

Abstract
Although the center-surround receptive field is a fundamental property of retinal ganglion cells, the circuitry that mediates surround inhibition remains controversial. We examined the contribution of horizontal cells and amacrine cells to the surround of parasol ganglion cells of macaque and baboon retina by measuring receptive field structure before and during the application of drugs that have been shown previously to affect surrounds in a range of mammalian and nonmammalian species. Carbenoxolone and cobalt, thought to attenuate feedback from horizontal cells to cones, severely reduced the surround. Tetrodotoxin, which blocks sodium spiking in amacrine cells, and picrotoxin, which blocks the inhibitory action of GABA, only slightly reduced the surround. These data are consistent with the hypothesis that the surrounds of light-adapted parasol ganglion cells are generated primarily by non-GABAergic horizontal cell feedback in the outer retina, with a small contribution from GABAergic amacrine cells of the inner retina.
Keywords: primate, retina, ganglion cell, amacrine cell, horizontal cell, receptive field, lateral inhibition, surround antagonism
Introduction
Most retinal ganglion cells are strongly excited by a small spot of light modulated near the center of the dendritic field but are inhibited by an annulus of light surrounding it. This center-surround receptive field organization, known for half a century (Kuffler, 1953), has been modeled as the difference of two overlapping Gaussian sensitivity profiles (Rodieck, 1965; Enroth-Cugell et al., 1983). Many ganglion cells also possess other complex response properties not well described by the classical center and surround (cf. Passaglia et al., 2001; Roska and Werblin, 2003). The excitatory center response is well understood to result from a vertical signaling pathway from cones to bipolar cells to ganglion cells. However, the circuitry that mediates the inhibitory surround remains unclear.
The traditional view is that the ganglion cell surround is produced by negative feedback from horizontal cells to cones that is either mediated (for review, see Wu, 1992; Piccolino, 1995) or modulated (for review, see Kamermans and Spekreijse, 1999) by the inhibitory neurotransmitter GABA. However, recent evidence suggests that the rich diversity of interneurons of the inner retina, the amacrine cells, also contribute to the ganglion cell surround (Cook and McReynolds, 1998; Taylor, 1999; Roska et al., 2000; Flores-Herr et al., 2001)
In primate retina, the inhibitory surround begins the task of spatial information processing by transforming the ganglion cell spatial tuning curve from that of the center response, which has smoothly declining sensitivity with increasing spatial frequency, into a bandpass shape in which sensitivity to low spatial frequencies has been attenuated (Enroth-Cugell and Robson, 1984). Surround circuitry is also critical for the creation of color opponent ganglion cell light responses, because opponency is based on cone type-specific segregation of excitatory and inhibitory signals in the receptive field (Lennie, 2000; Dacey and Packer, 2003). However, neither the detailed circuitry nor the relative contributions of horizontal and amacrine cells to the primate ganglion cell surround are completely understood. The presence of inhibitory surrounds in macaque cones (Verweij et al., 2003) suggests that horizontal cell feedback at the cone synapse must play a major role. Strong surrounds in macaque cone bipolar cells (Dacey et al., 2000a) together with the nature of the horizontal cell light response itself (Packer et al., 2002) further support this hypothesis. However, the contribution of amacrine cells to surrounds has not been measured in primate.
To address these questions, we explored the origin of the surround in a single, well characterized primate ganglion cell (Croner and Kaplan, 1995), the parasol cell. Parasol cells project to the magnocellular layers of the lateral geniculate nucleus, have well defined center-surround organization, and receive substantial amacrine cell input (Kolb and Dekorver, 1991; Jacoby et al., 1996). We measured receptive field structure in an in vitro preparation of the intact monkey retina (Dacey and Lee, 1994; Dacey et al., 2000b) and characterized the responses to drugs shown to affect the surround in other species.
Drugs that clearly affect inhibitory amacrine cell transmission, TTX and GABAergic modulators, had little effect on parasol surround strength. In contrast, carbenoxolone and cobalt chloride, drugs thought to interfere with horizontal cell feedback, severely attenuated the surround. These results suggest that the classical receptive field surround of monkey parasol ganglion cells is generated by non-GABAergic horizontal cell feedback in the outer retina, with only a small contribution from GABAergic amacrine cells of inner retina.
Materials and Methods
Tissue preparation. Parasol ganglion cells were recorded in an in vitro preparation of intact primate (Macaca nemestrina, Macaca fascicularis, Papio c. anubis) retina using methods described in detail previously (Dacey et al., 2000b). Retinas were obtained through the University of Washington Tissue Distribution Program of the Washington National Primate Research Center. Eyes were enucleated under deep barbiturate anesthesia. The retina, choroid, and pigment epithelium were dissected as a unit from the sclera. The retina was flattened by making radial cuts and fixed to the bottom of a recording chamber with the ganglion cell side up using poly-l-lysine (Sigma-Aldrich, St. Louis, MO). The recording chamber was mounted on the stage of a light microscope and super-fused with oxygenated Ames' medium (Sigma-Aldrich) maintained at 36°C. For combined intracellular recording and staining, glass micro-electrodes (resistances >250 MΩ) were filled with 2–3% Neurobiotin (Vector Laboratories, Burlingame, CA) and 1–2% pyranine (Molecular Probes, Eugene, OR) in 1 m KCl. Ganglion cell somas were stained with the vital dye acridine orange (Sigma-Aldrich) (Watanabe and Rodieck, 1989). The distinctively large somas of parasol ganglion cells were penetrated for recording while viewing pyranine fluorescence in the electrode and acridine fluorescence in the soma under episcopic illumination using the same filter combination. Their identity was confirmed in vitro by observing dendritic morphology after iontophoresis of pyranine (Dacey and Brace, 1992).
Stimuli and data acquisition. Spots, annuli, and sinusoidal gratings were created with a retinal stimulator based on a digital light projector (Packer et al., 2001). Stimulus parameters were sent to a VSG3 stimulus generator (Cambridge Research Systems, Kent, UK) that created the video signal used to drive a digital light projector (VistaGRAPHX 2500; Christie Digital, Cypress, CA). The output of the digital light projector was relayed by an optical system to the camera port of the microscope and imaged on the retina by a 4× microscope objective. The image of the 1024 × 768 pixel display covered 2.96 × 2.22 mm of the retina. The light output was calibrated by placing the fiber optic probe of a CCD-based spectroradiometer (SM240; Spectral Products, Putnam, CT) at the location of the retina during stimulation. Calibration was confirmed with a PhotoResearch (Chatsworth, CA) PR-650 spectroradiometer.
Stimuli were white (CIE 1931 chromaticity; x = 0.304, y = 0.349) and were modulated at 2 Hz, a temporal frequency at which center-surround antagonism is strong (Troy et al., 1999). Stimuli were modulated above and below a midphotopic light level to maintain a stable state of adaptation. The contrast, the amplitude divided by the mean light level, was 25%. The mean retinal illuminance of 1.13 lux, equivalent to ∼1000 trolands assuming standard values for pre-retinal absorption (Wyszecki and Stiles, 1982) and a 6 mm pupil, produced an absorbed photon flux for M-cones of 3.4 × 10⁵ photons per photoreceptor per second. Previous experiments have shown that the responses of macaque parasol ganglion cells to 2 Hz modulated stimuli are cone dominated at and above 200 trolands (Lee et al., 1997).
The intracellular voltage was amplified (Axoprobe-2B; Axon Instruments, Foster City, CA) and digitized at a sampling rate of up to 10 kHz (NBIO16 installed in a Macintosh computer; National Instruments, Austin, TX). Responses were averaged over multiple temporal cycles of stimulus presentation, and the digital Fourier transform was computed. We used the amplitude and phase of the Fourier component at the temporal frequency of stimulus modulation (2 Hz) as the response measurement. This measurement represents the linear component of the response of the cell.
Drugs were mixed with oxygenated Ames' medium and applied to the bath superfusion. All drugs were purchased from Sigma-Aldrich, except for imidazole-4-acetic acid hydrochloride (I4AA) (Tocris Cookson, Ellisville, MO).
Measurement of receptive field parameters. After attaining a stable intracellular recording, stimuli were centered over the receptive field by moving a small flickering spot of light around the retina to the location of maximum response.
A rapid qualitative description of the effects of different drugs on the receptive field center and surround was obtained by measuring responses to flickering spots, annuli, and full fields. The sizes of the spots (0.3 mm diameter) and annuli (0.4 mm inner diameter, 2 mm outer diameter) were approximately matched to the center and surround sizes of parasol cells at the location of our recordings (mean ± SD distance from the fovea, 11.4 ± 2.0 mm; ∼53°; n = 52). Stimuli were square-wave modulated at 2 Hz. The unaveraged voltage recordings provided information about the temporal dynamics of the responses before and during drug application. The strengths of the spot and annulus responses were quantified by averaging multiple cycles of the voltage response of a cell (typically 24) and computing the amplitude of the 2 Hz component of the Fourier transform. We used these values to calculate the proportion of the spot and annulus responses that remained during the application of each drug.
Detailed information about the center-surround receptive field of each cell was obtained by measuring three types of spatial tuning functions: responses to flashing spots as a function of spot diameter (the area-summation function), responses to flashing annuli as a function of annulus inner diameter (the annulus-summation function), and responses to drifting sinusoidal gratings as a function of spatial frequency (the modulation transfer function) (Fig. 1). Spatial tuning functions were measured with sinusoidally modulated stimuli. We presented four temporal cycles of each stimulus, averaged the voltage responses, and calculated the amplitude of the 2 Hz component of the Fourier transform. The shapes of the tuning functions reveal the interaction between the center and surround mechanisms.
Figure 1.

Simultaneous fit of the difference-of-Gaussians receptive field model to the spatial tuning functions of an ON-center parasol cell. Responses to flashing spots as a function of spot diameter (the area-summation function) are shown in the first column, responses to flashing annuli as a function of inner diameter (the annulus-summation function) are shown in the second column, and responses to drifting sinusoidal gratings as a function of spatial frequency (the modulation transfer function) are shown in the third column. Response amplitudes are shown in the top plots and phases in the bottom plots. All six data sets were simultaneously fit with the difference-of-Gaussians receptive field model (solid lines). The best-fitting spatial receptive field is shown in the bottom right and had the following model parameters: center amplitude, 8.26 spikes/sec; radius, 62 μm; phase, 69°; surround amplitude, 7.64 spikes/sec; radius, 348 μm; phase, –123°; spatial offset, 10.2 μm.
Quantitative estimates of the center-surround receptive field parameters of each cell were obtained by simultaneously fitting the amplitudes and phases of all three spatial tuning functions with a difference-of-Gaussians receptive field model (Fig. 1) (Enroth-Cugell et al., 1983; Dacey et al., 2000a). This model linearly combines the spatial profile of a tall, narrow Gaussian representing the receptive field center and a short, broad Gaussian of opposite sign representing the surround. The model has seven free parameters: the amplitude, radius, and phase of the center and surround Gaussians and their spatial offset. The spatial offset parameter allows the center and surround to be centered at slightly different locations. After setting the initial fitting parameters to physiologically plausible values, numerical search (Grace, 1990) was used to minimize the mean square difference between predicted and measured responses. A two-dimensional representation of the spatial receptive field that best fit the data in Figure 1 is shown in the bottom right. Although the amplitude of the surround Gaussian may appear inconsequential, its broad spatial extent imparts it with an integrated volume that is 0.93 of the center. We defined the strengths of the center and surround mechanisms as the integrated volumes of their best-fitting Gaussians. The solid lines in the top plots of Figure 1 are the model fits to the spatial tuning functions. After the fit was completed, the best-fitting receptive field was always normalized so that the center Gaussian had an integrated volume of 1. This factored out natural and drug-induced changes in overall responsiveness without changing the shapes of the spatial tuning curves, allowing us to make comparisons of the surround strengths.
We repeated this procedure, simultaneously fitting all three spatial tuning functions, before, during, and after the application of drugs. We graphically illustrated the effect of each drug on the center-surround receptive field by plotting the area-summation function of the best-fitting spatial receptive field for the predrug and drug-affected conditions. Quantitative estimates of the effect of each drug on the strength of the surround were computed by taking the ratio of the drug-affected surround Gaussian volume to the predrug surround Gaussian volume. Changes in surround strength mainly represent decreases of the surround amplitude, because none of the drugs significantly changed the width of the surround.
Our method of modeling the surround strength allows us to overcome the difficulties imposed by the low amplitude of the surround and broad spatial extent. First, the model specifies a receptive field that is the simultaneous best fit to all three spatial tuning functions. A surround-dominated response can be gleaned from the annulus-summation function (Troy et al., 1999), and combining these data with the area-summation and modulation transfer functions provides increased sensitivity and a better signal-to-noise ratio. Second, the model fits both the amplitude and the phase of the responses. Third, the model provides a detailed quantitative description of the sensitivity profiles of the center and surround mechanisms.
Results
We obtained qualitative and quantitative estimates of the center-surround organization of each ganglion cell before, during, and, when possible, after the application of each drug. Results are shown first for cobalt and carbenoxolone and then for drugs that affect GABAergic neurotransmission.
Cobalt
Figure 2 shows the effect of cobalt on the responses of an ON-center parasol ganglion cell. The voltage responses to a flashing spot, annulus, and full-field stimulus before application of cobalt are shown in the top row. When stimulated by a small spot that excited the receptive field center, the cell depolarized at light onset and hyperpolarized at light offset (Fig. 2, top left). The response to an annulus that excited the surround was similar but of opposite polarity (Fig. 2, top middle). The response to a full field is the sum of the responses to the spot and annulus. Because they were of approximately equal strength but opposite sign, the sustained components canceled, leaving only ON and OFF transients (Fig. 2, top right). The middle row of Figure 2 shows responses to the same stimuli during the application of cobalt chloride (75 μm). The amplitude of the spot response was slightly reduced, but the waveform was not changed (Fig. 2, middle left). However, the stimulus-driven component of the response to the flashing annulus was strongly reduced (Fig. 2, middle), indicating a severe attenuation of the inhibitory surround. This selective attenuation of the receptive field surround caused the full-field response to have a similar amplitude and phase as the spot response (Fig. 2, middle right). Approximately 5 min after cobalt application ended, the surround response returned (Fig. 2, bottom middle). After cobalt washed out, the responses of the cell resembled the responses before the application of cobalt, except for a slight reduction of the overall spike rate (Fig. 2, bottom row).
Figure 2.

Responses of an ON-center parasol ganglion cell before, during, and after the application of cobalt (75 μm). Responses to a flashing spot (0.3 mm diameter), annulus (0.4 mm inner diameter, 2 mm outer diameter), and full field are shown before (top row), during (middle row), and after (bottom row) the application of cobalt. All stimuli were 25% luminance contrast and were modulated at 2 Hz around a mean background of ∼1000 photopic trolands. The vertical calibration bar at the top left represents 10 mV. The stimulus configuration and waveform are shown below the traces.
In Figure 3A, the proportion of the annulus response that remained during cobalt application is plotted against the proportion of the spot response that remained during cobalt application for 22 cells. Cells whose spot and annulus responses were equally affected by cobalt would fall along the diagonal of slope 1. Cells whose annulus response was more strongly reduced than their spot response would fall below the diagonal. All cells fell under the line of slope 1, indicating that cobalt reduced the annulus response more than the spot response.
Figure 3.

Cobalt attenuated the surrounds of parasol ganglion cells. A, The effect of cobalt on the amplitude of the response to a flashing spot and annulus. For each cell, the proportion of the annulus response that remained during cobalt is plotted against the proportion of the spot response that remained during cobalt application. Cells whose spot and annulus responses were equally affected by cobalt would lie along the diagonal of slope 1. Locations below the diagonal indicate a greater reduction of the annulus response than the spot response. The inset shows the effect of three concentrations on a single ganglion cell. B, Area-summation functions measured for four cells before (dotted lines) and during (solid lines) the application of cobalt. The spot size varies from 0 to 2 mm, and the vertical calibration bars represent 2 mV. C, Fits of the difference-of-Gaussians receptive field model to the spatial tuning functions were used to plot average area-summation functions before (dotted line) and during (solid line) the application of cobalt (n = 22). Error bars indicate SEM.
The overall level of response reduction was sensitive to concentration. A dose–response function for one cell is shown in the inset of Figure 3A. When the concentration of cobalt was low, the spot and annulus responses changed very little (Fig. 3A, inset, 75 μm). At higher concentrations, cobalt abolished the entire light response (Fig. 3A, inset, 300 μm), presumably by interfering with calcium-dependent photoreceptor synaptic transmission (Thoreson and Burkhardt, 1990). For this cell, 150 μm provided a good balance between these two extremes (Fig. 3A, inset, 150 μm), reducing the annulus response by 89% and the spot response by 51%. The optimal cobalt concentration varied from cell to cell, as noted previously by Vigh and Witkovsky (1999). Although recording time constraints prevented us from measuring the dose–response function of each cell, the tendency of higher concentrations to reduce the overall light response can be seen in Figure 3A.
In addition to the estimates obtained with the fixed-size spot and annulus, we obtained detailed information about the effects of cobalt on the center-surround receptive field by measuring spatial tuning functions before and during the application of cobalt. The shapes of all three spatial tuning functions provide information about the effect of cobalt on the center-surround balance (Fig. 1), but we chose to illustrate it using the area-summation function. Figure 3B shows area-summation functions before (dotted lines) and during (solid lines) the application of cobalt for four cells. Before the application of cobalt, the cells displayed typical area-summation functions (Fig. 3B, dotted lines). The center response increases as the stimulus spot increases in size. Once the spot covers the entire center mechanism, making it bigger does not change the response of the center. However, as the spot diameter increases beyond 300 μm, the inhibitory contribution of the diffuse surround mechanism grows and cancels the excitatory response of the center mechanism. The signature of the surround mechanism is the degree to which the response of the ganglion cell decreases from its peak as spot size gets large. During cobalt application, there was very little reduction of the response when the spot size became larger than the center mechanism (Fig. 3B, solid lines), indicating that cobalt severely reduced the inhibitory action of the surround.
We summarized the effect of cobalt on the center-surround receptive field by simultaneously fitting the area-summation function, annulus-summation function, and modulation transfer function with a difference-of-Gaussians receptive field model. Natural and drug-induced changes in overall responsiveness were factored out by normalizing the surround strength by the center strength for each condition, allowing us to compare the effect of drug application on the center-surround balance despite differences in response amplitudes. To visualize the results, we used the best-fitting receptive fields to plot average area-summation functions before and during cobalt application (Fig. 3C). ON-center and OFF-center cells produced similar results, so their averages were pooled. Before the application of cobalt, the cells displayed a typical area-summation function (Fig. 3C, dotted line). During cobalt application, there was very little reduction of the response when the spot size became larger than the center mechanism (Fig. 3C, solid line), indicating that cobalt severely reduced the inhibitory action of the surround. We calculated the effect of cobalt on the surround strength by averaging the ratio of the drug-affected surround strength to the predrug surround strength across cells. A value of 1 would denote no reduction of the surround relative to the center, and a value of 0 would denote a complete abolishment of the surround mechanism. The average ± SD surround strength under the influence of cobalt calculated from the fits of the model was 0.36 ± 0.06 (n = 22).
Carbenoxolone
Responses to fixed-size spots and annuli were measured before, during, and after the application of carbenoxolone (100 μm). The drug essentially eliminated the sustained response to the flashing annulus but produced a much smaller effect on the spot response (Fig. 4). The onset of the drug effect occurred more gradually than for other drugs. When carbenoxolone was applied for an extended time or used at concentrations higher than 100 μm, it often completely abolished the light response. In many of these cells, even after the sustained response to the spot and annulus was gone, transients remained at stimulus onset and offset. In a subset of cells, we were able to observe the original response return as the drug washed out over a period of 15–30 min. The highly lipophillic nature of carbenoxolone (Davidson and Baumgarten, 1988) is probably what caused the washout to occur so slowly. Figure 5A plots the proportion of the annulus response that remained during carbenoxolone application against the proportion of the spot response that remained during carbenoxolone application for 10 parasol ganglion cells. The annulus response was always more severely reduced than the spot response. The cells are clustered toward the origin, indicating that carbenoxolone decreased the overall light responsiveness of the cells.
Figure 4.
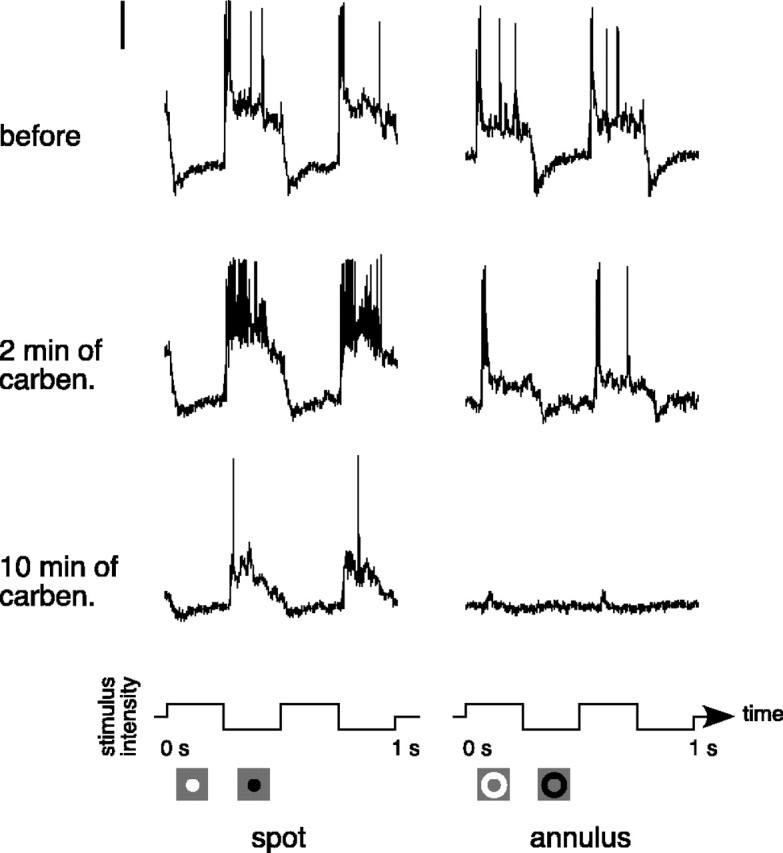
Responses of an OFF-center parasol ganglion cell before and during the application of carbenoxolone (100 μm; carben). Responses to a flashing spot (0.3 mm diameter) and annulus (0.4 mm inner diameter, 2 mm outer diameter) are shown before (top row) and during (bottom rows) the application of carbenoxolone. Stimuli were 25% luminance contrast and were modulated at 2 Hz around a mean background of ∼1000 photopic trolands. The vertical calibration bar at the top left represents 10 mV. The stimulus configuration and waveform are shown below the traces.
Figure 5.

Carbenoxolone (100 μm) attenuated the surrounds of parasol ganglion cells. A, The effect of carbenoxolone on the amplitude of the response to a flashing spot and annulus. For each cell, the proportion of the annulus response that remained during carbenoxolone is plotted against the proportion of the spot response that remained during carbenoxolone. B, Area-summation functions measured for four cells before (dotted lines) and during (solid lines) the application of carbenoxolone. The spot size varies from 0 to 2 mm, and the vertical calibration bars represent 2 mV. C, Average area-summation functions before (dotted line) and during (solid line) the application of carbenoxolone (n = 10). Error bars indicate SEM.
We obtained detailed information about the effects of carbenoxolone on the center-surround receptive field by measuring spatial tuning functions before and during its application. Figure 5B shows area-summation functions before (dotted lines) and during (solid lines) the application of carbenoxolone for four cells. Before application, the cells displayed typical area-summation functions (dotted lines). The shapes of the carbenoxolone-affected functions reveal very little reduction of the response when the spot size became larger than the center mechanism (Fig. 5B, solid lines), indicating that carbenoxolone severely reduced the inhibitory action of the surround. The tendency of carbenoxolone to attenuate the overall light response is illustrated by the lower peak amplitudes of the area-summation functions (Fig. 5B, solid lines).
The average area-summation functions calculated from the model fits are shown in Figure 5C. The predrug condition (Fig. 5C, dotted line) produced a typical area-summation function. Carbenoxolone removed much of the surround inhibition at large spot sizes (Fig. 5C, solid line). Quantitative estimates of the effect of carbenoxolone on the surround were obtained by fitting the difference-of-Gaussians receptive field model to the spatial tuning functions, as described above. The strength of the surround during carbenoxolone was 0.37 ± 0.11 of its predrug value (n = 10).
Picrotoxin
Figure 6 shows the voltage responses of an ON-center parasol ganglion cell to a flashing spot, annulus, and full-field stimulus before and during the application of picrotoxin (100 μm). Before picrotoxin was applied, the cell depolarized at the onset of a spot and hyperpolarized at the offset of a spot (Fig. 6, top left). The response to an annulus was similar but of opposite polarity (Fig. 6, top middle), and the response to a full field was composed of transients at onset and offset (Fig. 6, top right). The bottom row of Figure 6 shows the responses to the same stimuli during the application of picrotoxin. Although picrotoxin did not significantly reduce the amplitude of either the spot or annulus response, it did alter the temporal dynamics of the responses. It severely reduced the fast membrane potential hyperpolarization and slow depolarization at spot offset and annulus onset. It also decreased the temporal delay between stimulus onset and the fast depolarizing response by ∼15 msec. This speeding up of the response during picrotoxin is shown in Figure 6 by the offset in the vertical lines that are aligned with the responses at spot onset and annulus offset. The full-field response was relatively unchanged by picrotoxin (bottom right panel), although the transient hyperpolarization at offset was reduced.
Figure 6.

Responses of an ON-center parasol ganglion cell before and during the application of picrotoxin (100 μm). Responses to a flashing spot (0.3 mm diameter), annulus (0.4 mm inner diameter, 2 mm outer diameter), and full field are shown before (top row) and during (bottom row) the application of picrotoxin. Stimuli were 25% luminance contrast and were modulated at 2 Hz around a mean background of ∼1000 photopic trolands. The vertical calibration bar at the top left represents 10 mV. The stimulus configuration and waveform are shown below the traces.
We applied picrotoxin (100 μm) to 13 parasol ganglion cells. The proportion of the annulus response that remained during picrotoxin is plotted against the proportion of the spot response that remained during picrotoxin in Figure 7A. The spot and annulus responses were equally affected by picrotoxin, as is demonstrated by the tendency of the cells to fall around the line of slope 1. Although the effect of picrotoxin on response amplitude varied from cell to cell, with most cells being attenuated, it did not differentially affect the center and surround mechanisms.
Figure 7.

Picrotoxin (100 μm) had a small effect on the center-surround receptive fields of parasol ganglion cells. A, The effect of picrotoxin on the amplitude of the response to a flashing spot and annulus. For each cell, the proportion of the annulus response that remained during picrotoxin is plotted against the proportion of the spot response that remained during picrotoxin. B, Area-summation functions measured for four cells before (dotted lines) and during (solid lines) the application of picrotoxin. The spot size varies from 0 to 2 mm, and the vertical calibration bars represent 2 mV. C, Average area-summation functions before (dotted line) and during (solid line) the application of picrotoxin (n = 13). Error bars indicate SEM.
We measured spatial tuning functions before and during the application of picrotoxin. Figure 7B shows area-summation functions before (dotted lines) and during (solid lines) the application of picrotoxin for four cells. Picrotoxin did not change the general shape of the functions, indicating that the center-surround balance was similar before and during the application of picrotoxin.
The strength of the surround during picrotoxin was 0.96 ± 0.03 (n = 13) of its predrug value. The 4% surround reduction caused a slightly higher response amplitude for spot sizes larger than the receptive field center (Fig. 7C).
TTX
TTX (0.5 μm) eliminated spiking in 12 parasol ganglion cells but did not produce noticeable changes in the underlying membrane potential (Fig. 8, middle row). Spiking returned to normal ∼15 min after TTX application ended (Fig. 8, bottom row). Figure 9A plots the proportion of the annulus response that remained during TTX against the proportion of the spot response that remained during TTX. The annulus responses were reduced slightly more than the spot responses.
Figure 8.

Responses of an OFF-center parasol ganglion cell before, during, and after the application of TTX (0.5 μm).Responses to a flashing spot (0.3 mm diameter), annulus (0.4 mm inner diameter, 2 mm outer diameter), and full field are shown before (top row), during (middle row), and after (bottom row) the application of TTX. Stimuli were 25% luminance contrast and were modulated at 2 Hz around a mean background of ∼1000 photopic trolands. The vertical calibration bar at the top left represents 10 mV. The stimulus configuration and waveform are shown below the traces.
Figure 9.

TTX (0.5 μm) had a small effect on the center-surround receptive fields of parasol ganglion cells. A, The effect of TTX on the amplitude of the response to a flashing spot and annulus. For each cell, the proportion of the annulus response that remained during TTX is plotted against the proportion of the spot response that remained during TTX. B, Area-summation functions measured for four cells before (dotted lines) and during (solid lines) the application of TTX. The spot size varies from 0 to 2 mm, and the vertical calibration bars represent 2 mV. C, Average area-summation functions before (dotted line) and during (solid line) the application of TTX (n = 12). Error bars indicate SEM.
Figure 9B shows area-summation functions before (dotted lines) and during (solid lines) the application of TTX for four cells. TTX did not change the general shape of the functions, indicating that the center-surround balance was similar before and during its application.
Despite the slight tendency of TTX to reduce the spot response more than the annulus response (Fig. 9A), the average area-summation functions produced by the receptive field model did not appreciably change during the application of TTX (Fig. 9C), and the strength of the surround during TTX was not significantly different from the predrug condition (0.97 ± 0.07; n = 12).
GABA
We have already seen that the GABAA/C antagonist picrotoxin had only a small effect on the receptive field surround (Figs. 6, 7). GABA is the inhibitory neurotransmitter of many amacrine cells, but there is also evidence that GABA plays a role in the horizontal cell to cone feedback circuit, by either increasing the conductance of Cl– channels in cones (Wu, 1992) or modulating an electrical feedback signal (Kamermans and Spekreijse, 1999). To test more generally for the role of GABA in establishing the receptive field surround, we applied GABA (500 μm) at a concentration high enough to saturate GABA receptors (Lukasiewicz and Shields, 1998) plus the reuptake inhibitor SKF89976A (25 μm) to five parasol ganglion cells. We measured the responses of the cells to fixed-size flashing spots, annuli, and full fields over time after application. Typical responses from an ON-center parasol cell to a flashing spot and annulus are shown in Figure 10. Before GABA was applied, the cell depolarized at the onset of a spot and hyperpolarized at the offset of a spot (Fig. 10, top left). The response to an annulus was similar but of opposite polarity (Fig. 10, bottom left). GABA steadily hyperpolarized the resting membrane potential of all five cells (0.9 mV per minute) and decreased the amplitude of the light response. The responses to the spot and the annulus decreased together over time, suggesting that the surround mechanism is not more sensitive to disruptions in GABAergic neurotransmission than the center mechanism. Prolonged application of GABA severely reduced the sustained components of the responses, but an excitatory transient was still observable at spot onset and annulus offset (Fig. 10, fourth column). The fact that the transients produced by both the spot and the annulus persisted when direct GABAergic inhibition was saturated is consistent with the hypothesis that the center-surround receptive field structure is generated presynaptic to the ganglion cell by non-GABAergic mechanisms. The drug effect washed out completely and rapidly for all cells (Fig. 10, last column).
Figure 10.

Responses of an ON-center parasol ganglion cell to a flashing spot and annulus during the application of GABA (500 μm) and SKF89976A (25 μm). The first row shows the response to a flashing spot, and the second row shows the response to a flashing annulus at different times after the application of a saturating dose of GABA. The black dot at the start of each response represents the resting membrane potential of the cell measured before stimulus onset. The spot and annulus were 25% luminance contrast and were modulated at 2 Hz around a mean background of ∼1000 photopic trolands. The temporal waveforms of the stimuli are shown below the traces. The units at the right are in millivolts.
In addition to the fixed-size stimuli, spatial tuning functions were measured and fit with the difference-of-Gaussians receptive field model before GABA and midway between the application of GABA and complete abolishment of the light response. The average surround strength during GABA application was not significantly different from the predrug condition (1.02 ± 0.02; n = 5).
Application of drug mixtures
Blocking GABAergic inhibition with picrotoxin can cause an increase in glycinergic inhibition in dark-adapted tiger salamander retina (Cook et al., 2000). We tested to see whether the ineffectiveness of picrotoxin and TTX in blocking the primate parasol cell surround was attributable to an increase in glycinergic inhibition by applying a mixture that contained both picrotoxin and the glycine antagonist strychnine (100 μm picrotoxin plus 0.5 μm TTX plus 5 μm strychnine, n = 1 ON-center cell, n = 1 OFF-center cell; 100 μm picrotoxin plus 0.5 μm TTX plus 2 μm strychnine plus 10 μm I4AA, n = 2 ON-center cells). As an extra precaution, we added I4AA to two of the mixtures to block picrotoxin-insensitive GABAC receptors (Gao et al., 2000). Spatial tuning functions were measured before and during the application of each drug mixture. Fits of the difference-of-Gaussians receptive field model to these data sets showed that the average surround strength during administration of the mixture was not significantly different from the predrug condition (1.06 ± 0.13; n = 4).
Summary of the drug effects
The difference-of-Gaussians receptive field model shows that cobalt and carbenoxolone reduced the surround strength by ∼63%. The drugs that affect GABAergic neurotransmission (picrotoxin, TTX, and GABA) produced no significant attenuation of the surround mechanism. Table 1 summarizes the drug-affected to predrug surround strength ratio for each drug.
Table 1.
Summary of the surround strength reductions produced by each drug
|
|
Drug-affected surround strength |
SEM |
Number of cells (ON, OFF) |
|---|---|---|---|
| Cobalt | 0.36 | 0.06 | 19,3 |
| Carbenoxolone | 0.37 | 0.11 | 6,4 |
| Picrotoxin | 0.96 | 0.03 | 9,4 |
| TTX | 0.97 | 0.07 | 9,3 |
| GABA |
1.02 |
0.02 |
5,0 |
Discussion
Blocking GABAergic neurotransmission and amacrine cell spiking with picrotoxin and TTX only slightly attenuated the classical receptive field surround of parasol ganglion cells, suggesting that amacrine cells are only a minor source of surround inhibition in the primate parasol pathway. These results are consistent with other studies that measured the receptive field of mammalian ganglion cells at photopic light levels. Frishman and Linsenmeier (1982) showed that picrotoxin had little effect on the surrounds of cat X and Y ganglion cells, and Bolz et al. (1985) found that the application of neither GABA nor the GABAA receptor antagonist bicuculine affected the center-surround balance of cat ganglion cells. In a series of experiments, Daw and Ariel (1981) showed that picrotoxin did not eliminate the surround of any of the rabbit center-surround ganglion cell types. Bloomfield (1996) reported that TTX did not alter the spatial structure of rabbit ganglion cell receptive fields, including their surrounds, and concluded that spiking amacrine cells do not play a role in shaping the classical receptive field.
Nevertheless, other recent studies argue that GABAergic mechanisms do make a major contribution to the classical receptive field surround of some mammalian ganglion cells. In rabbit ganglion cells, Flores-Herr et al. (2001) measured substantial surround inhibition in the excitatory signal arriving from bipolar cells that was attenuated by picrotoxin and TTX. They also isolated direct inhibitory input from amacrine cells and found that it was blocked by picrotoxin and TTX in most ganglion cells. Likewise, Taylor (1999) showed that TTX produced a large attenuation of rabbit ON-center brisk-transient ganglion cell surrounds.
Several factors could reconcile the conflicting conclusions about the role of amacrine cells in forming the classical surround. One possibility is that differences in light level affect the degree of amacrine cell contribution to the surround. We measured receptive field structure at photopic light levels that saturate the rod system, whereas both Flores-Herr et al. (2001) and Taylor (1999) made their measurements at mesopic light levels at which the rod system continues to respond. A number of previous studies show that GABA antagonists attenuate the ganglion cell surround in cat (Kirby and Schweitzer-Tong, 1981) and rabbit (Daw and Ariel, 1981) only under scotopic conditions. At low light levels, rod signals are relayed to ganglion cells by AII amacrine cells (Bloomfield and Dacheux, 2001), whose surrounds are blocked by picrotoxin in rabbit (Volgyi et al., 2002).
A second factor that may affect the role of amacrine cells in surround formation is the diversity of ganglion cell types. Even under those conditions in which GABAergic surround inhibition has been found, its contribution has varied by ganglion cell type. Taylor (1999) found that the surrounds of a number of ON-center ganglion cell types were attenuated by TTX, although it produced little effect on OFF-center cells. Kirby and Enroth-Cugell (1976) reported that, under scotopic conditions, picrotoxin substantially reduced the surrounds of cat Y cells but had no effect on X cells. Our data were collected only from ON- and OFF-center parasol ganglion cells.
Finally, the GABAergic contribution to classical inhibitory surrounds may be greater in nonmammalian than mammalian ganglion cells. In tiger salamander, the surrounds of ON-center ganglion cells with small receptive fields were attenuated by the application of TTX or picrotoxin (Cook and McReynolds, 1998), and Shields and Lukasiewicz (2003) identified TTX-sensitive surround inhibition of both bipolar cell axon terminals and ganglion cells. Other tiger salamander slice recordings have also demonstrated a contribution of amacrine cells to the receptive field surround, by both feedback to GABAC receptors on bipolar terminals and feed-forward inhibition to GABAA receptors on ganglion cell dendrites (Roska et al., 2000). Relatively low light levels (Cook and McReynolds, 1998; Shields and Lukasiewicz, 2003) may have increased the strength of the GABAergic contribution to the surround in some of these experiments as well.
The second major finding of this paper is that cobalt and carbenoxolone strongly attenuate the receptive field surround of primate parasol ganglion cells, consistent with previous measurements in both nonmammalian and mammalian retina. In outer retina, the antagonistic surround of the cone is blocked by cobalt in monkey (Verweij et al., 2003) and turtle (Thoreson and Burkhardt, 1990) and by carbenoxolone in monkey (Verweij et al., 2003) and teleost fish (Kamermans et al., 2001). The responses of horizontal cells to large flashing spots are also affected by both drugs. At light onset, horizontal cells rapidly hyperpolarize and then slowly depolarize back to their resting potential in the light, a response component usually attributed to horizontal cell feedback to cones (Kamermans et al., 2001). In teleost retina, both cobalt and carbenoxolone abolish this slow depolarization (Kamermans et al., 2001). The H1 horizontal cells of monkey retina respond in a nearly identical manner, exhibiting a well developed slow depolarization that is abolished by the application of either drug (Packer et al., 2002). Cobalt also blocks the surrounds of ON- and OFF-center bipolar cells in turtle retina (Vigh and Witkovsky, 1999). In inner retina, cobalt blocks the surrounds of ganglion cells and prevents current injected into horizontal cells from driving ganglion cells (Vigh and Witkovsky, 1999).
The surround attenuation produced by cobalt and carbenoxolone in the cells of both inner and outer retina is consistent with non-GABAergic feedback from horizontal cells onto cones. In one model of non-GABAergic feedback, which was developed in goldfish retina (Kamermans et al., 2001), light hyperpolarizes horizontal cells and current flows through hemichannels on horizontal cell dendrites, producing an extracellular voltage drop in the cone synaptic cleft and depolarizing the cone pedicle. This activates a calcium conductance in the cone that opens calcium-activated chloride channels and inhibits the cone. Carbenoxolone is thought to block the hemichannels and prevent horizontal cells from depolarizing the cone. Low concentrations of cobalt may block the calcium-activated opening of chloride channels. Our data are not consistent with surround inhibition resulting from GABA-mediated feedback from horizontal cells to cones, a mechanism that has been well characterized in many nonmammalian species (Wu, 1992) but remains controversial (Kamermans et al., 2001). It is possible that this mechanism does not exist in primate retina because, although primate horizontal cells can synthesize GABA (Vardi et al., 1994), horizontal cells only exhibit GABA immunoreactivity in the central retina (Grunert and Wassle, 1990; Kalloniatis et al., 1996) and GABA receptors have not been found on primate cones (Hughes et al., 1989; Enz et al., 1996; Vardi et al., 1998). Also, monkey cones do not exhibit an increase in chloride conductance in response to pressure injection of GABA, and high concentrations of GABA do not block the surrounds of primate cones (Verweij et al., 2003).
There is also little evidence supporting direct horizontal cell inhibition of bipolar cell dendrites in mammals. One hypothesis is that GABA release from horizontal cells affects ON- and OFF-center bipolar cells in opposite ways and therefore creates an inhibitory surround in both (Vardi et al., 2000). However, it has been shown that GABAergic horizontal cell input is unlikely to antagonize the center of ON bipolar cells in rat (Billups and Attwell, 2002).
Together, the minimal effect of drugs thought to modulate amacrine cell signaling and the robust effects of drugs thought to modulate horizontal cell to cone feedback are consistent with the view that the classical surround of primate parasol ganglion cells is primarily mediated by the horizontal cell network via feedback onto cones. The fact that the feedback is sensitive to cobalt and carbenoxolone, and insensitive to GABA antagonists, is consistent with a calcium-dependant and/or gap junctional mechanism (Kamermans et al., 2001) rather than a GABAergic one. Although amacrine cells do not underlie the classical cone-mediated surround of parasol ganglion cells, they may play a role in the rod-mediated receptive field surround. They may also play an important role in other parasol ganglion cell responses analogous to those in other species, such as responses to complex trigger features (Daw and Ariel, 1981), nonlinear sensitivity changes generated by remote stimuli (Frishman and Linsenmeier, 1982), transient elevations of threshold produced by rapid shifts of large-field stimuli (Roska and Werblin, 2003), and the sensitivity of nonlinear subunits (Frishman and Linsenmeier, 1982; Demb et al., 1999).
Footnotes
This work was supported by National Institutes of Health Grants GM08107 (National Research Service Award), EY06678, EY09625, EY01730 (Vision Research Core), and RR00166 (Tissue Distribution Program at Washington National Primate Research Center). We thank David Brainard for programming the difference-of-Gaussians fitting routine and Toni Haun and Beth Peterson for technical assistance.
Correspondence should be addressed to Matthew J. McMahon, Department of Biological Structure, Box 357420, University of Washington, Seattle, WA 98195. E-mail: mm@mattmcmahon.com.
DOI:10.1523/JNEUROSCI.5252-03.2004
Copyright © 2004 Society for Neuroscience 0270-6474/04/243736-10$15.00/0
References
- Billups D, Attwell D (2002) Control of intracellular chloride concentration and GABA response polarity in rat retinal ON bipolar cells. J Physiol (Lond) 545: 183–198. [DOI] [PMC free article] [PubMed] [Google Scholar]
- Bloomfield SA (1996) Effect of spike blockade on the receptive-field size of amacrine and ganglion cells in the rabbit retina. J Neurophysiol 75: 1878–1893. [DOI] [PubMed] [Google Scholar]
- Bloomfield SA, Dacheux RF (2001) Rod vision: pathways and processing in the mammalian retina. Prog Retin Eye Res 20: 351–384. [DOI] [PubMed] [Google Scholar]
- Bolz J, Frumkes T, Voigt T, Wässle H (1985) Action and localization of gamma-aminobutyric acid in the cat retina. J Physiol (London) 362: 369–394. [DOI] [PMC free article] [PubMed] [Google Scholar]
- Cook PB, McReynolds JS (1998) Lateral inhibition in the inner retina is important for spatial tuning of ganglion cells. Nat Neurosci 1: 714–719. [DOI] [PubMed] [Google Scholar]
- Cook PB, Lukasiewicz PD, McReynolds JS (2000) GABAC receptors control adaptive changes in a glycinergic inhibitory pathway in salamander retina. J Neurosci 20: 806–812. [DOI] [PMC free article] [PubMed] [Google Scholar]
- Croner LJ, Kaplan E (1995) Receptive fields of P and M ganglion cells across the primate retina. Vision Res 35: 7–24. [DOI] [PubMed] [Google Scholar]
- Dacey DM, Brace S (1992) A coupled network for parasol but not midget ganglion cells in the primate retina. Vis Neurosci 9: 279–290. [DOI] [PubMed] [Google Scholar]
- Dacey DM, Lee BB (1994) The “blue-on” opponent pathway in primate retina originates from a distinct bistratified ganglion cell type. Nature 367: 731–735. [DOI] [PubMed] [Google Scholar]
- Dacey DM, Packer OS (2003) Colour coding in the primate retina: diverse cell types and cone-specific circuitry. Curr Opin Neurobiol 13: 421–427. [DOI] [PubMed] [Google Scholar]
- Dacey D, Packer OS, Diller L, Brainard D, Peterson B, Lee B (2000a) Center surround receptive field structure of cone bipolar cells in primate retina. Vision Res 40: 1801–1811. [DOI] [PubMed] [Google Scholar]
- Dacey DM, Diller LC, Verweij J, Williams DR (2000b) Physiology of L- and M-cone inputs to H1 horizontal cells in the primate retina. J Opt Soc Am A Opt Image Sci Vis 17: 589–596. [DOI] [PubMed] [Google Scholar]
- Davidson JS, Baumgarten IM (1988) Glycyrrhetinic acid derivatives: a novel class of inhibitors of gap-junctional intercellular communication. Structure-activity relationships. J Pharmacol Exp Ther 246: 1104–1107. [PubMed] [Google Scholar]
- Daw NW, Ariel M (1981) Effect of synaptic transmitter drugs on receptive fields of rabbit retinal ganglion cells. Vision Res 21: 1643–1647. [DOI] [PubMed] [Google Scholar]
- Demb JB, Haarsma L, Freed MA, Sterling P (1999) Functional circuitry of the retinal ganglion cell's nonlinear receptive field. J Neurosci 19: 9756–9767. [DOI] [PMC free article] [PubMed] [Google Scholar]
- Enroth-Cugell C, Robson J (1984) Functional characteristics and diversity of cat retinal ganglion cells. Invest Ophthalmol Vis Sci 25: 250–267. [PubMed] [Google Scholar]
- Enroth-Cugell C, Robson JG, Schweitzer-Tong DE, Watson AB (1983) Spatio-temporal interactions in cat retinal ganglion cells showing linear spatial summation. J Physiol (Lond) 341: 279–307. [DOI] [PMC free article] [PubMed] [Google Scholar]
- Enz R, Brandstatter JH, Wassle H, Bormann J (1996) Immunocytochemical localization of the GABAC receptor ρ subunits in the mammalian retina. J Neurosci 16: 4479–4490. [DOI] [PMC free article] [PubMed] [Google Scholar]
- Flores-Herr N, Protti DA, Wassle H (2001) Synaptic currents generating the inhibitory surround of ganglion cells in the mammalian retina. J Neurosci 21: 4852–4863. [DOI] [PMC free article] [PubMed] [Google Scholar]
- Frishman LJ, Linsenmeier RA (1982) Effects of picrotoxin and strychnine on non-linear responses of Y-type cat retinal ganglion cells. J Physiol (Lond) 324: 347–363. [DOI] [PMC free article] [PubMed] [Google Scholar]
- Gao F, Maple BR, Wu SM (2000) I4AA-Sensitive chloride current contributes to the center light responses of bipolar cells in the tiger salamander retina. J Neurophysiol 83: 3473–3482. [DOI] [PubMed] [Google Scholar]
- Grace A (1990) Optimization toolbox for use with Matlab: user's guide. Natick, MA: The MathWorks.
- Grunert U, Wassle H (1990) GABA-like immunoreactivity in the macaque monkey retina: a light and electron microscopic study. J Comp Neurol 297: 509–524. [DOI] [PubMed] [Google Scholar]
- Hughes ET, Carey RG, Vitorica J, de Blas AL, Karten HJ (1989) Immunohistochemical localization of GABAA receptors in the retina of the new world primate Saimiri sciureus Vis Neurosci 2: 565–581. [DOI] [PubMed] [Google Scholar]
- Jacoby R, Stafford D, Kouyama N, Marshak D (1996) Synaptic inputs to ON parasol ganglion cells in the primate retina. J Neurosci 16: 8041–8056. [DOI] [PMC free article] [PubMed] [Google Scholar]
- Kalloniatis M, Marc RE, Murry RF (1996) Amino acid signatures in the primate retina. J Neurosci 16: 6807–6829. [DOI] [PMC free article] [PubMed] [Google Scholar]
- Kamermans M, Spekreijse H (1999) The feedback pathway from horizontal cells to cones. A mini review with a look ahead. Vision Res 39: 2449–2468. [DOI] [PubMed] [Google Scholar]
- Kamermans M, Fahrenfort I, Schultz K, Janssen-Bienhold U, Sjoerdsma T, Weiler R (2001) Hemichannel-mediated inhibition in the outer retina. Science 292: 1178–1180. [DOI] [PubMed] [Google Scholar]
- Kirby AW, Enroth-Cugell C (1976) The involvement of gamma-aminobutyric acid in the organization of cat retinal ganglion cell receptive fields. A study with picrotoxin and bicuculline. J Gen Physiol 68: 465–484. [DOI] [PMC free article] [PubMed] [Google Scholar]
- Kirby AW, Schweitzer-Tong DE (1981) Gaba-antagonists alter spatial summation in receptive field centres of rod- but not cone-drive cat retinal ganglion Y-cells. J Physiol (Lond) 320: 303–308. [DOI] [PMC free article] [PubMed] [Google Scholar]
- Kolb H, Dekorver L (1991) Midget ganglion cells of the parafovea of the human retina: a study by electron microscopy and serial section reconstructions. J Comp Neurol 303: 617–636. [DOI] [PubMed] [Google Scholar]
- Kuffler SW (1953) Discharge patterns and functional organization of mammalian retina. J Neurophysiol 16: 37–68. [DOI] [PubMed] [Google Scholar]
- Lee BB, Smith VC, Pokorny J, Kremers J (1997) Rod inputs to macaque ganglion cells. Vision Res 37: 2813–2828. [DOI] [PubMed] [Google Scholar]
- Lennie P (2000) Color vision: putting it together. Curr Biol 10: R589–R591. [DOI] [PubMed] [Google Scholar]
- Lukasiewicz PD, Shields CR (1998) A diversity of GABA receptors in the retina. Semin Cell Dev Biol 9: 293–299. [DOI] [PubMed] [Google Scholar]
- Packer O, Diller LC, Verweij J, Lee BB, Pokorny J, Williams DR, Dacey DM, Brainard DH (2001) Characterization and use of a digital light projector for vision research. Vision Res 41: 427–439. [DOI] [PubMed] [Google Scholar]
- Packer OS, McMahon MJ, Dacey DM (2002) Carbenoxolone blocks horizontal cell feedback and eliminates the ganglion cell surround in macaque monkey retina. Invest Ophthalmol Vis Sci [Suppl] 43: 2922. [Google Scholar]
- Passaglia CL, Enroth-Cugell C, Troy JB (2001) Effects of remote stimulation on the mean firing rate of cat retinal ganglion cells. J Neurosci 21: 5794–5803. [DOI] [PMC free article] [PubMed] [Google Scholar]
- Piccolino M (1995) Cross-talk between cones and horizontal cells through the feedback circuit. In: Neurobiology and clinical aspects of the outer retina, Ed 1 (Djamgoz MBA, Archer SN, Vallerga S, eds), pp 221–248. London: Chapman and Hall.
- Rodieck RW (1965) Quantitative analysis of cat retinal ganglion cell response to visual stimuli. Vision Res 5: 583–601. [DOI] [PubMed] [Google Scholar]
- Roska B, Werblin F (2003) Rapid global shifts in natural scenes block spiking in specific ganglion cell types. Nat Neurosci 6: 600–608. [DOI] [PubMed] [Google Scholar]
- Roska B, Nemeth E, Orzo L, Werblin FS (2000) Three levels of lateral inhibition: a space-time study of the retina of the tiger salamander. J Neurosci 20: 1941–1951. [DOI] [PMC free article] [PubMed] [Google Scholar]
- Shields CR, Lukasiewicz PD (2003) Spike-dependent GABA inputs to bipolar cell axon terminals contribute to lateral inhibition of retinal ganglion cells. J Neurophysiol 89: 2449–2458. [DOI] [PubMed] [Google Scholar]
- Taylor WR (1999) TTX attenuates surround inhibition in rabbit retinal ganglion cells. Vis Neurosci 16: 285–290. [DOI] [PubMed] [Google Scholar]
- Thoreson WB, Burkhardt DA (1990) Effects of synaptic blocking agents on the depolarizing responses of turtle cones evoked by surround illumination. Vis Neurosci 5: 571–583. [DOI] [PubMed] [Google Scholar]
- Troy JB, Bohnsack DL, Diller LC (1999) Spatial properties of the cat X-cell receptive field as a function of mean light level. Vis Neurosci 16: 1089–1104. [DOI] [PubMed] [Google Scholar]
- Vardi N, Kaufman DL, Sterling P (1994) Horizontal cells in cat and monkey retina express different isoforms of glutamic acid decarboxylase. Vis Neurosci 11: 135–142. [DOI] [PubMed] [Google Scholar]
- Vardi N, Morigiwa K, Wang TL, Shi YJ, Sterling P (1998) Neurochemistry of the mammalian cone “synaptic complex.” Vision Res 38: 1359–1369. [DOI] [PubMed] [Google Scholar]
- Vardi N, Zhang LL, Payne JA, Sterling P (2000) Evidence that different cation chloride cotransporters in retinal neurons allow opposite responses to GABA. J Neurosci 20: 7657–7663. [DOI] [PMC free article] [PubMed] [Google Scholar]
- Verweij J, Hornstein EP, Schnapf JL (2003) Surround antagonism in macaque cone Photoreceptors. J Neurosci 23: 10249–10257. [DOI] [PMC free article] [PubMed] [Google Scholar]
- Vigh J, Witkovsky P (1999) Sub-millimolar cobalt selectively inhibits the receptive field surround of retinal neurons. Vis Neurosci 16: 159–168. [DOI] [PubMed] [Google Scholar]
- Volgyi B, Xin D, Bloomfield SA (2002) Feedback inhibition in the inner plexiform layer underlies the surround-mediated responses of AII amacrine cells in the mammalian retina. J Physiol (Lond) 539: 603–614. [DOI] [PMC free article] [PubMed] [Google Scholar]
- Watanabe M, Rodieck RW (1989) Parasol and midget ganglion cells of the primate retina. J Comp Neurol 289: 434–454. [DOI] [PubMed] [Google Scholar]
- Wu SM (1992) Feedback connections and operation of the outer plexiform layer of the retina. Curr Opin Neurobiol 2: 462–468. [DOI] [PubMed] [Google Scholar]
- Wyszecki G, Stiles WS (1982) Color science: concepts and methods, quantitative data and formulae, Ed 2. New York: Wiley.