

Abstract
The ectostriatum is a large visual structure in the avian telencephalon. Part of the tectofugal pathway, the ectostriatum receives a large ascending thalamic input from the nucleus rotundus, the homolog of the mammalian pulvinar complex. We investigated the effects of bilateral lesions of the ectostriatum in pigeons on visual motion and spatial-pattern perception tasks. To test motion perception, we measured performance on a task requiring detection of coherently moving random dots embedded in dynamic noise. To test spatial-pattern perception, we measured performance on the detection of a square wave grating embedded in static noise. A double dissociation was revealed. Pigeons with lesions to the caudal ectostriatum showed a performance deficit on the motion task but not the grating task. In contrast, pigeons with lesions to the rostral ectostriatum showed a performance deficit on the grating task but not the motion task. Thus, in the avian telencephalon, there is a separation of visual motion and spatial-pattern perception as there is in the mammalian telencephalon. However, this separation of function is in the targets of the tectofugal pathway in pigeons rather than in the thalamofugal pathway as described in mammals. The implications of these findings with respect to the evolution of the visual system are discussed. Specifically, we suggest that the principle of parallel visual streams originated in the tectofugal pathway rather than the thalamofugal pathway.
Keywords: ectostriatum, visual motion, pattern vision, tectofugal, extrastriate pathway, pigeon
Introduction
A large body of evidence has outlined that there are parallel streams in the mammalian geniculo-striate system, each associated with specific visual functions (Livingstone and Hubel, 1988). On the basis of neuroanatomical, behavioral, and neuropsychological studies, a dichotomy has been proposed for extrastriate visual cortices: the “ventral” or “temporal” stream processes color and form and is related to perception and recognition of objects, whereas a “dorsal” or “parietal” stream processes motion and relative spatial relations and is important for visuomotor actions (Ungerleider and Mishkin, 1982; Milner and Goodale, 1995), although there are extensive interactions between the pathways (Merigan and Maunsell, 1993).
Pigeons have a remarkable array of visual abilities (Hodos, 1993; Wasserman, 1995; Bischof et al., 1999; Kelly et al., 2001). There are many similarities with respect to the neuroanatomical organization and physiology of the avian and mammalian sub-cortical visual systems but marked differences with respect to telencephalic structures (Karten and Shimizu, 1989; Engelage and Bischof, 1993; Shimizu and Bowers, 1999). For example, although the avian visual wulst is thought to be the homolog of mammalian visual cortex (Medina and Reiner, 2000), lesions to the visual wulst result in only minor impairments in visual tasks (Hodos et al., 1984). Furthermore, in birds, it appears that the tectofugal pathway is highly developed compared with the thalamofugal pathway, but the opposite is true in primates (Macphail, 1982; Karten and Shimizu, 1989; Butler and Hodos, 1996; Husband and Shimizu, 2001).
In the tectofugal system, the avian nucleus rotundus (nRT) receives a robust tectal input (Karten and Revzin, 1966) and is comparable with parts of the pulvinar nuclei and the lateral posterior nucleus of the thalamus in mammals (Nauta and Karten, 1970; Karten, 1979; Karten and Shimizu, 1989; Husband and Shimizu, 2001). On the basis of neurochemistry, cytoarchitecture, tectal innervation, and physiology, nRT has been divided into several subnuclei (Benowitz and Karten, 1976; Martinez-de-la-Torre et al., 1990; Mpodozis et al., 1996; Marin et al., 2003). Early electrophysiological studies showed that the majority of cells in nRT were motion sensitive (Revzin, 1979). More recently, Wang et al. (1993) recorded nRT activity to various types of visual stimuli. Four groups of neurons were found: color, luminance, simple motion, and looming (Sun and Frost, 1998). The color and luminance cells were found in the rostral areas of nRT, whereas the motion and looming cells were found in the caudal nRT (Wang et al., 1993).
The nRT projects to a telencephalic structure, the ectostriatum (Ec) (Karten and Hodos, 1970), which is possibly homologous to the thalamo-recipient cells in mammalian extrastriate cortices (Karten and Shimizu, 1989; Butler and Hodos, 1996; Shimizu and Bowers, 1999). The nRT-Ec projection is topographic: the caudal and rostral Ec receive input from subnuclei in the caudal and rostral nRT, respectively (Benowitz and Karten, 1976; Nixdorf and Bischof, 1982). The physiological organization of nRT (see above) (Wang et al., 1993) suggests that the caudal Ec should be important for visual motion processing, whereas the rostral Ec should be important for spatial-pattern vision and color. We tested this hypothesis by assessing motion and spatial-pattern vision in pigeons before and after lesions to the rostral or caudal Ec.
Materials and Methods
The methods reported herein were conducted in accordance with the guidelines established by the Canadian Council on Animal Care, and the protocol was approved by the University of Alberta Biological Sciences Animal Policy and Welfare Committee. Experiments were performed on 14 Silver King pigeons obtained from a local supplier. The pigeons had varied experimental backgrounds, including previous experience with the touch screens in the operant chambers. Most of the birds had previous experience with the motion or grating discrimination tasks. The birds were maintained at ∼85% of their free-feeding weight; they received mixed grains in the experimental setting and additional Kaytee pigeon pellets in their individual home cages after the behavioral experimental sessions. The pigeons also had access to water and grit ad libitum in their home cages and were housed in a 12 hr light/dark cycle, with lights on at 6:00 A.M.
Behavioral training and testing
The pigeons were trained and tested on alternate days on motion and spatial-pattern vision tasks. For both tasks, a two-alternative forced-choice paradigm was used. For all birds, the motion task required detection of coherently moving random dots embedded in dynamic noise (Bischof et al., 1999) (Fig. 1 B). For 12 of the birds, the spatial-pattern task involved the detection of a square wave grating embedded in static noise (Bischof et al., 1999) (Fig. 1 A). For the other two birds, the spatial-pattern task required the detection of Glass patterns embedded in static noise (Glass, 1969; Wilson and Wilkinson, 1998; Kelly et al., 2001). However, these two birds failed to perform adequately during the prelesion testing sessions; thus, only their data for performance on the motion task was considered.
Figure 1.
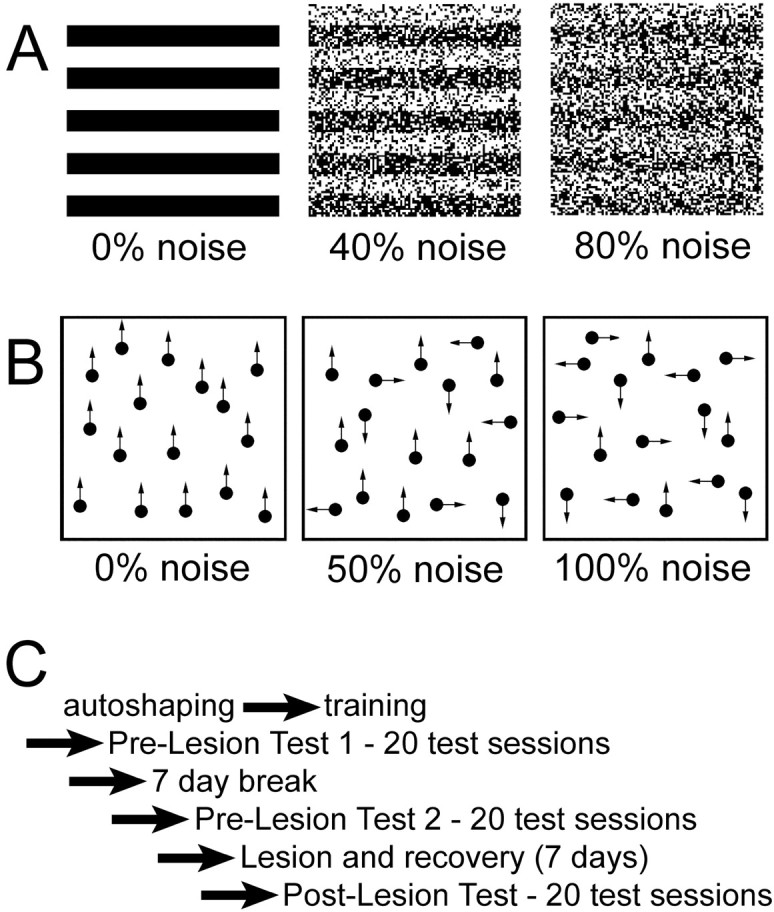
Stimuli and experimental timeline. A shows a faithful representation of the grating stimuli used for the spatial-pattern task. The gratings are shown noise free (left) or with 40% (middle) and 80% (right) noise. 40% noise means that 20% of the pixels in the white bars have been randomly replaced with black pixels, and 20% of the pixels in the black bars have been replaced with white pixels. B depicts the concept of the stimuli for the motion task. The stimuli actually contained 200 dots. On the left, all dots are moving coherently in the same direction (upward; 0% noise). In the middle, only half of the dots are moving in the same direction (50% noise). On the right, all dots are moving randomly in one of four directions (100% noise). For additional details about the stimuli, see Materials and Methods. C shows a schematic of the steps in the experiment for each bird. For additional details, see Materials and Methods.
Apparatus. The experimental chambers were modified pigeon operant chambers with touch screens inserted into one end of each chamber (for more details, see Bischof et al., 1999). Each touch screen was an infrared touch frame (Carroll Touch 1472) attached to a color monitor, with a thin sheet of Plexiglas inserted between the frame and the monitor. The stimuli were displayed on the computer screens, and pecks on the screen were detected via a break in the infrared beams of the touch frame. Correct choices were rewarded with mixed grain presented from one of the hoppers on either side of the touch screens. One randomly selected hopper was raised and illuminated for each reward, and photocells within the hoppers were used to limit the duration of access to food (1 or 2 sec depending on the pigeon's weight). Computers located in an adjacent room controlled the stimulus and hopper presentations and recorded the number, location, and timing of pecks to the screen.
Stimuli for motion task. The stimuli for the motion task were identical to those used in the previous study by Bischof et al. (1999) and were meant to closely mimic the stimuli used by Newsome and colleagues (Newsome and Paré, 1988; Newsome et al., 1989) for their investigations of the role of area MT in motion perception by primates. The stimuli consisted of two (S+ and S-) dynamic random dot patterns displayed on the left and right sides of the screen. They measured 98 × 98 pixels (4 × 4 cm), separated by a space measuring 60 pixels (2.4 cm) in width. Previous studies have indicated that pigeons generally stand very close to the Plexiglas surface that covered the monitors, despite being free to stand anywhere in the chamber (Hodos et al., 1976; Bischof et al., 1999). Thus, assuming a viewing distance of 9 cm, the stimuli each measured ∼50 × 50° and were separated by a gap measuring ∼30°. Each stimulus contained 200 randomly placed black dots (luminance ≅ 5 cd/m2), each measuring 1 × 1 pixels (i.e., 0.5 × 0.5°), on a white background (luminance ≅ 95 cd/m2). With each successive frame, each dot moved one pixel (i.e., 0.5°) in one of four directions: up, down, left, or right. The frame rate was set to 60 Hz, and the lifetime of each dot was set to five frames. That is, after five frames, each dot was relocated to a random position. The percentage of dots moving in the same direction, i.e., the coherence level, could be varied from 0% (random noise) to 100% (all dots moving in the same direction). As such, for each frame change, a certain coherence (or proportion of the dots) moved in the same direction, whereas the remaining dots moved randomly (Fig. 1 B). For training and testing, the S-consisted of randomly moving dots (i.e., 0% coherence or 100% noise). For training, the S+ consisted of all dots moving coherently in the same direction (i.e., 100% coherence or 0% noise). During the testing phase, the coherence level of the S+ ranged from 10 to 100%. The stimuli were not limited in duration but remained until the pigeon made a pecking response (typically 1-3 sec) to either the left or right display area of the screen.
Stimuli for grating task. The stimuli for the grating task also consisted of two stimulus patterns on the left and right sides of the screen separated by a gap, the dimensions of which were identical to the motion stimuli. The S-was a pattern of random dots, each measuring 1 × 1 pixels (0.5 × 0.5°). Each dot position had a 50% chance as being assigned as black or white (100% noise). The S+ consisted of five cycles of a square wave grating (i.e., 0.1 cycles per degree) oriented vertically or horizontally. During training, the grating stimuli presented were noise free (0% noise). During the testing phase, the S+ was embedded in noise ranging from 0 to 95%. (Fig. 1 A) (for a more in -depth description of these stimuli, see Bischof et al., 1999). The stimuli remained on the screen until a peck was made to either the left or right display area of the screen.
General training/testing procedure. All pigeons were trained/tested 6 d/week. They were trained/tested on both the motion and grating tasks on alternating days. For both tasks, a daily training session consisted of 128 trials, with the S+ set to 0% noise. Between trials, a blank screen appeared for 5 sec. For the motion task, the direction of the coherent dots was randomized, but there were an equal number of trials with the coherent dots moving up, down, left, or right. For the grating task, the orientation of the gratings (horizontal or vertical) was also randomly assigned, but there were an equal number of trials with each orientation. For both tasks, the side (left or right) on which the S+ appeared was randomly assigned, as was the hopper providing the reinforcement (left or right).
Experimental timeline
The experimental timeline (Fig. 1C) consisted of six different stages: autoshaping, training, first prelesion testing period, 7 d break, second prelesion testing period, surgery/recovery, and postlesion testing period.
Autoshaping. The pigeons were trained on a modified autoshaping procedure until they reliably pecked the screen (80% of 80 trials) in response to the displays of the motion or grating stimuli. Only the positive stimuli were displayed at this stage, randomly on either side of the touch screen. The stimuli were displayed at their maximal detection for both the motion and grating patterns (0% noise). Subjects were immediately rewarded with mixed grain from an illuminated hopper for pecking at the display. Food was also presented regardless of whether the bird pecked, after the display was on for 8 sec. This phase required 2-14 d to complete.
Training. After autoshaping, the pigeons were placed on a simultaneous discrimination-training program consisting of 128 trials per session. Trials began with a larger yellow square on the center of the screen as a start stimulus. A peck at the start stimulus elicited the presentation of the stimulus display. If a peck was made to the S+, the pigeon was rewarded with access to the mixed-grain hopper; if the peck was made to the noise display, the trial ended without reward. Training continued until a criterion of 80% correct on four successive training sessions for both motion and grating tasks (i.e., eight sessions total) was obtained. Training required 8-129 sessions to complete.
First prelesion testing session. The first testing period was conducted as soon as the bird reached criterion. Testing sessions were similar to training sessions except that the level of noise was varied in the S+ for both the motion and grating tasks. For the motion stimuli, the S+ consisted of 90, 80, 70, 60, 50, 40, 20, or 0% noise. For the grating stimuli, the S+ consisted of 95, 90, 80, 70, 60, 40, 20, or 0% noise. An equal number of trials at each noise level were presented in each session, but the order of trial presentation was randomized. Each testing session of both the motion/grating task consisted of 128 trials. Each bird completed a total of 10 testing sessions of each task.
Seven day break and second prelesion testing session. A 7 d break separated the first prelesion testing period from the second. On the first2dof the 7 d break, the birds had ad libitum food access, and then they were subsequently brought back down to 85% of their original free-feeding weight. The second set of testing sessions that followed the 7 d break was identical to the first set of prelesion testing sessions. This part of the procedure was introduced as a control. Outlined below, the surgery-recovery period required a 7 d break, and we wanted to ensure that any changes in performance after surgery were not attributable to the time-off period itself.
Surgery/recovery. Within 48 hr of completing the final testing session in the second prelesion testing period, all pigeons received bilateral lesions to Ec. They were anesthetized with isofluorane (1-4% induction and maintenance in 70% N20 and 30% O2). Intermittent toe pinch was used to assess the depth of anesthesia. Each pigeon was positioned in a large-animal stereotaxic apparatus with pigeon adapter, such that the orientation of its head was consistent with the atlas of the pigeon brain (Karten and Hodos, 1967). The skull was exposed, and interaural zero was marked. Bone and dura were removed to allow access to Ec with vertical penetrations. The lesions were aimed at either the caudal or rostral half of Ec and were made using Teflon-coated insect pins or varnished recording electrodes with exposed tips (0.4-0.5 mm). A constant current (1.5-3.0 mA, electrode positive) was passed for up to 3 min using a stimulator (model S-48; Grass Instruments, Quincy, MA) and a constant current unit (Grass Instruments). At the end of the surgery, the animals were given a dose of the analgesic buprenorphine (0.01 mg/kg). For 2 d after the surgery, the birds had ad libitum access to food, after which, they were brought back down to their 85% free-feeding weight.
Postlesion testing sessions. The postlesion testing period resumed after 5-7 d after surgery. The format for the sessions was identical to the prelesion testing sessions.
Histology
Although the electrodes were positioned to produce a lesion in either the caudal or rostral half of Ec, the brains were examined to visualize and quantify the extent and location of the lesions in the telencephalon. After the final testing period, the pigeons were deeply anesthetized with sodium pentobarbital (100 mg/kg, i.p.) and perfused transcardially with saline, followed by 4% paraformaldehyde. The brains were extracted, blocked, postfixed for several hours (4% paraformaldehyde with 20% sucrose), and left in 20-30% sucrose for ≥24 hr. The dura was then removed, and the brain was embedded in gelatin. Frozen sections (45-μm-thick in the coronal plane) through the Ec were collected using a microtome. The sections were mounted on gelatin-coated slides, stained with cresyl violet or neutral red, and coverslipped with Permount. The tissue was examined using light microscopy, and drawings were made with the aid of a camera lucida.
Results
Quantification of ectostriatal lesions
After sectioning the tissue, it was quite clear that there were three types of lesions: those located primarily in the rostral Ec, those located primarily in the caudal Ec, and small lesions. To quantify the site and size of the lesions, seven equally spaced coronal sections, 0.5 mm apart and spanning the rostrocaudal extent of Ec, were selected from each bird. The rostral-most and caudal-most sections corresponded to anterior (A) 11.25 mm and A8.25 from the atlas of Karten and Hodos (1967), respectively. Drawings of the sections were made using a camera lucida, and the borders of the Ec and the lesions were carefully noted. [We did not distinguish between the core and belt (“Ep”) regions of Ec delineated in previous neuroanatomical studies (Karten and Hodos, 1970). What we delineate as “Ec” includes both the core and belt region.] An observer blind to the behavioral results corroborated the extent of the lesions. The sections were then digitized and analyzed using NIH ImageJ. The total area of the Ec and that part of Ec destroyed by the lesion were measured for each section. The three rostral-most sections were then grouped as “rostral Ec,” and the four caudal sections were grouped as “caudal Ec.” The extent of the lesion in the rostral Ec was calculated by expressing the area lesioned as a percentage of the total area of the rostral Ec summed from the three rostral-most sections. Likewise, the magnitude of the caudal Ec lesion was calculated from the four caudal-most sections. Table 1 shows the percentage of the rostral and caudal Ec lesioned in each of the 14 cases. In three cases, there was extensive damage to the rostral Ec (48-68%) but much less to the caudal Ec (1-12%). In six cases, more of the caudal Ec compared with the rostral Ec was destroyed. In four of these cases, the rostral Ec was spared, and the extent of the lesion in the caudal Ec was moderate to large (13-37%). In the other two cases, the lesion in the caudal Ec was large (29 and 40%), but there was encroachment on the rostral Ec (13 and 17%). Finally, in five cases, the lesions were classified as small: <5% of the Ec was lesioned, and the lesion in the caudal or rostral Ec did not exceed 10%. In these five birds, the lesion was made using a microelectrode rather than an insect pin, and the current was passed for a short duration.
Table 1.
Quantification of ectostriatal lesions
| Case number | Rostral Ec% lesioned | Caudal Ec % lesioned |
|---|---|---|
| Caudal lesions | ||
| 2736 | 0 | 26 |
| 2753 | 0 | 13 |
| A28 | 0 | 14 |
| A104 | 0 | 37 |
| C212 | 17 | 29 |
| A19 | 13 | 40 |
| Rostral lesions | ||
| 14 | 48 | 12 |
| 4 | 61 | 8 |
| 8722 | 68 | 1 |
| Small lesions | ||
| 809 | 0 | 3 |
| 9036 | 0 | 6 |
| 9055 | 0 | 9 |
| 61 | 3 | 7 |
| 2727 |
5 |
2 |
The extent of the lesion in the rostral and caudal Ec, expressed as the percentage destroyed, is shown for each of the 14 cases. On the basis of the relative magnitude, the animals were categorized as having caudal Ec lesions (n = 6), rostral Ec lesions (n = 3), or small lesions, defined as <10% destruction of the caudal or rostral Ec (n = 5).
Figure 2 shows camera lucida drawings of three sections from case 2736, which was the fourth largest (of six) of the caudal Ec lesions. The top section, from the rostral Ec (A10.75), was intact, but the middle section, from the caudal Ec (A9.25), had a relatively symmetrical bilateral lesion occupying ∼40% of Ec. In the bottom section, from the extreme caudal Ec (A8.25), only a small lesion was present in the right Ec.
Figure2.
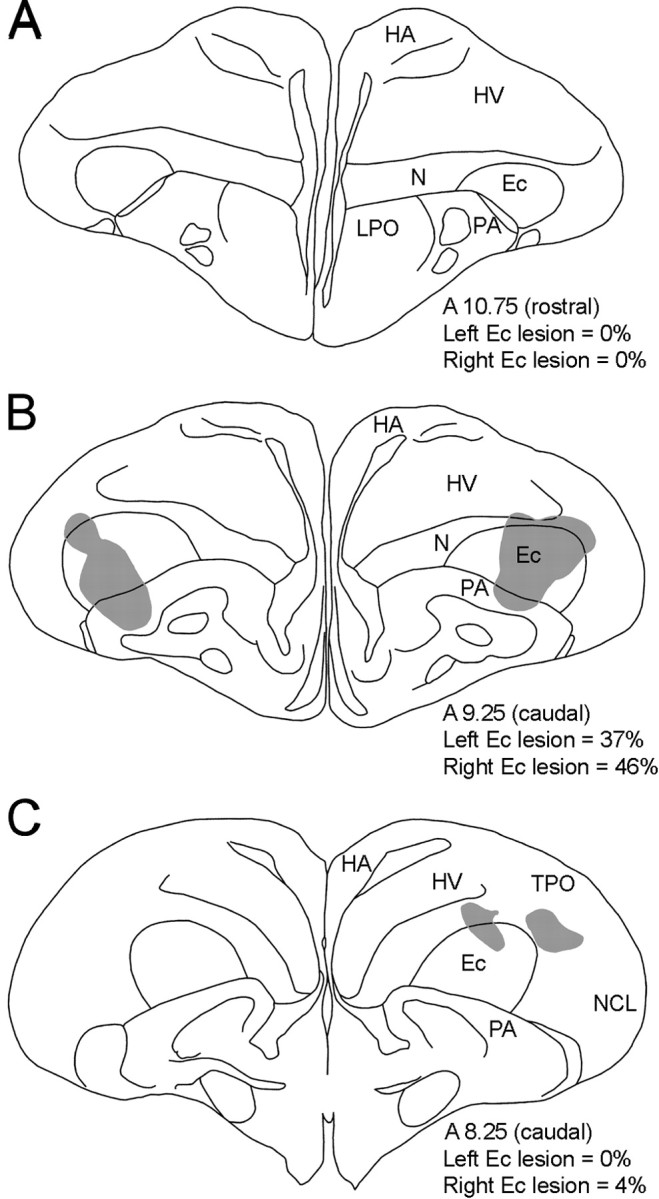
Electrolytic lesions in the Ec.Camera lucida drawings of three coronal sections from case 2736 are shown. The shaded area indicates the extent of the lesion. Using the atlas of Karten and Hodos (1967) as a guide, for each section, the approximate distance (in millimeters) anterior to interaural zero is indicated. The percentage of the left and right Ec destroyed is also indicated. A shows a section from the rostral Ec (A10.75), whereas B and C show sections from the caudal Ec (A9.25 and A8.25). The bulk of the lesion for this case was in the midcaudal Ec (B; see Table 1). HA, Hyperstriatum accessorium; LPO, lobus paraolfactorius; NCL, neostriatum caudale, pars lateralis; TPO, area temporo-parieto-occipitalis.
Performance on the grating and motion tasks
The performance of the animals during the testing sessions is presented in Figure 3 in which the percentage correct is plotted as a function of the noise in the S+ for both the motion (left) and grating (right) tasks. Although the average score across birds is plotted for illustration purposes, note that a repeated-measures design was used.
Figure 3.
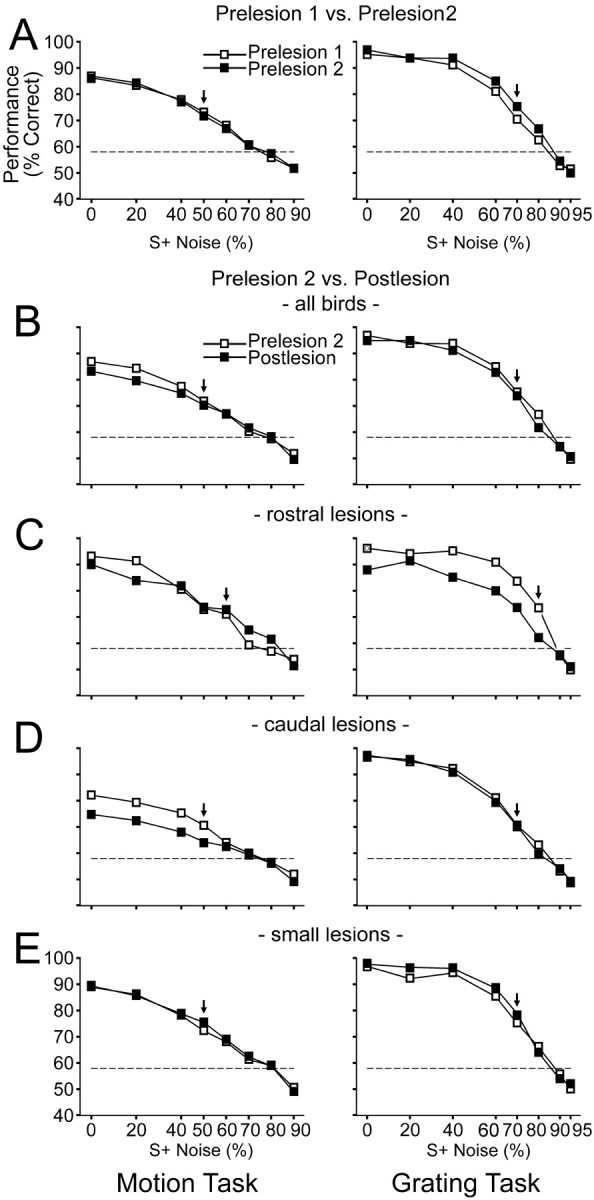
Performance on the motion (left) and grating (right) tasks. The average score (percentage correct) is plotted as a function of noise of the S+ in the test sessions. In A, the average scores of all birds on prelesion test 1 (opensymbols) and prelesion test 2 (filled symbols) are compared. In B-E, the average scores on the prelesion test 2 (open symbols) are compared with the postlesion test (filled symbols). In B, the scores are averaged from all birds. In C, D, and E, the scores are averaged from birds in the rostral, caudal, and small groups, respectively. Note that the scale on the abscissa is linear. The labels and ticks on the abscissa indicate the noise levels of each S+ used in the testing sessions. The broken line at 58% indicates the performance level required for statistical significance above chance. The vertical arrow indicates when all animals in the group were performing significantly above chance (i.e., above 58% correct) to that level of noise. For additional details, see Results.
Prelesion test 1 versus prelesion test 2
The purpose of the second prelesion test was to examine the effect ofa7d break, which was required for the subsequent surgery and recovery, on performance of the two tasks. In Figure 3A, the performance for the two prelesion tests is shown. Performance was almost identical on the two prelesion tests for the motion task and was slightly better on prelesion test 2 than on prelesion test 1 for the grating task, indicating that the 7 d break did not impair performance. Note that, generally, the animals' performance was better on the grating task compared with the motion task. For both tasks, as expected, performance declined as the noise in the S+ increased. To analyze these data, for both the grating and motion tasks, we performed a repeated-measures ANOVA with “noise” and “test” (prelesion tests 1 and 2) as within factors. For the motion task, we only included the four lowest levels of noise (i.e., 0-50% noise) because all birds were performing significantly above chance during the prelesion testing sessions to these stimuli. (For the number of trials involved, 58% is the performance level required for statistical significance above chance.) A performance deficit would not be observed with stimuli in which the animals were performing near chance. For the stimulus containing 60% noise, two birds were not performing significantly above chance. Similarly, for the grating task, we included the five lowest levels of noise (i.e., 0-70% noise). For the stimulus containing 80% noise, three birds were not performing significantly above chance. For all tests, the α level was set to p = 0.05 (two-tailed). As expected, there was a significant effect of noise for both the motion (F(3,39) = 63.9; p < 0.001) and grating (F(4,44) = 63.5; p < 0.001) tasks, indicating that the performance decreased as the S+ contained more noise. There was a significant effect of test on the grating task (F(1,11) = 6.2; p = 0.03) but not on the motion task. Thus, the 7 d break did not affect the birds' performance on the motion task, and the performance on the grating task showed a small (<5%) but significant improvement after the 7 d break (Fig. 3A, right).
Prelesion test 2 versus postlesion test
To examine the effects of the lesion on performance, we compared the results on the second prelesion test versus the postlesion test. Repeated-measures ANOVAs were performed for the grating and motion tasks as described above with one addition. There were two within factors, “noise” and “lesion” (i.e., prelesion test 2 vs postlesion test) but also a three-level between-groups factor, “lesion site,” to examine the effects of the rostral, caudal, and small lesions on performance. There was a significant effect of noise for both the grating (F(4,36) = 90.9; p < 0001) and motion (F(3,33) = 147.1; p < 0.001) tasks. There was a significant main effect of lesion for both the grating (F(1,9) = 6.3; p = 0.03) and motion (F(1,11) = 12.2; p = 0.005) tasks. Figure 3B compares the prelesion (test 2) and postlesion performance collapsed across all birds. Note that, for both tasks, the postlesion performance is reduced, but the performance deficit appeared small, with the exception of that on the motion stimuli containing 0 and 20% noise. However, there was also a significant lesion × lesion site interaction for both the motion (F(2,11) = 10.8; p = 0.003) and grating (F(2,9) = 12.6; p = 0.002) tasks. To illustrate this interaction, in Figure 3, C, D, and E, respectively, the prelesion (test 2) and postlesion performance of birds in the rostral, caudal, and small groups are plotted separately. For the birds with lesions to the rostral Ec (Fig. 3C), there was a marked postlesion deficit on performance in the spatial-pattern task for gratings containing <90% noise. This deficit was >10% for the stimuli containing 40-80% noise. For the motion task, these birds appeared to show a slight impairment for the stimuli containing 0 and 20% noise. From Figure 3D, it is apparent that the birds with lesions to the caudal Ec were impaired on the motion task, showing a 7% reduction to stimuli containing <60% noise. However, there was no apparent deficit for the grating task. Finally, the birds with the small lesions appeared to show no performance change for the motion task, and they performed slightly better after lesion on the grating task (Fig. 3E). For post hoc tests, we performed separate repeated-measures ANOVAs for the caudal, rostral, and small groups, as above, with noise and lesion as within factors. For the birds with the caudal Ec lesions, there was a highly significant effect of lesion for the motion task (F(1,5) = 511.4; p << 0.001) but not the grating task (F(1,4) = 0.2; p = 0.7). For the birds with the rostral Ec lesions, there was no effect of lesion for the motion task (F(1,2) = 0.36; p = 0.6), and the effect of lesion fell just short of significance for the grating task (F(1,2) = 12.5; p = 0.07). (Note that, because there are only three birds in this group, the power for detecting statistical significance is extremely low.) For the birds with small Ec lesions, there was a significant effect of lesion on the grating task (F(1,3) = 16.7; p = 0.03) but not on the motion task (F(1,4) = 0.4; p = 0.6). Clearly, the birds with the small lesions were not impaired after lesion on the motion or grating tasks. In fact, similar to the prelesion test 1 to prelesion test 2 comparison (Fig. 3A), the birds with the small lesions performed slightly (<5%) better after lesion on the grating task.
Thus, lesions to the rostral Ec appeared to impair performance on the grating but not the motion task, and lesions to the caudal Ec impaired performance on the motion but not the grating task. Birds with small lesions showed no impairment on either task. This is reinforced with the scatter plots in Figure 4. In Figure 4A, the magnitude of the performance deficit on the grating task was plotted as a function of the magnitude of the lesion in rostral Ec. All birds were included. Similarly, Figure 4B shows a plot of the magnitude of performance deficit on the motion task as a function of the magnitude of the lesion in caudal Ec. The magnitude of the performance deficit was calculated by taking the average of the difference of the scores between the two tests (postlesion-prelesion test 2) for the five lowest levels of noise in the grating task and the four lowest levels of noise in the motion task. A significant correlation was found between the size of lesions in rostral Ec and the performance on the grating task (r = 0.89; p < 0.001): as the size of lesions in rostral Ec increased, performance on the grating task deteriorated. Note that, of the birds from the caudal group, the one with largest encroachment on the rostral Ec (Table 1, case C212) also showed the largest deficit on the grating task. Similarly, there was a significant correlation between the size of lesions in caudal Ec and the performance on the motion task (r = 0.73; p < 0.01). Note that, of the birds from the rostral group, the case with largest encroachment on the caudal Ec (Table 1, case 14) also showed the largest deficit on the motion task.
Figure 4.

Correlation between performance and the extent of the lesion in Ec. In A, the normalized magnitude of the performance deficit on the grating task is plotted as a function of the size of the lesion in the rostral Ec. A significant correlation was found (r = 0.89; p < 0.001). In B, the normalized magnitude of the performance deficit on the motion task is plotted as a function of the size of the lesion in the caudal Ec. A significant correlation was found (r = 0.73; p < 0.01). Circles, squares, and triangles indicate individual animals from the rostral, caudal, and small groups, respectively. For additional details, see Results.
Possible effect of damage to areas adjacent to ectostriatum
As indicated in Figure 2, although the majority of the lesion is within Ec, there was damage to adjoining structures as well. This is typical of studies involving Ec lesions (Hodos and Karten, 1970; Bessette and Hodos, 1989; Watanabe, 1996). There was minimal damage to the paleostriatum augmentatum (PA) just ventral to Ec, except for one case in which there was no damage. In all but two cases, the lesion encroached on the neostriatum (N) just dorsal and/or medial to Ec and in 10 of the cases, there was some damage to the hyperstriatum ventrale (HV). Damage to HV and N was inevitable given that the electrode had to pass through these regions to access Ec. To assess the contributing effects of lesions in these regions to performance on the tasks, stepwise multiple regressions were performed whereby the magnitude of the performance deficit was considered as a function of the extent of damage to Ec, N, HV, and PA (in that order). This is the appropriate order, a priori, for three reasons. First, this ranking matches the ranking of lesion volumes. Second, previous neuro-physiological, behavioral, and neuroanatomical studies (see Introduction and Discussion) suggest that Ec is involved in visual tasks. Finally, previous studies have indicated that damage in N, HV, and PA cannot account for the visual deficits associated with Ec lesions (Hodos et al., 1986, 1988; Bessette and Hodos, 1989; Watanabe, 1991; Chaves and Hodos, 1998).
Considering the overall performance deficit (grating + motion) as a function of the various lesions, the Ec lesion was significantly correlated with deficit magnitude (F(1,9) = 13.6; p = 0.005), but lesions to the N, HV, and PA were not (N, F(1,9) = 1.1, p = 0.3; HV, F(1,9) = 0.02, p = 0.9; PA, F(1,9) = 0.4, p = 0.6).Likewise, considering the grating deficit as a function of damage to the rostral regions of Ec, N, HV, and PA, the rostral Ec was significantly correlated with deficit magnitude (F(1,7) = 35.3; p < 0.0006), but lesions to the N, HV, and PA were not (N, F(1,7) = 1.0, p = 0.3; HV, F(1,7) = 1.3, p = 0.3; PA, F(1,7) = 0.3, p = 0.6). Finally, considering the motion deficit as a function of damage to the caudal regions of Ec, N, HV, and PA, the caudal Ec was significantly correlated with deficit magnitude (F(1,9) = 15.0; p < 0.004), but lesions to the N, HV, and PA were not (N, F(1,9) = 1.1, p = 0.3; HV, F(1,9) = 0.03, p = 0.9; PA, F(1,9) = 3.3, p = 0.1). In summary, these results show no effect of damage beyond that measured by Ec lesion volume.
Discussion
We found that lesions of the caudal Ec in pigeons impaired performance on a visual motion but not a spatial-pattern task, whereas lesions of the rostral Ec impaired performance on a spatial-pattern task but not the visual motion task. It should be emphasized that the pigeons were not motion or spatially “blind” after lesions to Ec. For example, as shown in Figure 3C, birds with lesions to the caudal Ec showed a motion performance decrement after lesion but still correctly detected the noise-free S+ 75% of the time. We suggest that Ec is involved in higher-order visual processing, in much the same way that area MT is involved in motion processing in primates. Newsome and Paré (1988) found that lesions to area MT in macaque cortex impaired performance on a motion task, which was essentially identical to that used in the present study, and they suggested that MT was involved in motion integration. Subsequent studies indicated that the activity of MT neurons was very tightly correlated with motion perception (Newsome et al., 1989).
Comparison with previous studies of the rotundal-ectostriatal pathway
Previous electrophysiological studies of Ec found that the majority of neurons are responsive to moving stimuli (Revzin, 1970; Kimberly et al., 1971; Engelage and Bischof, 1997; Gu et al., 2002). Given the findings of the present study, we infer that most of these units were recorded in the caudal Ec. Previous studies involving Ec lesions found deficits on tasks involving color, brightness, and pattern discriminations (Hodos and Karten, 1970; Hodos et al., 1984, 1986, 1988; Bessette and Hodos, 1989; Watanabe, 1991, 1992). We speculate that these lesions involved rostral Ec. We are not aware of any previous studies demonstrating that Ec lesions disrupt motion perception.
The rostral Ec-grating, caudal Ec-motion double dissociation is consistent with the topographic projection from nRT to Ec. Wang et al. (1993) found that neurons in the posterior nRT are motion sensitive, whereas neurons responsive to color and luminance are found in the anterior nRT. Husband and Shimizu (1999) showed that the caudal Ec receives input from the posterior nRT, and the rostral Ec receives input from the anterior nRT (Benowitz and Karten, 1976; Laverghetta and Shimizu, 2003).
It is likely that the rostral-grating, caudal-motion dissociation found in the present study offers only a gross description of the functional compartmentalization of Ec. Given that the nRT contains several distinct areas on the basis of neurochemistry, cytoarchitecture, tectal innervation, and physiology (Karten and Hodos, 1970; Benowitz and Karten, 1976; Revzin, 1979; Watanabe et al., 1985; Martinez-de-la-Torre et al., 1990; Wang et al., 1993; Mpodozis et al., 1996; Marin et al., 2003) and that the topographic nRT-Ec projection may be quite precise (Husband and Shimizu, 1999; Laverghetta and Shimizu, 2003), it is probable that Ec contains several functionally distinct regions (Hellmann et al., 1995). Future studies using smaller localized lesions may reveal a finer, yet more extensive, functional organization of Ec. For example, the rostral tip of Ec receives input from the dorsoanterior subnucleus of nRT (Laverghetta and Shimizu, 2003), which contains color-sensitive cells (Wang et al., 1993). We predict that lesions localized to this area of Ec would impair on performance on color discrimination.
Visual streams in the mammalian and avian telencephalon
Numerous studies have addressed the streams in the thalamofugal pathway in the mammalian visual system (Ungerleider and Mishkin, 1982; Merigan and Maunsell, 1993; Milner and Goodale, 1995). Outlined in a simplified schematic in Figure 5 (left), there are motion, form, and color pathways originating with distinctive retinal ganglion cells and passing through different layers in the lateral geniculate nucleus (LGN) and primary visual cortex (V1), ultimately giving rise to the parietal and temporal streams in extrastriate visual cortex. At the top of this diagram, the extrastriate visual areas are related to specific functions: V4, MT, and inferotemporal (IT) cortex subserve higher-order color, motion, and form vision, respectively (Zeki, 1983a,b; Newsome et al., 1989; Tanaka et al., 1991). Shimizu and colleagues (Husband and Shimizu, 1999; Shimizu and Bowers, 1999; Laverghetta and Shimizu, 2003) outline that, like the mammalian thalamofugal pathway, there are streams in the avian tectofugal pathway (Fig. 5, middle). The deep layers in the tectum project to caudal nRT, whereas the superficial layers project to rostral nRT (Benowitz and Karten, 1976; Marin et al., 2003); the caudal and rostral nRT project to the caudal and rostral Ec, respectively (Benowitz and Karten, 1976; Husband and Shimizu, 1999; Laverghetta and Shimizu, 2003). Ec projects differentially to areas of the telencephalon: the caudal and rostral Ec project to the neostriatum intermediale (NIL) and neostriatum frontale (NFL), respectively (Husband and Shimizu, 1999). These anatomical data, combined with the electrophysiological recordings from nRT (Wang et al., 1993) and the behavioral data from the present study, support the idea that there are streams within the avian tectofugal pathway: a caudal stream for motion vision and a rostral stream for color and form.
Figure 5.

Visual streams in the tectofugal and thalamofugal pathways. Simplified schematics of the parallel processing of visual motion (broken lines) and form-color (solid lines) in the tectofugal pathway of birds (middle) and mammals (right) and the thalamofugal pathway of mammals (left) are shown. Spfl, Superficial. For a detailed discussion, see Results.
Shimizu and Bowers (1999) draw an explicit analogy between the counterparts in the mammalian thalamofugal and the avian tectofugal pathway. In this view, the rostral and caudal nRT are, respectively, analogous to the parvocellular and magnocellular layers of the LGN, and the rostral and caudal Ec are functionally equivalent to layer 4Cβ and 4Cα of primary visual cortex. Likewise, the projection sites of V1 (e.g., V2, V4, and MT) are considered analogous to NFL and NIL.
We suggest an alternative, perhaps more parsimonious, explanation: the streams in the avian and mammalian tectofugal systems are very similar. A much simplified schematic of the mammalian tectofugal pathway is shown in Figure 5 (right). The homolog of nRT in mammals is those areas in the thalamus that receive input from the superior colliculus (i.e., tectum) and/or project to the telencephalon (Nauta and Karten, 1970; Karten, 1979; Karten and Shimizu, 1989; Husband and Shimizu, 2001). This includes the lateral posterior nucleus of the thalamus and the adjacent pulvinar in cats and squirrels (Robson and Hall, 1977; Chalupa et al., 1983; Kelly et al., 2003) and parts of the medial, lateral, and inferior pulvinar subdivisions in primates (Soares et al., 2001). As with the nRT, the pulvinar can be divided into various areas on the basis of cytoarchitecture, electrophysiology, connectivity, and immunohistochemistry (for review, see Soares et al., 2001, their Fig. 15). Most of the electrophysiological research on the mammalian pulvinar has examined motion-sensitive cells (Chalupa et al., 1983; Bender, 1988; Casanova et al., 1989; Chalupa and Abramson, 1989; Merabet et al., 1998; Dumbrava et al., 2001), but neurons responsive to form and color have also been reported (Felsten et al., 1983; Benevento and Port, 1995). The cortical connections of the pulvinar are widespread and include areas 17, 18, and 19 in squirrels (Robson and Hall, 1977) and area MT, V1, V2, V4, IT, and parietal area 7 in various primates (Adams et al., 2000; Soares et al., 2001) (for review, see Robinson and McClurkin, 1989). Moreover, these projections are topographic. Soares et al. (2001), in their Figure 9, in Cebus, identified areas P1, P2, and P3 that have differential projections to V1, V2, V4, and MT.
Thus, although it has been emphasized that there are parallel pathways for form, color, and motion in the mammalian thalamofugal pathway, similar pathways are apparent in the mammalian tectofugal pathway. In this light, whereas Shimizu and Bowers (1999) emphasize that streams in the avian tectofugal system are a reflection of those in the mammalian thalamofugal system, we suggest that the streams in the avian tectofugal system simply resemble those in the mammalian tectofugal system, and we consider the subregions of Ec to be equivalent to various extrastriate cortices. In particular, the caudal Ec is equivalent to area MT, whereas the rostral regions of Ec involved in spatial-pattern vision might be equivalent to V2, V3, and possibly IT. There may be parts of Ec that are involved in the processing of complex form. Watanabe (1994) has reported that lesions to Ec result in visual agnosia, e.g., pigeons with Ec lesions are unable to discriminate individuals but can distinguish different species (Watanabe, 1992, 1996). One would also speculate that the rostral region of Ec, which receives input from the color cells in nRT, is equivalent to V4. There is a danger to overstating the parallels between the mammalian and avian tectofugal systems, as depicted in Figure 5. For example, the areas of the pulvinar containing MT-projecting neurons do not receive direct input from the superior colliculus (Stepniewska et al., 1999).
Finally, we suggest that the visual streams for form, color, and motion, present in both the thalamofugal and tectofugal pathways, may have first evolved in the tectofugal pathway. These two telencephalic pathways are present in all terrestrial amniotes, and the similarity in their basic connectivity, neurochemistry, and response properties across classes suggest that they can be traced to a common ancestor, and both pathways are necessary for normal visual function (Karten and Shimizu, 1989; Shimizu and Karten, 1991, 1993; Butler and Hodos, 1996; Shimizu and Bowers, 1999). In contrast to mammals, the thalamofugal pathway is rather underdeveloped in aves, particularly lateral-eyed species (Shimizu and Karten, 1991; Butler and Hodos, 1996; Bischof and Watanabe, 1997), and reptiles (for review, see Macphail, 1982; Husband and Shimizu, 2001). Behavioral studies have failed to find a clear role for this pathway in normal vision in these animals (Hodos et al., 1984). The thalamofugal pathway is far more developed in frontal-eyed species, such as owls, and is important for stereopsis (Karten et al., 1973; Pettigrew and Konishi, 1976; Pettigrew, 1979).
Husband and Shimizu (2001) discuss the “Bottleneck Theory” of Walls (1942), emphasizing that the visual system changed markedly when early mammals adopted a nocturnal lifestyle during the age of the dinosaurs. Functions such as color vision, likely mediated by the tectofugal pathway, were lost. After the mammals emerged and radiated into diurnal niches, the thalamofugal pathway expanded. With the development of a more sophisticated thalamofugal pathway in mammals, complete with streams for motion, form, and color, the tectofugal system may have evolved to subserve other visual functions, such as generation of visual salience (Robinson, 1993).
Footnotes
This research was supported by grants from the Natural Sciences and Engineering Research Council (NSERC) of Canada (D.R.W.W., M.L.S.). D.R.W.W. was supported by the Canada Research Chairs Program. N.A.C. was supported by a Julie Payette NSERC postgraduate scholarship. I.R.W. was supported by a Canada Graduate Scholarship (NSERC) and a graduate fellowship from the Alberta Heritage Foundation for Medical Research. We thank Dr. Andrew Iwaniuk for his comments on this manuscript.
Correspondence should be addressed to Dr. Douglas R. Wong-Wylie, Department of Psychology, University of Alberta, Edmonton, Alberta, Canada T6G 2E9. E-mail: dwylie@ualberta.ca.
N. A. Crowder's present address: Research School of Biological Sciences, The Australian National University, GPO Box 475, Canberra 2601, Australian Capital Territory, Australia.
Copyright © 2004 Society for Neuroscience 0270-6474/04/244962-09$15.00/0
References
- Adams MM, Hof PR, Gattass R, Webster MJ, Ungerleider LG (2000) Visual cortical projections and chemoarchitecture of macaque monkey pulvinar. J Comp Neurol 419: 377-393. [DOI] [PubMed] [Google Scholar]
- Benevento LA, Port JD (1995) Single neurons with both form/color differential responses and saccade-related responses in the nonretinotopic pulvinar of the behaving macaque monkey. Vis Neurosci 12: 523-544. [DOI] [PubMed] [Google Scholar]
- Bender DB (1988) Electrophysiological and behavioral experiments on the primate pulvinar. Prog Brain Res 75: 55-65. [DOI] [PubMed] [Google Scholar]
- Benowitz LI, Karten HJ (1976) Organization of the tectofugal visual pathway in the pigeon: a retrograde transport study. J Comp Neurol 167: 503-520. [DOI] [PubMed] [Google Scholar]
- Bessette BB, Hodos W (1989) Intensity, color, and pattern discrimination deficits after lesions of the core and belt regions of the ectostriatum. Vis Neurosci 2: 27-34. [DOI] [PubMed] [Google Scholar]
- Bischof HJ, Watanabe S (1997) On the structure and function of the tectofugal visual pathway in laterally eyed birds. Eur J Morphol 35: 246-254. [DOI] [PubMed] [Google Scholar]
- Bischof WF, Reid SL, Wylie DR, Spetch ML (1999) Perception of coherent motion in random dot displays by pigeons and humans. Percept Psycho-phys 61: 1089-1101. [DOI] [PubMed] [Google Scholar]
- Butler AB, Hodos W (1996) Comparative vertebrate neuroanatomy: evolution and adaptation. New York: Wiley.
- Casanova C, Freeman RD, Nordmann JP (1989) Monocular and binocular response properties of cells in the striate-recipient zone of the cat's lateral posterior-pulvinar complex. J Neurophysiol 62: 544-557. [DOI] [PubMed] [Google Scholar]
- Chalupa LM, Abramson BP (1989) Visual receptive fields in the striate-recipient zone of the lateral posterior-pulvinar complex. J Neurosci 9: 347-357. [DOI] [PMC free article] [PubMed] [Google Scholar]
- Chalupa LM, Williams RW, Hughes MJ (1983) Visual response properties in the tectorecipient zone of the cat's lateral posterior-pulvinar complex: a comparison with the superior colliculus. J Neurosci 3: 2587-2596. [DOI] [PMC free article] [PubMed] [Google Scholar]
- Chaves LM, Hodos W (1998) Color reversal-learning deficits after tectofugal pathway lesions in the pigeon telencephalon. Behav Brain Res 90: 1-12. [DOI] [PubMed] [Google Scholar]
- Dumbrava D, Faubert J, Casanova C (2001) Global motion integration in the cat's lateral posterior-pulvinar complex. Eur J Neurosci 13: 2218-2226. [DOI] [PubMed] [Google Scholar]
- Engelage J, Bischof H-J (1993) The organization of the tectofugal pathway in birds: a comparative review. In: Vision, brain, and behavior in birds (Zeigler HP, Bischof H-J, eds), pp 137-158. Cambridge, MA: MIT.
- Engelage J, Bischof HJ (1997) Single cell responses in the ectostriatum of the zebra finch. J Comp Physiol [A] 179: 785-795. [Google Scholar]
- Felsten G, Benevento LA, Burman D (1983) Opponent-color responses in macaque extrageniculate visual pathways: the lateral pulvinar. Brain Res 288: 363-367. [DOI] [PubMed] [Google Scholar]
- Glass L (1969) Moire effect from random dots. Nature 223: 578-580. [DOI] [PubMed] [Google Scholar]
- Gu Y, Wang Y, Zhang T, Wang SR (2002) Stimulus size selectivity and receptive field organization of ectostriatal neurons in the pigeon. J Comp Physiol [A] 188: 173-178. [DOI] [PubMed] [Google Scholar]
- Hellmann B, Waldmann C, Gunturkun O (1995) Cytochrome oxidase activity reveals parcellations of the pigeon's ectostriatum. NeuroReport 6: 881-885. [DOI] [PubMed] [Google Scholar]
- Hodos W (1993) The visual capabilities of birds. In: Vision, brain, and behavior in birds (Zeigler HP, Bischof HJ, eds), pp 36-76.Cambridge, MA: MIT.
- Hodos W, Karten HJ (1970) Visual intensity and pattern discrimination deficits after lesions of ectostriatum in pigeons. J Comp Neurol 140: 53-68. [DOI] [PubMed] [Google Scholar]
- Hodos W, Leibowitz RW, Bonbright Jr JC (1976) Near-field visual acuity of pigeons: effects of head location and stimulus luminance. J Exp Anal Behav 25: 129-141. [DOI] [PMC free article] [PubMed] [Google Scholar]
- Hodos W, Macko KA, Bessette BB (1984) Near-field acuity changes after visual system lesions in pigeons. II. Telencephalon. Behav Brain Res 13: 15-30. [DOI] [PubMed] [Google Scholar]
- Hodos W, Weiss SR, Bessette BB (1986) Size-threshold changes after lesions of the visual telencephalon in pigeons. Behav Brain Res 21: 203-214. [DOI] [PubMed] [Google Scholar]
- Hodos W, Weiss SR, Bessette BB (1988) Intensity difference thresholds after lesions of ectostriatum in pigeons. Behav Brain Res 30: 43-53. [DOI] [PubMed] [Google Scholar]
- Husband S, Shimizu T (1999) Efferent projections of the ectostriatum in the pigeon (Columba livia). J Comp Neurol 406: 329-345. [PubMed] [Google Scholar]
- Husband S, Shimizu T (2001) Evolution of the avian visual system. In: Avian visual cognition (Cook R, ed). Medford, MA: Tufts University. E-book available at http://www.pigeon.psy.tufts.edu.
- Karten HJ (1979) Visual lemniscal pathways in birds. In: Neural mechanisms of behavior in the pigeon (Granda AM, Maxwell JH, eds), pp 409-430. New York: Plenum.
- Karten HJ, Hodos W (1967) A stereotaxic atlas of the brain of the pigeon (Columba livia). Baltimore: Johns Hopkins.
- Karten HJ, Hodos W (1970) Telencephalic projections of the nucleus rotundus in the pigeon (Columba livia). J Comp Neurol 140: 35-51. [DOI] [PubMed] [Google Scholar]
- Karten JH, Revzin AM (1966) The afferent connections of the nucleus rotundus in the pigeon. Brain Res 2: 368-377. [DOI] [PubMed] [Google Scholar]
- Karten HJ, Shimizu T (1989) The origins of neocortex: connections and lamination as distinct events in evolution. J Cognit Neurosci 1: 290-301. [DOI] [PubMed] [Google Scholar]
- Karten HJ, Hodos W, Nauta WJ, Revzin AM (1973) Neural connections of the “visual wulst” of the avian telencephalon. Experimental studies in the pigeon (Columba livia) and owl (Speotyto cunicularia). J Comp Neurol 150: 253-278. [DOI] [PubMed] [Google Scholar]
- Kelly DM, Bischof WF, Wong-Wylie DR, Spetch ML (2001) Detection of Glass patterns by pigeons and humans: implications for differences in higher-level processing. Psychol Sci 12: 338-342. [DOI] [PubMed] [Google Scholar]
- Kelly LR, Li J, Carden WB, Bickford M (2003) Ultrastructure and synaptic targets of tectothalamic terminals in the cat lateral posterior nucleus. J Comp Neurol 464: 472-486. [DOI] [PubMed] [Google Scholar]
- Kimberly RP, Holden AL, Bamborough P (1971) Response characteristics of pigeon forebrain cells to visual stimulation. Vision Res 11: 475-487. [DOI] [PubMed] [Google Scholar]
- Laverghetta AV, Shimizu T (2003) Organization of the ectostriatum based on afferent connections in the zebra finch (Taeniopygia guttata). Brain Res 963: 101-112. [DOI] [PubMed] [Google Scholar]
- Livingstone MS, Hubel DH (1988) Segregation of form, color, movement, and depth: anatomy, physiology, and perception. Science 240: 740-749. [DOI] [PubMed] [Google Scholar]
- Macphail EM (1982) Brain and intelligence in vertebrates. New York: Oxford UP.
- Marin G, Letelier JC, Henny P, Sentis E, Farfan G, Fredes F, Pohl N, Karten H, Mpodozis J (2003) Spatial organization of the pigeon tectorotundal pathway: an interdigitating topographic arrangement. J Comp Neurol 458: 361-380. [DOI] [PubMed] [Google Scholar]
- Martinez-de-la-Torre M, Martinez S, Puelles L (1990) Acetylcholinesterasehistochemical differential staining of subdivisions within the nucleus rotundus in the chick. Anat Embryol 181: 129-135. [DOI] [PubMed] [Google Scholar]
- Medina L, Reiner A (2000) Do birds possess homologues of mammalian primary visual, somatosensory and motor cortices? Trends Neurosci 23: 1-12. [DOI] [PubMed] [Google Scholar]
- Merabet L, Desautels A, Minville K, Casanova C (1998) Motion integration in a thalamic visual nucleus. Nature 396: 265-268. [DOI] [PubMed] [Google Scholar]
- Merigan WH, Maunsell JH (1993) How parallel are the primate visual pathways? Annu Rev Neurosci 16: 369-402. [DOI] [PubMed] [Google Scholar]
- Milner AD, Goodale MA (1995) The visual brain in action. New York: Oxford UP.
- Mpodozis J, Cox K, Shimizu T, Bischof HJ, Woodson W, Karten HJ (1996) GABAergic inputs to the nucleus rotundus (pulvinar inferior) of the pigeon (Columba livia). J Comp Neurol 374: 204-222. [DOI] [PubMed] [Google Scholar]
- Nauta WJH, Karten HJ (1970) A general profile of the vertebrate brain, with sidelights on the ancestry of cerebral cortex. In: The neurosciences: second study program (Schmitt FO, ed). New York: Rockefeller.
- Newsome WT, Paré EB (1988) A selective impairment of motion perception following lesions of the middle temporal visual area (MT). J Neurosci 8: 2201-2211. [DOI] [PMC free article] [PubMed] [Google Scholar]
- Newsome WT, Britten KH, Movshon JA (1989) Neuronal correlates of a perceptual decision. Nature 341: 52-54. [DOI] [PubMed] [Google Scholar]
- Nixdorf BE, Bischof HJ (1982) Afferent connections of the ectostriatum and visual wulst in the zebra finch (Taeniopygia guttata castanotis Gould)—an HRP study. Brain Res 248: 9-17. [DOI] [PubMed] [Google Scholar]
- Pettigrew JD (1979) Binocular visual processing in the owl's telencephalon. Proc R Soc Lond B Biol Sci 204: 435-454. [DOI] [PMC free article] [PubMed] [Google Scholar]
- Pettigrew JD, Konishi M (1976) Neurons selective for orientation and binocular disparity in the visual Wulst of the barn owl (Tyto alba). Science 193: 675-678. [DOI] [PubMed] [Google Scholar]
- Revzin AM (1970) Some characteristics of wide-field units in the brain of the pigeon. Brain Behav Evol 3: 195-204. [DOI] [PubMed] [Google Scholar]
- Revzin AM (1979) Functional localization in the nucleus rotundus. In: Neural mechanisms of behavior in the pigeon (Granda AM, Maxwell JH, eds), pp 165-175.New York: Plenum.
- Robinson DL (1993) Functional contributions of the primate pulvinar. Prog Brain Res 95: 371-380. [DOI] [PubMed] [Google Scholar]
- Robinson DL, McClurkin JW (1989) The visual superior colluculus and pulvinar. Rev Oculomot Res 3: 337-360. [PubMed] [Google Scholar]
- Robson JA, Hall WC (1977) The organization of the pulvinar in the grey squirrel (Sciurus carolinensis). I. Cytoarchitecture and connections. J Comp Neurol 173: 355-388. [DOI] [PubMed] [Google Scholar]
- Shimizu T, Bowers AN (1999) Visual circuits of the avian telencephalon: evolutionary implications. Behav Brain Res 98: 183-191. [DOI] [PubMed] [Google Scholar]
- Shimizu T, Karten HJ (1991) Central visual pathways in retiles and birds: evolution of the visual system. In: Vision and visual dysfunction, Vol 2 (Gregory R, Cronly-Dillon JR, eds), pp 421-441.London: Macmillan. [Google Scholar]
- Shimizu T, Karten HJ (1993) The avian visual system and the evolution of the neocortex. In: Vision, brain, and behavior in birds (Zeigler HP, Bischof HJ, eds), pp 103-114.Cambridge, MA: MIT.
- Soares JGM, Gattass R, Souza APB, Rosa MGP, Fiorani M, Brandã BL (2001) Connectional and neurochemical subdivisions of the pulvinar in Cebus monkeys. Vis Neurosci 18: 25-41. [DOI] [PubMed] [Google Scholar]
- Stepniewska I, Qi H-X, Kaas JH (1999) Do superior colliculus projection zones in the inferior pulvinar project to MT in primates? Eur J Neurosci 11: 469-480. [DOI] [PubMed] [Google Scholar]
- Sun HJ, Frost BJ (1998) Computation of different optical variables of looming objects in pigeon nucleus rotundus neurons. Nat Neurosci 1: 296-303. [DOI] [PubMed] [Google Scholar]
- Tanaka K, Saito H, Fukada Y, Moriya M (1991) Coding visual images of objects in the inferotemporal cortex of the macaque monkey. J Neurophysiol 66: 170-189. [DOI] [PubMed] [Google Scholar]
- Ungerleider LG, Mishkin M (1982) Two cortical visual systems. In: Analysis of visual behavior (Ingle DJ, Goodale MA, Mansfield RJW, eds), pp 549-586. Cambridge, MA: MIT.
- Walls G (1942) The vertebrate eye and adaptive radiation. Bloomfield Hills, MI: Cranbrooke.
- Wang Y-C, Jiang S, Frost BJ (1993) Visual processing in pigeon nucleus rotundus: luminance, color, motion, and looming subdivisions. Vis Neurosci 10: 21-30. [DOI] [PubMed] [Google Scholar]
- Wasserman EA (1995) The conceptual abilities of pigeons. Am Scientist 83: 246-255. [Google Scholar]
- Watanabe M, Ito H, Ikushima M (1985) Cytoarchitecture and ultrastructure of the avian ectostriatum: afferent terminals from the dorsal telencephalon and some nuclei in the thalamus. J Comp Neurol 236: 241-257. [DOI] [PubMed] [Google Scholar]
- Watanabe S (1991) Effects of ectostriatal lesions on natural concept, pseudoconcept, and artificial pattern discrimination in pigeons. Vis Neurosci 6: 497-506. [DOI] [PubMed] [Google Scholar]
- Watanabe S (1992) Effect of lesions in the ectostriatum and Wulst on species and individual discrimination in pigeons. Behav Brain Res 49: 197-203. [DOI] [PubMed] [Google Scholar]
- Watanabe S (1994) Experimental visual agnosia in the pigeon. Braz J Med Biol Res 27: 563-571. [PubMed] [Google Scholar]
- Watanabe S (1996) Effects of ectostriatal lesions on discriminations of conspecific, species and familiar objects in pigeons. Behav Brain Res 81: 183-188. [DOI] [PubMed] [Google Scholar]
- Wilson HR, Wilkinson F (1998) Detection of global structure in Glass patterns: implications for form vision. Vis Res 38: 2933-2947. [DOI] [PubMed] [Google Scholar]
- Zeki S (1983a) Colour coding in the cerebral cortex: the reaction of cells in monkey visual cortex to wavelengths and colours. Neuroscience 9: 741-765. [DOI] [PubMed] [Google Scholar]
- Zeki S (1983b) Colour coding in the cerebral cortex: the responses of wavelength-selective and colour-coded cells in monkey visual cortex to changes in wavelength composition. Neuroscience 9: 767-781. [DOI] [PubMed] [Google Scholar]