

Abstract
Songbirds, such as zebra finches, learn their song from a tutor early in life. Forebrain nuclei in the “song system” are important for the acquisition and production of song. Brain regions [including the caudomedial part of the neostriatum (NCM) and of the hyperstriatum ventrale (CMHV)] outside the song system show increased neuronal activation, measured as expression of immediate early genes (IEGs), when zebra finch males are exposed to song. IEG expression in the NCM in response to tutor song is significantly positively correlated with the strength of song learning (i.e., the number of elements copied). Here, we exposed three groups of adult zebra finch males to tutor song, to their own song, or to novel conspecific song. The two control groups were included to examine an alternative explanation of our previous results in terms of variation in predisposed levels of attentiveness. Expression of Zenk, the protein product of the IEG ZENK, was measured in the NCM, CMHV, and hippocampus. There were no significant differences in overall Zenk expression between the three experimental groups. However, there was a significant positive correlation between Zenk expression in the NCM (but not in the other two regions) and strength of song learning in the males that were exposed to the tutor song. There was no such correlation in the other two groups. These results suggest that experience-related neuronal activation is specific to the tutor song and thus unlikely to be a result of differences in attention.
Keywords: learning, songbirds, brain, birdsong, IEG, zebra finch
Introduction
Many songbird species learn their songs from an adult conspecific, or “tutor,” during a sensitive period early in life and can remember these learned sounds into adulthood (Konishi, 1985; Marler, 1991; Funabiki and Konishi, 2003). Birdsong learning has become a prominent model for the study of the neural mechanisms of learning and memory (Nottebohm, 1991, 2000; DeVoogd, 1994; Clayton, 2000; Bolhuis and Eda-Fujiwara, 2003). For a long time, the study of the brain mechanisms of birdsong focused on nuclei and pathways, which are collectively referred to as the “song system” (Nottebohm et al., 1990; Nottebohm, 1991, 2000) (but see Bolhuis and Macphail, 2001; Bolhuis and Eda-Fujiwara 2003). However, analysis of the expression of immediate early genes (IEGs), a measure of neuronal activation (Sagar et al., 1988; Tischmeyer and Grimm, 1999; Davis et al., 2003), has revealed that other parts of the brain are involved in song perception. These brain regions include the caudomedial neostriatum (NCM) [also known as the caudomedial nidopallium (Reiner et al., 2004)] and the caudomedial hyperstriatum ventrale (CMHV) (or caudomedial mesopallium in the new nomenclature of Reiner et al., 2004) (Mello et al., 1992; Mello and Clayton, 1994; Jarvis and Nottebohm, 1997; Mello and Ribeiro, 1998; Bolhuis et al., 2000) (Fig. 1). Bolhuis et al. (2000, 2001) found a significant positive correlation between the strength of song learning (the number of elements that males had copied from the song of their tutor) and IEG expression in the NCM. These authors suggested that the NCM may be (part of) the neural substrate for the representation of the tutor song.
Figure 1.

Camera lucida drawing of a parasagittal section of a male zebra finch brain at ≅1.0 mm from the midline. Rectangles indicate the counting area for the NCM, CMHV, and hippocampus. Gray shaded areas are activated when birds hear song (Jarvis and Nottebohm, 1997; Mello and Ribeiro, 1998). Gray arrows connect nuclei of the conventional song system. CMHV, Caudal medial hyperstriatum ventrale (known as caudal medial mesopallium in the new nomenclature of Reiner et al., 2004); DLM, medial part of the dorsolateral thalamic nucleus; HVC, high vocal centre; LH, lamina hyperstriatica; lMAN, lateral part of the magnocellular nucleus of the neostriatum; NCM, caudal medial neostriatum (known as caudal medial nidopallium in the new nomenclature of Reiner et al., 2004); RA, robust nucleus of the archistriatum; V, ventricle (based on Vates et al., 1996; Jarvis and Nottebohm, 1997; Brainard and Doupe, 2000; Clayton, 2000; Mello, 2002; Bolhuis and Eda-Fujiwara, 2003). For new nomenclature of brain areas other than NCM and CMHV, see Reiner et al., 2004. Scale bar, 1 mm.
There are a number of alternative explanations for the findings of Bolhuis et al. (2000) (cf. Marler and Doupe, 2000; Bolhuis et al., 2001; Bolhuis and Eda-Fujiwara, 2003). First, a positive correlation between the strength of song learning and IEG response to the tutor song is also consistent with a role for the NCM as (part of) the neural substrate for the bird's own song (BOS). The more a bird has learned from its tutor, the more the tutor song will resemble the BOS. Thus, it is important to measure neuronal activation in the NCM in response to playback of the BOS. Second, the positive correlations might reflect individual differences in attention. That is, “good learners” might be predisposed to pay more attention to song stimuli than “bad learners” (Marler and Doupe, 2000). To address this issue, a group of birds was exposed to a novel song of an unfamiliar conspecific to see whether also in this condition there would be a significant positive correlation between neuronal activation in the NCM and the number of elements copied from the tutor song.
There has been some debate concerning the lateral extent of the NCM (Stripling et al., 2001). In the present study, we compared IEG expression in two locations within the NCM: medial [at a location comparable with previous studies (Table 1)] and lateral (comparable with the location sampled by Bolhuis et al., 2000).
Table 1.
Distance to the midline (in millimeters) in a number of studies in which the NCM of songbirds was sampled
|
Study |
Distance to midline |
Gender |
Species |
Stimulus sounds |
Method |
|---|---|---|---|---|---|
| Bailey and Wade, 2003 | not spec. | M, F | ZF | CON, HET, TON, SIL | ICC |
| Bailey et al., 2002 | not spec. | F | ZF | CON, HET, TON, SIL | ICC |
| Bolhuis et al., 2000 | 0.5-1.0 | M | ZF | TUT, SIL | ICC |
| Bolhuis et al., 2001 | 0.8-1.2 | M | ZF | TUT | ICC |
| Chew et al., 1995 | 0.2-0.6 | M | ZF | CON, HET, TON | Elec |
| Chew et al., 1996 | not spec. | M, F | ZF | BOS, CON, NOV, HET, TON | Elec |
| Duffy et al., 1999 | 0.2-0.6 | M, F | Star | CON, SIL | ICC |
| Eda-Fujiwara et al., 2003 | dNCM ≅ 1.0a | F | Bud | NOV | ICC |
| VNCM ≅ 2.5a | |||||
| Gentner et al., 2001 | 0.0-0.7 | F | Star | CON | ICC |
| Jarvis and Nottebohm, 1997 | not spec. | M | ZF, Can | BOS, CON, SIL | ISH |
| Jarvis et al., 1995 | not spec. | M | Can | CON, NOV, SIL | ISH |
| Jin and Clayton, 1997 | 0.15-0.25 | M | ZF | NOVb, TON | ISH |
| Kimpo and Doupe, 1997 | not spec. | M | ZF | CON, TON | ICC |
| Maney et al., 2003 | 0-0.6 | F | WCS | CON, NOV | ICC |
| Mello and Clayton, 1994 | 0.15-0.25 | M | ZF, Can | CON | ISH |
| Mello and Ribeiro, 1998 | 0.15c | M, F | ZF, Can | CON, SIL | ICC |
| Mello et al., 1992 | 0.2-0.3 | M | ZF, Can | CON, HET, TON, SIL | ISH |
| Mello et al., 1995 | 0.15-0.25 | M | ZF | CON | ISH |
| Park and Clayton, 2002 | not spec. | M | ZF | CON, TON | ICC |
| Phillmore et al., 2003 | 0-0.8 | M, F | BCC | NOV, SIL | ICC |
| Ribeiro et al., 1998 | 1.1-1.3 | F | Can | CON, TON, SIL | ICC |
| Sockman et al., 2002 | 0-1.12 | F | Star | CON | ICC |
| Stripling et al., 1997 | 021-0.78 | M | ZF | BOS, CON, HET, TON, SIL | Elec |
| Stripling et al., 2001 | 0.25 | M, F | ZF | CON, NOV, HET, TON | Elec, ICC |
| Whitney et al., 2003 | >0.15d | not spec. | ZF | NOV | ICC |
| Present study | 0.25-0.4, | M | ZF | TUT, BOS, NOV | ICC |
|
|
0.7-1.0 |
|
|
|
|
Gender (M, male; F, female) and species (ZF, zebra finch; Star, starling; Bud, budgerigar; Can, canary; WCS, white crowned sparrow; BCC, black capped chickadee) of birds studied, used stimulus sounds (TUT, tutor song; BOS, bird's own song; CON, conspecific song, not specified whether these songs were familiar or novel to the experimental subjects; NOV, novel conspecific song; HET, heterospecific song; TON, tone or noise; SIL, silence), and method (ICC, immunocytochemistry; Elec, electrophysiology; ISH, in situ hybridization). not spec., Not specified.
Personal communication.
Authors state they used tutor song, but, according to our definitions, they used novel song.
Figure 3C shows NCM up to 1.0 mm from the midline.
Lateral extent not specified.
Materials and Methods
Subjects. Subjects were 29 male zebra finches (Taeniopygia guttata), reared socially in the breeding colony of the department of Behavioural Biology, Leiden University. Birds were reared and maintained as described in a behavioral study in which 15 of them participated (Riebel et al., 2002). Briefly, birds received water and food ad libitum and were maintained on a 13.5/10.5 hr light/dark cycle. The males remained with both parents and their siblings until 74 ± 12 d (mean ± SD) after hatching. Thus, during the sensitive period for song learning, the experimental birds stayed with their father, who acted as their song tutor. From then onward, they were housed in same-sex groups, except during preference tests at 112 ± 11 d (mean ± SD) after hatching and when their songs were recorded.
Preference tests. Measuring song preference and calculating number of copied elements are two methods that are often used to assess whether or how much a bird learned from a particular song (Houx and ten Cate, 1999; Riebel et al., 2002). In this study, we examined whether these two measures correlate. The preference testing procedure has been described previously (Houx and ten Cate, 1999; Riebel, 2000; Riebel et al., 2002). Briefly, operant conditioning was used with song as sole reward. In the experimental cages (70 × 30 × 45 cm), birds could peck at red response keys (diameter, 1 cm) with a red light-emitting diode in the center (diameter, 2 mm) fitted into the rear wall. Pecking one key triggered one playback of the song assigned to it (tutor song or novel song). A custom-built control-registration unit kept a data log and controlled the playbacks (sound chip Oki MSM6388; Oki, Tokyo, Japan). Songs were broadcast at 70 dB peak amplitude (CEL-231 sound level meter) at 30 cm from the loudspeaker (Quart 250 or JBL Control 1), which was fitted behind an opening (diameter, 9 cm) in the rear, halfway between the pecking keys. Songs played when either of the keys was pecked were interchanged daily so as to control for possible side preferences. The day after a bird started pecking both response keys was designated day 1 of the preference test, which lasted 4 consecutive days. Most birds learned the task without training; those who had not started to peck the keys after 4 d were trained in sessions as described by Houx and ten Cate (1999). The preference for the father's song (i.e., the tutor song) was calculated by dividing the number of pecks for the father's song by the grand total over the 4 d. Throughout the preference testing period, food and water were available ad libitum.
Song (re-)exposure. The birds were divided into three experimental groups. All birds received the same treatment throughout, except for the category of songs heard before being anesthetized and perfused. At 672 ± 27 d after hatching, birds were placed in a cage in a sound-attenuating chamber for acclimatization, and, 2-3 d later, birds were exposed to a recording of their tutor song (group TUT; n = 9), to their own song (group BOS; n = 11), or to a novel song of an adult zebra finch male (group NOV; n = 9). The subjects had never heard the novel songs before, and the songs were recorded from males that were unrelated to the tutor males. Novel songs used for the preference test were different from those used for playback before perfusion. Lights were switched off 15 min before onset of playbacks to keep movements that could induce IEG expression to a minimum and to prevent the birds from vocalizing. During 30 min, song segments of 6.1 ± 0.7 sec were played back at random intervals by a custom-made playback device (with sound chip Oki MSM6388) set to a rate of 60 random playbacks per hour. Songs were broadcast at 70 dB sound pressure level peak amplitude at the point at which the bird's head was during the playback (CEL-231 sound level meter). The birds remained in darkness for 1 hr after the end of song playback, when they were killed. Continuous tape recording revealed that none of the birds sang while they were in darkness. Permission to perform this experiment was obtained from the Animal Experiments Committee of Leiden University (UDEC 00071).
Song recording and analysis. The undirected (Zann, 1996) songs of tutor, experimental, and novel birds had been recorded before the playback experiments with a Sennheiser Electronic (Wedemark, Germany) MKH40 microphone and a Sony (Tokyo, Japan) TC-D5 Pro II recorder. Recording of the bird's own songs took place when the experimental birds were adult (over 120 d of age) in a sound-attenuating chamber. Songs were digitized using Signal-Rts software (Engineering Design, Belmont, MA) with a sample rate of 20.5 kHz. For each experimental bird and each tutor, a sonogram was made of a representative motif using Avisoft (Berlin, Germany) SASLab Pro software. Songs from the three categories (tutor songs, novel songs, and the songs of the experimental males) were recorded under the same circumstances, and their sonograms were produced in the same manner. Three independent observers, who did not know the origin of the sonograms, compared the sonograms of motifs of each of the experimental males in the three groups with that of the tutor motif. In addition, the observers were asked to compare 14 sonograms of tutor songs with sonograms of songs from males that were unrelated to the tutors and had always been in different rooms. Subsequently, for each experimental bird, the percentage of elements shared with the tutor song was calculated in relation to the number of different elements in the tutor song (cf. Bolhuis et al., 2000). The percentage of elements that an unfamiliar bird shared with the tutor song was calculated in relation to the number of different elements in the tutor song to obtain a measure of the chance level of song element sharing. An element was defined as a single continuous vocalization separated from other vocalizations by either a short silent interval or by a major change in harmonic structure (Sturdy et al., 1999a,b). Kendall's coefficient of concordance for the three observers was 0.83. The mean scores of the three observers were used for analysis (cf. Bolhuis et al., 2000).
Immunocytochemistry. One hour after the end of exposure to the stimulus song, birds received injections of 0.06 ml of Nembutal (intramuscularly), and they were subsequently perfused with 0.2% heparin in saline and a fixative (4% paraformaldehyde in 0.1 m PBS, pH 7.4). The brains were dissected out and placed in fixative for 3 hr, after which they were placed in a 30% sucrose solution overnight. Free-floating sections (40 μm) were made using a freezing microtome and placed in 0.1 m PBS, pH 7.4. The sections were then incubated in 3% H2O2 in PBS for 15 min, rinsed in PBS, and incubated with normal goat serum for 30 min. Sections were rinsed in PBS again and incubated at 4°C for 20 hr with the primary antibody. We used polyclonal antibodies against egr-1 (C-19, sc-189), dilution 1:1000, raised in rabbits (Santa Cruz Biotechnology, Santa Cruz, CA). Sections were then rinsed in PBS, incubated with goat anti-rabbit for 1 hr, and rinsed in PBS again. Staining involved incubation for 1 hr in ABC (avidin-biotinylated enzyme complex; Vector Laboratories, Burlingame, CA) and rinsing in PBS, followed by rinsing in acetic acid and incubation in a diaminobenzidine medium for 25 min with 0.034% H2O2 added during the final 15 min. Sections were then rinsed in acetic acid and mounted onto slides using gelatin. Control sections were subjected to the same procedure but were not incubated with the primary antibody. Alternate sections were stained for acetylcholinesterase to facilitate identification of brain structures.
Image analysis. The number of immunopositive cell nuclei in a standard size frame of 0.3 × 0.4 mm was counted in two medial (0.25 and 0.4 mm from the midline) and two lateral (0.7 and 1.0 mm from the midline) sections in the NCM, the CMHV, and the hippocampus. For the NCM, the counting frame was placed at the extreme caudal pole of the neostriatum, immediately adjacent to the ventricle separating the NCM from the hippocampus (Fig. 1). For the CMHV, the frame was positioned adjacent to the ventricle and to the lamina hyperstriatica (Fig. 1). For the hippocampus, the frame was placed at the point at which the curve is most pronounced (Fig. 1). For each brain region, mean values of the two sections were used to determine the number of immunoreactive cells for the medial or lateral parts, respectively. Distance from the midline was assessed using the atlas of Vates et al. (1996), Figure 3 of Mello and Ribeiro (1998), and an unpublished atlas of the zebra finch brain by A. M. Den Boer-Visser. Digital photographs of the brain areas were made with a Nikon (Tokyo, Japan) Coolpix 950 camera at 200× magnification. Image analysis was performed with a personal computer-based system using KS400 version 3.0 software (Zeiss, Oberkochen, Germany). A program was developed in KS400 to quantify the number of immunoreactive cells in the brain areas of interest. The immunoreactive cells and cell clusters, with an empirically determined optical density of 0.05 higher than the mean optical density of the background in the image, were selected automatically. Only those structures with a circular shape factor higher than 0.1 and an area >10.0 μm2 were considered. The circular shape factor was defined as 4π × area)/perimeter2. Cell clusters were divided by a mean cell size that was empirically determined per brain region. The experimenter checked the selection made by the image analysis system and deselected artifacts manually. Counting was done “blind” as to the experimental history of the subjects.
Figure 3.

Scatter plots of mean number of ZENK immunoreactive (IR) nuclei per square millimeter in medial and lateral NCM in relation to the percentage of song elements copied from the tutor song (song similarity) for groups of birds exposed to tutor song (TUT) (A, D), bird's own song (BOS) (B, E), or novel conspecific song (NOV) (C, F).
Statistical analyses. Differences between playback condition, brain region, and medial-lateral were examined using repeated-measures ANOVAs with factors brain area (NCM, CMHV, or hippocampus) and medial-lateral as repeated measures and group (TUT, BOS, or NOV) as between-subjects factor. When appropriate, repeated-measures tests were adjusted for sphericity using the Greenhouse-Geisser correction (Zar, 1999). In addition, repeated-measures ANOVAs were performed for the three brain areas separately, as well as one-way ANOVAs for the medial and lateral parts of the three brain areas. For one missing value for the hippocampus in the TUT group, the group mean was used. Data were analyzed using SPSS software version 11.0.1 (SPSS, Chicago, IL).
Results
Song similarity
The mean ± SEM percentage of elements that the experimental birds copied from the tutor song (song similarity) was 49.4 ± 4.4%, whereas the mean percentage of elements shared between the songs of unrelated males was 10.0 ± 2.2%. The mean number of elements that the experimental males copied from the tutor did not differ significantly between experimental groups, nor did the mean length of recorded stimulus songs or the number of different elements in these songs differ significantly.
Preference tests
Preference scores could not be calculated for all birds because some did not learn to press both keys (n = 4) or one key (n = 3) or because of technical problems (n = 1), thus leaving a total of 21 birds with preference scores (n = 7 in the TUT group; n = 8 in the BOS group; n = 6 in the NOV group). The mean preference for the tutor song was significantly greater than 50% (chance level): for all experimental birds, 64 ± 2.6%, p < 0.001; for birds in the TUT group, 66 ± 3.8%, p < 0.01; for birds in the BOS group, 61 ± 4.3%, p < 0.05; and for birds in the NOV group, 66 ± 5.7%, p < 0.05. There was no significant correlation between arcsine transformed preference scores and song similarity.
Zenk expression in different brain regions
Zenk-positive immunostaining was measured in the medial and lateral parts of the NCM, the CMHV, and the hippocampus. There was considerably less staining in the hippocampus compared with both the NCM and the CMHV. The mean number of Zenk-immunoresponsive nuclei per square millimeter in the medial and lateral parts of the NCM, the CMHV, and the hippocampus are shown in Figure 2.
Figure 2.
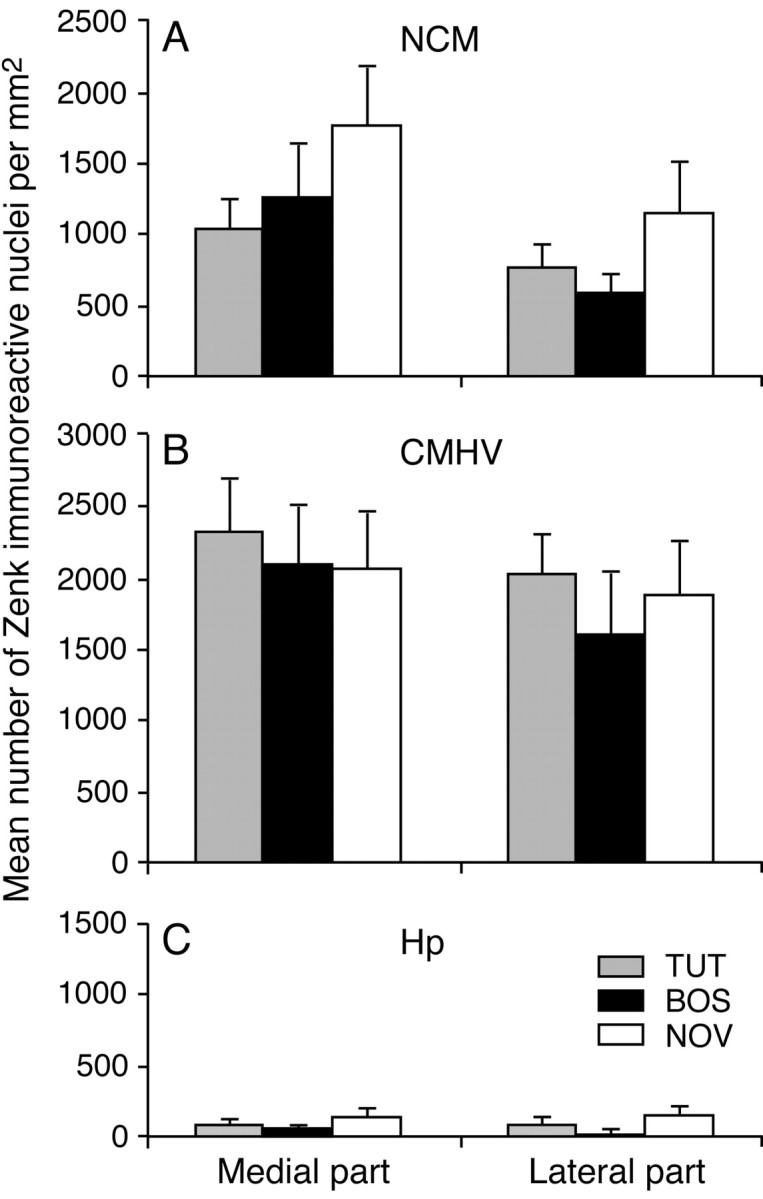
Mean ± SEM number of Zenk-positive nuclei per square millimeter in NCM (A), CMHV (B), and hippocampus (Hp) (C) for groups of male zebra finches exposed to tutor song (TUT), bird's own song (BOS), or novel conspecific song (NOV).
The overall repeated-measures ANOVA revealed significant effects of the factor brain area (F(1.4,35.2) = 65.7; p < 0.001) and of medial-lateral (F(1.0,26.0) = 18.4; p < 0.001), and there was a significant interaction between brain area and medial-lateral (F(1.4,36.5) = 4.4; p = 0.031). There was no significant effect of group, nor were there any other significant interactions. Subsequent ANOVAs for the three different brain regions yielded significant effects of medial-lateral in the NCM (F(1.0,26.0) = 9.0; p = 0.006) and CMHV (F(1.0,26.0) = 7.7; p = 0.010) but no significant interactions between this factor and the factor group. In the hippocampus, there were no significant effects of medial-lateral or group, nor was there an interaction between these two factors. Separate one-way ANOVAs for the medial and lateral parts of the NCM, CMHV, and hippocampus also revealed no significant effects of group in any of the areas.
Correlations between percentage of song elements copied and Zenk expression
The relationship between the percentage of song elements copied from the tutor song and the number of Zenk-positive neurons in the medial and lateral parts of NCM, CMHV, and hippocampus are shown in Table 2. Figure 3A-F shows scatter plots of the number of Zenk-immunoresponsive nuclei and similarity between songs of experimental males and their tutors in the lateral and medial parts of the NCM in groups TUT, BOS, and NOV.
Table 2.
Correlation coefficients of the relationship between the number of elements copied from the tutor song (TUT) and Zenk expression in the medial and lateral parts of the NCM, CMHV, and hippocampus (Hp) for groups of birds exposed to tutor song (TUT), bird's own song (BOS), or novel conspecific song (NOV)
|
|
TUT |
BOS |
NOV |
||||||
|---|---|---|---|---|---|---|---|---|---|
| Stimulus |
Pearson's R
|
p value |
Pearson's R
|
p value |
Pearson's R
|
p value |
|||
| Medial part of NCM | 0.361 | NS | −0.085 | NS | −0.657 | NS | |||
| Lateral part of NCM | 0.713 | <0.05 | −0.159 | NS | 0.099 | NS | |||
| Medial part of CMHV | 0.365 | NS | −0.098 | NS | −0.335 | NS | |||
| Lateral part of CMHV | 0.355 | NS | −0.011 | NS | −0.547 | NS | |||
| Medial part of Hp | 0.437 | NS | 0.003 | NS | −0.110 | NS | |||
| Lateral part of Hp |
0.379 |
NS |
0.000 |
NS |
−0.048 |
NS |
|||
p values <0.05 were considered not significant (NS).
There was a significant positive correlation between the number of Zenk-immunoreactive nuclei and the number of elements copied, only in the lateral part of the NCM in group TUT. There were no significant correlations between the number of Zenk-immunoreactive nuclei and number of elements copied in any of the other groups in any of the sampled regions. The negative correlation between number of Zenk-immunoreactive nuclei and number of copied elements in medial NCM approached significance (r = -0.660; p = 0.053).
Discussion
The results of males that were reexposed to their tutor song replicate the significant, positive correlation between the strength of song learning and neuronal activation in the NCM that was shown in two previous studies (Bolhuis et al., 2000, 2001). If these results were attributable to differences in attention (Marler and Doupe, 2000), then similar correlations would be expected in the groups of birds that were exposed to their own song or to novel song. The present study shows that a predisposed difference in attention directed to auditory stimuli between good and bad learners (Marler and Doupe, 2000) is not a likely explanation for the significant positive correlation among birds that were reexposed to the tutor song. These findings reinforce the suggestion that the NCM may be (part of) the neural representation of learned song. The present results are ambiguous with regard to the nature of the putative neural representation (tutor song or bird's own song) in the NCM.
There was no significant difference in the mean levels of Zenk expression between experimental groups in medial and lateral parts of the NCM and the CMHV (Fig. 2). Other (electrophysiological) studies of the NCM (Chew et al., 1996; Stripling et al., 1997) failed to find differences in neuronal responsiveness between BOS and novel song as well. To our knowledge, neuronal responsiveness to tutor song compared with BOS or novel song has not been investigated before, using either electrophysiology or IEG expression. Differential IEG expression in response to the various stimuli appears to be quite subtle and only becomes apparent when the strength of song learning is taken into account.
The nature of the neural representation in the NCM
When considering the nature of the neural representation in the NCM (tutor song or BOS), at least three possible hypothetical scenarios emerge.
(1) All males have learned the complete tutor song, but they have not incorporated all of the tutor song elements into their own songs (Marler and Peters, 1982: Nelson and Marler, 1994; Geberzahn and Hultsch, 2003). Neurons in the NCM are activated by the complete tutor song. Reexposure to the tutor song would then be expected to induce high levels of neuronal activation in the NCM of experimental males, independent of how many elements this male copied from the tutor song. Exposure to the BOS, however, would be expected to induce higher IEG levels in birds that copied many elements from the tutor song than in birds that copied only a few elements. This scenario is not likely because, in both the present study and two previous ones (Bolhuis et al., 2000, 2001), there was a significant positive correlation between neuronal activation in the NCM and number of copied elements in males that were reexposed to their tutor song.
(2) Neurons in the NCM are activated by the elements of the tutor song that are incorporated into the bird's own song. In this case, both reexposure to the tutor song and exposure to the BOS should induce levels of neuronal activation proportional to the strength of song learning. This hypothesis is not congruent with our present findings, because we did not find a significant positive correlation between neuronal activation and number of copied elements when we exposed birds to their own song.
(3) Neurons in the NCM are activated by the BOS. In this case, exposure to the BOS would be expected to lead to considerable neuronal activation in the NCM, regardless of the strength of song learning, whereas the neural response to the tutor song would be expected to be proportional to the number of elements copied by the birds from the tutor song. The latter proportionality prediction is consistent with the result shown in Figure 3D, because there was a significant positive correlation between neuronal activation and number of copied elements when birds were exposed to their tutor song, although there was no such correlation when birds were exposed to their own song (Fig. 3E). However, this hypothesis would also predict greater neuronal activation in the NCM in the BOS group compared with the other two groups. We did not find such an effect (Fig. 2).
The role of the CMHV in tutor song representation
For an analysis of the nature of the neural representation of song memory (tutor song or BOS), the results of experiments with female zebra finches are relevant, because they do not sing and thus do not have a BOS. Nevertheless, female zebra finches can learn to recognize songs to which they have been exposed, and they develop a preference for these songs (Riebel, 2000; Riebel et al., 2002). Several studies have shown that both the NCM and the CMHV are involved in processing conspecific songs in female songbirds (Chew et al., 1996; MacDougall-Shackleton et al., 1998; Duffy et al., 1999; Gentner et al., 2001; Bailey et al., 2002; Sockman et al., 2002; Bailey and Wade, 2003; Gentner and Margoliash, 2003; Grace et al., 2003; Maney et al., 2003; Phillmore et al., 2003), as well as in female budgerigars (Eda-Fujiwara et al., 2003). Preliminary results from our own laboratory indicate that, in female zebra finches, the CMHV may be part of the neural representation of learned tutor song (Terpstra et al., 2001). In the present study, male zebra finches did not show greater levels of IEG expression in response to tutor song compared with novel conspecific song in the NCM or the CMHV. In addition, there was no significant correlation between the strength of song learning and IEG expression in the CMHV, as in our previous studies (Bolhuis et al., 2000, 2001). It is possible that, in juvenile males, the tutor song is processed in the CMHV but that the tutor song representation is transferred to another part of the brain by the time the bird starts to sing itself. Similar results were found in analyses of the neural correlates of motor memory consolidation in humans (Shadmehr and Holcomb, 1997).
Memory versus attention
In the present study, there was a significant positive correlation between the strength of song learning and IEG expression in the lateral NCM only in the group that was exposed to the tutor song. This finding suggests that the effect is not attributable to birds that learned more from their tutor paying more attention to any auditory stimulus (Marler and Doupe, 2000). If good learners would be predisposed to attend more to any song stimulus, a positive correlation would be expected between the strength of learning and Zenk expression in the NCM also in groups that were exposed to BOS or to novel song, which was not the case. Previously, we demonstrated (Bolhuis et al., 2001) that the positive correlation between the strength of song learning and IEG expression in the NCM as shown by Bolhuis et al. (2000) was not an artifact of isolation rearing.
Song preference for and number of elements copied from the tutor song
There was no significant correlation between preference for the tutor song and the number of elements copied from tutor song. This supports the suggestion that song production learning and song perception learning are two separate processes in zebra finch males (Riebel et al., 2002).
Differential neural activation within the NCM
The positive correlation between the number of elements copied and IEG expression after exposure to the tutor song was significant in the lateral part of the NCM and not in the medial part. According to Stripling et al. (2001), in the study by Bolhuis et al. (2000), IEG expression was measured “far more laterally than in any other study of the ZENK response in zebra finches” (p. 178). As shown in Table 1, in one study (Ribeiro et al., 1998), ZENK expression in the NCM was measured further lateral than in the study by Bolhuis et al. (2000). Nevertheless, it is true that, in the majority of studies, IEG expression is sampled closer to the midline than in our previous studies. It is important to determine whether learning-related IEG expression is localized within the NCM. To this end, in the present study, we compared IEG expression in two locations within the NCM, medial (0.25-0.4 mm from the midline) and lateral (0.7-1.0 mm from the midline). In our two previous studies, we sampled NCM at comparable, lateral levels (Table 1). It is remarkable that the overall level of Zenk expression is lower in the lateral part of the NCM compared with that in the medial part, whereas the correlation between neuronal activation and percentage of copied elements is significant only in the lateral part of the NCM, although the difference between these two correlations is not very large. Nevertheless, several studies (Gentner et al., 2001; Eda-Fujiwara et al., 2003; Maney et al., 2003) have reported differences in IEG expression between dorsal and ventral parts of the NCM after exposure to conspecific song, although Ribeiro et al. (1998) showed that exposure to different auditory stimuli resulted in different activation patterns within the NCM. In an electrophysiological study, Chew et al. (1995, their Fig. 1) found that habituation to familiar stimuli only occurred in the caudal and not in the rostral part of the NCM. Together, these results suggest that the NCM is subdivided into regions that process various components of sounds (Mello, 2002, 2004). Thus, it is important to specify accurately which subregions of the NCM are being sampled.
Footnotes
We thank Gabriel Horn for valuable discussion, Maarten Terlou for writing image analysis software, Katharina Riebel and Isabel Smallegange for performing some of the preference tests,GabriëlBeckers and Thijs Zandbergen for technical help and for discussion, Han de Vries for statistical advice, Martin Brittijn for editing the figures, two anonymous referees for their constructive comments, Carel ten Cate for comments on a previous draft of the manuscript, and Carel ten Cate, Robert Lachlan, and Hans Slabbekoorn for comparing sonograms.
Correspondence should be addressed to Johan J. Bolhuis, Behavioural Biology, Utrecht University, Padualaan 14, P.O. Box 80086, 3508 TB Utrecht, The Netherlands. E-mail: j.j.bolhuis@bio.uu.nl.
Copyright © 2004 Society for Neuroscience 0270-6474/04/244971-07$15.00/0
References
- Bailey DJ, Wade J (2003) Differential expression of the immediate early genes FOS and ZENK following auditory stimulation in the juvenile male and female zebra finch. Mol Brain Res 116: 147-154. [DOI] [PubMed] [Google Scholar]
- Bailey DJ, Rosebush JC, Wade J (2002) The hippocampus and caudomedial neostriatum show selective responsiveness to conspecific song in the female zebra finch. J Neurobiol 52: 43-51. [DOI] [PubMed] [Google Scholar]
- Bolhuis JJ, Eda-Fujiwara H (2003) Bird brains and songs: neural mechanisms of birdsong perception and memory. Anim Biol 53: 129-145. [Google Scholar]
- Bolhuis JJ, Macphail EM (2001) A critique of the neuroecology of learning and memory. Trends Cogn Sci 5: 426-433. [DOI] [PubMed] [Google Scholar]
- Bolhuis JJ, Zijlstra GGO, den Boer-Visser AM, Van der Zee EA (2000) Localized neuronal activation in the zebra finch brain is related to the strength of song learning. Proc Natl Acad Sci USA 97: 2282-2285. [DOI] [PMC free article] [PubMed] [Google Scholar]
- Bolhuis JJ, Hetebrij E, den Boer-Visser AM, de Groot JH, Zijlstra GGO (2001) Localized immediate early gene expression related to the strength of song learning in socially reared zebra finches. Eur J Neurosci 13: 2165-2170. [DOI] [PubMed] [Google Scholar]
- Brainard MS, Doupe AJ (2000) Auditory feedback in learning and maintenance of vocal behaviour. Nat Rev Neurosci 1: 31-40. [DOI] [PubMed] [Google Scholar]
- Chew S, Mello C, Nottebohm F, Jarvis E, Vicario D (1995) Decrements in auditory responses to a repeated conspecific song are long-lasting and require two periods of protein-synthesis in the songbird forebrain. Proc Natl Acad Sci USA 92: 3406-3410. [DOI] [PMC free article] [PubMed] [Google Scholar]
- Chew S, Vicario D, Nottebohm F (1996) A large-capacity memory system that recognizes the calls and songs of individual birds. Proc Natl Acad Sci USA 93: 1950-1955. [DOI] [PMC free article] [PubMed] [Google Scholar]
- Clayton DF (2000) The neural basis of avian song learning and perception. In: Brain, perception, memory: advances in cognitive neuroscience (Bolhuis JJ, ed), pp 113-125. Oxford: Oxford UP.
- Davis S, Bozon B, Laroche S (2003) How necessary is the activation of the immediate early gene zif 268 in synaptic plasticity and learning? Behav Brain Res 142: 17-30. [DOI] [PubMed] [Google Scholar]
- DeVoogd T (1994) The neural basis for the acquisition and production of bird song. In: Causal mechanisms of behavioural development (Hogan JA, Bolhuis JJ, eds), pp 49-81. Cambridge, UK: Cambridge UP.
- Duffy DL, Bentley GE, Ball GF (1999) Does sex or photoperiodic condition influence ZENK induction in response to song in Eur starlings? Brain Res 844: 78-82. [DOI] [PubMed] [Google Scholar]
- Eda-Fujiwara H, Satoh R, Bolhuis JJ, Kimura T (2003) Neuronal activation in female budgerigars is localized and related to male song complexity. Eur J Neurosci 17: 149-154. [DOI] [PubMed] [Google Scholar]
- Funabiki Y, Konishi M (2003) Long memory in song learning by zebra finches. J Neurosci 23: 6928-6935. [DOI] [PMC free article] [PubMed] [Google Scholar]
- Geberzahn N, Hultsch H (2003) Long-time storage of song types in birds: evidence from interactive playbacks. Proc R Soc Lond B Biol Sci 270: 1085-1090. [DOI] [PMC free article] [PubMed] [Google Scholar]
- Gentner TQ, Margoliash D (2003) Neuronal populations and single cells representing learned auditory objects. Nature 424: 669-674. [DOI] [PMC free article] [PubMed] [Google Scholar]
- Gentner TQ, Hulse SH, Duffy D, Ball GF (2001) Response biases in auditory forebrain regions of female songbirds following exposure to sexually relevant variation in male song. J Neurobiol 46: 48-58. [DOI] [PubMed] [Google Scholar]
- Grace JA, Amin N, Singh NC, Theunissen FE (2003) Selectivity for conspecific song in the zebra finch auditory forebrain. J Neurophysiol 89: 472-487. [DOI] [PubMed] [Google Scholar]
- Houx B, ten Cate C (1999) Song learning from playback in zebra finches: is there an effect of operant contingency? Anim Behav 57: 837-845. [DOI] [PubMed] [Google Scholar]
- Jarvis E, Nottebohm F (1997) Motor-driven gene expression. Proc Natl Acad Sci USA 94: 4097-4102. [DOI] [PMC free article] [PubMed] [Google Scholar]
- Jarvis ED, Mello CV, Nottebohm F (1995) Associative learning and stimulus novelty influence the song-induced expression of an immediate-early gene in the canary forebrain. Learn Mem 2: 62-80. [DOI] [PubMed] [Google Scholar]
- Jin H, Clayton DF (1997) Localized changes in IEG regulation during sensory and motor learning in zebra finches. Neuron 19: 1049-1059. [DOI] [PubMed] [Google Scholar]
- Kimpo RR, Doupe AJ (1997) Fos is induced by singing in distinct neuronal populations in a motor network. Neuron 18: 315-325. [DOI] [PubMed] [Google Scholar]
- Konishi M (1985) Birdsong: from Behavior to neuron. Annu Rev Neurosci 14: 125-170. [DOI] [PubMed] [Google Scholar]
- MacDougall-Shackleton SA, Hulse SH, Ball GF (1998) Neural bases of song preferences in female zebra finches (Taeniopygia guttata). NeuroReport 9: 3047-3052. [DOI] [PubMed] [Google Scholar]
- Maney D, MacDougall-Shackleton E, MacDougall-Shackleton S, Ball G, Hahn T (2003) Immediate early gene response to hearing song correlates with receptive behavior and depends on dialect in a female songbird. J Comp Physiol [A] 189: 667-674. [DOI] [PubMed] [Google Scholar]
- Marler P (1991) Song-learning behavior—the interface with neuroethology. Trends Neurosci 14: 199-206. [DOI] [PubMed] [Google Scholar]
- Marler P, Doupe AJ (2000) Singing in the brain. Proc Natl Acad Sci USA 97: 2965-2967. [DOI] [PMC free article] [PubMed] [Google Scholar]
- Marler P, Peters S (1982) Developmental overproduction and selective attrition—new processes in the epigenesis of birdsong. Dev Psychobiol 15: 369-378. [DOI] [PubMed] [Google Scholar]
- Mello CV (2002) Mapping vocal communication pathways in birds with inducible gene expression. J Comp Physiol [A] 188: 943-959. [DOI] [PubMed] [Google Scholar]
- Mello CV (2004) Gene regulation by song in the auditory telencephalon of songbirds. Front Biosci 9: 63-73. [DOI] [PubMed] [Google Scholar]
- Mello CV, Clayton DF (1994) Song-induced ZENK gene expression in auditory pathways of songbird brain and its relation to the song control system. J Neurosci 14: 6652-6666. [DOI] [PMC free article] [PubMed] [Google Scholar]
- Mello CV, Ribeiro S (1998) ZENK protein regulation by song in the brain of songbirds. J Comp Neurol 393: 426-438. [DOI] [PubMed] [Google Scholar]
- Mello CV, Vicario DS, Clayton DF (1992) Song presentation induces gene expression in the songbird forebrain. Proc Natl Acad Sci USA 89: 6818-6822. [DOI] [PMC free article] [PubMed] [Google Scholar]
- Mello CV, Nottebohm F, Clayton DF (1995) Repeated exposure to one song leads to a rapid and persistent decline in an immediate early gene's response to that song in zebra finch telencephalon. J Neurosci 15: 6919-6925. [DOI] [PMC free article] [PubMed] [Google Scholar]
- Nelson DA, Marler P (1994) Selection-based learning in bird song development. Proc Natl Acad Sci USA 91: 10498-10501. [DOI] [PMC free article] [PubMed] [Google Scholar]
- Nottebohm F (1991) Reassessing the mechanisms and origins of vocal learning in birds. Trends Neurosci 14: 206-211. [DOI] [PubMed] [Google Scholar]
- Nottebohm F (2000) The anatomy and timing of vocal learning in birds. In: The design of animal communication (Hauser M, Konishi M, eds), pp 63-110. Cambridge, MA: MIT.
- Nottebohm F, Alvarez-Buylla A, Cynx J, Kirn J, Ling CY, Nottebohm M, Suter R, Tolles A, Williams H (1990) Song learning in birds: the relation between perception and production. Philos Trans R Soc Lond B Biol Sci 329: 115-124. [DOI] [PubMed] [Google Scholar]
- Park KHJ, Clayton DF (2002) Influence of restraint and acute isolation on the selectivity of the adult zebra finch zenk gene response to acoustic stimuli. Behav Brain Res 136: 185-191. [DOI] [PubMed] [Google Scholar]
- Phillmore LS, Bloomfield LL, Weisman RG (2003) Effects of songs and calls on ZENK expression in the auditory telencephalon of field- and isolate-reared black capped chickadees. Behav Brain Res 147: 125-134. [DOI] [PubMed] [Google Scholar]
- Reiner A, Perkel DJ, Bruce L, Butler AB, Csillag A, Kuenzel W, Medina L, Paxinos G, Shimizu T, Striedter GF, Wild M, Ball GF, Durand S, Gün-türkün O, Lee DW, Mello CV, Powers A, White SA, Hough G, Kubikova L, et al. (2004) Revised nomenclature for avian telencephalon and some related brainstem nuclei. J Comp Neurol 473: 377-414. [DOI] [PMC free article] [PubMed] [Google Scholar]
- Ribeiro S, Cecchi GA, Magnasco MO, Mello CV (1998) Toward a song code: evidence for a syllabic representation in the canary brain. Neuron 21: 359-371. [DOI] [PubMed] [Google Scholar]
- Riebel K (2000) Early exposure leads to repeatable preferences for male song in female zebra finches. Proc R Soc Lond B Biol Sci 267: 2553-2558. [DOI] [PMC free article] [PubMed] [Google Scholar]
- Riebel K, Smallegange IM, Terpstra NJ, Bolhuis JJ (2002) Sexual equality in zebra finch song preference: evidence for a dissociation between song recognition and production learning. Proc R Soc Lond B Biol Sci 269: 729-733. [DOI] [PMC free article] [PubMed] [Google Scholar]
- Sagar SM, Sharp PR, Curran T (1988) Expression of c-fos protein in brain: metabolic mapping at the cellular level. Science 240: 1328-1331. [DOI] [PubMed] [Google Scholar]
- Shadmehr R, Holcomb HH (1997) Neural correlates of motor memory consolidation. Science 277: 821-825. [DOI] [PubMed] [Google Scholar]
- Sockman KW, Gentner TQ, Ball GF (2002) Recent experience modulates forebrain gene-expression in response to mate-choice cues in Eur starlings. Proc R Soc Lond B Biol Sci 269: 2479-2485. [DOI] [PMC free article] [PubMed] [Google Scholar]
- Stripling R, Volman S, Clayton D (1997) Response modulation in the zebra finch neostriatum: relationship to nuclear gene regulation. J Neurosci 17: 3883-3893. [DOI] [PMC free article] [PubMed] [Google Scholar]
- Stripling R, Kruse AA, Clayton DF (2001) Development of song responses in the zebra finch caudomedial neostriatum: role of genomic and electrophysiological activities. J Neurobiol 48: 163-180. [DOI] [PubMed] [Google Scholar]
- Sturdy CB, Phillmore LS, Weisman RG (1999a) Note types, harmonic structure, and note order in the songs of zebra finches (Taeniopygia guttata). J Comp Psychol 113: 194-203. [Google Scholar]
- Sturdy CB, Phillmore LS, Price JL, Weisman RG (1999b) Song-note discriminations in zebra finches (Taeniopygia guttata): categories and pseudocategories. J Comp Psychol 113: 204-212. [Google Scholar]
- Terpstra NJ, Bolhuis JJ, Van der Burg JJM, den Boer-Visser AM (2001) Song learning-related immediate early gene expression in the forebrain of zebra finch females. Behav Pharmacol 12: S101. [Google Scholar]
- Tischmeyer W, Grimm R (1999) Activation of immediate early genes and memory formation. Cell Mol Life Sci 55: 564-574. [DOI] [PMC free article] [PubMed] [Google Scholar]
- Vates GE, Broome BM, Mello CV, Nottebohm F (1996) Auditory pathways of caudal telencephalon and their relation to the song system of adult male zebra finches (Taeniopygia guttata). J Comp Neurol 366: 613-642. [DOI] [PubMed] [Google Scholar]
- Whitney O, Soderstrom K, Johnson F (2003) CB1 cannabinoid receptor activation inhibits a neural correlate of song recognition in an auditory/perceptual region of the zebra finch telencephalon. J Neurobiol 56: 266-274. [DOI] [PMC free article] [PubMed] [Google Scholar]
- Zann R (1996) The zebra finch: a synthesis of field and laboratory studies. Oxford: Oxford UP.
- Zar JH (1999) Biostatistical analysis. Upper Saddle River, NJ: Prentice Hall.