

Abstract
Neurons in the inferior colliculus (IC) change their firing rates with sound pressure level. Some neurons maintain monotonic increases in firing rate over a wide range of sound intensities, whereas other neurons are monotonic over limited intensity ranges. We examined the conditions necessary for monotonicity in this nucleus in vitro in rat brain slices and in vivo in the unanesthetized rabbit. Our in vitro recordings indicate that concurrent activation of GABAA synapses with excitatory inputs facilitates monotonic increases in firing rate with increases in stimulus strength. In the absence of synaptic inhibition, excitatory input to IC neurons causes large depolarizations that result in firing block and nonmonotonicity. In vivo, although GABAA synapses decrease the firing rate in all IC neurons, they can have opposing effects on rate-level functions. GABAergic inputs activated by all sound intensities maintain monotonicity by keeping the postsynaptic potential below the level at which depolarization block occurs. When these inputs are blocked, firing block can occur and rate-level functions become nonmonotonic. High-threshold GABAergic inputs, in contrast, cause nonmonotonic responses by decreasing the firing rate at high intensities. Our results suggest that a dynamic regulation of the postsynaptic membrane potential by synaptic inhibition is necessary to allow neurons to respond monotonically to a wide range of sound intensities.
Keywords: inferior colliculus, rate coding, depolarization block, synaptic inhibition, GABA, sensory coding, synaptic depression
Introduction
Single neurons in sensory systems often reflect changes in a stimulus parameter by changing their firing rates. Neurons in the visual cortex increase their firing rates in response to stimuli of increasing contrast (Albrecht and Hamilton, 1982), and changes in firing rates of hippocampal neurons code the spatial location of an animal (Wilson and McNaughton, 1993) and the speed of an animal's movement (Huxter et al., 2003).
In the auditory system, neurons exhibit different types of firing rate functions with changes in sound intensity. In the inferior colliculus (IC), an auditory brainstem nucleus, some neurons maintain a monotonic increase in discharge rate over a large intensity range, whereas other neurons show increases in discharge rate at low intensities but decrease their firing at high intensities, producing nonmonotonic rate-level functions (Irvine and Gago, 1990; Rees, 1992). Monotonic rate-level functions are thought to arise from a continuous increase in the excitatory input level, whereas nonmonotonic responses could be attributable to the activation of high-threshold inhibitory inputs, which would decrease discharge rates at high intensities. This role of inhibition in sound intensity coding was inferred from the observation that, in some IC neurons, nonmonotonic functions become monotonic when GABAA receptors are blocked (Faingold et al., 1991; Pollak and Park, 1993).
Neuronal firing rates do not solely reflect changes in input. Passive changes in membrane potential during synaptic activity as well as intrinsic neuronal responsiveness can alter firing rate. Characteristics of the postsynaptic cell, such as the kinetics of voltage-gated channels activated during synaptic activity or membrane saturation (Reyes, 2001), have a significant regulatory influence on firing rates by causing a nonlinear summation of inputs (Schwindt and Crill, 1998; Wei et al., 2001). Thus, the effect of GABAA antagonists on rate-level functions in the IC (Faingold et al., 1991; Pollak and Park, 1993) may occur through a secondary influence on the postsynaptic membrane potential. There have been no direct measurements of changes in membrane potential or synaptic activity during changes in sound intensity, and the interaction of excitatory and inhibitory inputs with postsynaptic membrane properties is unknown.
In this study, we examined the separate contributions of synaptic inputs and postsynaptic responsiveness to the generation of a single neuron code of sound intensity. GABAergic inputs were selectively blocked, and neuronal responses were recorded in brain slices of the rat IC to synaptic stimulation and in vivo in the unanesthetized rabbit to changes in sound intensity. In the absence of inhibition, excitatory input increases the firing rate of all IC neurons. In some neurons, however, excitation causes large depolarizations that result in firing block and nonmonotonic responses to sound intensity. GABAergic inputs to these neurons are critical in maintaining monotonicity over a wide intensity range. However, other neurons receive high-threshold GABAergic inputs that cause nonmonotonicity by decreasing firing rates at high sound intensities. Our results imply that a dynamic balance between excitatory and inhibitory input strength and postsynaptic responsiveness is necessary to maintain increases in firing rate over a wide intensity range.
Materials and Methods
Recordings in rat brain slices. Long-Evans rats, 11-17 d of age, were anesthetized with a mixture of ketamine/xylazine and then decapitated. The making of brain slices, their storage, and recordings from neurons were all performed in oxygenated saline (95%O2/5%CO2) at 35°C. A block containing the IC was removed from the brain with two transverse cuts, and 300 μm thick brain slices were made in a plane parallel to the laminas of the central nucleus of the IC. Slices were allowed to recover for 1 hr before being used for recordings. For recording, slices were transferred to a chamber where a Peltier device was used to regulate the temperature (model PSMI; Medical Systems, Greenvale, NY). The chamber was affixed to the stage of an upright microscope (Zeiss Axioskop; Zeiss, Thornwood, NY) fitted with a water immersion objective (40×; numerical aperture, 0.75) and differential interference optics. The slice was continuously perfused with saline containing (in mm): 120 NaCl, 5 KCl, 2.4 CaCl2, 1.3 MgSO4, 1 KH2PO4, 10 NaHCO3, 25 glucose, pH 7.3.
Synaptic activity was evoked by stimulating the lateral lemniscus with an extracellular bipolar tungsten electrode placed ventral to the dorsal nucleus of the lateral lemniscus and to the IC. The placement of the bipolar electrode was 2-4 mm distant from the central nucleus of the IC to prevent direct stimulation of neuronal dendrites or axons by spreading current. Action potentials evoked by lemniscal stimulation did not appear to be contaminated by direct activation because they were completely abolished by glutamate receptor antagonists (S. Sivaramakrishnan and D. L. Oliver, unpublished observations). Lemniscal shock durations were between 0.2 and 0.5 msec. Shock strengths ranged from 0.1 to 1.0 mA and were increased until no additional changes in responses occurred. Because the proximity of the stimulating electrode to the various axons in the lemniscal nerve bundle that innervate a particular neuron is arbitrary, the absolute value of the shock strength is a meaningless measure of the absolute number of axons recruited.
Recordings were made with patch pipettes of 5-7MΩ resistance made from borosilicate glass (1.5 mm outer diameter; Kimax; Kimble Glass, Vineland, NJ). Pipettes were filled with a solution containing (in mm): 120 K Gluconate, 11 KCl, 5 NaCl, 2 mm EGTA, 0.1 CaCl2, 5 Mg-ATP, 0.3 Na-GTP, 10 HEPES, pH 7.3. Whole-cell patch-clamp techniques were used in current-clamp and voltage-clamp modes to identify cell types by their firing patterns to current injection and to record synaptic potentials and currents. Bicuculline methochloride (Sigma-Aldrich, St. Louis, MO), an antagonist of GABAA receptors, was dissolved in external saline (10-50 μm final concentration), and the bath was continuously superfused with it at a rate of 1-1.5 ml/min (Sivaramakrishnan and Laurent, 1995). The superfusion and clearance rates were balanced so that no change in bath level occurred. Drug concentrations were allowed to equilibrate for ∼15 min, and stability was determined by making several recordings to the same stimulus.
Because bicuculline can affect resting potentials and apamin-sensitive calcium-activated potassium channels (Khawaled et al., 1999), which affect firing patterns in some IC neurons (Sivaramakrishnan and Oliver, 2001), we tested the effect of bicuculline on firing patterns during the injection of current pulses into the soma, which bypasses synaptically evoked responses. At the concentrations used, bicuculline did not affect resting potentials, interspike intervals, or firing rates (n = 15), indicating no direct effect on the postsynaptic membrane or on voltage-gated channels in IC neurons.
An EPC-8 amplifier (Heka Elektronik, Lambrecht/Pfalz, Germany) was used for both current and voltage-clamp recordings, and PClamp software (Axon Instruments, Foster City, CA) was used for data collection and analyses. Series resistances were generally 12-18 MΩ and were compensated by 75-80%. Recordings with higher series resistances or lower compensation were not included in the analyses. Data were filtered at 5 kHz during acquisition. During a supra-threshold postsynaptic response to lemniscal stimulation, the maximum voltage at the base of the evoked spikes was used as a measure of the peak depolarization during synaptic activity. Firing rate (spikes per second) was determined by counting the total number of spikes during the postsynaptic potential (PSP) and dividing that number by the PSP duration measured from its onset to its return to baseline. Spikes were not counted if their peak heights were <1% of the maximum spike height.
Recordings in the unanesthetized rabbit. Single-unit extracellular recordings were made from adult, female, Dutch-belted rabbits (1.5-2.5 kg) with healthy external ears. All animal procedures were approved by the Committee for Animal Care and Use at the University of Connecticut Health Center and conformed to the National Institutes of Health guidelines for laboratory animal care and use. Surgical and experimental procedures have been fully described previously (Kuwada et al., 1987; D'Angelo et al., 2003) and will be briefly recounted here.
Surgery was performed under anesthesia (ketamine, 44 mg/kg; xylazine, 6 mg/kg, i.m.). A brass rod was anchored to the skull using screws and dental acrylic. Approximately 1 week later, the animal was again anesthetized to make custom-fitted ear molds. This was done by filling the external meatus and the concha with dental impression material (Reprosil; Dentsply International, Milford, DE). In a separate procedure, a craniotomy (∼8 × 4 mm) was performed under anesthesia to allow a dorsal approach to the inferior colliculus. After each experimental session, the craniotomy was covered with sterilized medical elastopolymer (Sammons-Preston Rolyan, Germantown, IL).
Recordings were conducted in a sound-insulated chamber. The unanesthetized rabbit was placed in a spandex sleeve, seated in a padded cradle, and its head secured by clamping to the head bar. The elastopolymer was removed, and the topical anesthetic Marcaine was applied to the exposed dura so that electrode penetration was painless. Recording sessions were limited to ∼2 hr for practical and ethical reasons and could be terminated if the rabbit showed discomfort. Each rabbit participated in daily recording sessions over a period of 3-6 months.
Acoustic stimulation and recording procedures. Stimuli were generated using a digital stimulation system (Rhode, 1976) and delivered to the two ears through Beyer DT-48 earphones coupled to the ear molds to form a sealed system. The ear molds were fitted with a sound-delivery tube that extended to within ∼2.5 cm of the tympanum. The system was calibrated for amplitude and phase from 60 to 40 kHz in 20 Hz steps by means of a probe tube that extended ∼1 mm from the end of the sound-delivery tube.
Recordings were made with glass-coated platinum-tungsten microelectrodes. After isolating a single neuron, its best frequency was determined by delivering tone bursts (75 msec) to the contralateral ear from 0.25 to 32 kHz in half-octave steps at 20-30 dB above the threshold of the neuron. Rate-level functions were measured at the best frequency of each neuron, usually for intensities from 0 to 85 dB sound pressure level (SPL) in 5-10 dB steps using tone bursts (75-100 msec every 400-500 msec, repeated at least 10 times) delivered to the contralateral ear. Rate-level functions were interpolated to 5 dB steps. Recordings were stored using the Cool Edit program (Syntrillium Software).
Experiments involving iontophoresis used a glass-coated tungsten microelectrode (∼1 μm tip diameter; ∼10 μm exposed) (Merrill and Ainsworth, 1972) attached to a five-barrel glass pipette with epoxy (i.e., a piggyback configuration) (Havey and Caspary, 1980). Individual barrels were back-filled with GABAA antagonists bicuculline methochloride (10 mm) or 2-(3-carboxypropyl)-3-amino-6-(4-methoxyphenyl) pyradizinium bromide (SR-95531, or gabazine) (25 mm), GABA (500 mm), and saline (165 mm). Typical impedance values for the filled barrels ranged from 20 to 60 MΩ. The current source (model 6400; Dagan, Minneapolis, MN) provided independent control of six iontophoreses channels and a balancing channel. Small retaining currents (approximately -5 nA) were set for all barrels. Iontophoresis of saline as a control at current levels as high as 100 nA did not cause a noticeable change in neural response.
Our protocol was to continuously assess the rate-level function of the neuron during iontophoresis of the drugs, and the recordings shown are when we thought a maximum or near-maximum effect had occurred. In many cases, drug effects were observed within seconds after the iontophoretic current was turned on. Across our sample using drug application (n = 17), the shortest assessment was at 2.3 min and the longest at 16.8 min, after iontophoresis began. The mean and median times were 8.7 and 6 min, respectively. Neurons that did not increase their firing rates by at least 50% were excluded.
Classification of rate-level functions. Rate-level functions were analyzed over the first 80 msec from stimulus onset to take into account the first spike latency. Based on their shape, neurons were placed into three broad categories: nonmonotonic, monotonic, and saturating. Nonmonotonic functions increased their firing rate up to a particular intensity, beyond which the rate decreased. If this decrease was ≥20%, the response was classified as non-monotonic. Monotonic functions increased their firing rate with sound intensity. If the rate did not increase at the highest intensity tested or decreased by <20%, it was still classified as monotonic. Saturated functions displayed a monotonic increase in spike rate up to a particular intensity, beyond which spike rate remained constant for at least 15 dB, or decreased <20%. These criteria are similar to previous studies (Bock et al., 1972; Kuwada et al., 1984; Semple and Kitzes, 1985; Ehret and Merzenich, 1988; Rees and Palmer, 1988; Irvine and Gago, 1990; Aitkin, 1991; Pollak and Park, 1993).
Results
Recordings from IC neurons in vitro
We examined the ability of IC neurons in brain slices to maintain increases in firing rate both intrinsically as well as during synaptic activity. Current steps injected into the cell body were used to examine intrinsically evoked firing, and synaptic activity was evoked by electrical stimulation of the lateral lemniscus. To examine the interaction between excitatory and inhibitory inputs in generating changes in firing rate, responses were measured in the presence of the GABAA receptor antagonist bicuculline. Because changes in sound-pressure level result in changes in the number of inputs recruited and the frequency of their discharge (Kiang et al., 1965), we simulated these effects in vitro by combining synaptic recruitment with pulse trains of different frequencies.
Responses to current injection
Previous studies in brain slices of the IC have shown that neurons capable of producing multiple spikes during a current pulse increase their firing rates when the strength of the current injected is increased (Peruzzi et al., 2000; Sivaramakrishnan and Oliver, 2001). To examine the limits of firing rate increase, we used current strengths that produced larger depolarizations than in these previous studies. When depolarizing current steps of increasing strength were injected into the soma of IC neurons, firing rate increased, reached a peak but then decreased, so that at high-current strengths (∼0.5 nA), firing was reduced to one or two spikes at the beginning of the current step (Fig. 1a,b). The reduction in spike frequency at high current strengths appeared to be attributable to depolarization block and was observed in all five categories of multiple-firing neurons (Sivaramakrishnan and Oliver, 2001): sustained-regular, pause-build, rebound-transient, rebound-regular, and rebound-adapting cells (n = 98). Rate-depolarization functions were therefore nonmonotonic (Fig. 1c). Maximal firing rates occurred at a depolarization of 27 ± 6 mV (n = 28), corresponding to an average membrane potential of -25 mV (resting potentials of IC neurons, with our internal solution, were between -50 and -55 mV).
Figure 1.
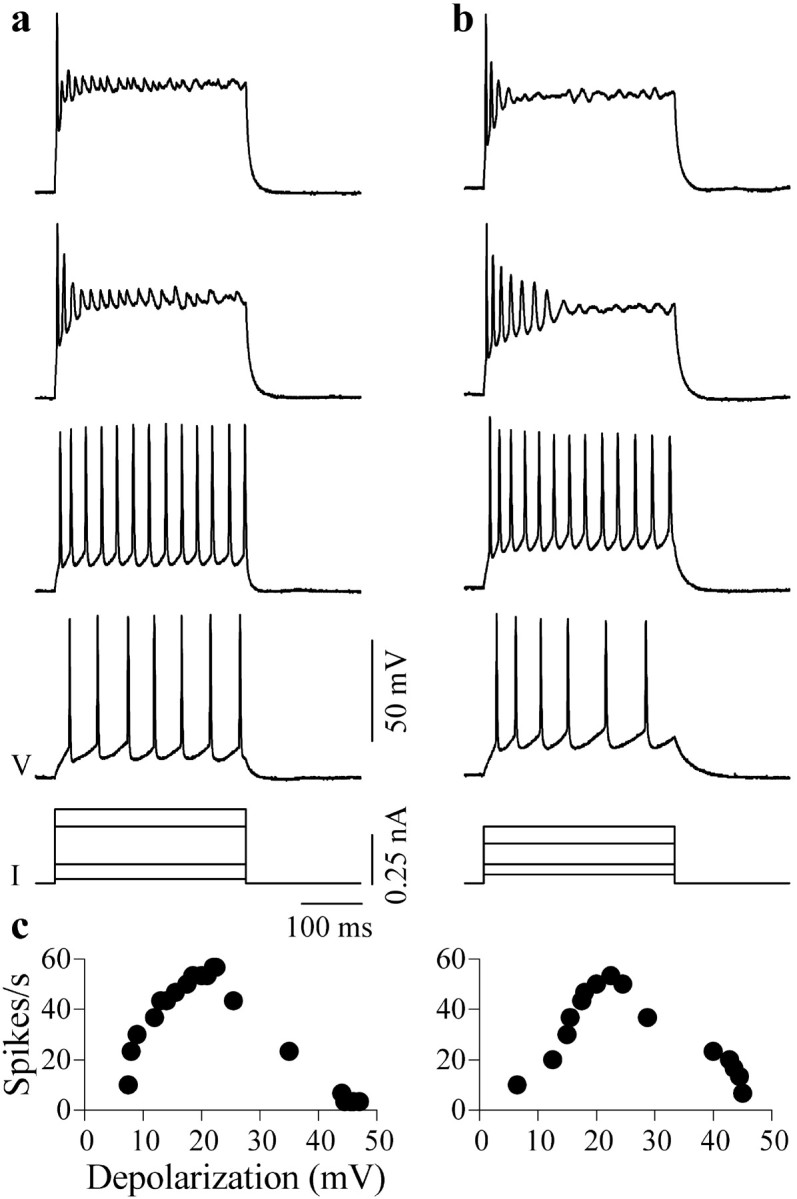
Intrinsic depolarization block in IC neurons in the rat brain slice. a, b, Responses under current clamp of two neurons, a sustained-regular cell (P13) (a) and rebound-adapting cell (P13) (b), to the injection of depolarizing current pulses into their soma in normal saline. Long current pulses (300-600 msec) were used, because short pulses (0.2-0.5 msec) injected into IC neurons evoke only single spikes at all current strengths (Sivaramakrishnan and Oliver, 2001). Bottom, I, Current pulses of four strengths; V, corresponding voltage recordings. Depolarization increases from bottom to top. c, Spike rate as a function of the depolarization for each cell. Depolarization was measured as the difference between the resting voltage and the average value of the minimum and maximum voltage at the base of the spikes.
Responses to synaptic recruitment
Firing patterns during synaptic activity evoked by single lemniscal shocks also showed evidence of depolarization block (Fig. 2) (n = 88). When increasing numbers of synaptic inputs were recruited by increasing the strength of the shock, the firing rate initially increased, reached a peak, and then decreased (Fig. 2a). The decrease in firing at high shock strengths was attributable to aborted spikes that occurred during the peak of the synaptic potential (Fig. 2ai, top trace). Rate-depolarization functions were obtained by plotting spike rates as a function of the maximum amplitude of the PSP (Fig. 2aii). In the majority of IC neurons (76 of 88), peak depolarizations during maximally evoked PSPs were usually >30 mV, and the membrane potential (difference between the resting potential and the peak depolarization during the PSP) at which maximum firing occurred and after which firing block was observed was similar across neurons (Fig. 2aii; top panel, -25 mV; middle panel, -26 mV; bottom panel, -24 mV) (mean, -23 ± 3 mV; 36 neurons measured). This membrane potential at which depolarization block began to occur was similar to that observed with current injection into the soma (approximately -25 mV) (Fig. 1).
Figure 2.

Depolarization block during synaptic recruitment. ai, bi, Responses under current clamp of a sustained-regular (P15) (ai) and a rebound-adapting neuron (P12) (bi) to lemniscal shocks of increasing strength in normal saline. Each trace is the response to a single shock (arrow; shock duration, 0.2-0.5 msec). Shock strength increases from bottom to top; stimulus artifacts have been truncated for clarity. aii, bii, Discharge rates plotted as a function of the peak depolarization during the PSP for three sustained regular neurons (aii) and three rebound-adapting neurons (bii). Firing rates were determined by dividing the number of spikes evoked during the PSP by the duration of the PSP. RP, Resting potential.
Although all five multiple-firing cell types in the IC exhibited depolarization block during synaptic activity, different shock strengths were necessary to evoke PSPs large enough to cause firing block in the different cell types. In the rebound-adapting class of neurons (8 of 88 cells), PSPs were the least likely to reach the level at which depolarization block was generally evident. In these cells (Fig. 2b), responses to increased shock strengths were characterized by a continuous increase in firing rate (for minimal to maximal effective shock strengths), sometimes accompanied by saturation at high shock strengths (Fig. 2bi). A slight decrease in spike amplitude was observed in these neurons at high shock strengths (Fig. 2bi, top trace) but was insufficient to cause firing block. Peak depolarizations during the PSP did not exceed 27 mV (at maximum shock strength), and the membrane potentials at which maximum firing occurred (Fig. 2bii; top panel, -30 mV; middle panel, -29 mV; bottom panel, -30 mV) (average, -31 ± 3 mV; n = 8) remained below that at which firing block was observed in the other cell types (Fig. 2aii). PSP amplitudes were smaller and of shorter duration in rebound-adapting cells than the other neuron types, for the same range of shock strengths used. These differences could have been attributable to differences in membrane time constants or the densities of excitatory and inhibitory inputs.
The increased depolarization during synaptic potentials at high shock strengths was accompanied by an increase in the net excitatory input to IC neurons; thus, postsynaptic current (PSC) amplitudes corresponding to the onset of depolarization block (Fig. 3a, PSC-2, PSP-2) were greater than those at which maximum “sustained” firing occurred (Fig. 3a, PSC-1, PSP-1) (n = 42). Application of the GABAA antagonist bicuculline greatly altered PSPs and firing patterns in all five types of multiple-firing neurons. A low shock strength that evoked small, short PSPs and minimal firing in normal saline evoked a greatly enhanced PSP when bicuculline was added (n = 36). For the cell shown in Figure 3b, the peak PSP amplitude and duration were 11 mV and 96 msec in normal saline (Fig. 3b, top trace) and 48 mV and 790 msec in bicuculline (Fig. 3b, bottom trace). Firing during these large PSPs was restricted to one or two shortened spikes at the beginning, followed by complete depolarization block for the remainder of the PSP. Maximum PSP durations in bicuculline ranged from ∼800 msec in rebound-adapting cells to ∼2.5 sec in sustained-regular cells.
Figure 3.

Depolarization block occurs with increased excitatory input. a, Current and voltage-clamp recordings in a nonmonotonic cell (P12) in normal saline during lemniscal stimulation at two different shock strengths. V, Voltage recordings (current clamp); I, current recordings (voltage clamp). Shock strength is greater for PSP-2 than PSP-1. PSC-1 and PSC-2 were evoked by the same stimulus intensities used for PSP-1 and PSP-2. Holding potential for PSCs (-52 mV) was the same as the resting potential of the cell; horizontal axis for the PSCs is expanded so that peaks are visible. b, Firing in a rebound-adapting neuron (P12) in control (i) and 30 μm bicuculline (ii) in response to a lemniscal shock that produced a small PSP in normal saline. Shock strength was the same for i and ii.
To examine how bicuculline-induced depolarization block affected the firing rate of IC neurons, we plotted firing rate as a function of two parameters: the shock strength (Fig. 4a) and the membrane potential (Fig. 4b) during synaptic recruitment. Of the cells illustrated in Figure 4, one had a nonmonotonic rate-depolarization function in normal conditions (Fig. 4ai,bi, filled circles), and the other had a monotonic function (Fig. 4aii,bii, filled circles). In both cells, the firing rate in bicuculline increased more steeply and reached larger maximum values at lower shock strengths (Fig. 4ai,aii). Cells that exhibited depolarization block-induced decreases in firing rate in normal saline continued to do so in bicuculline (Fig. 4ai); however, nonmonotonicity occurred at lower shock strengths in bicuculline. Cells in which the maximum lemniscal shock strengths were insufficient to cause depolarization block in normal saline readily exhibited block in bicuculline, and monotonic relationships between firing rate and shock strength in normal saline became nonmonotonic in bicuculline (Fig. 4aii). The depolarization at which nonmonotonicity began to occur was between 23 and 28 mV, whether or not bicuculline was present (Fig. 4bi,ii, dotted line) (n = 23), and was similar to the depolarization at which intrinsic firing block was observed (Fig. 1b). These results suggest that GABAergic inhibition promotes monotonic increases in firing rate by preventing the membrane potential from reaching the level at which neuronal depolarization block occurs.
Figure 4.

Rate-level functions in normal saline and in bicuculline in two neurons.a, b, Plot of firing rate as a function of shock strength (a) and firing rate as a function of the peak depolarization (b) during PSPs evoked by lemniscal shocks of different strengths for a sustained-regular neuron (ai, bi, postnatal day 12) and rebound-adapting (aii, bii, postnatal day 13) in normal saline and in 30 μm bicuculline. The peak depolarization is the difference between the resting potential of the cell and the membrane potential (measured at the base of spikes) during the peak of the PSP. The dotted line indicates the value of depolarization at which highest firing rate is observed.
Responses to stimulus trains
Responses of IC neurons to trains of lemniscal shocks also showed evidence of depolarization block-induced nonmonotonicity (n = 7). Figure 5 illustrates records from a cell activated for 800 msec with 50 and 100 Hz pulse trains. At each frequency, synapses were recruited by increasing the shock strength. PSPs evoked by each stimulus in the train were of shorter duration than those evoked by single shocks. This difference resulted from the inter-pulse intervals used in the trains, which were too short to allow a full development of the NMDA component of the PSP, which prolongs its time course when evoked by a single shock (Sivaramakrishnan and Oliver, unpublished results). At both train frequencies used, synaptic recruitment caused an initial increase in firing rate (Fig. 5ai-aiii,bi-bii). With additional increases in shock strength, however, neurons were unable to respond to all of the pulses in the train, and spike heights gradually decreased with successive stimuli (Fig. 5aiv). At maximal shock strengths, spikes were generally observed only to the first few pulses, with the remaining pulses evoking subthreshold PSPs (Fig. 5aiv,biii). For the three train frequencies tested on this neuron, firing rate-shock strength functions were nonmonotonic, with nonmonotonicity occurring at lower shock strengths at the higher train frequencies (Fig. 5, compare aiii, biii, and c).
Figure 5.

Depolarization block during stimulus trains. a, b, Responses under current clamp to 50 Hz (a) and 100 Hz (b) stimulus trains in the same neuron (postnatal day 15). The shock strength was increased from ai to aiv and bi to biii. c, Total number of spikes as a function of shock strength for three train frequencies in this cell. The total duration of the train (800 msec) was the same at each frequency.
Our results in vitro suggest that, in the absence of inhibition, most neurons in the IC are unable to maintain a monotonic increase in firing rate with intensity because of firing block that occurs at the higher intensities. The pattern of firing block, which consists of a gradual decrease in spike height during the rising phase of the PSP, completely aborted spikes at the highest depolarization, and recovery to full spike height during the decay of the PSP is consistent with depolarization block and recovery from this depolarization block (Figs. 2, 3). Our results suggest that in the intact animal, the interaction between inhibitory inputs and neuronal depolarization block would be an important determinant of the ability of IC neurons to respond monotonically to changes in sound intensity.
Extracellular recordings from IC neurons in the unanesthetized rabbit
Rate-level functions in IC neurons (n = 103) were measured over the duration of the tone burst (see Materials and Methods). Neurons were divided into three categories on the basis of the shape of these functions; 58% were monotonic, 25% were nonmonotonic, and 17% were saturating. Figure 6a displays the mean rate-level function for each category. The averaged monotonic function continued to increase up to 80 dB SPL (Fig. 6a, filled circles), the saturating function increased to ∼60 dB SPL (Fig. 6a, filled squares), and the nonmonotonic function increased up to ∼40 dB SPL and declined thereafter (Fig. 6a, open squares). Because different spike rates could influence the shape of the averaged function, we also normalized the rate-level function of each neuron and then averaged them for each category. In general, the shape of the normalized functions remained the same as those for spike rate (Fig. 6b), with the exception that the saturated function became even more saturated. Most monotonic neurons had a sustained discharge pattern during a tone burst (85% sustained, 15% transient), and nonmonotonic neurons displayed a bias toward sustained discharge patterns (60% sustained, 40% transient), as did saturating neurons (63% sustained, 34% transient) (Fig. 6c). The mean dynamic range, estimated from individual neurons in our sample, was largest for monotonic neurons (46 ± 14 dB) and smallest for nonmonotonic neurons (25 ± 8 dB).
Figure 6.

Types of rate-level functions. a, Averaged rate-level functions and SEs based on spike rate of monotonic (mono), nonmonotonic (nonmono), and saturating (sat) neurons as well as the mean function derived by averaging across all neurons (solid line). b, Normalized rate-level function. Because different spike rates could influence the shape of the averaged function, we also normalized the rate-level function of each neuron and then averaged them for each category. c, Distribution of types of rate-level functions in neurons that displayed sustained or transient responses to tone bursts. Note that plots in a and b are over the range 20-80 dB, although neurons were tested from 0 to 80 dB SPL. Lower (0-20 dB) intensities were not plotted, because very few neurons responded to these intensities.
We examined the effects of the GABAA antagonists bicuculline and SR-95531 on rate-level functions in a subset of our sample (17 of 103). Five of the seventeen neurons were nonmonotonic in control conditions, and the remaining were either monotonic or saturating.
The effects of GABAA antagonists on neurons with monotonic rate-level functions
Approximately half of the neurons (5 of 12) that exhibited monotonic or saturating rate-level functions in control conditions exhibited nonmonotonic behavior in the presence of GABAA antagonists. The dot raster plots in Figure 7 show the effects of bicuculline on three monotonic neurons that exhibited different firing rates in control conditions across the intensity range tested (Fig. 7a-c, first column). In bicuculline (Fig. 7a-c, second column), the sustained discharge pattern at the higher intensities changed to a firing pattern that consisted of an onset response, a gap in firing, and a resumption of activity. As intensity increased, the gap in firing increased, and in some cells its duration was almost as long as the tone burst (Fig. 7b, second column). Rate-level functions measured over the duration of the tone burst (5-80 msec) changed from monotonic in control conditions to nonmonotonic in bicuculline (Fig. 7a-c, third column, closed and open circles, respectively).
Figure7.

Effects of bicuculline on monotonic neurons. a-c, Spike time rasters in control (first column) and in GABAA antagonist (second column), rate-level functions (third column), and mean first-spike latencies (fourth column) from cells that were monotonic (a, b) or saturating (c) in control conditions. Rasters are illustrated over 100 msec to the first two repetitions of a best frequency tone burst (75 msec duration, presented every 400 msec) at each sound intensity. Rate-level functions were measured over the duration of the tone burst (75 msec). Bicuculline ejection current for neuron: a, 60 nA; b, 30 nA; c, 70 nA. Rasters in bicuculline are shown ∼10 min after start of iontophoresis for the neuron in a and ∼5 min for the neurons in b and c.
The mean first spike latency of these neurons decreased monotonically with intensity in control conditions, and iontophoresis of bicuculline hardly affected the latencies (except for the response in Fig. 7a, fourth column). The lack of effect of GABAA antagonists on first spike latencies suggests that, during the early part of the tone burst, neurons with monotonic or saturating rate-level functions receive either little inhibition (Fig. 7b,c, fourth column) or a uniform inhibition across stimulus levels (Fig. 7a, fourth column).
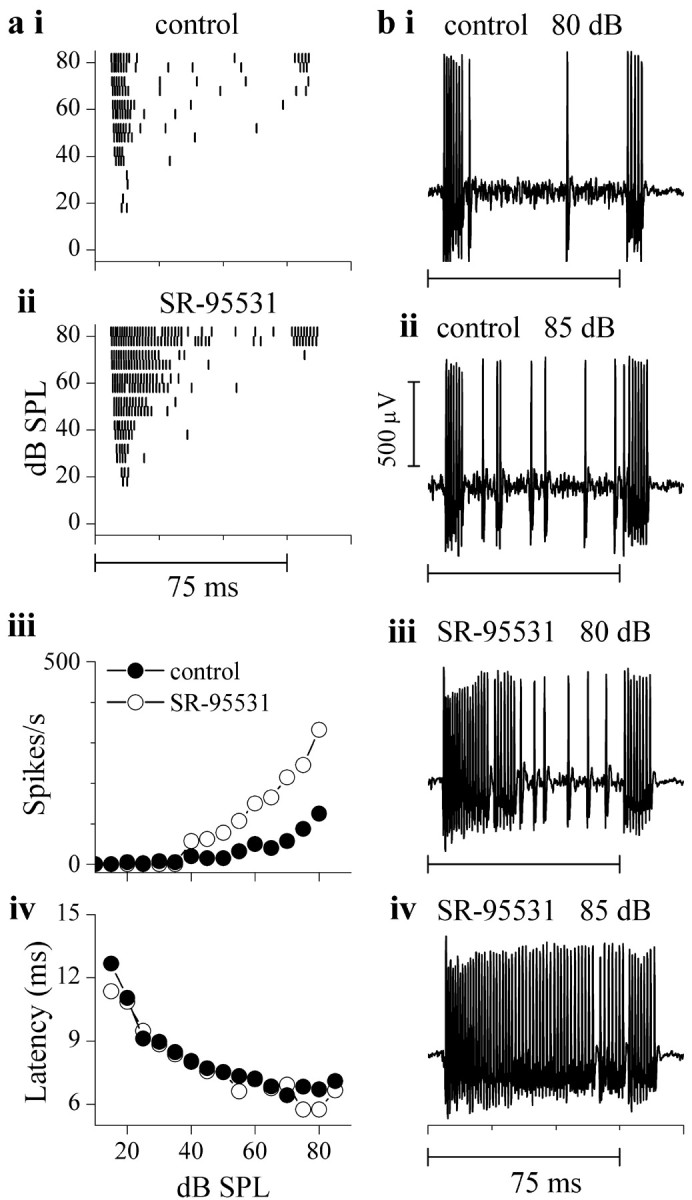
The gap in firing that occurred at high intensities when GABAA receptors were blocked was caused by aborted spikes during the tone burst. Figure 8 illustrates extracellular recordings of action potentials from a monotonic neuron in control conditions (Fig. 8a-d, left column) and in bicuculline (Fig. 8a-d, right column) at several sound intensities. In control conditions, spike heights remained constant for the duration of the sound at all intensities. In bicuculline, after an initial onset response, spike heights rapidly decreased as intensity increased, until they could no longer be distinguished from baseline noise. Spikes gradually began to reappear toward the end of the tone (Fig. 8a,b, right column) and then returned to their normal heights.
Figure8.

Firing block during at one burst in the presence of bicuculline. a-d, Extracellular recordings from a monotonic neuron (same neuron as in Fig. 7a) to a single 75 msec tone burst at the intensities indicated under control (left column) and bicuculline (right column). Recordings are displayed over 225 msec. e-h, Extracellular recordings from another monotonic neuron (same neuron as in Fig. 7b) to a single 75 msec tone burst at the intensities indicated in bicuculline, displayed over 0-150 msec (left column), 0-20 msec (middle column), and 30-50 msec (right column). Horizontal bars indicate duration of tone bursts (75 msec).
Figure 8, e-h, shows another neuron where the degree of firing block caused by GABAA antagonists was graded with intensity. Here, the firing block is displayed at different time scales and time points in the recording. Similar to the neuron in Figure 8, a-d, at 80 dB SPL, action potentials aborted during the tone burst (Fig. 8e, middle and right panels) and began to recover after the end of the sound (Fig. 8e, left panel). The duration of the firing block decreased with decreases in sound intensity (Fig. 8e-h) and at 20 dB SPL, spike heights were only partially reduced.
In the presence of bicuculline, firing extended beyond the stimulus duration (Fig. 8a,b,e,f). Figure 9 shows rate-level functions over different time windows for three neurons. Compared with those during the tone burst (0-80 msec), the rate-level function over an extended response time (0-150 msec) had a reduced degree of nonmonotonicity. However, rate-level functions did not become monotonic, and the dynamic range of the neuron remained narrower in bicuculline compared with the control.
Figure 9.

The effect of analysis window on rate-level functions under bicuculline. a, Rate-level functions of a saturating neuron over the stimulus window (0-80 msec) and extended window (0-150 msec) under control (cont) and bicuculline (bic) conditions. b, c, Same for two monotonic neurons. Bicuculline effects tested ∼ 5 min after start of ejecting current for neurons in a and c and ∼10 min for the neuron b.
In the remaining neurons that were monotonic or saturating in control conditions (7 of 12 cells), although spike rates increased (by >50%) in the presence of GABAA antagonists, rate-level functions remained monotonic or saturated. Except for one cell that displayed partial depolarization block (see Fig. 11), these cells did not display the clear reductions in spike height associated with depolarization block. An example is illustrated in Figure 10. This neuron had an onset response at low intensities and an on-off response at high intensities, and the intense onset response was followed by a weakly sustained response at higher intensities [Fig. 10ai (raster at 80 dB SPL), bii (recordings at 85 dB SPL)]. Rate-level functions were monotonic in control conditions (Fig. 10aiii, closed circles). When the GABAA antagonist SR-95531 was iontophoresed, the firing rate was higher than the control at all intensities (Fig. 10aii,biii), and although the rate-level function was steeper, it remained monotonic (Fig. 10aiii, open circles). A slight reduction in spike height was observed when response frequencies were the highest (at the beginning of the tone burst) and were likely attributable to refractory period effects and not depolarization block (Fig. 10biii,biv). SR-95531 appeared to increase the spike rate most noticeably between the on and off portions of the response, suggesting the presence of a strong GABAergic input in this time window. Like the monotonic cells illustrated in Figure 7, the first spike latency for this cell decreased with sound intensity and was unaltered in SR-95531 (Fig. 10aiv).
Figure 11.

Firing block is reduced during a train of tone bursts. Spikes in response to the first (left column), fourth (middle column), and fifteenth (right column) repetition of a 75 msec tone burst (7000 Hz) presented every 400 msec at 80 dB SPL. a, Control. b, c, Successively increasing times from the start of bicuculline iontophoresis (25 nA). d, Iontophoresis of GABA (40 nA) along with bicuculline. e, Recovery from drug iontophoresis.
Figure 10.
Neurons remain monotonic in the absence of firing block. a, Spike time rasters (same format as in Fig. 7) in control conditions (i) and during iontophoresis of SR-95531 (ii). iii, iv, Rate-level functions over the tone burst duration (75 msec) (iii) and mean first-spike latencies in the conditions indicated (iv). b, Extracellular recordings at 80 and 85 dB SPL in control (i,ii) and in SR-95531 (iii,iv); SR-95531 ejection current, 35 nA.
Rate-level functions during trains of tone bursts
Our results thus far indicate that in most neurons with monotonic rate-level functions, synaptic inhibition during a singletone burst facilitates monotonicity by preventing reductions in firing rate caused by aborted spikes. The prevalence of firing block at high, but not low, sound intensities suggests increases in membrane depolarization with increasing sound intensities. Because the amount of depolarization during synaptic activity is influenced by factors such as synaptic facilitation or depression, which occur during repeated stimulation (Zucker and Regehr, 2002), we examined the effects of blocking inhibition on rate-level functions during trains of tone bursts.
Figures 11 and 12 illustrate the responses of two neurons to a train of tone bursts. For the neuron in Figure 11 (monotonic in control; data not shown), responses are illustrated to the first (left column), fourth (middle column), and fifteenth repetition (right column) of an 80 dB SPL tone burst in control (Fig. 11a), bicuculline (Fig. 11b,c), bicuculline plus GABA (Fig. 11d), and recovery (Fig. 11e). In control conditions, the spike rate decreased with the number of repetitions of the same tone burst (Fig. 11a, compare left, middle, and right columns). In bicuculline, although the spike rate was higher than in control during all repetitions, spike frequency decreased from the first to the fifteenth repetition (Fig. 11b,c, compare left and right columns), a pattern similar to that in control conditions. The degree of firing block in bicuculline progressively weakened with repetition (Fig. 11b, compare left, middle, and right columns). Increasing the time of iontophoresis of bicuculline increased the spike rate and the degree of firing block (Figs. 11b,c). Simultaneous iontophoresis of bicuculline and GABA reduced the firing block, but the firing rate still decreased with repetition (Fig. 11d, compare left, middle, and right columns). Recovery from bicuculline and GABA showed a pattern similar to the control (Fig. 11e). The decrease in discharge rate over repetitions was only seen at high intensities (>60 dB SPL).
Figure 12.

Nonmonotonic rate-level functions induced by bicuculline become monotonic with repeated stimulation. a, Spike time rasters to successive presentations of the same stimulus at 80 dB SPL (first panel), 70 dB SPL (second panel), and 40 dB SPL (third panel) in control conditions (i) and in bicuculline (ii). b, Spike counts during each repetition under control (solid circles) and bicuculline (filled circles) at the intensities indicated. c, Extracellular recordings under bicuculline to different repetitions of the same 75 msec tone burst (2900 Hz, 80 dB SPL).
The recovery of spike height to control conditions when GABA was iontophoresed indicates that, as with our in vitro recordings, the depolarization block observed in vivo in the presence of bicuculline was not the result of a direct effect on the resting potential or voltage-dependent conductances of the postsynaptic membrane (Khawaled et al., 1999).
The neuron in Figure 12 did not exhibit a decrease in firing rate during a train of tone bursts in control conditions, even at high intensities (Fig. 12ai, left, middle, and right panels). In bicuculline, firing block (gap in the raster plots) occurred at higher intensities (Fig. 12aii, left and middle panels) with a smaller degree of block at 40 dB SPL (Fig. 12aii, right panel). Like the cell in Figure 11, the duration of the firing block decreased with repetition, and this decrease was more prevalent at the higher intensities (Fig. 12aii, left and middle panels; c, compare repetition 1 with 14). Plots of the number of spikes during each repetition showed that as the number of repetitions increased, the spiking in bicuculline approached that in control conditions (Fig. 12b, left and middle panels). This was optimally achieved at 70 dB SPL (Fig. 12b, middle column). At 40 dB SPL, the response in bicuculline was elevated relative to control and there were no effects of repetition (Fig. 12b, right panel).
The effect of GABAA antagonists on neurons with nonmonotonic rate-level functions
In the IC of the bat and rat, neurons that exhibit nonmonotonic rate-level functions in control conditions become monotonic in the presence of GABAA antagonists (Faingold et al., 1991; Pollak and Park, 1993). We therefore examined the effects of bicuculline on nonmonotonic neurons, which make up a small percentage of IC neurons in the rabbit (Fig. 6). Of the five nonmonotonic cells in our sample, two were tested with bicuculline and three with SR-95531. Both antagonists had similar effects.
GABAA antagonists made nonmonotonic rate-level functions monotonic. Figure 13 shows the effects of bicuculline on two such neurons. For the neuron in Figure 13a, spiking occurred only during the first 20 msec of the tone burst (Fig. 13ai). Iontophoresis of bicuculline caused an increase in the number of spikes at most intensities, but firing remained transient (Fig. 13aii). The increase in spike rate in the presence of bicuculline was nonuniform, with a larger increase occurring at intensities greater than ∼50 dB SPL, and the rate-level function became monotonic (Fig. 13aiii, filled vs open circles). Bicuculline also affected the first spike latency in this cell. In control conditions, the first spike latency increased at high intensities (Fig. 13aiv, filled circles), whereas in bicuculline, it decreased continuously with intensity (Fig. 13aiv, open circles), suggesting that first spike latencies were determined by a high-threshold, early inhibitory input. This effect of bicuculline on first spike latency contrasts with neurons that exhibit monotonic rate-level functions, in which bicuculline generally has little effect on first spike latency (Fig. 7).
Figure 13.

High-threshold GABAergic inputs in nonmonotonic neurons. a, b, Spike times displayed as rasters from a neuron with transient (a) and sustained (b) firing patterns. i, Control; ii, bicuculline; iii, rate-level functions. For the transient neuron in a, this was measured over 5-20 msec from tone onset, and for the sustained neuron in b, this was measured over 5-20 (biii, top panel) and over 20-80 msec (biii, bottom panel) from tone onset. iv, Mean first-spike latency as a function of intensity. Bicuculline ejection current for neuron in a was 25 nA, and 70 nA for the neuron in b. c, Extracellular recordings from the same neuron in a to tone bursts at four sound intensities (80, 60, 40, and 30 dB SPL) in control (left column) and bicuculline (right column). Bicuculline effects tested ∼5 min after start of ejecting current for both neurons.
The neuron in Figure 13b had a sustained response during the tone burst, and the shape of its rate-level function depended on whether the early or later portion of the response was analyzed. In control conditions (Fig. 13bi), the number of spikes increased with intensity throughout the tone burst, up to ∼40 dB SPL. At higher intensities, however, the first spike latency exhibited a sudden increase, resulting in a greatly reduced response during the first 20 msec of the tone burst (Fig. 13bi,biv). In the presence of bicuculline, the intensity-dependent increase in first spike latency was markedly attenuated (Fig. 13bii,iv), and firing increased throughout the tone burst (Fig. 13bii). Rate-level functions were plotted for two time windows, an onset time window, corresponding to the first 20 msec of the tone burst (Fig. 13biii, top panel), and a sustained time window, corresponding to the next 60 msec of the stimulus (Fig. 13biii, bottom panel). During the onset portion of the response, the rate-level function was strongly nonmonotonic in control conditions (Fig. 13biii, top panel, filled circles). This nonmonotonicity was reduced in bicuculline, and the rate-level function exhibited some saturation (Fig. 13biii, top panel, open circles). During the sustained portion of the response, the rate-level function saturated in control conditions (Fig. 13biii, bottom panel, filled circles), and the degree of monotonicity increased when bicuculline was present (Fig. 13biii, bottom panel, open circles). Therefore, as for the cell in Figure 13a, an increase in inhibition at high sound intensities was responsible for the increased first spike latency in this cell. Extracellular recordings of action potentials from the neuron in Figure 13a indicated minimal, if any, changes in spike heights in bicuculline (Fig. 13c), unlike the changes that occurred in monotonic cells (Fig. 8).
Discussion
The creation of monotonic rate-level functions
Our main finding is that the ability of IC neurons to respond monotonically to changes in sound intensity depends on the regulation of neuronal membrane potential by excitatory and inhibitory inputs. Our results suggest three roles for synaptic inputs and the postsynaptic IC neuron in the generation of a monotonic rate-level function. First, monotonicity is possible as long as the excitatory synaptic input is graded with intensity. Without inhibition, however, activation of excitatory inputs alone can result in a shortened dynamic range. Second, membrane saturation of the postsynaptic neuron (via depolarization block) can disrupt a monotonic response when the excitatory input is large and inhibition is limited. A similar role of synaptic inhibition in regulating firing by preventing depolarization block has been suggested from computational models of the responses of cochlear nucleus neurons to sounds (Rothman et al., 1993). Third, in a small fraction of IC neurons, a nonmonotonic response is created by high-threshold inhibitory inputs.
The increase in membrane depolarization that occurs with synaptic recruitment is at least partly attributable to an increased excitatory input, which increases both the amplitude and duration of the synaptic current. Changes in the shape of the synaptic current with increasing shock strength are likely to reflect differential activation of the glutamate receptors present on IC neurons (Wu et al., 2002) during recruitment. Without the concurrent activation of GABAA synapses, these excitatory inputs cause large and prolonged depolarizations, during which firing block occurs. GABAergic inhibition thus increases the chances of monotonicity by reducing both the amplitude and duration of the synaptic potential. Although GABAA and glutamatergic receptor subunits change between the immature and adult IC (Wenzel et al., 1996; Milbrandt et al., 1997; Caicedo and Eybalin, 1999), our finding that blocking GABAA receptors has similar effects at these two different ages suggests that, although individual receptor subunits and densities alter with maturity, the excitation-inhibition balance appears to remain relatively unchanged.
Depolarization block in IC neurons in vitro occurs at relatively small depolarizations (25 mV). Because synaptic potentials evoked by low lemniscal shock strengths are ∼5 mV in peak amplitude and reach ∼50 mV at maximum recruitment, a depolarization of ∼25 mV is likely to involve the activation of less than the maximum number of excitatory inputs on a neuron. This finding explains why, in the absence of synaptic inhibition, depolarization block in vivo occurs at moderate sound levels. The membrane potential at which spikes fail is similar across the different types of IC neurons that exhibit intrinsically different firing patterns and rates (Sivaramakrishnan and Oliver, 2001). Thus, the firing rate per se, although likely to alter the slope of the rate-level function, does not determine whether a response is monotonic or nonmonotonic. This conclusion is supported by our observations in vivo, in which rate-level functions in neurons with different firing rates are affected similarly by depolarization block (Figs. 7, 8).
Our results indicate that a critical factor in shaping responses to increasing stimulus intensity is the relative strengths of excitation and inhibition that a neuron receives. Rebound-adapting cells, for example, have smaller PSPs and remain monotonic in control conditions but become nonmonotonic in GABAA antagonists, implying that the excitation to inhibition ratio is smaller in these neurons than, for example, sustained-regular cells, which are already nonmonotonic in control conditions. The excitation to inhibition ratio at any given sound intensity would therefore be critical in determining monotonicity. Our in vivo results, in which depolarization block did not occur in all monotonic neurons, indicate that this ratio might differ between neurons (compare Figs. 7 and 10). However, the lack of depolarization block might have been caused by inadequate drug distribution during iontophoresis.
Although firing during a single-tone burst is vulnerable to changes in excitatory and inhibitory inputs, the balance between excitation and inhibition needed to generate monotonicity is reestablished during trains of tone bursts. A repeated sound stimulus decreases the spike rate and suggests the occurrence of synaptic depression and a resulting decrease in membrane potential during successive tone bursts of a train. The lower depolarization prevents firing block at high-sound intensities, and monotonicity is thus preserved. In some IC neurons, synaptic depression appears to occur in control conditions, whereas in others, it occurs only when GABAA receptors are blocked. This finding is consistent with the conditions necessary to generate synaptic plasticity in the IC in vitro (Wu et al., 2002), as well as in other systems such as the hippocampus and cerebellum where synaptic depression and potentiation of glutamatergic transmission may be observed normally in some conditions and, in others, more readily when GABAA receptors are blocked (Zucker and Regehr, 2002).
The only other study demonstrating depolarization block is in the IC of the unanesthetized bat (Pollak and Park, 1993). The lack of depolarization block in many studies may be caused by the use of anesthetics such as barbiturates and ketamine that potentiate GABA-mediated inhibition or reduce NMDA receptor activation to various degrees (Faingold et al., 1989; Ben-David, 2000; Cheng and Kendig, 2000; Yamakura et al., 2000; Ming et al., 2001) or because of the different species used, in which differences between GABAA or glutamate receptor densities or subunit types would differentially affect postsynaptic depolarization.
The incidence of monotonic rate level functions
Monotonic rate-level functions were the largest category in our sample, and if we include saturating functions, ∼75% of our neurons were monotonic. The large population of monotonic neurons suggests that firing rate may be adequate to reflect changes in sound pressure levels. Using similar criteria to ours, the proportion of monotonic rate-level functions in the IC varies widely from study to study. It ranges from those we observed (Bock et al., 1972; Kuwada et al., 1984; Rees and Palmer, 1988), to ∼50-60% (Semple and Kitzes, 1985; Irvine and Gago, 1990), to ∼20-40% (Ehret and Merzenich, 1988; Aitkin, 1991; Pollak and Park, 1993). The differences in the proportion of monotonic rate-level functions among these studies, including ours, may be attributable to the use of different anesthetic agents, including un-anesthetized (Kuwada et al., 1989), different rates of acoustic stimulation (Galazyuk et al., 2000), and the choice of species that may have different proportions of cell types with different intrinsic or synaptic properties. Ehret and Merzenich (1988) reported that the peaks of nonmonotonic rate-level functions were widely distributed over the intensity range. In contrast, we find that nonmonotonic functions are not widely distributed, because averaging them still results in a peaked function (Fig. 6).
Role of inhibition in neuronal responses to sound intensity in the IC
In neurons with nonmonotonic rate-level functions (Fig. 13), nonmonotonicity is caused by synaptic inhibition. GABAergic inputs to some nonmonotonic neurons are activated at all intensities, whereas in others, activation occurs primarily at the higher intensities. High-threshold inhibition affects the first spike latency, which abruptly increases at the higher intensities. High-threshold inhibitory inputs also have been reported in the bat and rat IC (Faingold and Anderson, 1991; Pollak and Park, 1993; LeBeau et al., 2001) and give rise to a “paradoxical latency shift” (Galazyuk and Feng, 2001), similar to what we observed.
Rate-level functions in nonmonotonic neurons are shaped by GABAergic inhibition in an intensity-dependent manner. At intensities less than ∼30 dB SPL, GABAergic inputs either decrease the firing rate without altering the slope of the rate-level function or do not alter firing rate much. Thus, synaptic inhibition is subtractive in this intensity range. At higher intensities, however, the slope of the rate-level function changes from positive to negative. Because the rate-level function in the absence of inhibition continues to increase at high intensities, it suggests that the excitatory input must also be increasing with intensity. Thus, the change in the direction of the rate-level function suggests a gradually increasing inhibitory input with increasing sound intensity. In these neurons, therefore, nonmonotonicity arises from the activation of dynamically changing GABAergic inputs, which shift the balance between excitation and inhibition in an intensity-dependent manner.
In monotonic cells, a change in the direction of the rate-level slope occurs when the postsynaptic membrane is unable to maintain firing at high intensities. The monotonic rate-level function in normal conditions suggests that GABAergic inhibition in these cells may be more or less uniform throughout the intensities used, although nonlinear effects cannot be ruled out. Thus, in contrast to nonmonotonic cells, inhibitory inputs to monotonic cells do not appear to be increasingly recruited with intensity. Inhibition has little or no effect on first spike latency in monotonic cells, suggesting a delayed activation of GABAergic inputs.
Our results show that GABAergic inputs to nonmonotonic neurons are early, high-threshold, and intensity dependent, whereas in monotonic neurons, they are delayed but activated uniformly over all intensities. Thus, inhibitory inputs introduce different degrees of nonlinearity in different IC neurons when the sound intensity changes. The IC receives extensive inhibitory input from lower brainstem regions (Adams and Mugnaini, 1984; Fekete et al., 1984; Oliver, 1985, 1987, 2000; Zook and Casseday, 1987; Saint Marie and Baker, 1990; Shneiderman et al., 1993), and a difference in the excitation-inhibition balance between different neurons is likely to be an important regulator of nonlinearity. Differences in nonlinearity between neurons appear to be caused by differences in the interaction between the net depolarization during a synaptic input, which is affected variably by inhibition, and postsynaptic membrane saturation.
Footnotes
This work was supported by National Institute on Deafness and Other Communication Disorders Grants DC01366 and DC00189. We thank Dr. R. Riquelme for contributing to the recordings in the unanesthetized rabbit and D. Bishop for technical help.
Correspondence should be addressed to Shobhana Sivaramakrishnan, Department of Neuroscience, University of Connecticut Health Center, Farmington, CT 06030. E-mail: shobhana@neuron.uchc.edu.
Copyright © 2004 Society for Neuroscience 0270-6474/04/245031-13$15.00/0
References
- Adams JC, Mugnaini E (1984) Dorsal nucleus of the lateral lemniscus: a nucleus of GABAergic projection neurons. Brain Res Bull 13: 585-590. [DOI] [PubMed] [Google Scholar]
- Aitkin L (1991) Rate-level functions of neurons in the inferior colliculus of cats measured with the use of free-field sound stimuli. J Neurophysiol 65: 383-392. [DOI] [PubMed] [Google Scholar]
- Albrecht DG, Hamilton DB (1982) Striate cortex of monkey and cat: contrast response function. J Neurophysiol 48: 217-237. [DOI] [PubMed] [Google Scholar]
- Ben-David B (2000) NMDA receptor blockade: from the laboratory to clinical application. Anesth Analg 91: 1042-1043. [DOI] [PubMed] [Google Scholar]
- Bock GR, Webster WR, Aitkin LM (1972) Discharge patterns of single units in inferior colliculus of the alert cat. J Neurophysiol 35: 265-277. [DOI] [PubMed] [Google Scholar]
- Caicedo A, Eybalin M (1999) Glutamate receptor phenotypes in the auditory brainstem and mid-brain of the developing rat. Eur J Neurosci 11: 51-74. [DOI] [PubMed] [Google Scholar]
- Cheng G, Kendig JJ (2000) Enflurane directly depresses glutamate AMPA and NMDA currents in mouse spinal cord motor neurons independent of actions on GABAA or glycine receptors. Anesthesiology 93: 1075-1084. [DOI] [PubMed] [Google Scholar]
- D'Angelo WR, Sterbing SJ, Ostapoff EM, Kuwada S (2003) Effects of amplitude modulation on the coding of interaural time differences of low-frequency sounds in the inferior colliculus. II. Neural mechanisms. J Neurophysiol 90: 2827-2836. [DOI] [PubMed] [Google Scholar]
- Ehret G, Merzenich MM (1988) Neuronal discharge rate is unsuitable for encoding sound intensity at the inferior-colliculus level. Hear Res 35: 1-7. [DOI] [PubMed] [Google Scholar]
- Faingold CL, Anderson CA (1991) Loss of intensity-induced inhibition in inferior colliculus neurons leads to audiogenic seizure susceptibility in behaving genetically epilepsy-prone rats. Exp Neurol 113: 354-363. [DOI] [PubMed] [Google Scholar]
- Faingold CL, Hoffmann WE, Caspary DM (1989) Effects of excitant amino acids on acoustic responses of inferior colliculus neurons. Hear Res 40: 127-136. [DOI] [PubMed] [Google Scholar]
- Faingold CL, Boersma Anderson CA, Caspary DM (1991) Involvement of GABA in acoustically-evoked inhibition in inferior colliculus neurons. Hear Res 52: 201-216. [DOI] [PubMed] [Google Scholar]
- Fekete DM, Rouiller EM, Liberman MC, Ryugo DK (1984) The central projections of intracellularly labeled auditory nerve fibers in cats. J Comp Neurol 229: 432-450. [DOI] [PubMed] [Google Scholar]
- Galazyuk AV, Feng AS (2001) Oscillation may play a role in time domain central auditory processing. J Neurosci 21: RC147. [DOI] [PMC free article] [PubMed] [Google Scholar]
- Galazyuk AV, Llano D, Feng AS (2000) Temporal dynamics of acoustic stimuli enhance amplitude tuning of inferior colliculus neurons. J Neurophysiol 83: 128-138. [DOI] [PubMed] [Google Scholar]
- Havey DC, Caspary DM (1980) A simple technique for constructing “piggyback” multibarrel microelectrodes. Electroencephalogr Clin Neurophysiol 48: 249-251. [DOI] [PubMed] [Google Scholar]
- Huxter J, Burgess N, O'Keefe J (2003) Independent rate and temporal coding in hippocampal pyramidal cells. Nature 425: 828-832. [DOI] [PMC free article] [PubMed] [Google Scholar]
- Irvine DR, Gago G (1990) Binaural interaction in high-frequency neurons in inferior colliculus of the cat: effects of variations in sound pressure level on sensitivity to interaural intensity differences. J Neurophysiol 63: 570-591. [DOI] [PubMed] [Google Scholar]
- Khawaled R, Bruening-Wright A, Adelman JP, Maylie J (1999) Bicuculline block of small-conductance calcium-activated potassium channels. Pflügers Arch 438: 314-321. [DOI] [PubMed] [Google Scholar]
- Kiang N-S, Watanabe T, Thomas E, Clark L (1965) Discharge patterns of single fibers in the cat's auditory nerve. Cambridge: MIT.
- Kuwada S, Yin TC, Syka J, Buunen TJ, Wickesberg RE (1984) Binaural interaction in low-frequency neurons in inferior colliculus of the cat. IV. Comparison of monaural and binaural response properties. J Neurophysiol 51: 1306-1325. [DOI] [PubMed] [Google Scholar]
- Kuwada S, Stanford TR, Batra R (1987) Interaural phase-sensitive units in the inferior colliculus of the unanesthetized rabbit: effects of changing frequency. J Neurophysiol 57: 1338-1360. [DOI] [PubMed] [Google Scholar]
- Kuwada S. Batra R, Stanford TR (1989) Monaural and binaural response properties of neurons in the inferior colliculus of the rabbit: effects of sodium pentobarbital. J Neurophysiol 69: 269-282. [DOI] [PubMed] [Google Scholar]
- LeBeau FE, Malmierca MS, Rees A (2001) Iontophoresis in vivo demonstrates a key role for GABA(A) and glycinergic inhibition in shaping frequency response areas in the inferior colliculus of guinea pig. J Neurosci 21: 7303-7312. [DOI] [PMC free article] [PubMed] [Google Scholar]
- Merrill EG, Ainsworth A (1972) Glass-coated platinum-plated tungsten microelectrodes. Med Biol Eng 10: 662-672. [DOI] [PubMed] [Google Scholar]
- Milbrandt JC, Hunter C, Caspary DM (1997) Alterations of GABAA receptor subunit mRNA levels in the aging Fischer 344 rat inferior colliculus. J Comp Neurol 379: 455-465. [DOI] [PubMed] [Google Scholar]
- Ming Z, Knapp DJ, Mueller RA, Breese GR, Criswell HE (2001) Differential modulation of GABA- and NMDA-gated currents by ethanol and isoflurane in cultured rat cerebral cortical neurons. Brain Res 920: 117-124. [DOI] [PubMed] [Google Scholar]
- Oliver DL (1985) Quantitative analyses of axonal endings in the central nucleus of the inferior colliculus and distribution of 3H-labeling after injections in the dorsal cochlear nucleus. J Comp Neurol 237: 343-359. [DOI] [PubMed] [Google Scholar]
- Oliver DL (1987) Projections to the inferior colliculus from the anteroventral cochlear nucleus in the cat: possible substrates for binaural interaction. J Comp Neurol 264: 24-46. [DOI] [PubMed] [Google Scholar]
- Oliver DL (2000) Ascending efferent projections of the superior olivary complex. Microsc Res Tech 51: 355-363. [DOI] [PubMed] [Google Scholar]
- Peruzzi D, Sivaramakrishnan S, Oliver DL (2000) Identification of cell types in brain slices of the inferior colliculus. Neuroscience 101: 403-416. [DOI] [PubMed] [Google Scholar]
- Pollak GD, Park TJ (1993) The effects of GABAergic inhibition on monaural response properties of neurons in the mustache bat's inferior colliculus. Hear Res 65: 99-117. [DOI] [PubMed] [Google Scholar]
- Rees A (1992) The coding of intensity in the inferior colliculus: onset and sustained responses. Adv Biosciences 83: 263-270. [Google Scholar]
- Rees A, Palmer AR (1988) Rate-intensity functions and their modification by broadband noise for neurons in the guinea pig inferior colliculus. J Acoust Soc Am 83: 1488-1498. [DOI] [PubMed] [Google Scholar]
- Reyes A (2001) Influence of dendritic conductances on the input-output properties of neurons. Annu Rev Neurosci 24: 653-675. [DOI] [PubMed] [Google Scholar]
- Rhode WS (1976) A digital system for auditory neurophysiological research. In: Current computer technology in neurobiology (Brown P, ed), pp 543-567. Washington, DC: Hemisphere.
- Rothman JS, Young ED, Manis PB (1993) Convergence of auditory nerve fibers onto bushy cells in the ventral cochlear nucleus: implications of a computational model. J Neurophysiol 70: 2562-2583. [DOI] [PubMed] [Google Scholar]
- Saint Marie RL, Baker RA (1990) Neurotransmitter-specific uptake and retrograde transport of [3H]glycine from the inferior colliculus by ipsilateral projections of the superior olivary complex and nuclei of the lateral lemniscus. Brain Res 524: 244-253. [DOI] [PubMed] [Google Scholar]
- Schwindt PC, Crill WE (1998) Synaptically evoked dendritic action potentials in rat neocortical pyramidal neurons. J Neurophysiol 79: 2432-2446. [DOI] [PubMed] [Google Scholar]
- Semple MN, Kitzes LM (1985) Single-unit responses in the inferior colliculus: different consequences of contralateral and ipsilateral auditory stimulation. J Neurophysiol 53: 1467-1482. [DOI] [PubMed] [Google Scholar]
- Shneiderman A, Chase MB, Rockwood JM, Benson CG, Potashner SJ (1993) Evidence for a GABAergic projection from the dorsal nucleus of the lateral lemniscus to the inferior colliculus. J Neurochem 60: 72-82. [DOI] [PubMed] [Google Scholar]
- Sivaramakrishnan S, Laurent G (1995) Pharmacological characterization of presynaptic calcium currents underlying glutamatergic transmission in the avian auditory brainstem. J Neurosci 15: 6576-6585. [DOI] [PMC free article] [PubMed] [Google Scholar]
- Sivaramakrishnan S, Oliver DL (2001) Distinct K currents result in physiologically distinct cell types in the inferior colliculus of the rat. J Neurosci 21: 2861-2877. [DOI] [PMC free article] [PubMed] [Google Scholar]
- Wei DS, Mei YA, Bagal A, Kao JP, Thompson SM, Tang CM (2001) Compartmentalized and binary behavior of terminal dendrites in hippocampal pyramidal neurons. Science 293: 2272-2275. [DOI] [PubMed] [Google Scholar]
- Wenzel A, Villa M, Mohler H, Benke D (1996) Developmental and regional expression of NMDA receptor subtypes containing the NR2D subunit in rat brain. J Neurochem 66: 1240-1248. [DOI] [PubMed] [Google Scholar]
- Wilson MA, McNaughton BL (1993) Dynamics of the hippocampal ensemble code for space. Science 261: 1055-1058. [DOI] [PubMed] [Google Scholar]
- Wu SH, Ma CL, Sivaramakrishnan S, Oliver DL (2002) Synaptic modification in neurons of the central nucleus of the inferior colliculus. Hear Res 168: 43-54. [DOI] [PubMed] [Google Scholar]
- Yamakura T, Chavez-Noriega LE, Harris RA (2000) Subunit-dependent inhibition of human neuronal nicotinic acetylcholine receptors and other ligand-gated ion channels by dissociative anesthetics ketamine and dizocilpine. Anesthesiology 92: 1144-1153. [DOI] [PubMed] [Google Scholar]
- Zook JM, Casseday JH (1987) Convergence of ascending pathways at the inferior colliculus of the mustache bat, Pteronotus parnellii. J Comp Neurol 261: 347-361. [DOI] [PubMed] [Google Scholar]
- Zucker RS, Regehr WG (2002) Short-term synaptic plasticity. Annu Rev Physiol 64: 355-405. [DOI] [PubMed] [Google Scholar]