

Abstract
Development of corticospinal (CS) terminations is activity dependent. In the cat, activity-dependent refinement of termination topography occurs between weeks 3 and 6. Initially, sparse terminals are present in the gray matter bilaterally, including the motor nuclei. By week 6, virtually all motor nuclear terminations are eliminated, as are most ipsilateral terminations. In this study, we determined whether electrical stimulation of CS axons could be used to rescue transient terminations and promote their growth. We implanted microwires in the pyramid or spinal white matter to stimulate CS axons (2 hr/d, 330 Hz, 45 msec burst, 2 sec intervals) for 2-3 weeks during the refinement period. CS terminations were traced using wheat germ agglutinin conjugated to horseradish peroxidase. Animals were killed after week 6. Stimulation produced dense terminations bilaterally, including within the motor nuclei. Termination density was least in lamina 1 and ventral lamina 9. Reticular formation stimulation produced a control (i.e., nonstimulated) termination pattern. To determine whether CS stimulation affected development of the nonstimulated CS system, we traced terminations from the contralateral cortex using biotinylated dextran amine. Compared with controls or after reticular formation stimulation, there was a shift in the distribution of terminations of the nonstimulated side to more dorsal laminas, which is where the stimulated CS system had fewer terminals. This distribution shift is consistent with competition for termination space between the CS systems on both sides. Our findings indicate that activity can be harnessed to bias CS axon terminal development. This has important implications for using activity to modify motor system organization after perinatal CNS trauma.
Keywords: motor cortex, corticospinal system, spinal cord, postnatal, cat, activity-dependent development
Introduction
The corticospinal (CS) system develops during early postnatal life. This is also a time of a rapid expansion in the motor behavioral repertoire and an increase in movement accuracy and coordination (Porter and Lemon, 1993; Galea and Darian-Smith, 1995; Konczak et al., 1995). In the cat, during this period, CS projections to the spinal cord are refined. At week 3, sparse terminals are present bilaterally in the gray matter, including the motor nuclei (Li and Martin, 2000, 2001, 2002). Between postnatal weeks (PWs) 3 and 5, CS axons develop fine terminal branches and more axon varicosities. By week 6, there is extensive elimination of ventral and ipsilateral (i.e., transient) terminations, yielding the mature pattern of dense terminals in the contralateral deep laminas of the dorsal horn and intermediate zone. The sparse motor nuclei terminations are eliminated. The only significant ipsilateral terminations normally present after PW 6 are in the medial ventral horn (lamina 8) (Theriault and Tatton, 1989; Alisky et al., 1992; Martin, 1996). Although CS axon terminations have a mature laminar specificity and laterality by week 6, terminal branches and varicosities further develop.
This refinement process is activity dependent. Blocking neuronal activity with infusion of the GABAA agonist muscimol into one sensorimotor cortex disrupts development of the normal CS termination pattern (Martin et al., 1999). The silenced cortex fails to establish dense contralateral spinal terminals, whereas the active cortex develops bilateral terminals. Bilateral sensorimotor cortex activity blockade produces a relatively normal CS termination pattern (Martin and Lee, 1999). This indicates that activity-dependent competition is occurring between the developing CS systems on the two sides.
In the present study, we further explored the role of activity in shaping development of the topography of CS terminations. We augmented activity by electrically stimulating CS tract axons in the medullary pyramid (PT) or the spinal cord. We determined whether stimulating the CS system maintained its transient terminations, as well as promoted termination growth, and whether stimulation also affected development of CS terminations on the nonstimulated side. We examined CS axon terminal topography from the stimulated and nonstimulated sides immediately after the stimulation period, at ages that normally show the mature CS termination pattern in the contralateral dorsal horn and intermediate zone (Theriault and Tatton, 1989; Alisky et al., 1992; Martin et al., 1999). Because CS axon development occurs between PWs 3 and 7, we chronically implanted a microwire electrode to stimulate for a prolonged period.
We show that promoting CS neural activity during early postnatal life strongly restructures the termination pattern of developing CS axons by conferring a competitive advantage. Our findings show that activity can be harnessed to bias the course of CS axon terminal development. This has important implications for devising strategies for modifying the functional organization of the motor systems after perinatal trauma.
Materials and Methods
General methods. All cats used in this study (n = 7 chronic, 2 acute, and 3 age-matched controls) were obtained from an American Association for the Accreditation of Laboratory Animal Care-accredited supplier. All experiments were conducted with the approval of the New York State Psychiatric Institute and Columbia University Institutional Animal Care and Use Committees. Under general anesthesia (induced with 30 mg/kg, i.m., ketamine and maintained using isofluorane), the head was placed in a stereotaxic frame, and craniotomies were made over the medullary electrode implantation and motor cortex tracer injection sites. Experiments were conducted in animals between 3 and 6 or 5 and 7 weeks or 8 weeks (see Table 1, Results).
Table 1.
Summary of experiments
|
Stimulation |
PW |
Electrode location |
Stimulus amplitude (μA) |
PW |
Total duration (hr) |
Dominant motor effect |
|---|---|---|---|---|---|---|
| Experiment | ||||||
| 1 | 3-6 | PT | 194 | 3-6 | 36 | Forelimb, distal |
| 2 | 5-7 | PT | 151 | 5-7 | 28 | Body |
| 3 | 5-8 | SC | 107 | 5-8 | 46 | Forelimb, distal |
| 4 | 5-8 | PT | 104 | 5-8 | 32 | Forelimb |
| 5 | 5-8 | RF | 77 | 5-8 | 38 | Hindlimb |
| 6 | 3-6 | RF | 81 | 3-6 | 36 | Neck, ear |
| 7 | 5-7 | PT | 150 | 5-7 | a | Forelimb |
| Controls | ||||||
| 8 | 7, WGA-HRP | |||||
| 9 | 7, BDA | |||||
| 10 |
7, BDA |
|
|
|
|
|
SC, Spinal cord.
Animal used in a different experiment, but PT electrode site was confirmed histologically.
Chronic electrical stimulation. We implanted an array of Teflon-insulated stainless steel microwires (50 μm diameter) unilaterally into the medullary PT using a carrier system that we developed. Briefly, microwire electrodes (four wires staggered in length by 250 μm) were attached to a stiff tungsten wire (500 μm outer diameter, rounded at the end) using Carbowax (Fisher Scientific, Pittsburgh, PA) (Palmer, 1978). The electrode array was inserted stereotactically into the caudal medulla (between 12° and 20° posterior to anterior angulation), using standard cat eye-hard palate supports in a Kopf stereotaxic frame. The array was positioned 0.5 mm from the midline and driven to the skull floor (identified by a small lateral movement of the array shaft while examining the entry site under a dissecting microscope at 400×) and then raised 0.5 mm to allow for the distance between the skull and ventral medulla. This resulted in the microwires being between 0.5-1.25 mm from the base of the skull. We allowed 15 min for the microwires to detach from the carrier system. The carrier wire was removed, and the microwires and the connector were embedded in dental acrylic. During the stimulation period (PWs 3-7; see below), skull and brain growth in the kitten is predominantly restricted to the cerebral hemispheres (Rose and Goodfellow, 1973). In accordance with this, the dental acrylic and electrode array remained stable. The final implantation site was determined on the basis of other experiments we have conducted in kittens (Meng and Martin, 2003). We found that the dorsoventral extent of effective medullary sites for evoking short latency CS tract potentials at PWs 4-5 was ∼1 mm above the base of the skull. Marking lesions in the PT were made before killing the animal (see Fig. 2 B). At the time of implanting the microwires, we attached a silver wire to one of the acrylic support screws. This served as the stimulation ground.
Figure 2.
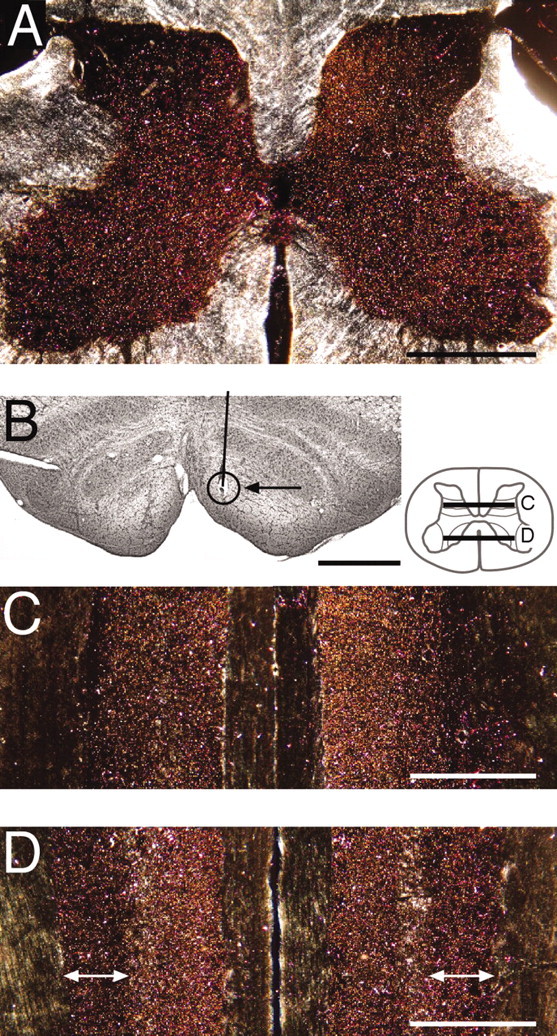
Effect of PT stimulation on CS axon terminal topography (experiment 2). A, Transverse section through the cervical enlargement (montage of 5 polarized dark-field micrographs). B, Nissl-stained section through the ventral portion of the medulla showing the pyramids. The solid line marks the electrode tract. The circle and arrow show the location of the marking lesion in the medial pyramid. C, Horizontal section through the dorsal horn (see inset for level) of the C6-C7 segments. D, Horizontal section through the ventral horn (see inset for level), ventral to the section in C. The white arrows mark the lateral and medial boundaries of the lateral motor nuclei. The right side of A, C, and D is contralateral to the stimulated CS system. Scale bars, 1 mm.
In one of the early experiments, the head was supported in a standard stereotaxic frame but with a rodent nasal bridge-tooth support, the height of which could be adjusted. In this animal, the front of the head was elevated relative to the horizontal plane. Because the electrode was kept vertically, it effectively had a posterior angulation with respect to the brainstem axis and as a consequence was advanced into the C1 spinal segment. Final electrode depth (relative to the skull surface) was 5 mm deeper than brainstem electrode placements. The marking lesion made at the end of the stimulation period indicated placement in the dorsolateral white matter, lateral to the dorsal horn (see Fig. 3A, inset). This is within the territory of the dorsolateral column in which labeled CS axons are present (Armand and Kuypers, 1980). There also was gliosis and neovascularization, which were limited to approximately ±500 μm rostrocaudally at the marking lesion site (i.e., at the array tip). This animal showed no untoward motor signs attributable to the spinal electrode. Note that in young kittens, the rostral spinal cord is closer to stereotaxic vertical than in older kittens and adult cats. Apart from producing ipsilateral movements, the threshold and motor effects were not distinguishable from those for PT stimulation (see Table 1, Results), and the anatomical outcome was the same. To determine the specificity of effects of CS stimulation, in two animals we stimulated the medullary reticular formation (RF) lateral to the pyramid (see Fig. 4 A, inset).
Figure 3.
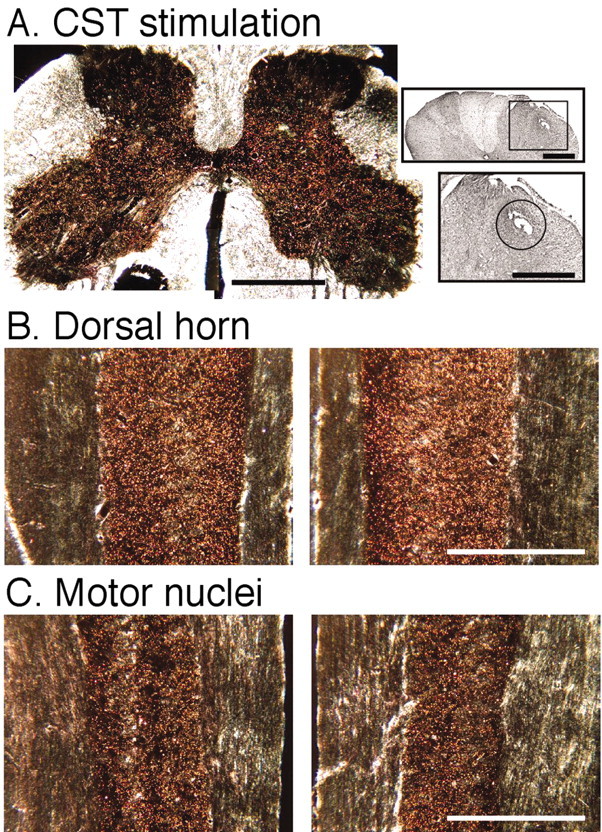
Stimulation of the CS tract (CST) in the lateral funiculus at C1 (experiment3). These micrographs are similar to those in Figure 2. A, Photomontage of a transverse section through the cervical enlargement. Insets, Nissl-stained section of the dorsal spinal cord (top) and higher magnification view of the boxed area (bottom). B, Horizontal sections through the dorsal horn of the C6-C7 segments (similar level as in Fig. 2C). C, Horizontal section through the ventral horn of the C6-C7 segments (similar level as in Fig. 2 D). The sections in C cut through the motor nuclei. The right side of A-C is contralateral to the stimulated CS system. Scale bars: A, A, top inset, B, C, 1 mm; A, bottom inset, 500 μm.
Figure 4.
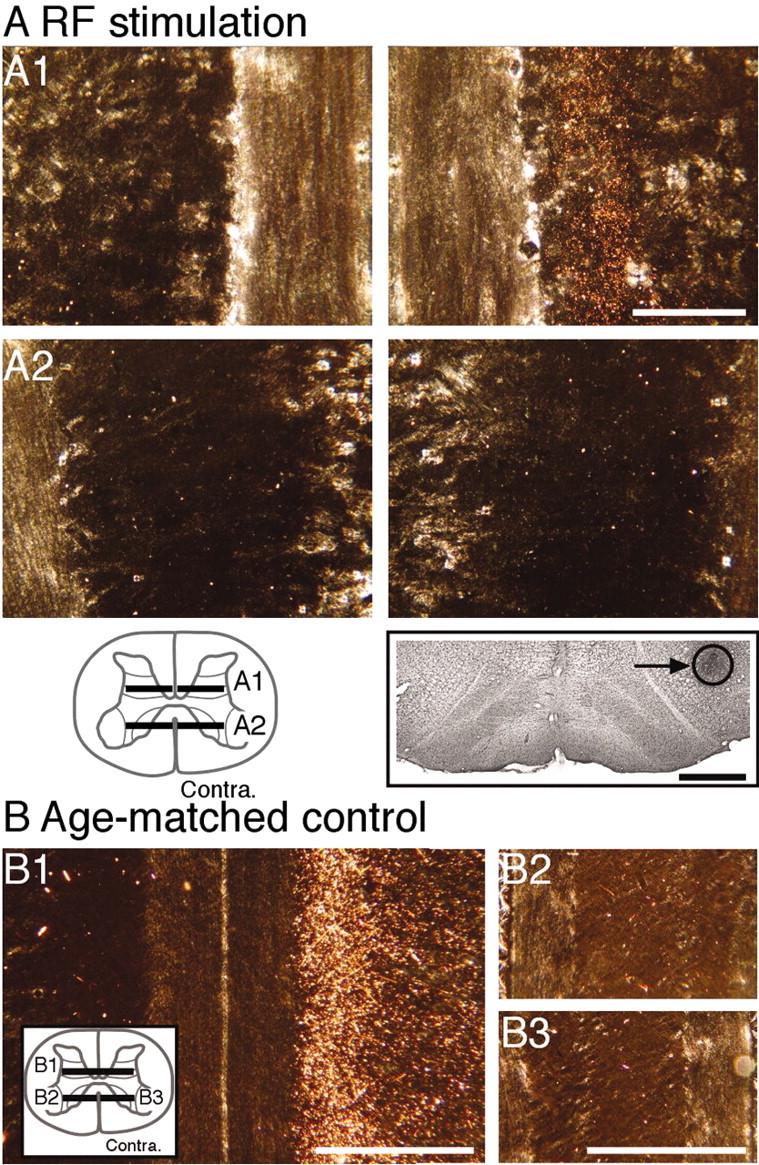
Predominantly contralateral CS terminations after reticular formation stimulation (A; experiment 6) and in an 8-week-old control (B; experiment 8). A1, left side (horizontal section), Dense CS axon terminal label in the dorsal horn, contralateral to the side of RF stimulation. No labeling is present on the left side, which is ipsilateral to the RF stimulation site. A2, Horizontal sections through the ipsilateral (left) and contralateral (right) motor nuclei in the ventral horn. No labeling is present in either the contralateral or ipsilateral motor nuclei. The schematic inset shows the levels of the sections. The Nissl-stained section below A2 shows the location of the marking lesion and gliosis associated with the tip of the RF stimulation electrode. B1, Horizontal section through the dorsal horn in an 8-week-old animal. Dense dorsal horn label is present contralaterally only (right side of section). Horizontal sections through the contralateral (B2) and ipsilateral (B3) motor nuclei reveal the absence of a significant label. Scale bars: A1, A2, 200 μm; A, inset, B1-B3, 1 mm.
Stimulation parameters and recording effects of stimulation. Stimulation (PT, RF, or spinal) was produced using a constant-current stimulator between one microwire and the ground wire attached to a bone screw (model 2100; AM System; biphasic stimulus, 20 μsec duration). We used 2 hr of stimulation/d (330 Hz, 20 μsec biphasic pulses, 45 msec burst duration, up to 200 μA every 2 sec) (see Table 1, Results) for the duration of the stimulation period. The animals were stimulated while in a small cage (31 × 53 × 31 cm) in the laboratory. No anesthesia or sedation was given. Generally, after a few days for acclimation, the animals' behavior during the stimulation period was rest, sleep, and play (with small cat toys placed in the cage). This is similar to their natural pattern. We have recently shown that burst stimulation of the PT can evoke peripheral motor effects (phasic forelimb nerve potentials) in kittens (Meng et al., 2004). In two animals, we recorded spinal surface potentials at the dorsal root entry zone at C6 using a silver ball electrode to determine the effects of PT stimulation in the cervical spinal cord. For these acute experiments, general anesthesia was induced with ketamine (30 mg/kg, i.m.) and xylazine (0.6-0.8 mg/kg, i.m.) and maintained using ketamine infusion (10-30 mg · kg-1 · hr-1, i.v.) The head was placed in a stereotaxic frame, and a cervical laminectomy was made, as in our previous studies (Meng and Martin, 2003; Meng et al., 2004). A pair of stainless steel electrodes separated by 2 mm, oriented in the sagittal plane, was placed in the caudal medulla 0.5 mm lateral from the midline in two animals (PWs 4 and 5), just rostral to the caudal edge of the occipital bone as in the chronic stimulation experiments. Stimulation evoked a pair of surface and deep potentials in the cervical cord at short latency. The potentials were not evoked when the electrode was raised just dorsal to the pyramid or was positioned lateral to it (Meng and Martin, 2003). The latency of the first potential increased from the fourth to the sixth cervical segment, consistent with increasing conduction time. The latency of the second potential with respect to the first was constant for different spinal levels (Meng and Martin, 2003). In these experiments, we verified that the electrode was in the PT by making a marking lesion at the end of the experiment. For these experiments, we recorded from the surface of the cord with a silver ball electrode. Filters cut signals of <100 Hz and >10 kHz. Data were acquired (Digidata; Axon Instruments, Foster City, CA) at 5 kHz in 80 msec epochs. Data were analyzed using the program Axograph (Axon Instruments). To eliminate stimulus artifacts for data presented in Figure 1, we used a fast Fourier transform with a 1 kHz cut.
Figure 1.

Evoked spinal response. An ensemble average (n = 10 trials) of a surface recording from the sixth cervical segment in a 4-week-old animal is shown. The stimulus was a train of six stimuli at 100 μA. The short vertical marks below the recording trace show the time of occurrence of each stimulus. Calibration, 20 μV.
CS axon tracing. We used two different tracers to determine the pattern of terminations from the stimulated and non-stimulated sides. We chose to use the anterograde tracers wheat germ agglutinin conjugated to horseradish peroxidase (WGA-HRP, 5%; Sigma, St. Louis, MO) to characterize connections from the stimulated side and biotinylated dextran amine (BDA, 5%; Molecular Probes, Eugene, OR), from the nonstimulated side. WGA-HRP, combined with the TMB reaction, is very sensitive (Mesulam, 1982), in our experience, more so than BDA. This difference in sensitivity precludes quantitative comparison of the density and topography of terminations mapped with each tracer. The analytical approaches we discuss below for WGA-HRP and BDA were used to compare the overall distribution of axons mapped with the same tracer only. Moreover, it should be noted that, in this study, we have no need to compare directly terminal topography measured using different tracers.
At the time of insertion of the stimulating electrode, we injected BDA into the motor cortex (MCX) on the nonstimulated side (i.e., contralateral to the stimulated PT or reticular formation, ipsilateral to the stimulated CS tract in the cord). We made a craniotomy over the lateral portion of the frontal lobe to expose the forelimb representation of the motor cortex. We pressure-injected BDA into the forelimb area of the motor cortex (between 1.5 mm below the pial surface). Up to three adjacent sites (separated by < 1 mm, 200 nl per injection) received tracer. BDA requires at least a 2 week survival period. For this reason, we injected this tracer at the time of electrode implantation. Three to four days before killing the animal, we made a craniotomy over the lateral portion of the other frontal lobe to expose the forelimb representation of the stimulated MCX. We pressure-injected WGAHRP into three adjacent sites (200 nl at each site) in the forelimb area of the motor cortex, as we did for the BDA injections. BDA and WGAHRP injections were made in homotopic cortical areas. Injections were intentionally large to label a large contingent of the cervical CS projection from the rostral and caudal sectors of the motor cortex. Despite approximately equal volumes of injected tracers, WGA-HRP produced a much larger injection site than BDA. At the time of tissue processing, BDA was present in discrete punctate injection sites (∼1 mm diameter), whereas the HRP reaction product was present throughout the sensorimotor cortex. These patterns are similar to those in our other studies (Martin et al., 1999; Li and Martin, 2001).
After appropriate survival and stimulation periods, animals were deeply anesthetized (as described earlier) and perfused transcardially with warm saline (39°C, 200-400 ml for 2 min, depending on body weight). Heparin was injected (200-500 U, i.v.) at the onset of the saline perfusion. This was followed by a mixture of 2% paraformaldehyde and 0.5% gluteraldehyde in 0.1 m phosphate buffer (PB; 4°C, pH 7.3-7.4, 1000 ml/kg body weight), infused initially at a rate of 100-200 ml/min and then adjusted to a slower rate to produce a total perfusion time of 20-30 min. The brain and spinal cord were removed, postfixed if necessary in the same fixative at 4°C for 30 min to several hours, and then transferred to 20% sucrose in PB overnight. Frozen sections (40 μm) through the C7-T1 spinal cord were cut. Typically, transverse sections were cut through the cervical enlargement, and horizontal sections were cut through the rostral cervical cord. Transverse sections were cut through the medulla for Nissl staining to identify the location of the electrode array tip and marking lesion. Parasagittal sections were cut through the cortex to identify the tracer injection sites. In the animal that had the spinal electrode, we cut transverse sections through C1-C2 for Nissl staining to identify the electrode-marking lesion. Alternate sections were processed for WGA-HRP and for BDA. For WGA-HRP, we used the modified TMB method of Mesulam (1982) (Martin et al., 1999). For BDA, we processed the tissue according to the manufacturer's specifications, using the ABC method.
Method of analyzing WGA-HRP reaction product. We used polarized dark-field microscopy to determine the amount and distribution of HRP reaction product. Using a CCD camera, an Apple (Cupertino, CA) Macintosh computer, and the program NIH Image, we measured the mean density of the labeling (i.e., mean gray scale pixel values) in the spinal gray matter. We measured labeling in the superficial dorsal horn (laminas I and II), medial dorsal horn (laminas V and VI at the level of the base of the dorsal column), intermediate zone (lamina VII), ventral horn (ventral portion of lamina VII), and motor nuclei (lamia IX). In each of the selected areas, we uniformly took several samples from homotopic bilateral locations (50 × 50 μm grid) and computed the mean labeling density for each area. For each of these areas, we computed a bilaterality index. This index corresponds to the ratio of the density of labeling on the side ipsilateral to the PT stimulation divided by the density of the labeling of the homotopic region in the side contralateral to the stimulation. A value of 1 indicated that ipsilateral and contralateral termination density is the same, whereas a value close to 0 corresponds to a predominantly contralateral termination pattern. This method of analysis is similar to one we previously used (Martin, 1996; Martin et al., 1999).
Method of analyzing BDA terminal labeling. To represent the distribution of BDA axon terminal label in the spinal gray matter, we used a camera lucida and carefully traced labeled axons at 100× (see Fig. 7). The borders of the gray matter also were drawn. To quantitatively analyze the label, we developed a method for computing mean termination density, which is similar to the method we have previously published for the HRP reaction product (Martin, 1996). First, the traced distributions of the label were scanned and converted into a black-and-white file. Next, using ImageJ for the Macintosh computer, all tracings were reduced to lines of single-pixel thickness using the skeletonize function. We generated a macro in ImageJ that divided the labeled gray matter territory into 100 × 100 μm square regions of interest (ROI). For each ROI, we computed the mean density of the label. This corresponds to the amount of label (i.e., total number of pixels) in the ROI divided by the area of the ROI. A matrix of mean label density was generated that preserved the mediolateral and dorsoventral dimensions of the topography of the label. We used the program Transform (Research Systems, Boulder, CO) first to smooth the array (one point) and then to generate a contour plot that enclosed coordinates in the matrix that contained mean label density greater then either 10 or 40% of maximal density. We used the area of the 10% contour to operationally define total label distribution and the 40% contour as the region of highest density. Conventional statistical analyses were conducted using the program StatView (SAS Institute Inc., Cary, NC) and are described in Results. This analysis effectively converted the discretely labeled profiles into a density measure. Despite similarities of the optical measurement of the HRP reaction product and digital measurement of BDA labeling density, we do not make qualitative or quantitative comparisons of results based on the two different anterograde labels and analyses.
Figure 7.

Distribution of CS terminal label from the nonstimulated side. Each diagram shows a camera lucida drawing of label in the dorsal horn and intermediate zone. The dotted line marks the approximate boundary between laminas 6 and 7. The insets show drawings of a single parasagittal section through the injection site; the arrow marks the cruciate sulcus. A, CS axon terminal label after tracer injection into the nonstimulated cortex from an animal that received PT stimulation (experiment 4).B,Asin A but for RF stimulation (experiment 6). C, Nonstimulated animal (PW 8, experiment 9). Scale bar: A-C, 1 mm; insets, 5 mm.
Results
Experimental paradigm
We stimulated CS tract axons in the PT or the spinal cord during early postnatal development. We contrast the effects of CS system stimulation on axon terminal topography with the absence of effect of stimulating the adjoining reticular formation. Unless otherwise indicated, in describing our findings, the terms contralateral and ipsilateral are used to refer to the laterality of the stimulating electrode or labeled CS axon terminals with respect to the side of the stimulated CS tract neurons in the cortex. Moreover, we refer to the CS axons on the side in which the electrode is implanted as the stimulated axons and the CS axons on the opposite side as the nonstimulated axons. The PT contains descending cortical projection axons only, most of which decussate in the medulla. However, there is a small number of ipsilaterally projecting axons in the pyramid that may cross at the level of termination in the spinal cord (Satomi et al., 1988). CS axons activated by stimulation of the dorsolateral spinal column at C1 are contralateral; however, spinal stimulation would also activate rubro-spinal fibers (McCurdy et al., 1987) and possibly other systems.
Stimulation period
We stimulated for 2-3 weeks during the early CS refinement period (PWs 3-6) or later (PWs 5-7 or to PW 8) (Table 1). The animals were killed at the end of the stimulation period. We stimulated for 2 hr each day, beginning the second postsurgical day. At both end points, the CS system has a topography similar to that in mature cats; namely, terminations are predominantly contralateral and within the dorsal horn and intermediate zone (Theriault and Tatton, 1989; Alisky et al., 1992; Martin et al., 1999). Notably, after week 6, terminations in the ipsilateral gray matter and in the motor nuclei (bilaterally) are eliminated. These two periods were chosen for two reasons. First, we aimed to determine whether stimulation during the earlier period had stronger effects than later. It was plausible that there would be less of an effect late because developing CS terminals may be less plastic. This turned out not to be the case, however. The capacity for activity-dependent plasticity appears to be high at week 5. Second, we wanted to extend the stimulation period into what our other evidence suggests is beyond the period of activity-dependent development of CS terminals; this corresponds to weeks 7 and 8 (Martin et al., 1999). Effects at all end points were qualitatively similar.
Stimulus pattern
We chose a burst stimulation pattern (330 Hz for 45 msec) on the basis of our recent findings that long stimulus trains at high frequencies are required to excite spinal neurons and produce muscle contraction in 3- to 7-week-old kittens (Meng et al., 2004). In that study, we also found that 330 Hz produces maximal summation of postsynaptic potentials, compared with higher or lower frequencies.
Stimulus threshold and duration
The current used in each animal was chosen on the basis of the threshold for evoking motor responses and the strength of the motor responses that were evoked. If a motor response was weak at threshold, we aimed to increase the current to two times the threshold to ensure more effective CS synapse activation. If the threshold response was strong, we increased the current to a level that did not upset the animal but not exceeding two times the threshold. Table 1 lists the average currents used for each animal. Each stimulus train typically evoked a movement, which was present when the animals were active or resting (see below). Reticular formation stimulation also evoked responses but at considerably lower currents (see next section).
Spinal and motor effect of PT stimulation in kittens
We have previously shown that a single PT stimulus at twice the threshold evoked a volley and a postsynaptic response, presumably monosynaptic, on the basis of timing considerations, in the cervical cord (Meng and Martin, 2003). Multiple PT stimuli evoked peripheral motor responses (Meng et al., 2004). That study did not report that multiple PT stimuli also evoked multiple PT stimuli. For this study, we conducted two experiments (at PWs 4 and 5) in which we determined the effects multiple stimuli on CS surface potentials. Figure 1 shows a representative ensemble average (n = 10 stimuli) of a spinal surface recording.
In this PW 4 animal, six stimuli were delivered at 330 Hz, which is the same frequency used in the chronic stimulation experiments, at 100 μA. This stimulus evoked an augmenting response. The response is shown at a low gain and compressed time scale; as a consequence, it is not possible to distinguish the volley and postsynaptic responses for each stimulus. Nevertheless, distinct phasic responses are evoked for each stimulus, showing the efficacy of this stimulation pattern in driving spinal activity. After the last stimulus, several late potentials can be seen. Such late potentials are occasionally evoked in young animals after single stimuli and become more robust with multiple stimuli (Meng et al., 2004) (Z. Meng and J. H. Martin, unpublished observations). Longer stimulus trains (e.g., 14 pulses, as used in this study) evoked longer and more robust spinal surface potentials, but axial muscle contraction produced spinal cord movement artifacts.
Table 1 lists the predominant movements produced by stimulation in each of the chronically stimulated animals. To show similarity in threshold, we also included data from one animal from another study in which there was an anatomically confirmed PT electrode (animal 7). For CS stimulation (PT or spinal cord), forelimb effects predominated in four of five cases. In two cases, wrist and digit effects were produced, along with more proximal forelimb effects. The effects we observed often were bilateral. However, contralateral effects were stronger with PT stimulation, and ipsilateral effects were stronger with spinal lateral column stimulation. This is consistent with the laterality of projections from the motor cortex during the ages tested, which are bilateral but denser contralaterally (Theriault and Tatton, 1989; Alisky et al., 1992). Other motor effects were often present to a variable extent and, in one animal, whole-body movements (including arm movements). The average currents for the five cats in which the CS system was stimulated (either PT or spinal cord) was 141.2 ± 16.6 μA. The high intensity is consistent with the relative immaturity of the system between PWs 3 and 8 (Meng and Martin, 2003). In contrast, brainstem stimulation outside the PT produced dominant hindlimb, neck, and ear effects at thresholds that were substantially less than those for the PT (77 and 81 μA in each of the two animals).
Continuous postnatal PT stimulation alters the topography of developing CS terminations
Postnatal CS system stimulation profoundly altered the topography of CS gray matter terminations. Figure 2A shows a transverse section though the eighth cervical segment (C8). This and all other sections showing WGA-HRP label are shown as a polarized dark-field micrograph. The CS axon label is gold; unlabeled gray matter is dark brown. The white matter appears predominantly bright white because of retroreflection of surface irregularities (i.e., texture). The PT electrode site for this experiment is shown in the Nissl-stained section in Figure 2B. The circle and arrow indicate the site of a marking lesion. The electrode tract extended to the dorsal medulla surface (data not shown). Bilateral terminations, with a higher density contralaterally, extend throughout most of the gray matter, excluding the most dorsal and ventral portions (see below). The medial portions of the dorsal horn and upper intermediate zone are heavily labeled. This bilateral distribution is present rostrocaudally. Figure 2, C and D, shows horizontal sections through the rostral portion of the cervical enlargement, showing uniformly dense terminations. (The schematic inset next to the Nissl-stained section shows planes of section in Figure 2C,D.) Of particular significance are the terminations in the lateral motor nuclei (Fig. 2D, arrows).
Stimulation of the CS tract in the lateral column produced the same pattern of terminations as with PT stimulation (Fig. 3). The insets in Figure 3A show the marking lesion made at the electrode tip and nearby gliosis and neovascularization in this region. Although the overall density of labeling was somewhat lighter than in the animal shown in Figure 2 (probably because of interanimal variability of the HRP reaction), there was bilateral labeling in the dorsal horn, intermediate zone, and ventral horn. As with PT stimulation, the density of labeling was least in the superficial dorsal laminas and most ventrally. Horizontal sections, at similar planes as Figure 2, C and D, are shown in Figure 3, B and C. The distribution is bilateral and extends into the motor nuclei (Fig. 3C).
The distributions of CS terminations in the dorsal and ventral horns for an animal in which the medullary electrode was located in the reticular formation are shown in Figure 4A. The two panels in Figure 4A1 show label in the ipsilateral (left) and contralateral (right) dorsal horn. (Schematic inset in Fig. 4 shows planes of the section.). The CS terminal label is present contralaterally only. There was no terminal label in the motor nuclei (Figure 4A2). The Nissl-stained section (Fig. 4A, inset) shows the marking lesion made through the stimulating electrode. Figure 4B presents horizontal spinal cord sections from an age-matched control; Figure 4B1, through the dorsal horn; Figure 4B2, through the contralateral motor nuclei; and Figure 4B3, through the ipsilateral motor nuclei. The distribution of labeling was the same as for the animal with RF stimulation.
Figure 5 quantifies the laterality of CS termination patterns in the various animals studied. We measured the amount of labeling in homotopic regions of the gray matter (as optical density; see Materials and Methods). We computed a bilaterality index that corresponded to the ratio of the ipsilateral to contralateral label. The inset shows the gray matter locations where we measured the density of the terminal label. The gray bars in the histogram present data from the four animals that received CS system stimulation chronically. There was a small reduction in the bilaterality index for the medial dorsal horn that was highly consistent across all animals but was not statistically significant. The open bar in Figure 5 (at the medial dorsal horn) plots data from the two animals that received reticular formation stimulation and from one age-matched control. This measurement was done only for the medial dorsal horn because that is where labeling was most dense in the three animals and could be measured automatically. The difference in the bilaterality index for the CS-stimulated animals, on the one hand, and those in which the reticular formation was stimulated or the control, on the other hand, was large. Our results indicate that bilateral labeling, as well as labeling within the motor nuclei on either side, occurred with corticospinal system stimulation only.
Figure 5.

The bilaterality index (ratio of ipsilateral to contralateral terminations) at different gray matter locations is shown for CS system stimulation (gray bars; n = 4 animals) and the combined set of control animals (white bar; n = 2 animals with RF stimulation; n = 1 age-matched control). For the CS stimulation experiments, we sampled five sites in the gray matter, as indicated in the inset: superficial dorsal horn (sDH), medial dorsal horn (mDH), intermediate zone (IZ), ventral horn (VH, i.e., territory between lateral and medial motor nuclei), and motor nuclei (MN). For the controls, only the medial dorsal horn was assessed because labeling was too light to quantitatively analyze in the other areas.
CS label density decreased dorsally and ventrally
Although CS stimulation resulted in an extraordinary termination topography, there were two areas with a low density of terminals. As can be seen in Figures 2A and 3A, labeling density decreased from the intermediate zone dorsally into lamina 1 and ventrally into the base of lamina 9. This is significant because it shows that CS system stimulation may not have as strong an effect on CS terminations in certain laminas. To study this further, we quantified the density of labeling in relation to the dorsoventral axis of the gray matter. We measured the change in the density of labeling from the region of maximal labeling in the contralateral medial dorsal horn and intermediate zone to where the label was absent (Fig. 6). Figure 6, A and C, shows the dorsal and ventral horns from one of the sections used for measuring the distribution of labeling. For this analysis, we measured optical density along a ventromedial to dorsolateral axis in Figure 6A and along a dorsomedial to ventrolateral axis in Figure 6B (Fig. 6A,C, white lines). The graphs in Figure 6, B and C, are averages from five sections. For the dorsal horn (Fig. 6B), the density decreased continuously for ∼1 mm. The lowest value corresponds to the background level of optical density. For the intermediate zone and ventral horn (Fig. 6D), label density is maintained (although lower than for the dorsal horn) until the most ventrolateral 500-600 μm. Here, too, the lowest value corresponds to background. A quantitatively similar distribution in CS axon terminal labeling was present for the case in which the CS tract was stimulated. For the two other cases, the terminal label also decreased continuously, as in Figure 6, but the density of the label was too low for automatic optical density measurement. Ipsilateral CS terminations also were least dense in the superficial dorsal horn and ventral part of the ventral horn (Figs. 2A, 3A). Because there was a gradual reduction in label density dorsally and ventrally, our finding indicate that CS terminal label density does not have a laminar distribution. Rather, other factors, such as the gradient of developmentally regulated molecules (Poh et al., 2002), may determine the dorsoventral terminal distribution.
Figure 6.

The density of labeling in CS-stimulated animals decreases gradually within the dorsal and ventral horns (experiment 2). A, C, Polarized dark-field micrographs through the dorsal and ventral horns, respectively. White lines show the axes along which label density was measured. B, D, Gradients of labeling in the dorsal and ventral horns, respectively, from a single animal. Mean values ± SE of five sections (10 samples from each section) are plotted.
Ipsilateral CS terminations from the stimulated side compete with contralateral terminations from the nonstimulated side
We next determined whether the topography of terminations from the nonstimulated side, in animals receiving CS system stimulation, was different from that of reticular formation stimulation or the normal pattern in age-matched controls. We reasoned that the presence of stimulated CS terminations in the ipsilateral dorsal horn and intermediate zone could prevent the nonstimulated CS terminations from establishing a normal pattern of projections. The nonstimulated terminations and those in an age-matched control were labeled using BDA (see Materials and Methods).
Figure 7 shows camera lucida tracings of sections through the spinal gray matter contralateral to the side of tracer injection in the motor cortex. The inset in each part shows a camera lucida drawing of the injection site. Figure 7A is from an animal that received PT stimulation; Figure 7B, from an animal that received RF stimulation; and Figure 7C, from an age-matched control. The distribution of the label in Figure 7A is shifted dorsally compared with the other groups. The horizontal dashed line indicates the approximate border between laminas 6 and 7 (Rexed, 1954). Note that virtually no label is present below this line in the CS-stimulated case. These differences were not attributable to systematic differences in the size or location of the tracer injection sites. (See insets for drawing of section through the injection; arrows show location of cruciate sulcus, with caudal to the right.) As indicated in Materials and Methods, we made several large injections in each animal (200 nl each) separated by ∼1 mm within the forelimb area of the motor cortex. These injections labeled both the rostral and caudal subregions of the motor cortex in similar manners.
We quantified differences in the size and distribution of BDA labeling using a nonbiased method (for description, see Materials and Methods). We measured the mean amount of labeling within 100 μm square regions of the gray matter. From these measurements, we conducted three analyses. First, we determined the area of a contour that enclosed regions with at least 10% of maximal mean label density. This gave an estimate of total label distribution. The differences between the values for the animals receiving CS stimulation with the control group (n = 2, RF stimulation; n = 2, age-matched controls) were not significant (CS stimulation: mean area, 0.85 ± 0.06 mm2; controls, 0.89 ± 0.09 mm2; t = 0.376; p = 0.71). Second, we determined the area of a contour that enclosed regions with at least 40% of maximal label density. This corresponds to the dense core of labeling, which tended to be more dorsally in the gray matter. As with the total distribution of the label, there was no significant difference between the CS stimulation animals (mean area, 0.35 ± 0.02 mm2) and the controls (0.38 ± 0.04 mm2; t = 0.657; p = 0.52). Third, we determined the percentage of the area of the 10% contour region (i.e., estimate of total area) that was located dorsal or ventral to the lamina 6-7 border (Fig. 7, dotted lines). For the CS stimulation animals, only 13.4 ± 2.5% of the label was located ventrally. In contrast, 32.5 ± 4.3% of the label was located ventrally in the controls. These findings show that development of the nonstimulated side was strongly affected by development of the stimulated side. These findings are consistent with the idea that the CS systems on the two sides mutually compete for termination space.
Discussion
CS system stimulation between weeks 3 and 8 had a profound impact on the topography of developing CS axon terminals, most noticeably by rescuing transient terminations. However, stimulation did not simply recapitulate the early termination pattern because the distribution and density of CS axon terminal labeling were more extensive than in the neonate. This was apparent on the ipsilateral side, where normally terminations are sparse early during development, as well as in the motor nuclei (Theriault and Tatton, 1989; Alisky et al., 1992; Li and Martin, 2000). Because CS system stimulation maintained transient terminations, their elimination normally cannot reflect the playing out of an age-dependent genetic program. Rather, these findings, together with our results using activity blockade (Martin et al., 1999) and manipulating limb use patterns (Martin et al., 2001, 2004), indicate the importance of CS system activity in shaping anatomical specification of the connections between developing CS terminals and spinal neurons.
Developing CS terminals interact with intrinsic spinal factors
Despite the extraordinary efficacy of stimulation in promoting CS axon terminal outgrowth into territories normally containing sparse transient terminations, there were clear limitations: CS termination density trailed off dorsally and ventrally. This decreasing density of CS terminations is reminiscent of the gradients of developmentally regulated molecules that are important in establishing the dorsoventral organization of the spinal gray matter (Poh et al., 2002). Recently it has been suggested that ephrin-B, together with its receptor EPH-A4, in the developing mouse ventral horn constrains development of the laterality of CS terminations (Coonan et al., 2001; Kullander et al., 2001; Yokoyama et al., 2001). The mechanism of this effect may be mediated by the neurite growth-suppressive actions of ephrins (O'Leary and Wilkinson, 1999). Our findings suggest that activity may be able to overcome such endogenous barriers. This finding points to an interplay between intrinsic factors in the spinal cord, which determine the initial termination pattern as CS axons grow into the gray matter (Stanfield, 1992), and the functional state of the motor systems.
Mechanisms for maintaining transient CS terminations and promoting growth
We think that the capacity to activate spinal neurons is essential for maintaining transient CS terminations and promoting their growth. In both developing and mature neural systems, effective activation of postsynaptic targets by presynaptic terminals leads to strengthening synapses (Bailey et al., 2000; Bi and Poo, 2001). During development, this process could be dominated by neurotrophic molecules, many of which are regulated by neural activity levels and may work as retrograde signaling molecules during long-term potentiation (LTP) (Poo, 2001). A high level of CS axon terminal activity would also be expected to promote activity-dependent uptake of factors from the target that could help maintain and grow terminals (Poo, 2001). CS axon stimulation is also expected to antidromically activate CS neurons, although this was not assessed in our experiments. This could increase neurotrophin production by CS neurons, similar to the effect of antidromic excitation of somatic motor neurons (Al-Majed et al., 2000). Thus, both the orthodromic and antidromic effects of stimulation could lead to further CS axon terminal outgrowth.
Competitive interactions between the stimulated and nonstimulated CS systems
Our findings indicate that mutual competitive interactions between the stimulated and nonstimulated sides played a key role in establishing the topographic pattern of their spinal terminations. After CS stimulation, the location of the termination field of the nonstimulated side was shifted dorsolaterally compared with that of controls or after RF stimulation. Ipsilateral terminations of the stimulated CS system were less dense in the dorsal horn, both because they were less strongly bilateral (Fig. 5, mDH), and overall density decreased farther dorsally (Fig. 6). The nonstimulated terminals were therefore better able to secure termination space within the gray matter territory that was less populated by stimulated CS terminals.
We propose that interactions between the stimulated and nonstimulated CS systems are reciprocal. Nonstimulated CS terminals in the dorsal horn make it more difficult for the stimulated CS terminals to secure synaptic space. During normal development, an equilibrium is established between overlapping CS terminations from the two sides that depends on multiple factors, including their respective levels and patterns of activity. Contralateral CS terminals are strongly selected over those from the ipsilateral cortex during normal development because (1) their density is greater initially, thereby jump-starting the projection; (2) they are active in concert with other contralateral motor pathways; and (3) they are active in association with afferent activity from the contralateral limbs. Spike timing-dependent plasticity and LTP could account for stabilizing the synapses that fire together (Bailey et al., 2000; Bi and Poo, 2001). During CS stimulation, this coordinated activity may not be necessary because the stimulus itself will lead to strong activation of spinal circuits (Porter and Lemon, 1993; Meng et al., 2004) and a cascade of intracellular events in CS neurons that could promote synapse maintenance and growth (Al-Majed et al., 2000; Poo, 2001). Nevertheless, we cannot rule out that, during CS stimulation, there is coordination between experimentally induced activity and activity in ipsilateral motor pathways (e.g., the corticoreticulospinal path) or with ipsilateral limb movements evoked by the stimulus.
Despite the effects of CS system stimulation, the terminations of the nonstimulated side were robust. The nonstimulated terminations may have been on a more equal footing with the stimulated side during the 22 hr each day when the system was not being stimulated. This could account for the finding that the size of the CS termination field of the nonstimulated side after CS stimulation was not different from that of controls or after RF stimulation. It is possible that current spread from one pyramid and stimulated axons weakly in the other pyramid. This might bolster the projection of the side indirectly activated by current spread, thereby abating somewhat activity-dependent competition from the side directly, and more strongly, stimulated by the implanted electrode. The termination pattern of the side weakly activated by current spread could reflect the combined actions of activation, which would promote terminations, and competition from the more strongly stimulated side, which would lead to eliminating terminations. Nevertheless, our findings stress that the major determinant is competition because the terminations of the side in which the PT electrode was implanted were strongly promoted at the expense of those from the other side.
Dense motor nuclei CS terminations in the cat
In cats, CS terminals within the contralateral and ipsilateral motor nuclei are normally sparse between 2 and 5 weeks and are eliminated by 6 weeks (Theriault and Tatton, 1989; Alisky et al., 1992; Martin et al., 1999). Corticomotoneuronal terminations are not present in mature cats (Baldissera et al., 1981). The absence of motor nuclear terminations in the cat contrast with their presence in rhesus monkeys, apes, and humans. How much of this difference is nature or nurture? A remarkable result of our experiments is the presence of dense terminations within the motor nuclei, both contralaterally and ipsilaterally, after CS stimulation. Because CS activity can produce this change, it is intriguing to speculate that the behavior of the developing cat, including the particular levels and patterns of motor cortex activity associated with limb control, somehow normally leads to elimination of these terminations, perhaps because corticomotoneuronal terminals are either not used or are contrary to optimal motor system function in the cat. However, the controls that prevent such terminations from becoming established in the cat may be more than just behavioral. The genetic influence may be to determine the distribution of intrinsic axon growth-inhibiting factors in the ventral horn of the cat spinal cord, which creates an environment not especially permissive to CS axon terminal growth. This discouragement can be mostly overcome by promoting CS activity. The behavioral repertoire of the kitten would not be expected to yield such high levels of activity as can be achieved with stimulation. In contrast, the monkey and human ventral horn may be more permissive to CS axon terminal growth. In the monkey, the emerging need to use its fingers could lead to protracted growth of CS projections into the motor nuclei (Kuypers, 1962; Galea and Darian-Smith, 1995; Armand et al., 1997).
Activity-dependent development of CS terminations
Earlier we showed the importance of CS system activity during postnatal development using activity blockade between weeks 3 and 8 (Martin et al., 1999). Similarly, we recently reported that preventing limb use during weeks 3 and 8 in kittens produces permanent defects in the organization of CS terminals and skilled paw use (Martin et al., 2004). Limb use patterns could shape CS neuron activity, either by feed-forward motor control or via somatic sensory feedback, to mediate activity-dependent developmental processes. CS system activity also is important for human development. Eyre et al. (2000, 2001), using transcranial magnetic stimulation, have shown that features of the normal and abnormal development of the electrophysiological properties of the CS system can be explained by activity-dependent competition between the two hemispheres.
Recently, constraint induced behavioral therapy has been used in children with cerebral palsy who have hemiplegia (Glover et al., 2002; Pierce et al., 2002; Karman et al., 2003). The effective arm is prevented from use to enhance the function of the impaired arm. In the context of our present results using stimulation and earlier results using CS activity blockade (Martin and Lee, 1999; Martin et al., 1999), the undamaged CS system is made less competitive through disuse (i.e., less CS neural activity), thereby enhancing the relative competitive capacity of the damaged side. Our findings point to a strategy whereby CS system stimulation could be used therapeutically to promote activity to enhance the absolute competitive advantage of the damaged CS system. The robust effects of postnatal CS system simulation that we have shown indicate that activity can indeed be harnessed to reshape CS system development.
Footnotes
This work was supported by National Institutes of Health Grant NS33835 (J.H.M.), the March of Dimes Birth Defects Foundation (J.H.M.), and the United Cerebral Palsy Education Foundation (I.S.). We thank Dr. Trevor Drew for help with the design of the microwires, Gary Johnson with their design and manufacture, XiuLi Wu and M. Anwar for biotinylated dextran amine and horseradish peroxidase histochemistry, Asif Maroof for help during surgeries, Germa Asfaw and Dr. M. Osman for veterinary care, Dr. Zhuo Meng for help with the spinal recordings, and Dr. Kathleen Friel for help with stimulation.
Correspondence should be addressed to Dr. John H. Martin, Center for Neurobiology and Behavior, Columbia University, 1051 Riverside Drive, New York, NY 10032. E-mail: jm17@columbia.edu.
Copyright © 2004 Society for Neuroscience 0270-6474/04/244952-10$15.00/0
References
- Alisky JM, Swink TD, Tolbert DL (1992) The postnatal spatial and temporal development of corticospinal projections in cats. Exp Brain Res 88: 265-276. [DOI] [PubMed] [Google Scholar]
- Al-Majed AA, Brushart TM, Gordon T (2000) Electrical stimulation accelerates and increases expression of BDNF and trkB mRNA in regenerating rat femoral motoneurons. Eur J Neurosci 12: 4381-4390. [PubMed] [Google Scholar]
- Armand J, Kuypers HGJM (1980) Cells of origin of crossed and uncrossed corticospinal fibers in the cat: a quantitative horseradish peroxidase study. Exp Brain Res 40: 23-34. [DOI] [PubMed] [Google Scholar]
- Armand J, Olivier E, Edgley SA, Lemon RN (1997) Postnatal development of corticospinal projections from motor cortex to the cervical enlargement in the macaque monkey. J Neurosci 17: 251-266. [DOI] [PMC free article] [PubMed] [Google Scholar]
- Bailey CH, Giustetto M, Huang YY, Hawkins RD, Kandel ER (2000) Is heterosynaptic modulation essential for stabilizing Hebbian plasticity and memory? Nat Rev Neurosci 1: 11-20. [DOI] [PubMed] [Google Scholar]
- Baldissera F, Hultborn H, Illert M (1981) Integration in spinal neuronal systems. In: Handbook of physiology, Section I, The nervous system, Vol II, Motor control (Brooks VB, ed), pp 509-596. Bethesda, MD: American Physiological Society.
- Bi G, Poo M (2001) Synaptic modification by correlated activity: Hebb's postulate revisited. Annu Rev Neurosci 24: 139-166. [DOI] [PubMed] [Google Scholar]
- Coonan JR, Greferath U, Messenger J, Hartley L, Murphy M, Boyd AW, Dottori M, Galea MP, Bartlett PF (2001) Development and reorganization of corticospinal projections in EphA4 deficient mice. J Comp Neurol 436: 248-262. [PubMed] [Google Scholar]
- Eyre JA, Miller S, Clowry GJ, Conway EA, Watts C (2000) Functional corticospinal projections are established prenatally in the human foetus permitting involvement in the development of spinal motor centres. Brain 123: 51-64. [DOI] [PubMed] [Google Scholar]
- Eyre JA, Taylor JP, Villagra F, Smith M, Miller S (2001) Evidence of activity-dependent withdrawal of corticospinal projections during human development. Neurology 57: 1543-1554. [DOI] [PubMed] [Google Scholar]
- Galea MP, Darian-Smith I (1995) Postnatal maturation of the direct corticospinal projections in the macaque monkey. Cereb Cortex 5: 518-540. [DOI] [PubMed] [Google Scholar]
- Glover JE, Mateer CA, Yoell C, Speed S (2002) The effectiveness of constraint induced movement therapy in two young children with hemiplegia. Pediatr Rehabil 5: 125-131. [DOI] [PubMed] [Google Scholar]
- Karman N, Maryles J, Baker RW, Simpser E, Berger-Gross P (2003) Constraint-induced movement therapy for hemiplegic children with acquired brain injuries. J Head Trauma Rehabil 18: 259-267. [DOI] [PubMed] [Google Scholar]
- Konczak J, Borutta M, Topka H, Dichgans J (1995) The development of goal-directed reaching in infants: hand trajectory formation and joint torque control. Exp Brain Res 106: 156-168. [DOI] [PubMed] [Google Scholar]
- Kullander K, Croll SD, Zimmer M, Pan L, McClain J, Hughes V, Zabski S, DeChiara TM, Klein R, Yancopoulos GD, Gale NW (2001) Ephrin-B3 is the midline barrier that prevents corticospinal tract axons from recrossing, allowing for unilateral motor control. Genes Dev 15: 877-888. [DOI] [PMC free article] [PubMed] [Google Scholar]
- Kuypers HGJM (1962) Corticospinal connections: postnatal development in the rhesus monkey. Science 138: 676-678. [DOI] [PubMed] [Google Scholar]
- Li Q, Martin JH (2000) Postnatal development of differential projections from the caudal and rostral motor cortex subregions. Exp Brain Res 134: 187-198. [DOI] [PubMed] [Google Scholar]
- Li Q, Martin JH (2001) Postnatal development of corticospinal axon terminal morphology in the cat. J Comp Neurol 435: 127-141. [DOI] [PubMed] [Google Scholar]
- Li Q, Martin JH (2002) Postnatal development of connectional specificity of corticospinal terminals in the cat. J Comp Neurol 447: 57-71. [DOI] [PubMed] [Google Scholar]
- Martin JH (1996) Differential spinal projections from the forelimb areas of the rostral and caudal subregions of primary motor cortex in the cat. Exp Brain Res 108: 191-205. [DOI] [PubMed] [Google Scholar]
- Martin JH, Lee S (1999) Activity-dependent competition between developing corticospinal terminations. NeuroReport 10: 2277-2282. [DOI] [PubMed] [Google Scholar]
- Martin JH, Kably B, Hacking A (1999) Activity-dependent development of cortical axon terminations in the spinal cord and brain stem. Exp Brain Res 125: 184-199. [DOI] [PubMed] [Google Scholar]
- Martin JH, Li Q, Pullman S (2001) Corticospinal development in cats depends on motor experience. Soc Neurosci Abstr 27: 467.6. [DOI] [PMC free article] [PubMed] [Google Scholar]
- Martin JH, Choy M, Pullman S, Meng Z (2004) Corticospinal development depends on motor experience. J Neurosci 24: 2122-2132. [DOI] [PMC free article] [PubMed] [Google Scholar]
- McCurdy ML, Hansma DI, Houk JC, Gibson AR (1987) Selective projections from the cat red nucleus to digit motor neurons. J Comp Neurol 265: 367-379. [DOI] [PubMed] [Google Scholar]
- Meng Z, Martin JH (2003) Postnatal development of corticospinal synaptic actions. J Neurophysol 90: 683-692. [DOI] [PubMed] [Google Scholar]
- Meng Z, Li Q, Martin JH (2004) The transition from development to motor control function in the corticospinal system. J Neurosci 24: 605-614. [DOI] [PMC free article] [PubMed] [Google Scholar]
- Mesulam M-M (1982) Principles of horseradish peroxidase neurohisto-chemistry and their applications for tracing neural pathways: axonal transport, enzyme histochemistry, and light microscopic analysis. In: Tracing neural connections with horseradish peroxidase (Mesulam M-M, ed), pp 1-151. New York: Wiley.
- O'Leary DD, Wilkinson DG (1999) Eph receptors and ephrins in neural development. Curr Opin Neurobiol 9: 65-73. [DOI] [PubMed] [Google Scholar]
- Palmer C (1978) A microwire technique for recording single neurons in unrestrained animals. Brain Res Bull 3: 285-289. [DOI] [PubMed] [Google Scholar]
- Pierce SR, Daly K, Gallagher KG, Gershkoff AM, Schaumburg SW (2002) Constraint-induced therapy for a child with hemiplegic cerebral palsy: a case report. Arch Phys Med Rehabil 83: 1462-1463. [DOI] [PubMed] [Google Scholar]
- Poh A, Karunaratne A, Kolle G, Huang N, Smith E, Starkey J, Wen D, Wilson I, Yamada T, Hargrave M (2002) Patterning of the vertebrate ventral spinal cord. Int J Dev Biol 46: 597-608. [PubMed] [Google Scholar]
- Poo MM (2001) Neurotrophins as synaptic modulators. Nat Rev Neurosci 2: 24-32. [DOI] [PubMed] [Google Scholar]
- Porter R, Lemon R (1993) Corticospinal function and voluntary movement. Oxford: Oxford Science.
- Rexed B (1954) The cytoarchitectonic organization of the spinal cord in the cat. J Comp Neurol 100: 297-379. [DOI] [PubMed] [Google Scholar]
- Rose GH, Goodfellow EF (1973) A stereotaxic atlas of the kitten brain. Los Angeles: Brain Information Service/Brain Research Institute, University of California.
- Satomi H, Takahashi K, Aoki M, Kosaka I (1988) Anatomical evidence for the re-crossing of lateral corticospinal fibers via the posterior gray commissure in the cat spinal cord. Neurosci Lett 88: 157-160. [DOI] [PubMed] [Google Scholar]
- Stanfield BB (1992) The development of the corticospinal projection. Prog Neurobiol 38: 169-202. [DOI] [PubMed] [Google Scholar]
- Theriault E, Tatton WG (1989) Postnatal redistribution of pericruciate motor cortical projections within the kitten spinal cord. Dev Brain Res 45: 219-237. [DOI] [PubMed] [Google Scholar]
- Yokoyama N, Romero MI, Cowan CA, Galvan P, Helmbacher F, Charnay P, Parada LF, Henkemeyer M (2001) Forward signaling mediated by ephrin-B3 prevents contralateral corticospinal axons from recrossing the spinal cord midline. Neuron 29: 85-97. [DOI] [PubMed] [Google Scholar]