Abstract
Vasopressin secreting neurons of the rat hypothalamus discharge lengthy, repeating bursts of action potentials in response to physiological stress. Although many electrical currents and calcium-dependent processes have been isolated and analyzed in these cells, their interactions are less well fathomed. In particular, the mechanism of how each burst is triggered, sustained, and terminated is poorly understood. We present a mathematical model for the bursting mechanism, and we support our model with new simultaneous electrical recording and calcium imaging data. We show that bursts can be initiated by spike-dependent calcium influx, and we propose that the resulting elevation of bulk calcium inhibits a persistent potassium current. This inhibition depolarizes the cell above threshold and so triggers regenerative spiking and further calcium influx. We present imaging data to show that bulk calcium reaches a plateau within the first few seconds of the burst, and our model indicates that this plateau occurs when calcium influx is balanced by efflux and uptake into stores. We conjecture that the burst is terminated by a slow, progressive desensitization to calcium of the potassium leak current. Finally, we propose that the opioid dynorphin, which is known to be secreted from the somatodendritic region and has been shown previously to regulate burst length and phasic activity in these cells, is the autocrine messenger for this desensitization.
Keywords: mathematical model, bursting, vasopressin, dynorphin, Hodgkin-Huxley, calcium imaging, neurosecretion
Introduction
Arginine vasopressin (AVP) magnocellular neurosecretory cells (MNCs) of the supraoptic nucleus (SON) are neurons that project from the hypothalamus to the neurohypophysis, where they release the hormone AVP directly into the blood. Release is caused by the invasion of the neuronal terminal by an action potential, and the resulting depolarization triggers the exocytotic release of a small quantity of peptide (Mikiten and Douglas, 1965).
Most AVP MNCs in the unstimulated rat display a Poisson-distributed, slow (<2 Hz), irregular firing pattern; however, a small proportion (∼10%) fire phasically and discharge repeating bursts of action potentials (Poulain et al., 1977). Furthermore, in response to blood loss (Wakerley et al., 1975), progressive dehydration (Wakerley et al., 1978), or hypertonic saline injection (Brimble and Dyball, 1977), almost all AVP cells cease irregular firing and adopt the phasic pattern. This transition is maintained in vitro and hypothalamic explant preparations exhibit increased phasic activity when the osmotic pressure of the perfusion media is raised (Bourque and Renaud, 1984). Although a few oxytocin (OT) MNCs also fire phasically (Lincoln and Wakerley, 1974; Armstrong et al., 1994; Moos and Ingram, 1995), this discharge is preferentially displayed by AVP cells, and dehydration typically induces a faster (>4 Hz) and more regular discharge in nonphasic OT cells (Wakerley et al., 1978).
The phasic bursting of AVP cells is markedly different from the more common short bursts seen in other cells (Wang and Rinzel, 1995) and is composed of bursts that last for tens of seconds to 1 min or more and are separated by silences of similar duration. Furthermore, single bursts can be evoked in nonphasic AVP cells, both in vivo and in vitro, by triggering brief spike trains with short depolarizing pulses (see Fig. 1) (Andrew and Dudek, 1984a), by antidromic stimulation (Dreifuss et al., 1976; Armstrong and Sladek, 1985), and also by clusters of excitatory synaptic events (Dudek and Gribkoff, 1987). If the holding potential is well below spike threshold, then evoked bursts rarely repeat, but instead, the basal, slow-irregular, firing pattern reappears once the burst is ended.
Figure 1.
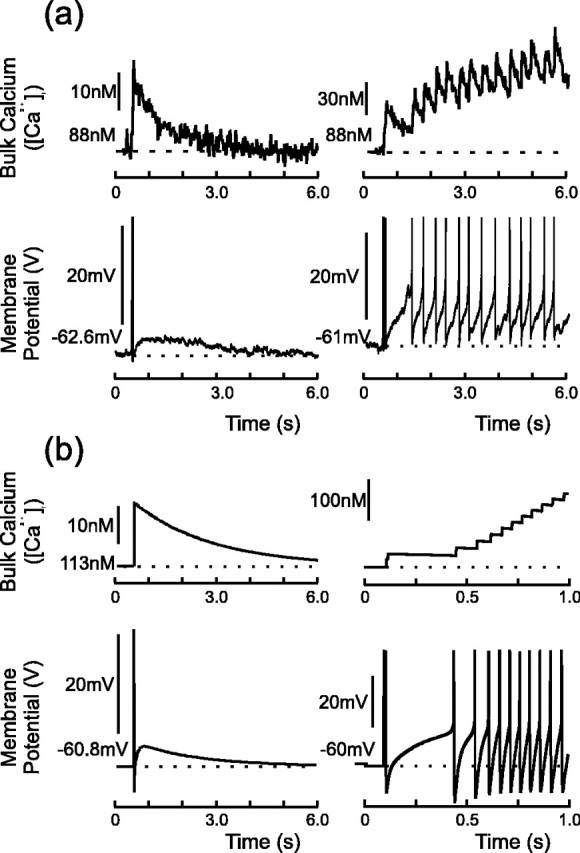
Experimental (a) and model (b) DAPs and their associated calcium transients. Data taken from a whole-cell recording from the SON of a hypothalamic slice; spikes were evoked with a 5 msec depolarizing pulse and have been truncated for clarity. Left panels, Single spike followed by a DAP that is subthreshold for firing. The decay of the DAP tracks that of intracellular calcium, returning to rest with a time constant of τ = ∼1.85 sec (Roper et al., 2003). Right panels, DAP summation and the initiation of phasic activity: the stimulation protocol elicits two spikes, and the resulting summed DAP crosses spike threshold. The consequent action potentials further raise intracellular calcium, which in turn maintains the suppression of IK,leak and so supports a regenerative plateau potential.
Here we extend our mathematical model of MNC electrical activity (Roper et al., 2003) to investigate evoked and endogenous phasic activity in an AVP cell, and we support our model with simultaneous electrical recording and calcium fluorescence imaging. We show first that each burst is supported by the regenerative activation of a calcium- and voltage-dependent depolarizing afterpotential (the DAP) and second that burst termination can occur via desensitization of the DAP to intracellular calcium. Following the experimental findings of Brown and colleagues (Brown et al., 1998, 1999, 2000; Brown and Leng, 2000), we investigate how the opioid dynorphin (which is colocalized with AVP and released from the somatodendritic region) may regulate phasic firing by autoinhibition of the DAP mechanism during activity.
First, we explore the progression of a single evoked burst in a nonphasic cell that is firing in the basal, slow-irregular pattern (Andrew and Dudek, 1984a). We show that such bursts can be reproduced by a model comprising a spiking mechanism coupled to a slow oscillation of the basal membrane potential (cf. Rinzel and Lee, 1987). We further show that the oscillation can best be explained by an initial Ca2+-mediated inhibition of a persistent K+ current that subsequently reactivates via a desensitization to calcium. We extend our model to analyze the repetitive bursting observed in phasic cells, and finally we discuss alternative mechanisms for phasic activity in SON MNCs.
Parts of this work have been published previously in abstract form (Roper et al., 2001).
Materials and Methods
Electrophysiology. We used whole-cell recordings to demonstrate aspects of phasic activity tested in the model, using techniques similar to those described by Stern et al. (1999). Virgin adult female rats (random cycling) were deeply anesthetized with sodium pentobarbital (50 mg/kg, i.p.) and perfused through the heart with cold medium in which NaCl was replaced by an equiosmolar amount of sucrose. Slices were cut at 300 μm on a vibrating microtome [VSL (Campden Instruments, Loughborough, UK) or VT1000S (Leica, Nussloch, Germany)]. The slice incubation medium consisted of the following (in mm): 25 NaHCO3, 3 KCl, 1.24 NaH2PO4, 124 NaCl, 10 glucose, 2 CaCl2, 1.3 MgCl2, and 0.2 ascorbic acid. The medium was saturated with 95% O2–5% CO2, with a pH of 7.3–7.4 and an osmolality of 290–300 mOsm/kg H2O; it was warmed to 33–34°C. Whole-cell, tight-seal configurations were made under visual guidance. Current-clamp recordings were made with either an Axopatch 200B or 700A amplifier (Axon Instruments, Foster City, CA) and digitized at 10 kHz using either a Digidata 1320A or 1322A (Axon Instruments). Pipettes were filled with a solution consisting of the following (in mm): 140 K-gluconate, 4 NaCl, 8.2 KCl, 0.6 MgCl, 10 HEPES, 4 Mg-ATP, 0.3 Na-GTP, and 0.2 EGTA, pH 7.4.
Calcium imaging. The details of the calcium imaging procedures are described by Roper et al. (2003) and are similar to those described by Wilson and Callaway (2000). Slices (300 μm) through the SON of adult, virgin female rat brains were made after anesthesia and perfusion as described above. The slices were imaged on an Olympus Optical (Tokyo, Japan) BX50WI microscope using a 40× water immersible lens (0.8 numerical aperture). The pipette filling solution consisted of the following (in mm): 140 K-gluconate, 4 NaCl, 4 KCl, 10 HEPES, 1 Mg-ATP, 1.0 Na-ATP, 0.3 Na-GTP, and 0.1 fura-2 (pentapotassium salt), pH 7.4. The extracellular solution was as described above. Whole-cell recordings were made with a Neurodata Instruments (New York, NY) IR283 intracellular recording bridge amplifier. High-speed fura-2 fluorescence images were obtained using the Imago Sensicam (T.I.L.L. Photonics, Planegg, Germany), with a 12-bit, 640 × 480 chip (readout rate of 12.5 MHz; scale, 0.246 μm/pixel with the 40× objective). For excitation, light of either 340 or 380 nm was provided by a Polychrome II monochromometer (T.I.L.L. Photonics) controlled with analog voltage commands and using a Hammamatsu L2841-01 75W mercury–xenon arc lamp. The frame rate was 40–50 Hz, and pixels were typically binned (4 × 4) to increase the signal-to-noise ratio. Software for data acquisition and analysis is based on that developed and described by Lasser-Ross et al. (1991) and modified by J. Callaway and allowed simultaneous recording of electrical and fluorescence signals from a ComputerBoards (Middleboro, MA) 16-bit analog-to-digital board.
Changes in bulk calcium ([Ca2+]i) were estimated by measuring the change in fluorescence intensity at 380 nm (ΔF) divided by a baseline fluorescence (F) to obtain the fractional change in [Ca2+]i, ΔF/F. Baseline fluorescence was first corrected for tissue autofluorescence by subtracting the background fluorescence from a region near the filled cell. The value ΔF/F was further corrected for bleaching during an exposure by subtracting time-matched, filtered (3 Hz) control curves of F at a hyperpolarized holding potential (–70 mV), at which no calcium entry could be detected.
The baseline of [Ca2+]i = 113 nm used in this study was estimated from 45 neurons as reported by Roper et al. (2003) using the ratioing method of Grynkiewicz et al. (1985) with the following formula:
 |
(1) |
where R is the 340/380 nm intensity ratio in the neuron corrected for background fluorescence at each wavelength, and Rmin and Rmax are the minimum and maximum ratios from a calibration done on this setup using fura-2 (Molecular Probes, Eugene, OR) dissolved in our K-gluconate patch solution, pH 7.4. The calibration produced a Kd for fura-2 of 226 nm, Rmin of 0.416, Rmax of 10.37, and F380max/F380min of 9.32. The change in Ca2+ to a stimulus was then calculated from ΔF/F using the following formula, derived by Wilson and Callaway (2000):
 |
(2) |
where [Ca2+]rest is the resting level measured in that neuron. This formula did not require obtaining a maximal fluorescence change (i.e., by calcium loading). In the text, all experimental results will be cited as mean ± SD. As a consequence of the lengthy bursts exhibited by these neurons (typical durations are tens of seconds), we were limited to the simultaneous recordings of [Ca2+]i and electrical activity during only single bursts in a single trace. In addition, this limitation has precluded us from measuring the time constant of [Ca2+]i decay after a burst, but we showed previously (Roper et al., 2003) that the calcium transient evoked by a lengthy spike train decays monoexponentially with time constant τ = 2.33 sec.
Mathematical model. In Roper et al. (2003), we presented a Hodgkin–Huxley model for evoked action potentials and their associated after-potentials of both oxytocin and vasopressin neurons of the SON. Here we extend that model and use the framework to analyze intrinsic phase activity occurring in AVP cells. For a complete description of the vasopressin cell model and our choice of parameters, see Roper et al. (2003). Briefly, we model the electrical activity as a single compartment with the following: a fast sodium current (INa); a delayed rectifier (IK); an A-current (IA); two calcium-dependent potassium currents (Ic and IAHP); a calcium current (ICa); and a leak current (Ileak). Electrical activity is described by a Hodgkin-Huxley-type system:
 |
(3) |
where  represents the cellular capacitance, and the voltage- and calcium-dependent currents (Iγ, (γ = Na, K,...)) have the standard activation–inactivation form:
 |
(4) |
Iapp denotes the effects of an applied current. gγ is the conductance associated with current Iγ, and the ionic species carried by the current has reversal potential Erev. Any activation [e.g., m(t)] or inactivation [h(t)] function x(t) evolves to its equilibrium state x∞ with time constant τx, according to:
 |
(5) |
and parameters are tabulated in Appendix.
We model the spatial evolution of calcium within the cell with three separate compartments, [Ca]BK, [Ca]SK, and [Ca2+]i, and we have previously motivated this model (Roper et al., 2003). The first two compartments model calcium domains that activate Ic and IAHP, respectively, and the latter represents the bulk calcium concentration. The fine details of the evolutions of [Ca]BK and [Ca]SK are not germane to the model for phasic bursting presented here, and so, although they have been included for completeness, only the evolution of [Ca2+]i will be discussed. We showed previously (Roper et al., 2003) that calcium only rises in response to an action potential and that there is little, if any, subthreshold calcium entry; thus, we assumed that [Ca2+]i is only increased by influx through high-voltage-activated calcium channels. However, our model could easily be extended to include other spike-dependent calcium sources, such as calcium-induced calcium release (Li and Hatton, 1997a), without affecting our main conclusions.
Each compartment is disjoint, and its concentration evolves according to Plant (1978):
 |
(6) |
where the subscript γ labels the pool of calcium, so that γ = {BK, SK, i}; Cγ ≡ [Ca2+]γ denotes the concentration of calcium in that pool; αγ relates the amplitude of the calcium current to calcium influx and also reflects the size of each pool; the time constant τγ approximates the buffering and diffusion processes that return the calcium transient to rest; and Cr (= 113 nm) denotes the measured basal calcium concentration (Roper et al., 2003). To better fit calcium concentration levels arising during lengthy bursts, we decreased αi by ∼30% (here αi = 0.9) from the value that we used previously (Roper et al., 2003). That model was fit to the calcium increase after a single spike; however, we also found that [Ca2+]i summed nonlinearly after multiple spikes, and the present choice for αi is fit to this summation. This parameter change is the sole difference between the two models.
The depolarizing afterpotential. Each action potential is succeeded by a lengthy voltage- and Ca2+-dependent depolarizing overshoot of the membrane potential (Andrew and Dudek, 1983). This DAP depolarizes the cell by ∼3 mV, lasts for ∼5 sec, and briefly elevates the probability that incident excitation will trigger a second spike. The DAP is caused, and sustained, by the transient [Ca2+]i elevation that follows each spike (Roper et al., 2003), and DAPs evoked by two or more proximal spikes sum to a significantly larger depolarization, as shown in Figure 1. We have shown previously that the time course of the DAP is closely matched to the decay of bulk calcium (Roper et al., 2003).
The DAP is thought (Li and Hatton, 1997b) to be caused by the calcium- and voltage-dependent modulation of a K+ leak conductance (but see Ghamari-Langroudi and Bourque, 2002). Our previous model (Roper et al., 2003) described the DAP by subdividing Ileak into two linear components: a Na+ leak (I) and a K+ leakNa,leak (IK,leak). We then allowed IK,leak to vary as a function of both the bulk calcium concentration, [Ca2+]i, and also the membrane potential, V, so that:
 |
(7) |
where C ≡ [Ca2+]i, and so
 |
(8) |
Although the factor (1 – f(C, V)) describes the calcium- and voltage-dependent modulation of a K+ leak conductance, it is perhaps simpler to think of f(C, V) as being an activation function for the DAP. f(C, V) is given by:
 |
(9) |
where λ and Γ are constants, with λ + Γ = 1, that account for the possibility that IK,leak is only partially inhibited. Unless otherwise stated, for concreteness, we used λ = 0, Γ= 1. p evolves according to Equation 5 to its equilibrium state:
 |
(10) |
with time constant τp = 70 msec, and the voltage-dependent term, q∞(V), activates instantaneously and is given by the following:
 |
(11) |
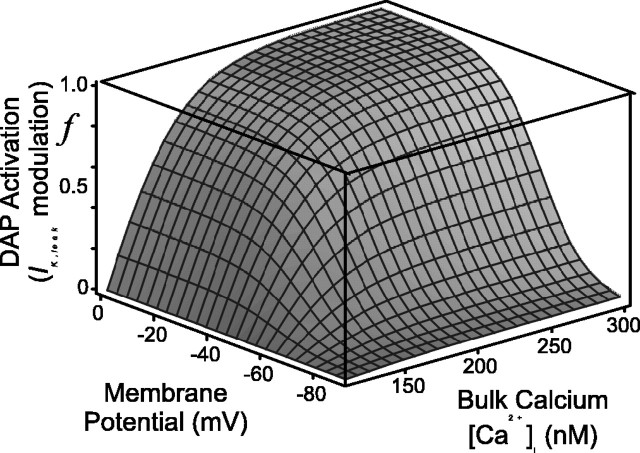
The mean resting calcium concentration was found to be [Ca2+]rest = 113 nm (Roper et al., 2003). kp = 50 nm, kq = 8 mV quantify the sensitivity of the channel to calcium and voltage, respectively; the half-activation is Vb =–60 mV, and each has been chosen to fit to data. The steady-state activation f∞(C, V) is plotted in Figure 2, and note that for this choice for p∞, f∞ is zero when bulk calcium is at rest and increases with [Ca2+]i. Also note that p∞ can go negative if [Ca2+]i is brought below rest, and so IK,leak can be both upregulated and downregulated by intracellular calcium.
Figure 2.
Putative steady-state voltage- and calcium-dependent modulation of the potassium leak current, IK,leak. Note that f∞ is zero when bulk calcium is at its resting level ([Ca2+]rest = 113 nm), increases with [Ca2+]i, but can go negative if [Ca2+]i is brought below rest (Eq. 10 and Fig 6).
These functions have been adjusted to give activity commensurate with experiment, and reasons for their choices have been discussed previously (Roper et al., 2003). However, a similar functional form to p∞ has been determined for the calcium dependence of a K+ leak conductance in rat hippocampal pyramidal cells (Selyanko and Sim, 1998).
Numerical methods. Numerical simulations were performed using the differential equation solver XPPaut (Ermentrout, 2002) (available at http://www.math.pitt.edu/~bard/xpp/xpp.html), and several different integration algorithms (e.g., backwards Euler, Dormund-Prince, and CVode) and time steps were used to check accuracy and stability.
Results
We will first examine the progression of a single, evoked burst in a cell that is otherwise not firing phasically. Such bursts can be evoked, both in vivo and in vitro, by antidromic stimulation, by brief spike trains triggered by short depolarizing pulses, and also by clusters of excitatory synaptic events (see Introduction). Although the present model includes neither synaptic input nor a mechanism for antidromic activation, current pulses can be injected by choosing a suitable protocol for the applied current, Iapp.
An example of burst initiation by consecutively evoked spikes is shown in the right panels of Figure 1a, and it is clear that the summed DAP steadily depolarizes the cell until it crosses spike threshold and starts to fire repetitively. The burst then remains active for many seconds after the end of the stimulus (see Fig. 3), indicating that it is driven by a mechanism intrinsic to the cell.
Figure 3.
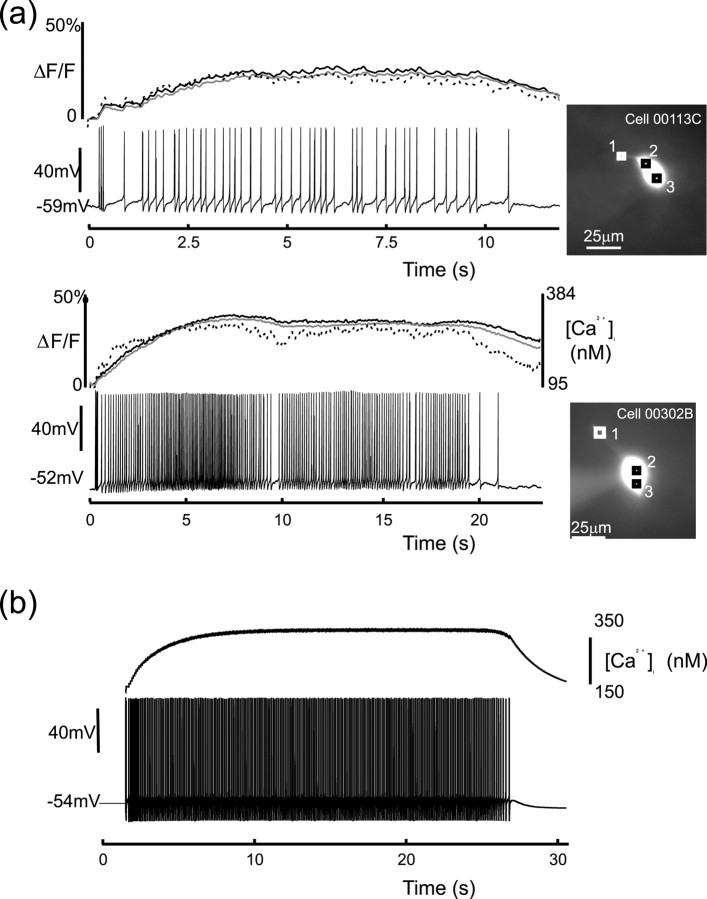
Simultaneous whole-cell recording and calcium imaging of evoked bursts in vivo (a), and model of evoked burst with corresponding calcium concentration (b). Note that calcium initially rises rapidly until it approaches a steady state and then decays once electrical activity has ceased. The top trace in each experimental figure plots the calcium concentration at three different locations in each cell, and these locations are shown in the photographs to the right of each figure. The trace that corresponds to each position is as follows: dashed line (1), black line (2), and gray line (3).
Burst initiation and the plateau potential
Each burst is sustained by a slow, persistent depolarization, termed the plateau potential (Andrew and Dudek, 1983), which is initiated at the beginning of the burst, lingers for several hundred milliseconds after its termination, and can also be activated by calcium spikes evoked during TTX perfusion (Andrew, 1987). The plateau is spike dependent and regenerative and is triggered by the summation of DAPs (Andrew and Dudek, 1984a) during low-frequency (<10 Hz) firing.
The DAPs that follow two or more closely spaced spikes sum to a much larger afterpotential, and the resulting depolarization can take the cell above spike threshold, as shown in the bottom right panel of Figure 1a. In the model, the DAP summates for two reasons. The first is simply that the increase in bulk calcium after multiple spikes more fully inhibits IK,leak (Fig. 2) and so more strongly depolarizes the cell. The second reason is that the voltage dependence of f(C, V) can further bootstrap the [Ca2+]i-induced depolarization. If the resulting summed DAP is then sufficient to carry the cell above spike threshold, the consequent action potential brings in more calcium, and this in turn elicits another DAP. The process then repeats, and this spike-dependent, positive feedback appears as a sustained plateau potential which supports repetitive spiking (Andrew and Dudek, 1983).
Figure 3a shows simultaneous whole-cell recording and calcium imaging of two evoked bursts, each of which is initiated by the summation of three DAPs. The top trace in each figure plots the calcium concentration at three different locations in each cell and shows that [Ca2+]i initially rises as the burst develops. After several seconds of activity, but long before termination, calcium attains a plateau that is typically >200 nm above rest. [Ca2+]i subsequently remains close to this plateau for the remainder of the burst and only decays when firing ceases. In the model, shown in Figure 3b, the calcium plateau arises when influx is balanced by clearance and is typically >150 nm suprathreshold for DAP activation. The elevated calcium during the burst thus saturates the suppression of IK,leak and so sustains the regenerative plateau throughout.
Burst structure
Intrinsic bursts show strong spike frequency adaptation (Fig. 4a) (Poulain et al., 1988, their Fig. 11), and, after an initial rapid acceleration to ∼30 Hz, the firing rate gradually decreases to ∼10 Hz (Andrew and Dudek, 1984a) and then remains steady until the end of the burst, as shown in Figure 4a. The firing rate does slow during the final few spikes of the burst (Fig. 5), but termination is otherwise abrupt (Dyball, 1988) and is not correlated with any further adaptation.
Figure 4.
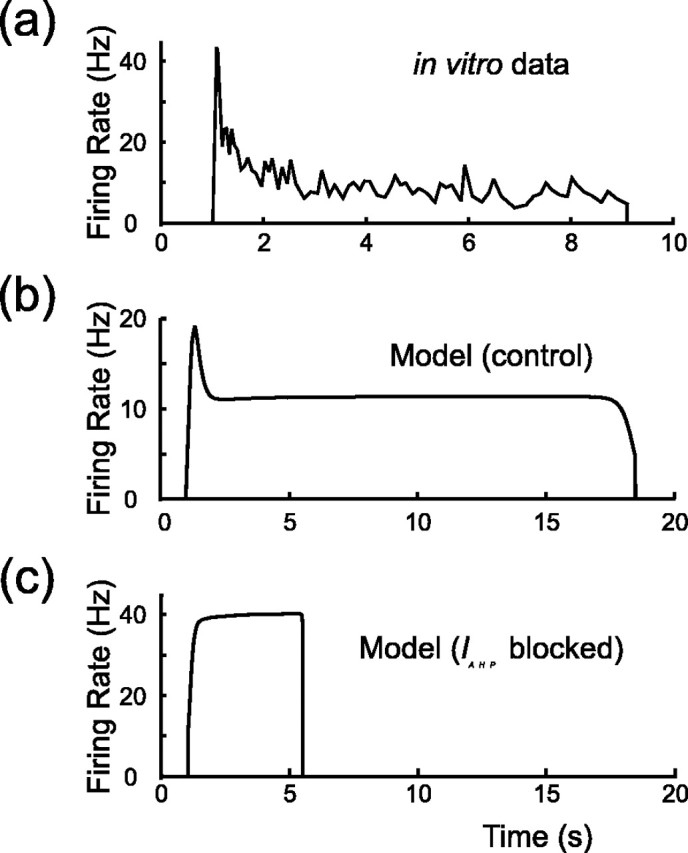
Instantaneous firing rate (quantified by the reciprocal of the interspike interval) versus time for experimental recording (a) and model (b) (compare with Poulain et al., 1988, their Fig. 11). Note that the rate first rises rapidly to a peak and then slowly adapts to ∼10 Hz. Firing then remains steady until the burst abruptly terminates. c shows that blocking the AHP in the model, by setting IAHP = 0, both prevents spike frequency adaptation and also shortens the burst. This should be compared with block of the AHP in vitro with apamin [Kirkpatrick and Bourque (1996), their Fig. 7]. Parameters of the model are otherwise the same for b and c.
Figure 11.
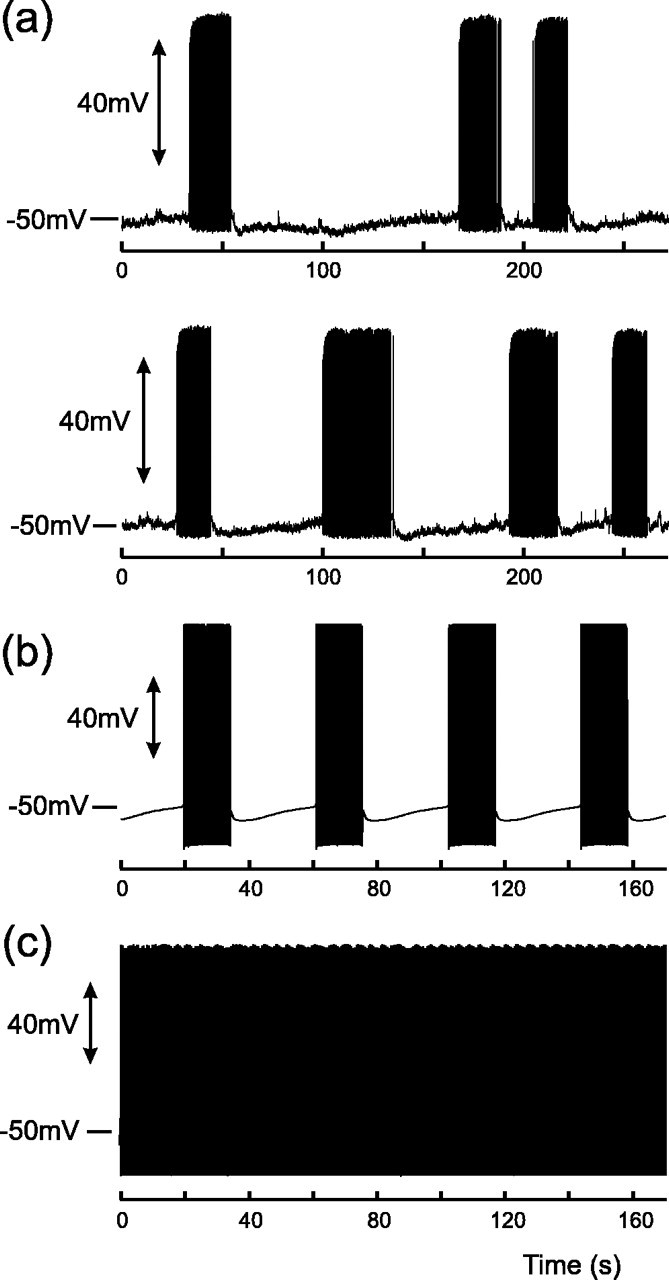
Phasic activity occurs in MNCs during sustained depolarization: experimental recordings (a) and model (b). Note that the silent phase is characterized first by postburst DAP and then by slow depolarization. Both active and silent phases of the burst have a mean length of ∼20 sec (see Results) but display a wide variability both in vitro and in vivo. Model parameters are Iapp = 1.28, λ = 0.6, and Γ = 0.4. Phasic activity only occurs when the model is depolarized above spike threshold, and the oscillation is driven by an upregulation of IK,leak, which transiently depresses V below threshold and interrupts firing. c, Model with same parameters as b, but the DAP has been “blocked” by setting f = 0, and the model fires continuously (cf. Ghamari-Langroudi and Bourque, 1998).
Figure 5.
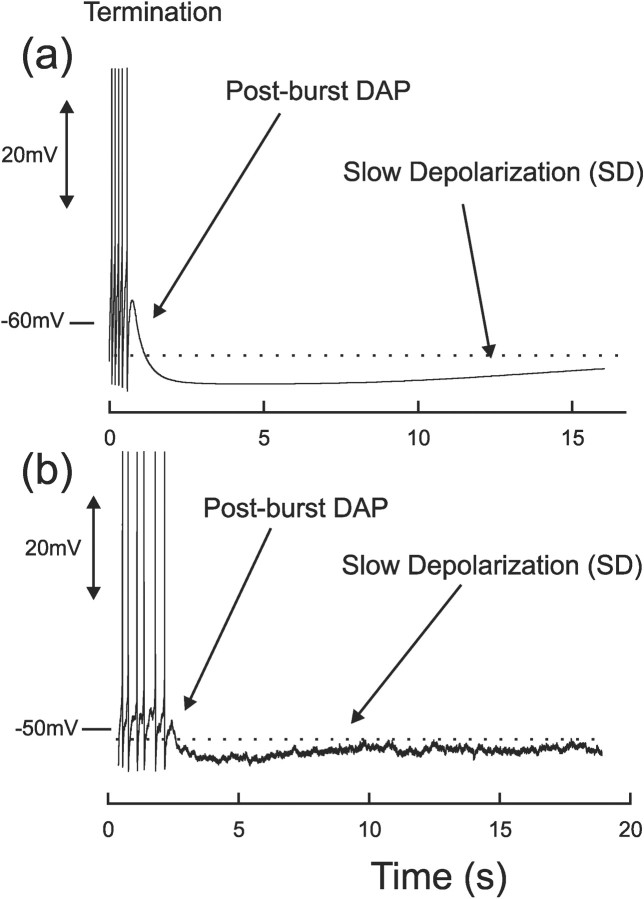
Burst termination and the interburst period: model (a) and whole-cell electrode recording from the SON of a hypothalamic slice (b). Note that the firing frequency remains steady until the end of the burst. The final spikes are succeeded first by a postburst DAP, which in turn is followed by a lengthy slow depolarization. The experimental trace has been low-pass filtered to remove membrane noise and to make the general trend more evident. Spikes have been trimmed for clarity.
Spike frequency adaptation during a burst can be abolished by application of 50–300 nm apamin (Bourque and Brown, 1987; Kirkpatrick and Bourque, 1996). This toxin is a specific blocker of SK channels, derived from bee venom, and so adaptation is caused by the progressive activation of an SK-like afterhyperpolarization (AHP) current (IAHP) (Andrew and Dudek, 1984b; Bourque and Brown, 1987). The model also shows spike frequency adaptation (Fig. 4b), and the effects of apamin on spike frequency adaptation can be simulated by setting IAHP to zero, as shown in Figure 4c.
Burst termination
The end of the burst is associated with a momentary decrease of the firing rate, after which firing abruptly halts. Once the electrical activity has ceased, the plateau quickly collapses and the membrane repolarizes (Andrew and Dudek, 1984a), as shown in Figure 5. The cause of termination has not yet been established, although an accumulation of [Ca2+]i and the subsequent activation of a hyperpolarizing calcium-dependent potassium AHP current has been proposed (Poulain and Vincent, 1987; Cobbett et al., 1988; Hlubek and Cobbett, 2000) (cf. Plant, 1978). However, block of the AHP current with apamin decreases, rather than increases, the burst length (Fig. 4c) (Kirkpatrick and Bourque, 1996), and, furthermore, the time course of spike frequency adaptation indicates that it is strongly activated early, rather than late, in the burst. Although AVP neurons probably have an even slower, apamin-insensitive, calcium-dependent AHP, this current also appears to develop well before the end of the burst (Greffrath et al., 1998). Furthermore, our imaging data (Fig. 3) shows that [Ca2+]i attains its plateau early and does not precipitously rise during the latter stages of the burst. Thus, changes in bulk calcium are unlikely to play a role in burst termination.
An alternative scenario is a progressive inactivation of the DAP and hence of the plateau potential, such that it eventually becomes unable to sustain firing and so collapses (Andrew and Dudek, 1984b; Bourque and Renaud, 1991). It is known that the successive generation of DAPs on a time scale of several seconds significantly reduces their amplitude (Bourque et al., 1998), and a mechanism for this inactivation has been proposed by Brown et al. (1999). They have shown that the activation of κ-opioid receptors, by agonists such as dynorphin, can inhibit the DAP. They have further demonstrated that in vivo phasic activity is regulated by κ-receptor activation (Brown et al., 1998): κ-agonists completely block phasic activity, but κ-antagonists prolong the duration of the active phase but decrease the length of the silent phase. Dynorphin is also known to be colocalized with vasopressin in MNCs (Watson et al., 1982) and is found in the same secretory granules (Whitnall et al., 1983). It is therefore likely that both AVP and dynorphin are intra-dendritically cosecreted into the extracellular space of the magnocellular nuclei (Brown et al., 2000), possibly by somatic action potentials that backpropagate through the dendrites. Thus, dynorphin can act as an autocrine modulator of the activity of the cell and so is a candidate messenger for the burst terminating mechanism.
For our model, we therefore assume an endogenous release and buildup of dynorphin. This then acts via κ-receptors as an inhibitory feedback to inhibit the DAP, which in turn reduces the plateau potential and so terminates the burst (Brown et al., 1998).
Action of dynorphin
We assume that the emission of action potentials causes the secretion of dynorphin from the somatodendritic region and that it also has some clearance mechanism. Neuromodulation by dynorphin depends not only on its concentration but also on the interaction between dynorphin and the κ-receptor. To model the effects of dynorphin on the membrane potential, we represent the transduction of κ-receptor activation by the dimensionless variable D, which increases in some manner when the cell is active and decreases when it is silent.
Sustenance of the burst depends on maintaining [Ca2+]i above the threshold for inhibiting IK,leak, which then keeps the DAP plateau active and the cell in a repetitive firing regime. Consequently, either [Ca2+]i must be brought subthreshold or the threshold must be raised for the burst to terminate. Because our experimental data show that the amplitude of the calcium plateau hardly varies during the latter stages of the burst (Fig. 3), we infer that termination is caused by an elevation of the DAP threshold, and we model this by progressively decreasing the sensitivity of the DAP to calcium. Thus, we propose that dynorphin acts to desensitize IK,leak by shifting the half-activation of f to higher calcium concentrations (Fig. 6), so that Equation 10 becomes:
 |
(12) |
where ϕ = 20 nm is a scaling factor chosen to fit to data. Note that D is the indirect effect of dynorphin on the activation of the DAP, and although D is related to, it is distinct from the extracellular concentration of dynorphin.
Figure 6.
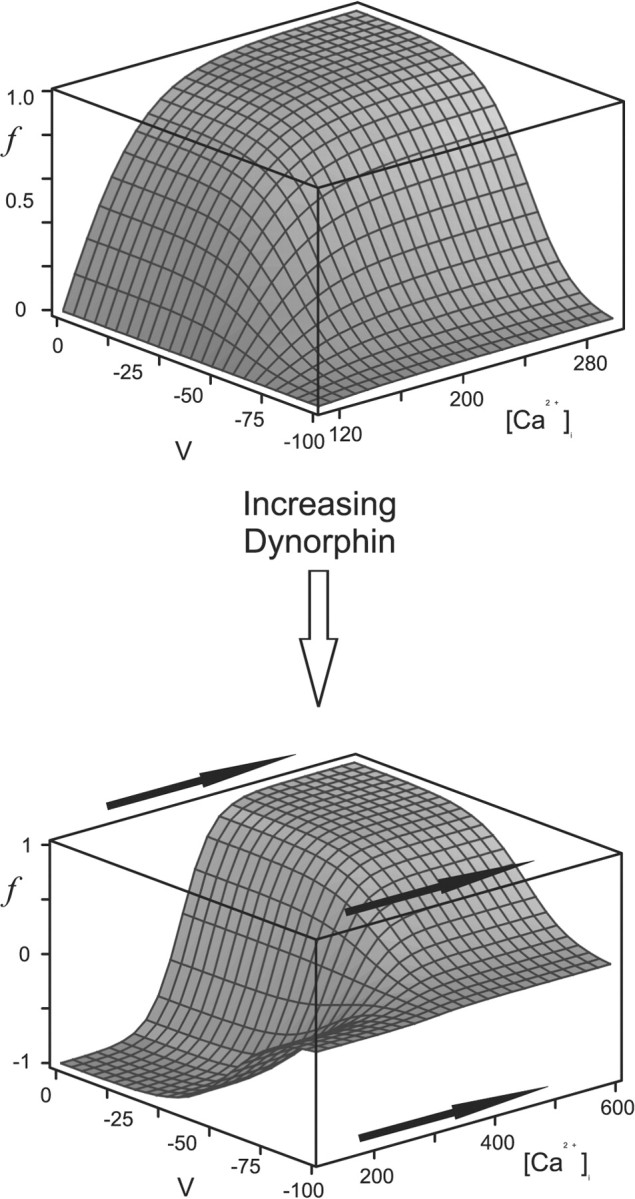
Proposed action of dynorphin on the activation of the DAP. We infer that the activation of the κ-opioid receptor by dynorphin desensitizes IK,leak to calcium and so shifts the activation curve rightward along the calcium axis. Note that the axis in the bottom panel has been lengthened.
If the half-activation shifts slowly as D increases, then IK,leak remains saturated and the firing rate remains steady until the DAP threshold approaches the calcium plateau. As this happens, IK,leak begins to reactivate, and this in turn reduces the plateau and slows the firing rate. Once the DAP threshold is brought above the calcium plateau, the desensitized DAP becomes unable to support repetitive firing. It therefore decays and firing ceases, as shown in Figure 5a. This paradigm closely corresponds to in vitro activity (Andrew and Dudek, 1984a), and the brief persistence of the DAP is clear in the recording plotted in Figure 5b. Although the intracellular calcium is still elevated during this time, it is now subthreshold for DAP reactivation, and, because there is no activity, there is no further influx and it decays to rest. D also decays, but if it does so more slowly than does [Ca2+]i, then the cell will remain subthreshold and will not fire.
Therefore, in the model, there are two slow processes that drive the burst: [Ca2+]i, which is excitatory, and D, which is inhibitory and must have a slower time course than [Ca2+]i. However, our model differs significantly from that of Rinzel and Lee (1987) because here the slow system does not oscillate autonomously but is instead driven by the spiking activity because both [Ca2+]i and D only increase when the cell fires an action potential.
The burst length, the interburst interval, and the dynamics of dynorphin
A lengthy silent phase is necessary to allow both the cell body and the terminals to recover from sustained secretion. Stimulation of the nerve terminals with an artificial, 10 Hz, phasic pattern shows that their complete recovery necessitates a quiet period of at least ∼20 sec (Shaw et al., 1984; Cazalis et al., 1985). In addition, the efficiency of peptide secretion begins to decrease if the active phase lasts for longer than ∼20 sec (Shaw et al., 1984). Both of these parameters are close to the mean values found for phasic activity both in vivo (17 and 20 sec for the silent and active phases, respectively) (Wakerley et al., 1978) and in vitro [28 and 18.4 sec, respectively, in hypothalamic explant (Armstrong and Sladek, 1982) and 28.2 and 16.7 sec, respectively, in hypothalamic slice (Mason, 1983)].
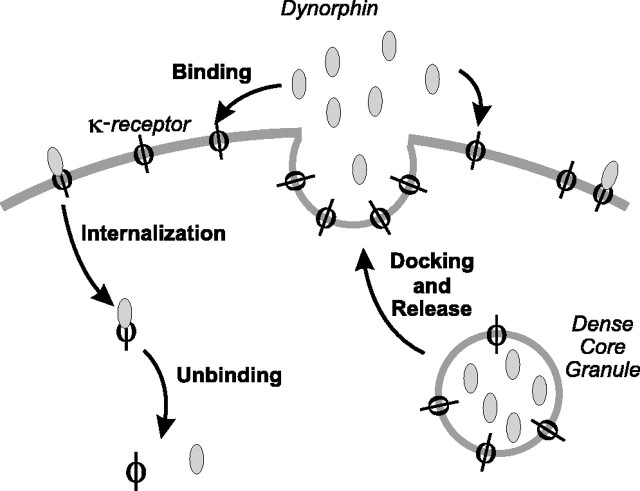
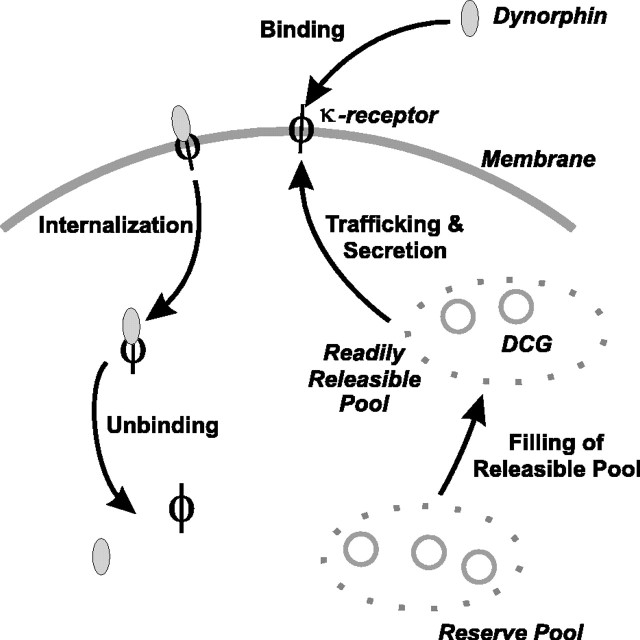
The durations of both the active and the silent phases are dictated by the kinetics of the slowest process underlying phasic activity. Calcium decays monoexponentially after long spike trains (Roper et al., 2003) with time constant τCa = 2.33 sec, and its slow decay after a burst is apparent in Figure 3. However, D must decay even more slowly to ensure that the cell remains subthreshold, and so inactive, once the burst has ceased. Although the time course of D is inaccessible, the recovery of DAPs from activity-dependent inhibition can be fit to a single exponential with time constant τ = 4.9 sec (C. Brown, personal communication) (However, more recent data received while this work was in press give τ = 4.3-4.7 sec. Such a change does not significantly affect our results.), and this is consistent with the findings of Dreifuss et al. (1976). This slow, monoexponential recovery is consistent with a ∼20 sec silent phase, and so we assume it to be equal to the decay constant of D. Such a time scale with a single exponential might be attributable to the internalization and recycling of the bound κ-receptor complex (cf. Goodner et al., 1988) rather than a simple unbinding of dynorphin. The fact that the recovery of the DAP follows a single rather than a multiple exponential implies that a single process underlies the recovery of IK,leak. In fact, it is known that bound insulin receptors will continue to signal even after they have been internalized and only cease when they have finally been dephosphorylated (Backer et al., 1989). Endopeptidases offer another contribution to clearance, and it is known that their inhibition causes a small but consistent enhancement of activity-dependent DAP inhibition (C. Brown, personal communication). Given their ability to reduce autocrine effects of dynorphin, it is probable that endopeptidases also limit paracrine actions of dynorphin to prevent synchronization of activity between vasopressin neurons. A schematic of the sequence of events of secretion, binding, and clearance is shown in Figure 7.
Figure 7.
Secretion, binding, and clearance of dynorphin and κ-receptors. (1) DCG fuses to cell membrane and spills dynorphin into the extracellular space. The DCG membrane also carries κ-receptors (Shuster et al., 1999), and so fusion of the granule also upregulates the receptor. (2) Extracellular dynorphin binds to the κ-receptor, and the bound complex begins to signal. (3) The bound complex is internalized, dephosphorylated, and ceases signaling.
The simplest model is to assume that D (the transduction of the κ-opioid receptor activation by dynorphin) is zero when the cell is at rest, is augmented by an amount Δ every time the cell spikes (or the membrane potential crosses some threshold Vthresh), and decreases exponentially when the cell is quiet so that:
 |
(13) |
where, for concreteness, we set the voltage threshold Vthresh = 0 mV. In fact, DCG exocytosis is unlikely to be triggered by a single, lone action potential, but is more likely to be a response to a cluster of spikes, and so Δ should be thought of as the average section per spike.
First, we assume that Δ is constant and does not facilitate or depress. We can now approximate Equation 13 when the cell is firing regularly by replacing the augmentation condition by its average, m = νΔ, where ν is the firing frequency of the neuron in millihertz. Recall from Figure 4 that this approximation is valid for most of the active phase: from the end of spike frequency adaptation to the final few spikes of the burst. Now Equation 13 becomes:
 |
(14) |
which may be solved to give:
 |
(15) |
 |
(16) |
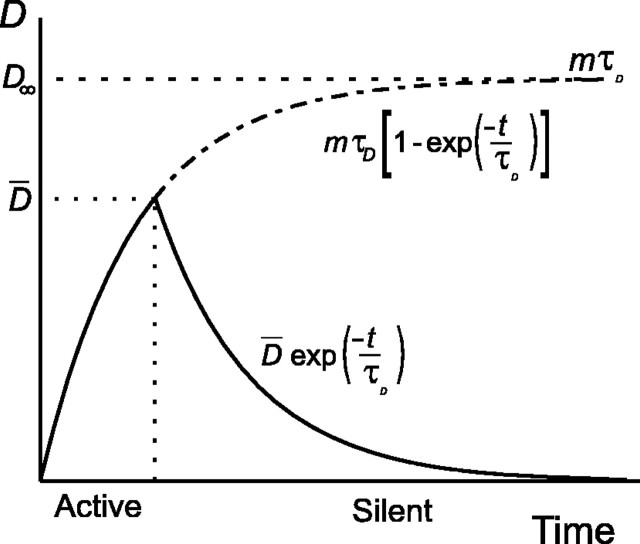
where A is the height of D at the beginning of the silent period. Thus, in common with [Ca2+]i (Fig. 3), D asymptotically approaches a steady state, D → D∞ ≡ mτD, during the active phase. (Note that D is dimensionless because Δ scales the amplitude of D∞ and the scaling factor ϕ has nanomolar units.) With this in mind, it is clear that, for burst termination to be successful, inactivation of the plateau potential must be completed while D is below D∞. There must therefore be a threshold for D, say D̄, such that D̄ < mτD and above which the plateau potential lies below spike threshold, as shown in Figure 8.
Figure 8.
Comparison of time periods for active and silent phases for the simple model of increase and clearance of D (Eq. 17). D both rises and falls exponentially with the same time constant, but, note that for this model, the silent phase is significantly longer than the active phase, although both in vivo and in vitro they are found to be almost equal. Thus, the simple model does not adequately describe the dynamics of D.
However, because the firing frequency varies little as end of the burst is approached, D cannot approach Dthresh slowly but must instead pass rapidly through the transition. Formally, the activation–inactivation of the plateau potential carries the spiking dynamics of the model through a saddle-node bifurcation (Roper and Sherman, 2002), and such transitions are characterized by a “critical slowing down” of the firing frequency as the bifurcation is approached. If D has an asymptotic approach to Dthresh, then the model shows a dramatic slowing of the firing rate as the end of the burst is approached (data not shown). Therefore, to maintain a steady firing rate, Dthresh must lie far below the asymptote and so must be significantly smaller than D∞ (Fig. 8).
Note that, for this simple model, the same decay time constant, τD, determines both the rise rate of D during the active phase and its fall rate during the silent phase. We can therefore invert both Equations 13 and 14 to predict that the durations of the active and silent phases will be:
 |
(17) |
where Dmin is the nadir of D between bursts. Because mτD > D̄ > Dmin, this simple model predicts that the silent phase should be significantly longer than the active phase as shown in Figure 8. However, both in vivo (Wakerley et al., 1978) and in vitro (Armstrong and Sladek, 1982; Mason, 1983), they are found to be similar (∼20 sec).
This mismatch might be rectified by postulating a more complex mechanism for dynorphin release, such as delays arising from mobilization effects (Pow and Morris, 1989; Kits and Mansvelder, 2000). However, a simpler way to prolong the active phase, without changing the length of the silent phase, is instead to allow Δ to depend on previous activity. This could be caused by a stimulus-dependent receptor upregulation, and, in fact, κ-opioid receptors are known to be colocalized with AVP in secretory vesicles and can be rapidly translocated to the plasma membrane by physiological stimuli (Shuster et al., 1999), as shown in Figure 7.
We therefore postulate that D facilitates its own increase, and write:
 |
(18) |
Now the mean increment of D per spike for a regularly firing cell becomes dependent on D, m(D) = νΔ(D), and so Equation 14 becomes:
 |
(19) |
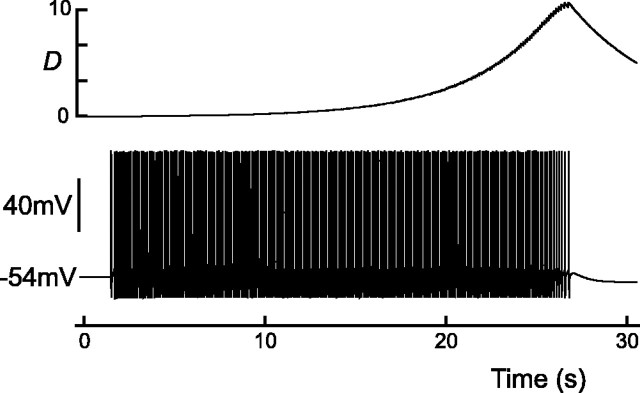
Solutions to Equation 19 are unbounded if the effective time constant τeff < 0 [i.e., δ > 1/(τDν)]. This means that D no longer tends to a steady state, i.e. D ↛ D∞, and so the threshold for burst termination, D̄, is no longer constrained to be below mτD but can be chosen to fit the observed burst and silence durations. A typical profile is shown in Figure 9.
Figure 9.
Proposed time course of D (the transduction of κ-receptor activation by dynorphin) during a burst; compare this with the profile of [Ca2+]i shown in Figure 3. D evolves according to Equations 13 and 18 and decays to rest exponentially when the cell is silent.
Note that Equation 18 does not imply that the cell has some infinite supply of dynorphin but rather that the effect of the amount released per spike increases in such a way that it overwhelms the clearance mechanism.
The slow depolarization
The silent period is dominated by a slow depolarization of the membrane potential (Andrew and Dudek, 1984a), which lasts for several seconds, can elevate the membrane potential by ∼3 mV, and can initiate a new burst in a phasic cell (Andrew, 1987). The slow depolarization (SD) is clear in Figure 5a.
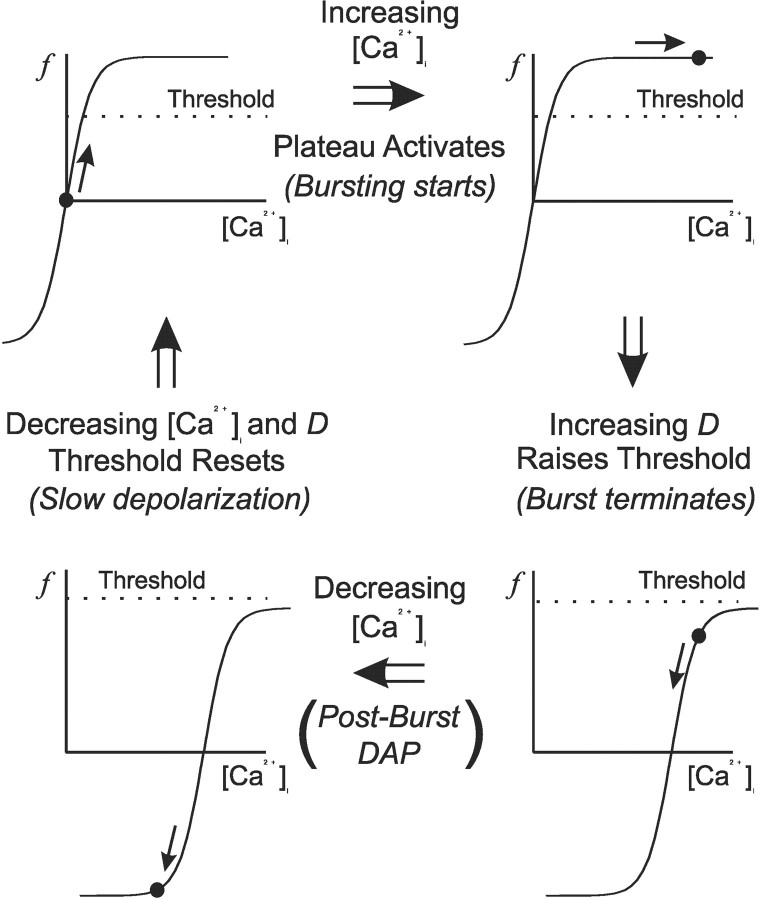
The cause of the SD is not known; however, a similar excitation occurs in our model (Fig. 5b) and is a consequence of [Ca2+]i decaying faster than does D. Recall that our hypothesis is that dynorphin desensitizes the DAP to calcium, thus allowing IK,leak to reactivate while calcium remains elevated. The burst then terminates and both [Ca2+]i and D begin to decay. However, because [Ca2+]i decays faster than D, it approaches its rest while D is still elevated and the calcium dependence of the DAP is still shifted. As a consequence, the calcium concentration temporarily lies much lower on the IK,leak modulation curve than it does when the cell is at rest (recall from Eq. 10 that p∞ can go negative in low [Ca2+]i). This therefore makes f negative, which in turn increases the amplitude of IK,leak [recall that the modulation of IK,leak is given by (1 – f)] and hyperpolarizes the cell. The hyperpolarization slowly fades as dynorphin decays, and IK,leak eventually returns to its resting value (f = 0). This overshoot and slow reset is manifest as a slow depolarization of the membrane potential. The cycle is shown schematically in Figure 10.
Figure 10.
The evolution of [Ca2+]i and D throughout and between bursts and the corresponding upmodulation and downmodulation of IK,leak (shown schematically). The cycle starts from top left and moves clockwise, and the activation of the DAP, or plateau, at any time is denoted by the circle. Threshold denotes the calcium threshold for triggering the plateau potential and not spike threshold, and depends on spike frequency. Note that the function f denotes the modulation, and not the activation, of IK,leak. f therefore starts at zero but can go negative if [Ca2+]i decays while it is still right-shifted. This negative modulation corresponds to an upmodulation of IK,leak and leads to a hyperpolarization of the membrane potential. The sequence of events is as follows: (1) spike-driven Ca2+ influx depolarizes the cell by depressing IK,leak. The depolarization triggers more spikes, further increasing [Ca2+]i and so sustaining a plateau and initiating a burst; (2) subsequent spikes cause further influx and so saturate the inhibition of IK,leak; (3) D starts to increase, desensitizing IK,leak to Ca2+ and raising the plateau threshold until it is no longer self-sustaining. The plateau then collapses, and the burst terminates; (4) D decays more slowly than Ca2+ and so remains elevated while Ca2+ decays. Thus IK,leak remains transiently desensitized, causing f to go negative and temporarily hyperpolarizing the membrane. Hyperpolarization decays as D is cleared, and becomes manifest as a slow depolarization. As both [Ca2+]i and D decay, the cell returns to its initial state.
Endogenous bursting in AVP cells
Thus far, we have studied evoked bursts in nonphasic AVP cells; however, AVP cells switch to a phasic pattern of repeating bursts and silences when held at a depolarized potential (Andrew and Dudek, 1984a), as shown in Figure 11a. The average lengths of both active and silent phases are ∼20 sec (Wakerley et al., 1978; Armstrong and Sladek, 1982), but both are highly variable even within a single cell (Poulain et al., 1988). Phasic bursts have similar profiles to their evoked counterparts but are usually initiated by the crossing of spike threshold by the slow depolarization (Andrew, 1987) rather than some extrinsic mechanism (Andrew and Dudek, 1984a).
For increasing values of constant, depolarizing current (Iapp = const), the model also reproduces the switch from an excitable mode (cf. Laing et al., 2003), during which each burst must be evoked, to the phasic pattern, as shown in Figure 11b. However, phasic activity only occurs in this model when the cell is held above threshold for repetitive spiking, for example by a large depolarizing current, Iapp, and this may be seen when when the plateau is blocked by setting f = 0, as shown in Figure 11c. Firing then only becomes broken up into phasic bursts when IK,leak is sufficiently upregulated by dynorphin to drive the cell below threshold. In contrast, spiking activity is only reignited, and a new burst initiated, when D has decayed to rest and IK,leak has been reset. We therefore conclude that it is the hyperpolarizing up-regulation of IK,leak by dynorphin, and not the depolarizing action of the plateau, that drives the phasic oscillation. It would appear that this sequence of events is also true in vitro because a block of the DAP, and hence the plateau potential, with Cs+ transforms a phasic cell into a continuously firing (i.e., suprathreshold) rather than a slow-irregular (i.e., subthreshold) cell (Ghamari-Langroudi and Bourque, 1998).
Transient activity during increased stress
Phasic firing is a response by AVP cells to an increased physiological stress, such as hyperosmolality (Brimble and Dyball, 1977) or exsanguination (Poulain et al., 1977), and in vitro can be induced by an increase in the osmotic pressure of the perfusion media (Bourque and Renaud, 1984). The effects of osmotic stress, and also presumably those too of blood loss, are mediated in part by a net depolarization of the membrane potential that has several contributing factors (Bourque, 1998).
The transition sequence for the discharge pattern is typically slow-irregular → phasic → fast-continuous (Poulain et al., 1988), and the degree of its progression depends on the severity of the stimulus. However, if the stimulus is increased aggressively, for example by substantial exsanguination (Poulain et al., 1977) or by a rapid change in the perfusion media, then some cells exhibit a transient response, emitting first a fast-continuous pattern before switching to phasic bursting (Poulain et al., 1977). The transient phase typically lasts only for a few minutes before the phasic pattern appears and can also be observed in vitro (Bourque and Renaud, 1984).
A similar transient pattern arises in the model if the dynorphin–κ-opioid receptor mechanism is initially inactive and develops only slowly. Recall first that the phasic pattern becomes apparent only when the cell has been brought above spike threshold by a net depolarization. Furthermore, note that phasic activity is driven by the interruption of firing by the hyperpolarizing action of the upregulated IK,leak and not by the depolarizing action of the plateau. Therefore, if the osmotic depolarization activates rapidly to bring the cell suprathreshold but the κ-opioid inhibition lags behind, then the cell will first cross to a repetitive, or fast-continuous, firing mode (compare with Fig. 11c), but this will subsequently become broken up into phasic bursts as the dynorphin–κ-opioid mechanism becomes effected, as shown in Figure 11b.
It is likely that the dense-core granules (DCGs) containing the κ-receptors are stored in an intracellular pool before being trafficked to the cell membrane by a depolarizing stimulus, as shown in Figure 12. If the pool is empty before the onset of the stress, then it must be filled before κ-receptors become available, and so the delay might reflect the slow filling of this pool. In hippocampal cells, Kim and von Zastrow (2003) have shown recently that nerve growth factor induces such a pool of δ-opioid receptors and that receptors from this pool can then be rapidly inserted into the membrane in response to physiological stimuli. In addition, the priming of the readily releasable pool of DCGs has been shown to be a necessary factor in the bursting that arises in oxytocin cells during the milk-ejection reflex (Ludwig et al., 2002).
Figure 12.
MNCs show a transient response during an aggressively applied stimulus and briefly discharge a fast-continuous pattern before the onset of phasic activity. We propose that this transient fast-continuous pattern occurs because the dynorphin–κ-receptor desensitization mechanism initially develops slowly, and so there is a short time for which the inhibition caused by the upregulation of IK,leak does not interrupt firing (compare with Fig. 11c). We further propose that this slow onset is caused by the slow filling of a releasable pool of dense-core granules from a docked pool of granules.
Discussion
We showed how a mathematical model of an AVP cell can support DAPs, plateau potentials, and phasic firing. Our analysis supports a recently proposed role of dynorphin in burst termination (Brown et al., 1998, 1999, 2000; Brown and Leng, 2000). We further suggest a mechanism for the action of dynorphin and predict the time course of its effects.
Burst terminations and phasic firing mimicking that found in AVP neurons were best achieved assuming that accumulated extracellular dynorphin, stemming from local release, desensitizes the DAP mechanism to [Ca2+]i (Fig. 10). Furthermore, the time course of the active and passive phases of the burst dictate that, in this model, dynorphin must potentiate its own actions, and this might be attributable to a concomitant upregulation of the κ-opioid receptor (Shuster et al., 1999).
Synaptic input
We neglected the effects of synaptic input in the present model and assumed phasic activity to be an intrinsic mechanism, and this has simplified our analysis. In fact, in vitro phasic discharge does not depend per se on synaptic input and can be maintained in explants in which synaptic inputs are significantly attenuated (Bourque and Renaud, 1984), but, more significantly, it can persist during a block of both excitatory and inhibitory synaptic input (Hatton, 1982; Bourque and Renaud, 1984) (C. Li and W. Armstrong, unpublished observations). However, it should also be noted that synaptic input appears to play a profound role in vivo, because phasic firing is inhibited by a block of NMDA or AMPA/kainate receptors (Nissen et al., 1995).
The phasic mechanism that we described here still persists when synaptic input, in the form of Poisson distributed EPSCs and IPSCs is included in the model. The cell still exhibits lengthy active and silent phases; however, spike timing within the active phase becomes irregular and the variability of the interspike interval (ISI) increases. A variable ISI is a requisite for spike clustering (Poulain et al., 1988), which is a feature of the discharge pattern that has been shown to optimize AVP release from the neurohypophyseal terminals (Dutton and Dyball, 1979; Cazalis et al., 1985).
Our model predicts that phasic bursting is periodic and consequently that the durations of both phases are constant. However, real cells exhibit wide variability in the lengths of their active and silent phases (Poulain et al., 1988), and such irregular bursting might also be partly explained by the effects of random synaptic input and other sources of membrane noise (Bourque et al., 1986). We showed that bursts can be triggered in a nonphasic cell by short spike trains, and the same mechanism allows synaptically evoked spikes prematurely to initiate a burst. The susceptibility of the model to premature initiation increases as D decays during the silent period, in common with in vivo results (Dreifuss et al., 1976), and so the timing of the silent phase is intimately related to the irregularity of spike train. In addition, although the active phase is self-sustaining, it too is strongly affected by the statistics of spike times. In particular, the nonlinear feedback between D and Δ, recall Equation 18, means that if, a closely spaced cluster of spikes occurs toward the end of the active phase, it will hasten burst termination.
Alternative actions of dynorphin
Following Brown et al. (1999), we proposed that dynorphin interacts directly with the current driving the DAP (IK,leak), and we further suggest that its action is to progressively desensitize the current to calcium. However, dynorphin is also known to directly inhibit high-voltage-activated calcium channels, and the activation of κ-opioid receptors in neuroendocrine terminals is known to reduce Ca2+ influx (Rusin et al., 1997). It is therefore possible that dynorphin could instead terminate the burst by manipulating calcium rather than by a downstream modulation of the DAP. In fact, direct Ca2+ channel modulation is unlikely because DAPs are still inhibited by κ-agonist concentrations that are too low to affect calcium channels, and furthermore κ-agonists do not affect other calcium-dependent processes, such as action-potential broadening (Brown et al., 1999). In addition, aside from Ca2+ influx, the DAP is known to be controlled by release from stores (Li and Hatton, 1997a), and so a direct reduction of influx should only partially inhibit the plateau. Nevertheless, it is sensible to consider how this alternative modulation might affect our model.
Recall that the burst can only terminate when calcium is brought below threshold for activation of the DAP plateau and further that bulk calcium typically attains a concentration >200 nm above this threshold during the burst. Therefore, if dynorphin does act to close Ca2+ channels, then an exponential decline in [Ca2+]i should be apparent during the latter stages of the burst, and, in addition, firing will only cease once the threshold (∼50 nm above [Ca2+]rest = 113 nm) has been crossed. Furthermore, a diminishing calcium influx should be associated with a reduction in the activation of both SK and BK potassium channels, and this in turn should reverse spike frequency adaptation and accelerate the firing rate, and this is observed in the model (data not shown). However, such a trajectory for [Ca2+]i is at odds with our observations of the time course shown in Figure 3, and we have also seen (Fig. 4) that the firing rate remains slow until the cell falls silent. We therefore conclude that, in contrast to the nerve terminals, dynorphin should have little effect on magnocellular somatic calcium channels.
Alternative autocrine inhibition
We emphasized the possible role played by the opioid dynorphin. However, this model depends not on the chemical underlying burst termination but only on the properties of its interactions. Dynorphin is not the sole neuromodulatory agent cosecreted with AVP, and it is possible that the inhibitory role could also be played by some other cosecreted neuromodulatory agent such as nitrous oxide (Stern and Ludwig, 2001). Other factors, including intracellular ones, that accumulate during firing may have a similar effect. However, our model is consistent both with the most compelling experimental data regarding local release of dynorphin (Brown et al., 1998, 1999, 2000; Brown and Leng, 2000) and also with our own observations of the time course of bulk calcium during bursts (Fig. 3).
Nonspecific cation currents mediating DAPs
We adopted the paradigm, proposed by Li and Hatton (1997b), that the DAP is a Ca2+-mediated reduction in a resting K+ current. Not only does this model show burst initiation and termination profiles that closely agree with experiment, but it also clarifies some more subtle features of the cells electrical activity (e.g., the postburst DAP and the intraburst slow depolarization). However, others (Bourque, 1986; Ghamari-Langroudi and Bourque, 2002) suggest instead that the DAP is caused by a Ca2+-activated nonspecific cation (CAN) current, and so it is sensible to consider how this change would affect our analysis.
If we assume the same activation function, f(C, V) (recall C ≡ [Ca2+]i), for the DAP, then the simplest way to incorporate a CAN current is to rewrite Equation 3 as:
 |
(20) |
where Itot = INa + IK + IA + Ic + IAHP + ICa, we set Îleak = INa,leak + gK,leak (V – EK), and typically ECAN ≃ –35 mV. Comparing this with our original model:
 |
(21) |
we see that, to a first approximation, both models are equivalent because the former is the addition of a depolarizing current and the latter is the subtraction of a hyperpolarizing current. If we also assume that desensitization to Ca2+ causes burst termination in both cases, then both models support burst initiation, the plateau potential and burst termination, and so their active phases are indistinguishable. However, recall that f goes negative when [Ca2+]i < [Ca2+]rest and that this causes the slow depolarization between bursts. In our model, this can be readily interpreted as an upregulation of the resting current IK,leak; however, if ICAN = 0 at rest in the CAN model, then the corresponding mechanism is less fathomable because it should not reverse in low calcium.
If we instead assume ICAN to be a persistent current, contributing to the resting membrane potential in a similar manner to that which we originally proposed for IK,leak, then it is conceivable that it too could be both upregulated and downregulated by [Ca2+]i and dynorphin. We therefore conclude that a CAN model can only fully explain phasic activity if it is driven by a nonspecific cation current that is partially active at rest. Such a current has recently been observed by Han et al. (2003), but it has not yet been shown to be modulated by [Ca2+]i.
Appendix
The full model is given by:
 |
and we have assumed the specific capacitance to be  .
.
Recall from Equation 4 that inactivating and non-inactivating currents are, respectively, described by:
 |
and their corresponding voltage-dependent activation (m∞) and inactivation (h∞) functions are:
 |
Reversal potentials are ENa = 50 mV, EK =–96 mV, and ECa = 12.5 ln ([Ca2+]o/[Ca2+]i), and we assumed the external calcium concentration to be [Ca2+]o = 4mm.
The parameters for each voltage-dependent current are listed in Table 1, and the corresponding time constants for each current are listed in Table 2.
Table 1.
Parameters for each voltage-dependent current
|
|
gγ (mS/cm-2) |
Vm (mV) |
km (mV) |
Vh (mV) |
kh (mV) |
|---|---|---|---|---|---|

|
14 | 38 | 4 | 45 | 2 |
| ICa = gCam2(V — ECa) | 0.1 | -10 | 7 | ||
| IDR = gDRm3(V — EK) | 14 | -2 | 11 | ||
| IA = gAm4h(V — EK) | 14 | 45 | 11 | 80 | 6.5 |

|
0.18 | ||||
|
Ic = gcm(V — EK) |
1 |
|
|
|
|
Table 2.
Time constants for each current
|
INa |
|
| τm | |
| τh |

|
| ICa | |
| τm |

|
| τh | |
| IDR | |
| τm |

|
| τh | |
| IA | |
| τm |

|
| τh |

|
| IAHP | |
| τm | |
| τh | |
| Ic | |
| τm | 1.22 |
| τh
|
|
The steady-state calcium-dependent activation functions for Ic and IAHP [respectively, m∞(CBK, V) and m∞(CSK)] are
 |
where CBK denotes the calcium concentration in the pool sensed by the BK channel, CSK denotes the concentration in the AHP calcium domain, and Cr = 113 nm the resting calcium concentration.
Each of the three calcium pools evolves according to (Eq. 6):
 |
with time constants τi = 2.33 sec (Ci), τBK = 1 msec (CBK), and τSK = 656 msec (CSK) and Faraday scaling factors αi = 0.9, αBK = 100, and αSK = 1.6.
The leak current is the linear sum of two distinct currents:
 |
and IK,leak can be modulated by both intracellular calcium and voltage according to:
 |
where
 |
with kp = 55 nm, kq = 7 mV, and Vq = –70 mV, the resting calcium concentration is [Ca2+]rest = 113 nm, and whereas q activates instantaneously, p evolves with τp = 75 msec.
Footnotes
This work was supported by a National Institutes of Health (NIH) Intramural Research Training Award fellowship (P.R.) and NIH Grants NS23941 (W.A.) and NS42276 (J.C.). We thank Arthur Sherman for guidance and support during the preparation of this work. We also thank the following, for both sharing their data and helpful discussions: Colin Brown, Charles Bourque, Gareth Leng, Ryoichi Teruyama, Talent Shevchenko, and Chunyan Li, as well as Bard Ermentrout for releasing and supporting XPPaut (http://www.math.pitt.edu/~bard/xpp/xpp.html), which was used for all of our simulations.
Correspondence should be addressed to Peter Roper, Mathematics Research Branch, National Institute of Diabetes and Digestive and Kidney Diseases, National Institutes of Health, 12A South Drive, Room 4007, MSC 5621, Bethesda, MD 20892. E-mail: pete.roper@nih.gov.
DOI:10.1523/JNEUROSCI.4203-03.2004
Copyright © 2004 Society for Neuroscience 0270-6474/04/244818-14$15.00/0
References
- Andrew RD (1987) Endogenous bursting by rat supraoptic neuroendocrine cells is calcium dependent. J Physiol (Lond) 384: 451–465. [DOI] [PMC free article] [PubMed] [Google Scholar]
- Andrew RD, Dudek FE (1983) Burst discharge in mammalian neuroendocrine cells involves an intrinsic regenerative mechanism. Science 221: 1050–1052. [DOI] [PubMed] [Google Scholar]
- Andrew RD, Dudek FE (1984a) Analysis of intracellularly recorded phasic bursting by mammalian neuroendocrine cells. J Neurophysiol 51: 552–566. [DOI] [PubMed] [Google Scholar]
- Andrew RD, Dudek FE (1984b) Intrinsic inhibition in magnocellular neuroendocrine cells of rat hypothalamus. J Physiol (Lond) 353: 171–185. [DOI] [PMC free article] [PubMed] [Google Scholar]
- Armstrong WE, Sladek CD (1982) Spontaneous “phasic-firing” in supraoptic neurons recorded from hypothalamo-neurohypophysial explants in vitro. Neuroendocrinology 34: 405–409. [DOI] [PubMed] [Google Scholar]
- Armstrong WE, Sladek CD (1985) Evidence for excitatory actions of histamine on supraoptic neurons in vitro: mediation by an H1-type receptor. Neuroscience 16: 307–322. [DOI] [PubMed] [Google Scholar]
- Armstrong WE, Smith BN, Tian M (1994) Electrophysiological characteristics of immunochemically identified rat oxytocin and vasopressin neurons in vitro. J Physiol (Lond) 475: 115–128. [DOI] [PMC free article] [PubMed] [Google Scholar]
- Backer JM, Kahn CR, White MF (1989) Tyrosine phosphorylation of the insulin receptor is not required for receptor internalization: studies in 2,4-dinitrophenol-treated cells. Proc Natl Acad Sci USA 86: 3209–3213. [DOI] [PMC free article] [PubMed] [Google Scholar]
- Bourque CW (1986) Calcium-dependent spike after-current induces burst firing in magnocellular neurosecretory-cells. Neurosci Lett 70: 204–209. [DOI] [PubMed] [Google Scholar]
- Bourque CW (1998) Osmoregulation of vasopressin neurons: a synergy of intrinsic and synaptic processes. Prog Brain Res 119: 59–76. [DOI] [PubMed] [Google Scholar]
- Bourque CW, Brown DA (1987) Apamin and d-tubocurarine block the afterhyperpolarization of rat supraoptic neurosecretory neurons. Neurosci Lett 82: 185–190. [DOI] [PubMed] [Google Scholar]
- Bourque CW, Renaud LP (1984) Activity patterns and osmosensitivity of rat supraoptic neurones in perfused hypothalamic explants. J Physiol (Lond) 349: 631–642. [DOI] [PMC free article] [PubMed] [Google Scholar]
- Bourque CW, Renaud LP (1991) Membrane-properties of rat magnocellular neuroendocrine cells in vivo. Brain Res 540: 349–352. [DOI] [PubMed] [Google Scholar]
- Bourque CW, Randle JCR, Renaud LP (1986) Nonsynaptic depolarizing potentials in rat supraoptic neurons recorded in vitro. J Physiol (Lond) 376: 493–505. [DOI] [PMC free article] [PubMed] [Google Scholar]
- Bourque CW, Kirkpatrick K, Jarvis CR (1998) Extrinsic modulation of spike afterpotentials in rat hypothalamoneurohypophysial neurons. Cell Mol Neurobiol 18: 3–12. [DOI] [PMC free article] [PubMed] [Google Scholar]
- Brimble MJ, Dyball REJ (1977) Characterization of oxytocin- and vasopressin-secreting neurones in the supraoptic nucleus to osmotic stimulation. J Physiol (Lond) 271: 253–271. [DOI] [PMC free article] [PubMed] [Google Scholar]
- Brown CH, Leng G (2000) In vivo modulation of post-spike excitability in vasopressin cells by κ-opioid receptor activation. J Neuroendocrinol 12: 711–714. [DOI] [PubMed] [Google Scholar]
- Brown CH, Ludwig M, Leng G (1998) κ-Opioid regulation of neuronal activity in the rat supraoptic nucleus in vivo. J Neurosci 18: 9480–9488. [DOI] [PMC free article] [PubMed] [Google Scholar]
- Brown CH, Ghamari-Langroudi M, Leng G, Bourque CW (1999) κ-opioid receptor activation inhibits post-spike depolarizing after-potentials in rat supraoptic nucleus neurones in vitro. J Neuroendocrinol 11: 825–828. [DOI] [PubMed] [Google Scholar]
- Brown CH, Russell JA, Leng G (2000) Opioid modulation of magnocellular neurosecretory cell activity. Neurosci Res 36: 97–120. [DOI] [PubMed] [Google Scholar]
- Cazalis M, Dayanithi G, Nordmann JJ (1985) The role of patterned burst and interburst interval on the excitation-coupling mechanism in the isolated rat neural lobe. J Physiol (Lond) 369: 45–60. [DOI] [PMC free article] [PubMed] [Google Scholar]
- Cobbett P, Inenaga K, Mason WT (1988) Mechanisms of phasic bursting in vasopressin cells. In: Pulsatility in neuroendocrine systems, Chap 9 (Leng G, ed), pp 155–179. Boca Raton, FL: CRC.
- Dreifuss JJ, Tribollet E, Baertschi AJ, Lincoln DW (1976) Mammalian endocrine neurones: control of phasic firing by antidromic action potentials. Neurosci Lett 3: 281–286. [DOI] [PubMed] [Google Scholar]
- Dudek FE, Gribkoff VK (1987) Synaptic activation of slow depolarization in rat supraoptic nucleus neurones in vitro. J Physiol (Lond) 387: 273–296. [DOI] [PMC free article] [PubMed] [Google Scholar]
- Dutton A, Dyball REJ (1979) Phasic firing enhances vasopressin release from the rat neurohypophysis. J Physiol (Lond) 290: 433–440. [DOI] [PMC free article] [PubMed] [Google Scholar]
- Dyball REJ (1988) The importance of bursting in determining secretory responses: how does a phasic firing pattern influence peptide release from neurohypophyseal vasopressin terminals. In: Pulsatility in neuroendocrine systems, Chap 10 (Leng G, ed), pp 181–196. Boca Raton, FL: CRC.
- Ermentrout B (2002) Simulating, analyzing, and animating dynamical systems: a guide to XPPAUT for researchers and students. Philadelphia: SIAM.
- Ghamari-Langroudi M, Bourque CW (1998) Caesium blocks depolarizing afterpotentials and phasic firing in rat supraoptic neurones. J Physiol (Lond) 510: 165–175. [DOI] [PMC free article] [PubMed] [Google Scholar]
- Ghamari-Langroudi M, Bourque CW (2002) Flufenamic acid blocks depolarizing afterpotentials and phasic firing in rat supraoptic neurones. J Physiol (Lond) 545: 537–542. [DOI] [PMC free article] [PubMed] [Google Scholar]
- Goodner CJ, Sweet IR, Harrison Jr HC (1988) Rapid reduction and return of surface insulin receptors after exposure to brief pulses of insulin in perifused rat hepatocytes. Diabetes 37: 1316–1323. [DOI] [PubMed] [Google Scholar]
- Greffrath W, Martin E, Reuss S, Boehmer G (1998) Components of afterhyperpolarization in magnocellular neurons of the rat supraoptic nucleus in vitro. J Physiol (Lond) 513: 493–506. [DOI] [PMC free article] [PubMed] [Google Scholar]
- Grynkiewicz G, Poenie M, Tsien RY (1985) A new generation of Ca2+ indicators with greatly improved fluorescence properties. J Biol Chem 260: 3440–3450. [PubMed] [Google Scholar]
- Han J, Gnatenco C, Sladek CD, Kim D (2003) Background and tandempore potassium channels in magnocellular neurosecretory cells of the rat supraoptic nucleus. J Physiol (Lond) 546: 625–639. [DOI] [PMC free article] [PubMed] [Google Scholar]
- Hatton GI (1982) Phasic bursting activity of rat paraventricular neurones in the absence of synaptic transmission. J Physiol (Lond) 327: 273–284. [DOI] [PMC free article] [PubMed] [Google Scholar]
- Hlubek MD, Cobbett P (2000) Differential effects of K+ channel blockers on frequency-dependent action potential broadening in supraoptic neurons. Brain Res Bull 53: 203–209. [DOI] [PubMed] [Google Scholar]
- Kim K-A, von Zastrow M (2003) Neurotrophin-regulated sorting of opioid receptors in the biosynthetic pathway of neurosecretory cells. J Neurosci 23: 2075–2085. [DOI] [PMC free article] [PubMed] [Google Scholar]
- Kirkpatrick K, Bourque CW (1996) Activity dependence and functional role of the apamin-sensitive K+ current in rat supraoptic neurones in vitro. J Physiol (Lond) 494: 389–398. [DOI] [PMC free article] [PubMed] [Google Scholar]
- Kits KS, Mansvelder HD (2000) Regulation of exocytosis in neuroendocrine cells: spatial organization of channels and vesicles, stimulus-secretion coupling, calcium buffers and modulation. Brain Res Rev 33: 78–94. [DOI] [PubMed] [Google Scholar]
- Laing C, Doiron B, Longtin A (2003) Type I burst excitability. J Comput Neurosci 14: 329–342. [DOI] [PubMed] [Google Scholar]
- Lasser-Ross N, Miyakawa H, Lev-Ram V, Young SR, Ross WN (1991) High time resolution fluorescence imaging with a CCD camera. J Neurosci Methods 36: 253–261. [DOI] [PubMed] [Google Scholar]
- Li ZH, Hatton GI (1997a) Ca2+ release from internal stores: role in generating depolarizing after-potentials in rat supraoptic neurones. J Physiol (Lond) 498: 339–350. [DOI] [PMC free article] [PubMed] [Google Scholar]
- Li ZH, Hatton GI (1997b) Reduced outward K+ conductances generate depolarizing after-potentials in rat supraoptic nucleus neurones. J Physiol (Lond) 505: 95–106. [DOI] [PMC free article] [PubMed] [Google Scholar]
- Lincoln DW, Wakerley JB (1974) Electrophysiological evidence for the activation of supraoptic neurones during the release of oxytocin. J Physiol (Lond) 242: 533–554. [DOI] [PMC free article] [PubMed] [Google Scholar]
- Ludwig M, Sabatier N, Bull PM, Landgraf R, Dayanithi G, Leng G (2002) Intracellular calcium stores regulate activity-dependent neuropeptide release from dendrites. Nature 418: 85–89. [DOI] [PubMed] [Google Scholar]
- Mason WT (1983) Electrical properties of neurons recorded from the rat supraoptic nucleus in vitro. Proc R Soc Lond B Biol Sci 217: 141–161. [DOI] [PubMed] [Google Scholar]
- Mikiten TM, Douglas WW (1965) Effect of calcium and other ions on vasopressin release from rat neurohypophyses stimulated electrically in vitro. Nature 207: 302. [DOI] [PubMed] [Google Scholar]
- Moos FC, Ingram CD (1995) Electrical recordings of magnocellular supraoptic and paraventricular neurons displaying both oxytocin-related and vasopressin-related activity. Brain Res 669: 309–314. [DOI] [PubMed] [Google Scholar]
- Nissen R, Hu B, Renaud LP (1995) Regulation of spontaneous phasic firing of rat supraoptic vasopressin neurons in vivo by glutamate receptors. J Physiol (Lond) 484: 415–424. [DOI] [PMC free article] [PubMed] [Google Scholar]
- Plant RE (1978) The effects of calcium++ on bursting neurons: a modeling study. Biophys J 21: 217–237. [DOI] [PMC free article] [PubMed] [Google Scholar]
- Poulain DA, Vincent JD (1987) Mammalian neurosecretory cells: electrical properties in vivo and in vitro. Curr Membrane Transport 31: 313–331. [Google Scholar]
- Poulain DA, Wakerley JB, Dyball REJ (1977) Electrophysiological differentiation of oxytocin- and vasopressin-secreting neurones. Proc R Soc Lond B Biol Sci 196: 367–384. [DOI] [PubMed] [Google Scholar]
- Poulain DA, Brown D, Wakerley JB (1988) Statistical analysis of patterns of electrical activity in vasopressin- and oxytocin-secreting neurones. In: Pulsatility in neuroendocrine systems, Chap 8 (Leng G, ed), pp 119–154. Boca Raton, FL: CRC.
- Pow DV, Morris JF (1989) Dendrites of hypothalamic magnocellular neurons release neurohypophyseal peptides by exocytosis. Neuroscience 32: 435–439. [DOI] [PubMed] [Google Scholar]
- Rinzel J, Lee YS (1987) Dissection of a model for neuronal parabolic bursting. J Math Biol 25: 653–675. [DOI] [PubMed] [Google Scholar]
- Roper P, Sherman A (2002) Mathematical analysis of firing pattern transitions in rat SON magnocellular neurosecretory cells subject to osmotic stress. Soc Neurosci Abstr 28: 273.3. [Google Scholar]
- Roper P, Callaway JC, Armstrong WE (2001) Reconstructing phasic vasopressin cells. Soc Neurosci Abstr 27: 178.3. [Google Scholar]
- Roper P, Callaway J, Shevchenko T, Teruyama R, Armstrong W (2003) AHP's, HAP's and DAP's: how potassium currents regulate the excitability of rat supraoptic neurones. J Comput Neurosci 15: 367–389. [DOI] [PubMed] [Google Scholar]
- Rusin KI, Giovannucci DR, Stenkel EL, Moises HC (1997) κ-Receptor activation modulates Ca2+ currents and secretion in isolated neuroendocrine nerve terminals. J Neurosci 17: 6565–6574. [DOI] [PMC free article] [PubMed] [Google Scholar]
- Selyanko AA, Sim JA (1998) Ca2+-inhibited non-inactivating K+ channels in cultured rat hippocampal pyramidal neurones. J Physiol (Lond) 510: 71–91. [DOI] [PMC free article] [PubMed] [Google Scholar]
- Shaw FD, Bicknell RJ, Dyball RE (1984) Facilitation of vasopressin release from the neurohypophysis by application of electrical stimuli in bursts: relevant stimulation parameters. Neuroendocrinology 39: 371–376. [DOI] [PubMed] [Google Scholar]
- Shuster SJ, Riedl M, Li X, Vulchanova L, Elde R (1999) Stimulus-dependent translocation of κ opioid receptors to the plasma membrane. J Neurosci 19: 2658–2664. [DOI] [PMC free article] [PubMed] [Google Scholar]
- Stern JE, Ludwig M (2001) NO inhibits supraoptic oxytocin and vasopressin neurons via activation of GABAergic synaptic inputs. Am J Physiol Regul Integr Comp Physiol 280: R1815–R1822. [DOI] [PubMed] [Google Scholar]
- Stern JE, Galarreta M, Foehring RC, Hestrin S, Armstrong WE (1999) Differences in the properties of ionotropic glutamate synaptic currents in oxytocin and vasopressin neuroendocrine neurons. J Neurosci 19: 3367–3375. [DOI] [PMC free article] [PubMed] [Google Scholar]
- Wakerley JB, Poulain DA, Dyball REJ, Cross BA (1975) Activity of phasic neurosecretory cells during haemorrhage. Nature 258: 82–84. [DOI] [PubMed] [Google Scholar]
- Wakerley JB, Poulain DA, Brown D (1978) Comparison of firing patterns in oxytocin- and vasopressin-releasing neurones during progressive dehydration. Brain Res 148: 425–440. [DOI] [PubMed] [Google Scholar]
- Wang XJ, Rinzel J (1995) Oscillatory and bursting properties of neurons. In: Handbook of brain theory and neural networks (Arbib M, ed). Cambridge, MA: MIT.
- Watson SJ, Akil H, Fischli W, Goldstein A, Zimmerman E, Nilaver G, van Wimersma Griedanus TB (1982) Dynorphin and vasopressin: common localization in magnocellular neurons. Science 216: 85–87. [DOI] [PubMed] [Google Scholar]
- Whitnall MH, Gainer H, Cox BM, Molineaux CJ (1983) Dynorphin-A-(1–8) is contained within vasopressin neurosecretory vesicles in rat pituitary. Science 222: 1137–1139. [DOI] [PubMed] [Google Scholar]
- Wilson CJ, Callaway JC (2000) Coupled oscillator model of the dopaminergic neuron of the substantia nigra. J Neurophysiol 83: 3084–3100. [DOI] [PubMed] [Google Scholar]


