

Abstract
Electroconvulsive therapy (ECT) remains the treatment of choice for drug-resistant patients with depressive disorders, yet the mechanism for its efficacy remains unknown. Gene transcription changes were measured in the frontal cortex and hippocampus of rats subjected to sham seizures or to 1 or 10 electroconvulsive seizures (ECS), a model of ECT. Among the 3500–4400 RNA sequences detected in each sample, ECS increased by 1.5- to 11-fold or decreased by at least 34% the expression of 120 unique genes. The hippocampus produced more than three times the number of gene changes seen in the cortex, and many hippocampal gene changes persisted with chronic ECS, unlike in the cortex. Among the 120 genes, 77 have not been reported in previous studies of ECS or seizure responses, and 39 were confirmed among 59 studied by quantitative real time PCR. Another 19 genes, 10 previously unreported, changed by <1.5-fold but with very high significance. Multiple genes were identified within distinct pathways, including the BDNF–MAP kinase–cAMP–cAMP response element-binding protein pathway (15 genes), the arachidonic acid pathway (5 genes), and more than 10 genes in each of the immediate-early gene, neurogenesis, and exercise response gene groups. Neurogenesis, neurite outgrowth, and neuronal plasticity associated with BDNF, glutamate, and cAMP–protein kinase A signaling pathways may mediate the antidepressant effects of ECT in humans. These genes, and others that increase only with chronic ECS such as neuropeptide Y and thyrotropin-releasing hormone, may provide novel ways to select drugs for the treatment of depression and mimic the rapid effectiveness of ECT.
Keywords: hippocampus, frontal cortex, ECS, microarray, gene expression, depression, bipolar disorder
Introduction
Psychiatric depression, associated with major depressive disorder (MDD) and psychotic depression, is treated with several classes of antidepressant drugs, all of which require several weeks to be effective. For many patients who do not respond to such drugs, electroconvulsive therapy (ECT) remains a highly effective and rapid treatment. The receptor interactions and other pharmacological actions of the chemical antidepressants have been well studied. In contrast, the mechanism(s) for their long-term anti-depressant efficacy, or for that of ECT, remains unclear. The molecular effects of electroconvulsive seizure (ECS), an animal model of electroconvulsive therapy, are diverse and comprise increases in levels of neurotransmitters, neuropeptides, and synaptic remodeling including neuronal sprouting (for review, see Fochtmann, 1994). ECS affects several brain regions, particularly the hippocampus, frontal cortex, neostriatum, entorhinal cortex, temporal-parietal cortex, and several monoaminergic nuclei that project to these areas (Table A; available at http://www.psygenomics.com/html/Supplemental_Table_A.pdf). Because the greatest benefits of antidepressants and ECT are derived with chronic treatment, the chronic molecular effects of ECS may reveal mechanisms of their therapeutic efficacy.
An analysis of gene changes after single or multiple ECS treatments might be expected to identify changes specific to chronic treatments, as well as potential initial triggering mechanisms. Investigations into the mediators of ECS have evaluated one or, at most, only several mRNA species in any brain region (Table A; available at http://www.psygenomics.com/html/Supplemental_Table_A.pdf). Hendriksen et al. (2001) measured multiple gene expression changes in the hippocampus, but only 8 d after local seizures induced by electrical stimulation had been terminated by pentobarbital. The only other study of this kind was by Lukasiuk et al. (2003), in which hippocampal and temporal lobe expression profiling was conducted in animals subjected to amygdala kindling but before they developed spontaneous seizures.
We studied the effects of single versus repeated ECS exposures on gene transcription to identify genes and potential biochemical pathways that are associated with the efficacy of chronic ECT. To accomplish this, gene changes in the rodent brain were measured using Affymetrix (Santa Clara, CA) U34 high-density oligonucleotide microarrays after a single or 10 repeated ECS treatments. A large subset of gene expression changes identified with the gene microarrays was confirmed with real time reverse transcription (RT)-PCR. The hippocampus and frontal cortex were selected for analysis because they are the most heavily implicated CNS areas in the biochemical basis of human depression. Positron emission tomography imaging studies and postmortem analyses (Drevets et al., 1999; Austin et al., 2002; Davidson et al., 2002; Liotti et al., 2002) have revealed multiple abnormalities of regional cerebral blood flow, glucose metabolism, and serotonin fiber densities in these regions in depression associated with MDD and, in some cases, bipolar disease. Consistent with their role in mediating effects of seizures, the frontal cortex and hippocampus are implicated in 74% of all rodent-based studies of gene changes after seizures (Table A; available at http://www.psygenomics.com/html/Supplemental_Table_A.pdf).
Materials and Methods
Subjects. Male Sprague Dawley rats (ACE Animals, Boyertown, PA) were 4–6 months of age and weighed 200–350 gm at the beginning of the experiment. Animals were housed two per cage under standard conditions, including ad libitum access to food and water in a 12 hr light/dark vivarium.
ECS delivery. Animals were handled for 3 d before the beginning of the experiment to become adjusted to the seizure induction area and the application of the ear-clip electrodes. The seizure induction or sham-seizure induction areas consisted of plastic cages with fresh bedding material. Each cage was placed on a lab bench, and a pair of electrodes was hung over the top of each cage. One set of electrodes was connected to the ECT unit (number 57800; Ugo Basile, Comerio, Italy) for use with the ECS animals, and the other set (for control animals) was disconnected from the ECT unit such that no current could be delivered. Cage mates were run concurrently; one animal was randomly assigned to the shock group and the other to the control group. Both animals were removed from their home cage and placed in the appropriate testing cage. Each set of ear-clip electrodes was dampened with saline and attached to the deep region of the pinna. The shock, a square wave pulse (pulse width, 0.7 msec; 50 Hz) of 50 mA (Madsen et al., 2000) was administered for 1.0 sec to provide a tonic seizure phase characterized by extension of all limbs and forward head extension that lasted for 10–15 sec. ECS and control animals were returned to their home cage 10 min after seizure induction. Acute ECS animals (n = 12) were given a single shock. Chronic ECS animals (n = 12) were given one ECS per day for 10 consecutive days. Control group rats (n = 12 acute; n = 12 chronic) followed this protocol.
Visual observation of behaviors and side effects. Visual observations were sufficient to confirm the presence of clonic–tonic seizures immediately after the shock. Side effects during the postictal phase, which lasted ∼10 min, were best characterized by heightened responsivity to auditory and tactile stimulation and decreased motor activity. General behavioral observations in the home cage for up to 6 hr postshock administration revealed sedation but no signs of recurrent seizures.
Brain area dissections. Animals were killed by decapitation without anesthesia ∼4 hr after the final ECS treatment as commonly used (Table A; available at http://www.psygenomics.com/html/Supplemental_Table_A.pdf). The brain was removed from the calvarium and immersed in crushed ice for 3–5 min. Coronal slabs of 2 mm thickness were prepared, from which the frontal cortex and hippocampus were dissected. The brain regions were weighed, frozen on dry ice, and stored at –80°C.
RNA extraction. Total RNA was extracted from 70–100 mg of frozen rat tissue with 0.7–1.0 ml of TRIzol reagent (Invitrogen, Carlsbad, CA) as per the instructions of the manufacturer. The tissue was homogenized with a Polytron (Fisher Scientific, Houston, TX) for 30 sec. The homogenate was cleared by a 10 min centrifugation at 10,000 × g, and 0.2 ml of chloroform was added per milliliter of TRIzol. The samples were vigorously shaken for 20 sec and incubated on ice for 10 min. The aqueous phase was separated by centrifugation at 10,000 × g for 10 min and decanted, and an equal volume of isopropanol was added to this aliquot. The mixture was allowed to precipitate for 10 min, and the precipitate was collected by centrifugation at 12,000 × g for 10 min. The pellet was washed with 70% ethanol, collected by a brief centrifugation, air dried, and resuspended in H2O. The RNA was further purified using an RNeasy column (Qiagen, Valencia, CA). The purified RNA was quantified by a UV spectrophotometer, and RNA quality was determined by capillary electrophoresis using an Agilent (Palo Alto, CA) Bioanalyzer.
Gene expression profiling. RNA (10 μg) was converted to double-stranded cDNA after priming with an oligo-dT-T7 promoter primer (Operon, Alameda, CA). The resultant cDNA was purified by phenol-chloroform extraction, ethanol precipitated, and resuspended in H2O. The purified cDNA was subjected to in vitro transcription using T7 polymerase in the presence of biotinylated UTP and CTP (Enzo Life Sciences, Farmingdale, NY). The resultant amplified RNA (aRNA) was purified with an RNeasy column (Qiagen), eluted in H2O, and quantified using a UV spectrophotometer. aRNA (15 μg) was fragmented following the Affymetrix protocol. The quality of RNA fragmentation was checked on the Agilent Bioanalyzer, and 30 μl was added to 270 μl of hybridization buffer and hybridized to the Affymetrix U34A Rat Genome GeneChip. After 16 hr of hybridization at 45°C, the GeneChip was washed, stained, and scanned according to the standard Affymetrix protocol.
Statistical analysis. Each gene on Affymetrix U34A gene chips is represented by one or more of ∼8800 “probe sets,” or sets of oligonucleotides that are derived from the mRNA sequence of that particular gene. After hybridization and scanning, each probe set was assigned a “present” or “absent” call and an overall fluorescent signal intensity as determined by the Affymetrix Microarray Suite Software 5.0 after global normalization. Scatter diagrams and estimates of sample sizes required for identifying significant gene changes were limited to probes that were present in at least one sample for either group. This procedure filtered out ∼50% of all probe sets. The identification of gene overlaps between experiments and of specific gene changes was limited to probe set(s) reported as present in at least 50% of all samples in either the control or ECS group and only if the mean fluorescence intensity for either the control or treatment group was >100.
A principal component analysis (PCA) was performed using Partek Pro 2000 software package (Partek, St. Charles, MO), with arrays as objects and probe sets as variables to detect outlier arrays. PCA plots mapped the distribution of arrays within a three-dimensional space defined by the three greatest contributors to the variance in total gene expression values. The position of an array on such plot reflects the overall expression profile of the sample as measured by the array. The arrays that appeared as outliers on the plots were removed from further analysis. The PCA outliers were primarily associated with a noted technical problem, including marginally acceptable RNA quality, regional blotches in hybridization signals, or weak overall hybridization on the gene chip.
Genes were considered to have been changed by acute or chronic ECS versus that of the sham-treated controls if the comparison generated a p value <0.05 using the two-tailed Welch t test and only if the ratio of means exceeded 1.5 or was <0.67. In a multiple testing setting, the p value of 0.05 does not really mean that the probability of type 1 error is 0.05, unless the Bonferroni's correction has been applied. We did not use the Bonferroni's correction, because it would result in many type 2 errors and the loss of most of the valid hits as p values that generally exceeded 10–6. The uncorrected p value of a statistical test is useful primarily as a measure of difference between data sets. A parametric p value may out-perform a permutational one as a distance metric, according to a recent study (Xu and Li, 2003). In addition, the ratio of means cutoff of 1.5 for increased genes and 0.67 for decreased genes enhanced the verification rate of gene expression changes by RT-PCR. GeneSpring analysis software (Silicon Genetics, Redwood City, CA) was used to evaluate the overlap between the gene changes identified in the four comparisons.
Quantitative RT-PCR assay. Because ∼3500–4400 genes were present in each sample, we expected to obtain a significant number of false positives. To evaluate this possibility and the ability of the microarray chip to determine relatively small gene changes, RT-PCR was used to independently measure in all samples 60 of the genes that were found to be altered with the microarray chip. Total RNA (2 μg) was subjected to DNase treatment in a 10 μl reaction containing 1 μl of 10× DNase I reaction buffer and 1 μl of DNase I (Invitrogen). The reaction was performed at room temperature for 10 min. One microliter of EDTA (25 mm) and 1 μl of oligo (dT)12–18 mer (0.5 μg/ml; Invitrogen) were added to DNase reaction and heated to 70°C for 15 min in a water bath to simultaneously inactivate the DNase I activity and eliminate RNA secondary structure to allow oligo dT-poly A annealing. The sample was placed on ice for 2 min and collected by brief centrifugation. The RNA in the sample was reverse-transcribed into cDNA by the addition of 8 μl of master mix containing 4 μl of 5× concentration first strand buffer, 2 μl of DTT (0.1 m), 1 μl of dNTPs (10 mm each), and 1 μl of SuperScript II (200U/μl; Invitrogen) and incubated at 42°C for 45 min. The RT reaction was diluted 10-fold with dH2O and stored at 4°C.
Each of the acute hippocampus experiment samples was diluted to 0.75, 0.5, and 0.25 of normal concentrations to evaluate the ability of RT-PCR to accurately measure 25, 33, and 50% decreases in mRNA levels and to detect the mRNA changes between the sham and ECS groups across these dilutions. Each dilution group was assayed separately for three genes that were randomly selected from those that produced high significance (p ≤ 1E-04) for the 35–65% increases or decreases in expression typically observed in the microarray studies. Glyceraldehyde-3-phosphate dehydrogenase (GAPDH) was included as a reference for normalization and as an example of a gene that did not change by ECS on the gene chip.
For each specific gene tested, diluted cDNA (5 μl) was added to 45 μl of PCR reaction mixture that contained 25 μlof2× concentration SYBR Green PCR Master Mix (Applied Biosystems, Warrington, UK) and 25 pmol of each forward and reverse primer. Each sample was subjected to 40 cycles of real time PCR (ABI 7900; Applied Biosystems) where fluorescence is measured several times during each cycle of two-step PCR alternating between 95°C for 15 sec and 60°C for 1 min. The threshold cycle, or point at which signal fluorescence exceeds background, for each sample for each gene was compared with a standard curve to determine a relative expression value. Because of limited amounts of sample RNA, the standard curve was generated by real time PCR analysis of five 10-fold serial dilutions of a cDNA generated from the RNA of rat cortical stem cells. This method does not provide an absolute quantitative value but allows a relative comparison between samples. The expression value of each gene was normalized to the amount of GAPDH in that sample to calculate a relative amount of transcript present for each gene. The normalized expression values for all control and treated samples were averaged, and an average fold change was determined. A Student's t test was conducted between the normalized relative expression values for each individual control and treated samples to determine statistical relevance.
Results
Four sets of microarray hybridizations were conducted to evaluate the effects of acute or chronic ECS treatment on gene expression in the frontal cortex and hippocampus (Fig. 1). At gene abundances >100, each scatter plot of mean intensities displayed minimal skewing about the unity line. The distribution of points was generally quite close to the unity line, but many statistically significant outliers were found, as illustrated by white dots (Fig. 1). PCA showed that the frontal cortex and hippocampus transcriptome segregated into distinct clusters (data not shown), similar to that reported for different human CNS brain regions (Palfreyman et al., 2002). Outlier samples in the PCA analysis were readily distinguished from this three-dimensional plot, and zero to two samples were removed from each group before statistical analysis.
Figure 1.
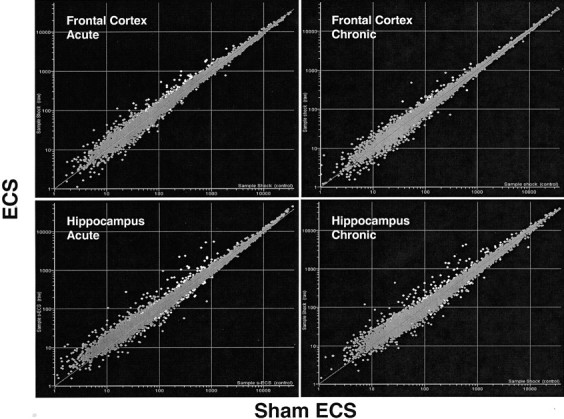
Plot of the mean abundances of each of the 8799 probe sets measured with the Affymetrix U34A rodent chip in the frontal cortex or hippocampus of rats that were exposed to either acute or chronic ECS (n = 10 per group; y axes) or sham control (n = 10 per group; x axes). Genes in white are those with ECS/control group ratios >1.5 or <0.67, with p <0.05, and passing minimum expression restrictions.
Our initial concern was to determine the number of samples per group needed to reliably identify differentially expressed genes. The 8–10 microarrays used for each group allowed us to calculate the number of significant mRNA changes obtained with various group sizes. From the acute hippocampus experiment, we randomly created subgroups of 2–10 samples from the sham- or ECS-treated groups or from a random mixture of these two groups. Statistical comparisons of 100 such subgroups were performed with Welch t tests. Each time, we calculated the number of genes that changed on the basis of p = 0.01. We expected ∼40 genes to appear as hits because of random technical and biological variations, independent of any real ECS treatment effect, from the 3500–4400 detected genes. Comparisons between subgroups created from within the ECS or control animals only, or from the “mixed” animals, produced approximately this chance number of gene changes (Fig. 2). In contrast, the number of significant gene changes between sham- and ECS-treated animals increased steeply from chance level at a group size of two to 15-fold above chance at a group size of 10. Virtually identical results were obtained with the frontal cortex data after acute ECS (data not shown). Thus, although larger groups may have identified more gene expression changes, 8–10 rats per group were clearly sufficient to detect a large number of highly significant changes resulting from ECS.
Figure 2.

The effect of sample size on the number of identified gene changes (Hits; p < 0.01, independent of fold change) is significant only for comparisons between sham- and ECS-treated rats. Groups of 2–10 were randomly composed from the hippocampus of acute sham-treated rats (sham), acute ECS-treated rats (ECS), or mixtures of rats from both groups (mixed). The number of hits was calculated for each microarray analysis of these samples, and this process was repeated 100 times for each sample size. Values are means ± SD. A calculation of 40 “theoretical chance” gene changes was based on p < 0.01 for the ∼4000 probes detected in the frontal cortex with at least a single present call in one group and a mean abundance >100.
Many genes are represented on the Affymetrix RG-34A chip by more than one probe set. We found 12 genes of which significant change attributable to the ECS treatment was identified by multiple probe sets (bolded gene names in Table 1). We randomly selected 5 of these 12 genes to determine the degree to which the changes in probe sets for each gene were in agreement. The numbers of probe sets reporting significant and codirectional change attributable to ECS treatments were five of seven for brain-derived neurotrophic factor (BDNF), two of two for prostaglandin (PG)-endoperoxide synthase 2 (Cox-2), two of four for Jun, two of three for transforming growth factor β inducible early growth response (TIEG), and one or two of four (depending on treatment and tissue) for catalase. The five probe sets for BDNF, Jun, and TIEG as well as one for the catalase probe sets that did not show a statistically significant change produced only absent calls or <100 abundance units in all rat brain samples. For this and other reasons, we filtered out genes that produced <50% present calls in one group or generated <100 abundance units.
Table 1.
Fold change (ratio), significance (p value), and ranking of genes identified as altered in hippocampus (H) and frontal cortex (F) after acute (A) or chronic (C) ECS exposure
|
|
Gene |
|
|
|
|
|
|---|---|---|---|---|---|---|
|
p value ranking (shading, unreported finding) |
Bold, gene is identified by more than one probe set Shading, same change with exercise |
Accession number |
Microarray |
Other regions with significant change |
||
| Ratio |
p value |
|||||
| Hippocampus chronic ECS with biggest change | ||||||
| 60 | Brain-derived neurotrophic factor (BDNF) (exon IV) | AI030286 | 4.78 | 1E-03 | AII | |
| 91 | Cyclooxygenase isoform (COX-2) | S67722 | 7.33 | 7E-03 | AII | |
| 64 | TGFB inducible early growth response (TIEG1) | AI071299 | 4.68 | 1E-03 | AII | |
| 83 | Minoxidil sulfotransferase | L19998 | 0.50 | 4E-03 | FA | |
| 120 | Solute carrier family 3, member 1 | M80804 | 0.44 | 5E-02 | FC, HA | |
| 35 | Activity and neurotransmitter induced early gene 3 (ania-3) | AF030088 | 4.79 | 4E-05 | HA | |
| 87 | HES-1 factor | D13417 | 2.09 | 5E-03 | HA | |
| 76 | HMG-CoA reductase | X55286 | 1.82 | 3E-03 | HA | |
| 88 | Interferon-related developmental regulator 1 | AI014163 | 2.03 | 6E-03 | HA | |
| 58 | Putative potassium channel TWIK | AF022819 | 1.83 | 9E-04 | HA | |
| 112 | Pyruvate dehydrogenase phosphatase isoenzyme 1 | AF062740 | 1.83 | 2E-02 | HA | |
| 28 | Activin type I receptor | L19341 | 1.63 | 3E-05 | ||
| 59 | Ash-s | D49847 | 1.56 | 1E-03 | ||
| 85 | β defensin-1 | AF068860 | 0.57 | 5E-03 | ||
| 97 | BRL-3A binding protein | A09811 | 0.32 | 1E-02 | ||
| 115 | Calvasculin; S100 calcium-binding protein A4 | X06916 | 1.58 | 3E-02 | ||
| 66 | DNA-damage-inducible transcript 1 | L32591 | 1.68 | 2E-03 | ||
| 67 | Enhancer-of-split and hairy-related protein 1 (SHARP 1) | AF009329 | 2.06 | 2E-03 | ||
| 62 | EST106597 | H31990 | 0.64 | 1E-03 | ||
| 99 | EST196314 (tescalcin) | AA892511 | 1.53 | 1E-02 | ||
| 116 | EST203592 (chromobox homolog 1) | AI009141 | 0.63 | 3E-02 | ||
| 63 | EST213163 (FK506 binding protein 3) | AI103874 | 0.63 | 1E-03 | ||
| 96 | Heme oxygenase-3 | AF058787 | 1.61 | 9E-03 | ||
| 119 | Insulin-like growth factor II (somatomedin A) | X17012 | 0.44 | 5E-02 | ||
| 77 | Isovaleryl coenzyme A dehydrogenase | AI102838 | 0.64 | 3E-03 | ||
| 102 | Neuropeptide Y (NPY) | M15880 | 2.14 | 1E-02 | ||
| 103 | Potassium voltage-gated channel, shaker-related member 4 | M32867 | 1.61 | 1E-02 | ||
| 79 | PP1M M110 | S74907 | 1.76 | 3E-03 | ||
| 89 | Prostaglandin D synthase | J04488 | 0.35 | 6E-03 | ||
| 90 | Protein phosphatase 1, regulatory (inhibitor) subunit 1A | J05592 | 1.62 | 6E-03 | ||
| 113 | rx04826s Rattus norvegicus cDNA clone (similar to Nedd4) | AI639058 | 1.62 | 2E-02 | ||
| 92 | SHB (Src homology 2 domain containing) adaptor protein B | AA859468 | 1.77 | 7E-03 | ||
| 74 | Tachykinin 2 [Neurokinin B precursor (NKB)] | M16410 | 3.36 | 2E-03 | ||
| 47 | Thymosin β-10 | M58404 | 1.51 | 3E-04 | ||
| 105 | Thyrotropin-releasing hormone | M23643 | 2.01 | 1E-02 | ||
| Hippocampus acute ECS with biggest change | ||||||
| 2 | Narp | S82649 | 5.89 | 7E-09 | AII | |
| 21 | ets variant gene 3 | AA859750 | 1.62 | 1E-05 | FA | |
| 53 | BHF-1 | D82074 | 0.44 | 6E-04 | FA, HC | |
| 37 | fos-related antigen (fra-2) | AA875032 | 3.16 | 8E-05 | FA, HC | |
| 27 | Metallothionein 1 A | AI102562 | 2.04 | 2E-05 | FA, HC | |
| 11 | Nerve growth factor-induced clone C | M92433 | 2.98 | 1E-06 | FA, HC | |
| 73 | rx04104s (Neurod1) | AI639109 | 0.42 | 2E-03 | FA, HC | |
| 44 | Silencer factor B (SF-B) | X60769 | 1.76 | 2E-04 | FA, HC | |
| 7 | Vesl | AB003726 | 6.50 | 2E-07 | FA, HC | |
| 8 | Activity and neurotransmitter-induced early gene protein 4 (ania-4) | AF030089 | 2.58 | 6E-07 | HC | |
| 10 | cAMP-regulated phosphoprotein | S65091 | 2.09 | 7-07 | HC | |
| 9 | Cytosolic phospholipase A2, group IVA | U38376 | 1.79 | 6-07 | HC | |
| 5 | DNAJ (Hsp40) homolog, subfamily B, member 5 | AA891542 | 2.32 | 1E-07 | HC | |
| 18 | EST190175 (atrophin-1 related protein) | AA800678 | 0.64 | 9E-06 | HC | |
| 1 | Growth factor (Arc) | U19866 | 4.82 | 6E-09 | HC | |
| 16 | Growth factor receptor bound protein 2 (GRB2) | AI170776 | 1.68 | 6E-06 | HC | |
| 78 | MHC class 1b RT1.S3 | AI235890 | 1.81 | 3E-03 | HC | |
| 72 | Neuropilin | AF016296 | 1.67 | 2E-03 | HC | |
| 12 | Roaz | U92564 | 0.59 | 1E-06 | HC | |
| 23 | Aldehyde dehydrogenase | M73714 | 0.44 | 2E-05 | ||
| 81 | Arginine vasopressin (diabetes insipidus) | M25646 | 1.52 | 4E-03 | ||
| 55 | Catalase | AA891848 | 0.60 | 8E-04 | ||
| 20 | Chemokine CX3C | AF030358 | 1.59 | 1E-05 | ||
| 107 | Decorin | AI639233 | 0.66 | 2E-02 | ||
| 49 | Developmentally regulated protein TP01 | AI012275 | 0.61 | 4E-04 | ||
| 29 | Di-N-acetylchitobiase | M95768 | 0.66 | 3E-05 | ||
| 61 | Early growth response 1 (EGR1) | AI176662 | 1.63 | 1E-03 | ||
| 68 | EST189184 | AA799687 | 0.65 | 2E-03 | ||
| 41 | EST190198 (coagulation factor III) | AA800701 | 1.58 | 2E-04 | ||
| 45 | EST195538 | AA891735 | 1.58 | 3E-04 | ||
| 40 | EST195957 (Mad4 homolog) | AA892154 | 0.67 | 1E-04 | ||
| 46 | EST196165 | AA892362 | 0.65 | 3E-04 | ||
| 36 | EST197009 | AA893206 | 1.63 | 4E-05 | ||
| 69 | FGF receptor-1 | D12498 | 1.51 | 2E-03 | ||
| 82 | GADD153 | U30186 | 1.78 | 4E-03 | ||
| 100 | Glutathione S-transferase, theta 2 | AI138143 | 0.63 | 1E-02 | ||
| 31 | Metabotropic glutamate receptor (GluR1) | M61099 | 0.60 | 3E-05 | ||
| 32 | Myr 6 myosin heavy chain | U60416 | 0.65 | 3E-05 | ||
| 101 | NAC-1 protein | AF015911 | 1.63 | 1E-02 | ||
| 109 | Neural receptor protein-tyrosine kinase (TrkB) | M55291 | 1.52 | 2E-02 | ||
| 4 | Neuritin | U88958 | 1.56 | 1E-08 | ||
| 110 | NMDAR1 glutamate receptor subunit | U11418 | 1.59 | 2E-02 | ||
| 22 | Nuclear orphan receptor HZF-3 (NURR1) | U01146 | 1.70 | 1E-05 | ||
| 43 | Nuclear pore complex protein Nup50 | U41845 | 1.52 | 2E-04 | ||
| 17 | Phosducin-like protein | L15354 | 0.56 | 6E-06 | ||
| 80 | Protein tyrosine phosphatase (PtP4a2) | AJ007016 | 1.51 | 3E-03 | ||
| 111 | Protein-tyrosine phosphatase (Ptpn1, non-receptor type 1) | AI180145 | 1.66 | 2E-02 | ||
| 94 | 3CH134/CL100 Protein tyrosine phosphatase | S81478 | 1.67 | 8E-03 | ||
| 34 | rx00382s Rattus norvegicus cDNA clone | AI639155 | 0.56 | 3E-05 | ||
| 15 | rx00909s Rattus norvegicus cDNA clone | AI638960 | 0.62 | 3E-06 | ||
| 50 | rx00967s Rattus norvegicus cDNA clone | AI639015 | 0.61 | 4E-04 | ||
| 51 | rx01019s Rattus norvegicus cDNA clone | AI639256 | 0.62 | 4E-04 | ||
| 52 | rx04422s Rattus norvegicus cDNA clone | AI639169 | 0.66 | 5E-04 | ||
| 104 | S-adenosylmethionine decarboxylase | AI008131 | 1.55 | 1E-02 | ||
| 14 | Tissue inhibitor of metalloproteinase 1 (TIMP1) | AI169327 | 11.39 | 2E-06 | ||
| 95 | Transcription factor UBF | M61725 | 1.58 | 8E-03 | ||
| 13 | Transducin-like enhancer of split 1(Tle1) | AA875084 | 0.60 | 1E-06 | ||
| 114 | UI-R-E0-bs-h-03-0-UI.s1 UI-R-E0 Rattus norvegicus cDNA clone | AA859627 | 1.56 | 2E-02 | ||
| 48 | UI-R-E0-ci-e-02-0-UI.s1 UI-R-E0 Rattus norvegicus cDNA clone | AA874943 | 0.64 | 3E-04 | ||
| 39 | Vascular endothelial growth factor (VEGF) | AA850734 | 1.73 | 8E-05 | ||
| 3 | VGF nerve growth factor inducible | M74223 | 2.35 | 8E-09 | ||
| 118 | Voltage-dependent potassium channel; (shaker-related subfamily) | X12589 | 1.83 | 4E-02 | ||
| 93 | Y box protein 1 | AI230572 | 1.53 | 7E-03 | ||
| Frontal cortex chronic ECS with biggest change | ||||||
| 86 | EST194857 | AA891054 | 1.82 | 5E-03 | FA | |
| 108 | EST220045 | AI176460 | 1.58 | 2E-02 | ||
| 117 | Leucine-rich acidic nuclear protein | D32209 | 1.60 | 4E-02 | ||
| Frontal cortex acute ECS with biggest change | ||||||
| 24 | CCAAT/enhancerbinding, protein (C/EBP) delta | M65149 | 2.95 | 2E-05 | ||
| 71 | Jun | AI175959 | 1.61 | 2E-03 | FC, HA | |
| 25 | Ceruloplasmin (ferroxidase) | L33869 | 1.81 | 2E-05 | HA | |
| 6 | Jun B | X54686 | 2.21 | 1E-07 | HA | |
| 56 | Nuclear receptor subfamily 4, group A, member 3 (NOR1) | AI176710 | 1.62 | 8E-04 | HA | |
| 19 | c-fos | X06769 | 2.22 | 1E-05 | HA, HC | |
| 54 | krox20; (early growth response 2) | U78102 | 3.13 | 7E-04 | HA, HC | |
| 57 | Cytochrome P450 1b1 | AI176856 | 1.51 | 9E-04 | HC | |
| 42 | Glial fibrillary acidic protein δ; glial fibrillary acidic protein α | AF028784 | 1.77 | 2E-04 | HC | |
| 106 | β-carotene 15, 15′-dioxygenase | AI014135 | 0.59 | 2E-02 | ||
| 98 | Connexin protein Cx26 (gap junction β-2 protein) | X51615 | 0.66 | 1E-02 | ||
| 26 | EST190350 | AA800853 | 1.55 | 2E-05 | ||
| 75 | EST215655 (similar to G33) | AI169756 | 1.78 | 3E-03 | ||
| 70 | Lavin-containing monooxygenase 1 | M84719 | 0.67 | 2E-03 | ||
| 30 | Interleukin 6 receptor | M58587 | 1.74 | 3E-05 | ||
| 38 | Lost on transformation 1 (L0T1) | U72620 | 1.58 | 8E-05 | ||
| 84 | Phosphatidylinositol 3-kinase p85 α subunit | D64045 | 2.02 | 4E-03 | ||
| 33 | Phosphodiesterase 4B, cAMP-specific | M25350 | 1.54 | 3E-05 | ||
|
65
|
UI-R-A0-bd-e-03-0-UI.s1 UI-R-A0 Rattus norvegicus cDNA clone |
AA866485 |
1.53 |
1E-03 |
|
|
After filtering genes by these criteria, a total of 120 unique genes (Table 1) were differentially expressed in ECS-treated rats compared with controls in at least one of the four ECS experiments. Thirty-nine genes were identified in multiple tissues or ECS treatment groups, and 81 genes changed in only one group (Fig. 3). The most dramatic response to ECS occurred in the hippocampus after a single acute shock, in which 79 genes were differentially regulated (Fig. 3). Chronic ECS treatment resulted in almost as many (57) gene changes in the hippocampus, and approximately half of these were distinct from those that changed after a single ECS. The frontal cortex was far less responsive than the hippocampus, with 33 gene changes with acute ECS, and only 9 genes identified with chronic ECS. Eleven genes that were regulated in the same direction in the hippocampus by ECS and after exercise (Russo-Neustadt et al., 1999; Tong et al., 2001; Molteni et al., 2002) are marked in Table 1 by the shading of the gene name.
Figure 3.

Venn diagram representation of the distribution of changes (p < 0.05, ratio of change >1.5 or <0.67) in the 120 unique genes in the frontal cortex and hippocampus after acute or chronic ECS. Genes are represented only if the corresponding probe was detected as present in at least 50% of samples in one group, and mean abundance exceeded 100. The overlaps of three genes between hippocampus chronic and frontal cortex acute could not be illustrated and are included in the tally of genes for these two tissues (shown in parentheses).
An additional 19 genes with p values of <0.005 and fold changes of <1.5-fold were identified (Table 2). Among the total of 139 genes identified in the present study, 52 are among the 88 mRNA or protein species that have been observed by others to change in the rodent brain after ECS (Table A; available at http://www.psygenomics.com/html/Supplemental_Table_A.pdf), whereas 87 of our 139 genes are unreported. Clearly, microarray studies are capable of replicating statistically significant mRNA changes in the brain obtained with other methods such as Northern blot and in situ hybridizations.
Table 2.
List of genes that changed < 1.5-fold but with high significance
|
Gene |
|
|
|
|
|
|
|---|---|---|---|---|---|---|
| Bold, gene is identified by more than one probe set Shading, unreported finding |
Accession number |
Microarray |
Brain region (with lowest p value) |
Other regions with significant change |
||
| Ratio |
p value |
|||||
| Neurofilament protein middle (NF-M) | Z12152 | 1.26 | 4E-08 | HA | ||
| Neurofilament protein; rat smallest (NF-L) | M25638 | 1.49 | 2E-07 | HA | HC | |
| EST 189694 normalized rat heart | AA800197 | 0.69 | 4E-07 | HA | HC | |
| EST 197783 normalized rat placenta | AA893980 | 0.76 | 6E-06 | HA | HC | |
| Beta-tubulin T β 15 (aa 1-445) | X03369 | 1.27 | 1E-05 | HC | ||
| Light molecular weight neurofilament | AF031880 | 1.4 | 1E-05 | HA | HC | |
| SH3-domain GRB2-like 1 | A1010110 | 1.26 | 1E-05 | HA | ||
| Sodium-dependent neurotransmitter transporter, ventral midbrain | S56141 | 0.78 | 1E-05 | HA | ||
| EST 195383 normalized rat kidney | AA891580 | 0.67 | 2E-05 | HC | HA | |
| Bcl-2 associated death agonist (BAD) | AA818072 | 0.8 | 3E-05 | HA | HC | |
| Phospholipase C-β 1 | L14323 | 0.79 | 3E-05 | HA | ||
| Neuron glucose transporter | D13962 | 1.4 | 7E-05 | FA | ||
| Phospholipase D gene 2 | NM_033299 | 0.72 | 1E-04 | HA | HC | |
| GABA-A receptor | X51992 | 0.79 | 2E-04 | HC | HA | |
| Diacylglycerol kinase | S49760 | 1.37 | 4E-04 | HC | ||
| Synapsin 2 | M27925 | 1.34 | 4E-04 | FC | ||
| Growth factor receptor bound protein 2 | AA801130 | 1.23 | 5E-04 | HC | HA, FC | |
| Glypican | L02896 | 1.28 | 3E-03 | HC | FA, FC | |
|
Ras homolog enriched in brain
|
A1009605 |
1.42 |
3E-03 |
HA |
HC |
|
Columns are defined as in Table 1.
Nineteen genes were regulated similarly with acute or chronic ECS in the hippocampus and frontal cortex (Fig. 3). This indicates that many changes throughout the brain after shock therapy may occur independently of the cellular heterogeneity of these regions. When considering Tables 1 and 2, 29 genes changed only after chronic ECS, and 59 changed only after acute ECS. In the hippocampus, 31 genes changed after acute and chronic ECS, as did 7 in the frontal cortex. The between-animal and between-region consistency of many gene changes was indicted by the finding that, of the 39 genes that changed in more than one tissue or after both durations of ECS (Fig. 3, Table 1), only one gene changed in opposite directions. Solute carrier family 3, member 1 decreased in the frontal cortex and hippocampus after chronic ECS but increased in the hippocampus after acute ECS.
Four genes were codirectionally changed after chronic and acute ECS treatments in the hippocampus and frontal cortex (Fig. 3, Table 1). These four genes are BDNF, COX-2, neuronal activity-regulated pentraxin (Narp), and TGFβ-inducible early growth response (labeled as All in Table 1). Each of these genes or their biological pathways has been reported by others to change after ECS treatment or seizure in rats (Nibuya et al., 1995; Hashimoto et al. 1998; Zetterstrom et al., 1998) (Table A; available at http://www.psygenomics.com/html/Supplemental_Table_A.pdf). Approximately two-thirds (81) of the identified genes were unique to a single experiment (Fig. 3), suggesting that acute and chronic ECS can influence the expression of different genes, and that genes in the hippocampus and frontal cortex can respond differently to ECS.
We used quantitative RT-PCR as an independent method to confirm the relatively small (less than twofold) changes seen by microarray. Therefore, we needed to ensure the ability of the RT-PCR assay to detect small differences in mRNA amounts. This was determined in two ways, first with a tissue dilution study and second with genes that produced small (∼30%) changes. Serial dilutions of each sample were made from the acute hippocampus experiment, and RT-PCR was used to measure the effects of both dilution and ECS treatment in all dilutions for four representative genes. The gene expression levels for each sample were normalized to the GAPDH expression for that sample to account for variations in efficiency of the RT reaction. The normalized relative expression values were averaged (n = 10 rats per group) and compared for each dilution group. A t test that compared the decrease in normalized expression from dilutions of 1× to 0.75×, from 0.75× to 0.5×, and from 0.5× to 0.25× for either the sham or ECS groups demonstrated statistically significant decreases (p < 0.01) between each dilution, except for neuropilin at the 0.5× dilution (Fig. 4). The magnitude and statistical significance of gene changes between the sham and ECS groups for the three genes measured by microarray (Table 1) and lack of change in GAPDH were replicated by the RT-PCR method regardless of the dilution, except at the greatest dilution of the EST189184 gene (Fig. 4).
Figure 4.

Ability of the RT-PCR assay to detect small differences in genes identified by the Affymetrix microarray. The expression of three genes was measured for each sample (n = 10 rats per acute hippocampus group) and normalized to the GAPDH expression for that sample to account for variations in efficiency of the RT reaction. The normalized expression values (mean ± SEM × 103) of each of the three genes differed significantly (p < 0.01; t test) between the sham and ECS-treated rats in the parent material and at the 0.75×, 0.5×, and 0.25× dilutions, except for the normalized rat heart EST189184 gene at the greatest dilution and GAPDH at all dilutions. The normalized expression values of each gene also decreased (p < 0.05; t test) at each dilution for all four genes compared with the one preceding it for both the sham and ECS groups, except for neuropilin at the 0.5× dilution.
The large number of genes measured in any experiment increases the number of genes that may be false positives and increases the challenge to determine which gene changes can be confirmed by other methods (Zhang, 2002; Xu and Li, 2003). Approximately 1200 RT-PCR assays were conducted with hippocampal or frontal cortex tissues after acute or chronic ECS, focusing on 60 genes from Tables 1 and 2 with the largest fold change and best statistical significance determined by microarray analysis (Table 3). The genes were also selected to represent various protein classes and for their biological relevance to depression or its treatment based on our knowledge of the literature.
Table 3.
Confirmation of select gene changes by quantitative RT-PCR
|
|
|
RT-PCR |
Microarray |
||||
|---|---|---|---|---|---|---|---|
| UniGene |
Gene |
Ratio |
p value |
Ratio |
p value |
||
| Hippocampus, chronic ECS | |||||||
| Rn.964 | Insulin-like growth factor II (somatomedin A) | 0.33 | 4.4E-02 | 0.44 | 5E-02 | ||
| Rn.11400 | Prostaglandin D synthase | 0.34 | 3.9E-02 | 0.35 | 6E-03 | ||
| Rn.19727 | Hairy and enhancer of split 1 (Drosophila) | 1.27 | 1.8E-02 | 2.09 | 5E-03 | ||
| Rn.18568 | Rat smallest neurofilament protein (NF-L) mRNA | 1.31 | 2.1E-03 | 1.22 | 4E-02 | ||
| Rn.7044 | Glypican 1 | 1.33 | 1.6E-02 | 1.28 | 3E-04 | ||
| Rn.78188 | Heme oxygenase-3 (H0-3) mRNA | 1.42 | 2.3E-02 | 1.61 | 9E-03 | ||
| Rn.859 | Ras homolog enriched in brain | 1.54 | 6.7E-04 | 1.45 | 3E-03 | ||
| Rn.9756 | Protein phosphatase 1, regulatory (inhibitor) subunit 1A | 1.58 | 4.8E-06 | 1.62 | 6E-03 | ||
| Rn.3546 | Neuritin | 1.58 | 8.6E-05 | 1.44 | 8E-04 | ||
| Rn.31799 | Pyruvate dehydrogenase phosphatase isoenzyme 1 | 1.72 | 1.3E-03 | 1.83 | 2E-02 | ||
| Rn.9714 | Neuropeptide Y | 2.40 | 5.2E-06 | 2.14 | 1E-02 | ||
| Rn.22 | Thyrotropin releasing hormone | 21.42 | 1.8E-03 | 2.01 | 1E-02 | ||
| Hippocampus, acute ECS | |||||||
| Rn.87787 | Glutamate receptor, metabotropic 1 | 0.63 | 2.5E-06 | 0.60 | 3E-05 | ||
| Rn.19727 | Hairy and enhancer of split 1 (Drosophila) | 0.71 | 3.3E-02 | 1.55 | 4E-05 | ||
| Rn.3812 | Normalized rat heart, Bento Soares Rattus sp. cDNA RHEAE07 | 0.72 | 1.4E-05 | 0.65 | 2E-03 | ||
| Rn.9113 | Aldehyde dehydrogenase family 3, subfamily A2 | 0.86 | 5.6E-03 | 0.44 | 2E-05 | ||
| Rn.3360 | Growth factor receptor bound protein 2 | 1.36 | 3.1E-02 | 1.68 | 6E-06 | ||
| Rn.10815 | Neuropilin | 1.36 | 1.2E-04 | 1.67 | 2E-03 | ||
| Rn.9797 | Fibroblast growth factor receptor 1 | 1.44 | 1.6E-03 | 1.51 | 2E-03 | ||
| Rn.2045 | Protein tyrosine phosphatase type IVA, member 2 | 1.46 | 2.0E-03 | 1.51 | 3E-03 | ||
| Rn.3546 | Neuritin | 1.59 | 4.9E-06 | 1.56 | 1E-08 | ||
| Rn.9839 | Nuclear receptor subfamily 4, group A, member 2 | 1.76 | 6.8E-05 | 1.70 | 1E-05 | ||
| Rn.44320 | Avian sarcoma virus 17 (v-jun) oncogene homolog | 1.80 | 1.7E-07 | 1.84 | 9E-05 | ||
| Rn.859 | Ras homolog enriched in brain | 1.83 | 1.0E-07 | 1.42 | 1E-05 | ||
| Rn.11183 | DNA-damage inducible transcript 3 | 1.89 | 1.6E-08 | 1.78 | 4E-03 | ||
| Rn.3723 | IFN-related developmental regulator 1 | 1.93 | 1.3E-07 | 2.01 | 3E-05 | ||
| D82074 | Rattus sp. mRNA for BHF-1 | 1.97 | 7.0E-04 | 0.44 | 6E-04 | ||
| S65091 | cAMP-regulated phosphoprotein | 2.52 | 6.7E-05 | 2.09 | 7E-07 | ||
| Rn.2398 | TGFB inducible early growth response | 2.79 | 1.4E-08 | 3.62 | 1E-06 | ||
| Rn.40517 | Activity and neurotransmitter-induced early gene protein 4 (ania-4) | 3.64 | 2.9E-10 | 2.58 | 6E-07 | ||
| Rn.44369 | Prostaglandin-endoperoxide synthase 2 | 4.03 | 1.5E-07 | 7.33 | 9E-08 | ||
| Rn.25754 | Tissue inhibitor of metalloproteinase 1 | 4.71 | 8.7E-08 | 11.39 | 2E-06 | ||
| Rn.11266 | Brain-derived neurotrophic factor | 5.73 | 2.9E-08 | 3.85 | 2E-04 | ||
| S82649 | Neuronal activity-regulated pentraxin | 7.24 | 2.0E-10 | 5.89 | 7E-09 | ||
| Rn.37500 | Homer, neuronal immediate early gene, 1 | 7.42 | 2.5E-07 | 6.50 | 2E-07 | ||
| Frontal cortex, chronic ECS | |||||||
| Rn.11400 | Prostaglandin D synthase | 0.61 | 1.0E-02 | 0.71 | 0.03 | ||
| Rn.7730 | Prostaglandin E synthase | 2.18 | 1.5E-02 | not on U34A chip | |||
| Rn.506 | Synapsin 2 | 1.29 | 1.0E-03 | 1.34 | 0.0004 | ||
| Frontal cortex, acute ECS | |||||||
| Rn.32777 | Ceruloplasmin (ferroxidase) | 1.35 | 2.8E-02 | 1.81 | 2E-05 | ||
| Rn.10599 | Phosphoinositide 3-kinase, regulatory subunit, polypeptide 1 | 1.59 | 5.8E-04 | 2.02 | 4E-03 | ||
| Rn.6977 | Lost on transformation 1 | 1.90 | 2.1E-04 | 1.58 | 8E-05 | ||
| Rn.1716 |
Interleukin-6 receptor |
2.24 |
3.1E-08 |
1.74 |
3E-05 |
||
All samples for ECS-treated groups and sham control groups used for microarray studies were analyzed for each gene (n = 8 - 10 per group).
The initial RT-PCR study observed a 50% validation rate of microarray data. The principle failures appeared to have been primarily associated with low technical performance of the particular primers, as evidenced by a failure of the amplified signal to reach asymptotic intensity levels that are characteristic of genes that amplified efficiently. For those primer pairs that failed, we selected a second and unique primer pair from the same region of the transcript to generate an amplicon of similar length as the first primer pair. The nonvalidated genes were retested with these new primer pairs, and 80% of the retested genes produced the expected asymptotic signal across amplification cycles and validated the microarray results. Thus, we confirmed the statistically significant differential expression of 39 of the 59 genes tested for a confirmation rate of 66% (Table 3).
Using genes from Table 2 that produced small (≥30%) changes, RT-PCR was able to validate the array increases or decreases of seven genes with such changes (Table 3). These seven genes were rat smallest neurofilament protein, glypican, neuritin, normalized rat heart, ras homolog enriched in brain, prostaglandin D synthase, and synapsin 2. Thus, the ability of RT-PCR to confirm array increases or decreases of ∼30% or greater are demonstrated by these findings and those in Figure 4.
The lack of experimental change in GAPDH was confirmed by the RT-PCR tissue dilution study. Nevertheless, in our experience, RT-PCR produces an ∼30% false negative rate for any large set of genes found to be changed on the Affymetrix or Agilent microarray platforms (J.A.B. and L.W.J., unpublished observations). Thus, we estimate that >66%, and probably closer to 80%, of the genes detected by the microarray analysis of our ECS tissues represent true positives on the basis of RT-PCR validation. The repeated observations of gene changes in different tissues or times, confirmation of fold and direction of gene changes in 66–80% of cases by RT-PCR, and the substantial agreement of many gene changes with literature findings increases the likelihood that our results are mostly valid.
Discussion
The present study investigated the effects of chronic and acute ECS on gene expression in the rodent CNS. The findings replicated 52 of the 88 genes and their direction of change observed by other laboratories and identified another 87 gene changes that were previously unreported. The large-scale replication, similar changes of multiple probes sets identified for 12 of the genes, and confirmation of at least 66% of gene changes by RT-PCR (Table 3) provide a general validation of the changes we observed in response to generalized CNS seizures. Importantly, none of the 282 gene changes in the hippocampus and temporal lobe associated with epileptogenesis during kindling (Lukasiuk et al., 2003) overlapped with the genes identified here. This probably resulted from the very different models used in these studies and indicates that the mechanism of seizure sensitization differs considerably from the effects of seizures themselves. When generalized seizures are induced by pilocarpine and gene expression in the dentate gyrus is measured 2 weeks later (Elliott et al., 2003), or when chronic seizures are induced using the present methods and hippocampal gene changes are evaluated using a 645-cDNA array (Newton et al., 2003), consistent increases occur in BDNF, cyclooxygenase-2, neuropeptide Y (NPY), neuritin, and vascular endothelial growth factor (VEGF), as we and previous investigators (Table A; available at http://www.psygenomics.com/html/Supplemental_Table_A.pdf) have observed. Novel gene increases seen here and by Newton et al. (2003) are the nerve growth factor inducible protein VGF, thyrotropin-releasing hormone (TRH), tissue inhibitor of metalloproteinase 1 (TIMP-1), FGF receptor 1, and early growth response-1; seen here and by Elliott et al. (2003) is the gene for the tandem of P domains in a weak inwardly rectifying K+ channel (Twik), pyruvate dehydrogenase phophatase, thymosin β-10, NARP, Vesl, ania-4, Arc, tropomyosin receptor-related kinase B (TrkB), neuritin, and transducin-like enhancer of split-1. Thus, increases in BDNF/TrkB, NPY, VEGF, and the arachidonic acid pathway genes figure most prominently in the effects of ECS and not in the sensitization of seizures by kindling.
Gene changes after chronic exposure to ECS
Gene changes after chronic or acute ECS exposure are each potentially relevant to the clinical effects of ECT, which can give symptomatic relief within hours after a single seizure. However, the increased and sustained efficacy of ECT with repeated treatments warrants a closer look at the 29 genes that changed only after chronic ECS.
The two genes that changed only with chronic ECS in both the hippocampus and frontal cortex were prostaglandin D synthase and IGF II (somatomedin A). These genes were consistently decreased, as shown by microarray and RT-PCR analyses. The downregulation by prostaglandin D synthase is consistent with the chronic upregulation we saw in its repressive modulator and GABA-differentiating factor, hairy and enhancer of split 1 (HES-1) (Kageyama and Ohtsuka, 1999). A potential role for a stimulation of the arachidonic acid cascade in the antidepressant effect of ECT was further supported by large elevations in cytosolic phospholipase A2 (cPLA2) in the hippocampus of both acute and chronic ECS-treated rats. cPLA2 releases arachidonate from phospholipids and is induced in the hippocampus after kainate seizures (Sandhya et al., 1998). Increases in cox-2, the inducible form of prostaglandin-endoperoxide synthase, catalyzes the rate-limiting step in converting arachidonic acid to PGs and was elevated in all tissues and times by ECS. Interestingly, the chronic treatment of rats with lithium or valproic acid decreases each of these genes in rat brain (Rapoport and Bosetti, 2002). Thus, the increases seen here in cPLA2, Cox-2, HES-1, and prostaglandin E synthase, and the lowering of a prostaglandin D2 (PGD) synthase may produce an antidepressant effect, whereas their lowering may promote mood stabilization.
The ECS-induced decreases we observed in PGD synthase, a gene thought to be neurotoxic (Baik et al., 1999; Fujimori et al., 2003) and increases in the putatively neuroprotective PDE synthase (Yagami et al., 2003) and cPLA2 (Nakamura, 1993, 1994), might also contribute to the lack of neuronal damage after ECS in the rat or human (Madsen et al., 2000; Zachrisson et al., 2000; Chen et al., 2001; Hellsten et al., 2002).
Among the other genes in Tables 1 and 2 that were only changed with chronic ECS, 26 were in the hippocampus and only three were in the cortex. This finding more strongly implicates the hippocampus as mediating, at least at the genomic level, chronic effects of ECS. A well known protein candidate in mood effects, TRH mRNA was doubled in the hippocampus and only with chronic ECS. RT-PCR revealed a 20-fold increase in hippocampal TRH and confirmed that TRH increases occurred only after chronic ECS in the hippocampus and not in the frontal cortex (Table 3). Although it is unclear why the TRH increase measured by PCR exceeded that determined by microarray, TRH mRNA increases are consistent with the ability of ECS to increase prepro-TRH peptides in several rat brain regions and with the antidepressant-like effects of TRH in the rodent forced swim test (Pekary et al., 2000). Both parenteral and intrathecal injections of TRH improve depression in humans (Satin, 1999) and animal models (Ogawa et al., 1984; Drago et al., 1990). The role of TRH in elevating mood in humans is supported by the use of triiodothyronine as an augmentation therapy for treatment-resistant depression (Hatzinger and Holsboer-Trachsler, 1999).
The doubling of neuropeptide Y mRNA in the frontal cortex and hippocampus after chronic ECS is consistent with increases in NPY protein (Wahlestedt et al., 1990) and mRNA (Mikkelsen et al., 1994; Elliott et al., 2003; Newton et al., 2003) in the cortex and hippocampus after ECS. NPY is decreased in schizophrenia (Iritani et al., 2000), bipolar disorder (Caberlotto and Hurd, 1999), depression associated with suicide (Westrin et al., 1999), and animal models of depression (Caberlotto et al., 1998). The augmentation of NPY by ECS may be consistent with the efficacy of ECT in each of these disorders. A doubling of NPY concentrations and secretion from cultured cortical neurons has been observed in response to BDNF, and this response operates through the ERK (extracellular signal-regulated kinase) (MAP) kinase pathway (Barnea and Roberts, 2001). The increases in calvasculin, heme oxygenase, and tacykinin 2, among other neural modulators in this group, represent additional chronic mediators of the longer-term effects of ECS on mood.
BDNF/MAP kinase
ECS elevated 17 genes along the BDNF/TrkB-stimulated MAP kinase pathway and its convergence with the NMDA-coupled PKC pathway and four additional genes of the ERK1,2-linked arachidonic acid pathway. In the hippocampus and frontal cortex, these genes included BDNF, for which five separate probe sets were increased up to fourfold to fivefold, and its high affinity receptor, TrkB, which increased acutely in the hippocampus. These findings are comparable with increases in these rat brain areas in BDNF mRNA (Duman et al., 1997; Nibuya et al., 1995; Zetterstrom et al., 1997; Chen et al., 2001) and BDNF protein (Altar et al., 2003) after ECS. BDNF-induced phosphorylation of TrkB and the son of sevenless adapter protein (Grb-2) and RAS gene activation initiate intracellular signaling pathways that include MAP kinase and cAMP (Skolnick et al., 2001). These steps may mediate the antidepressant action of BDNF and ECT (Duman et al., 1997; Altar, 1999).
Other genes among the BDNF/TrkB-stimulated MAP kinase pathway include Grb-2, Grb-2 like, RAS homolog, growth arrest and DNA-damage inducible gene (GADD153), neuritin, glypican, phosphotyrosine phosphatase, and Vesl/homer. Their augmentation by ECS is highly consistent with the reduced activation and expression of ERK1/2 MAP kinase in the postmortem brain of depressed suicide subjects (Dwivedi et al., 2001). Vesl/homer was upregulated by up to sixfold after ECS in both brain areas (Table 1). It is a neuronal immediate-early gene of which the synaptic protein product is enriched at excitatory synapses, including those in the hippocampus where it facilitates postsynaptic metabotropic glutamate receptor signaling through ion channels and AMPA receptors (for review, see Thomas, 2002). Vesl-1 mRNA expression increases in cultured neurons exposed to BDNF or NMDA and in the hippocampus after seizure or after electrical or pharmacological stimulation (Brakeman et al., 1997). This implicates Vesl-1 regulation just downstream of the receptor-associated factor–MAP kinase convergence between the neurotrophin and excitatory pathways (Sato et al., 2001).
Neuroplasticity and neurogenesis
Although ECT in humans or rats is not associated with neuronal damage, both ECS (our results) and deep cortical impact injury (Matzilevich et al., 2002) increase the hippocampal expression of Cox-2, glial fibrillary acidic protein, FGF receptor-1, Vesl/homer isoform, neuropeptide Y, the putative potassium channel TWIK, and the immediate early genes Narp, Arc, BDNF, NGF inducible clone C, and the protooncogenes jun-B, c-jun, fra-2, and c-fos. However, 8 of these 14 genes are immediate-early genes, which respond to many diverse stimuli. Five of these 14 genes (Cox-2, Vesl/homer, Narp, BDNF, NGF inducible clone C) and six others that we observed also change after exercise (Russo-Neustadt et al., 1999; Tong et al., 2001; Molteni et al., 2002). Exercise, and most of these 11 genes, are associated with neuroprotection, neuroplasticity, and antidepressant effects rather than with damage. In addition, none of the other 107 genes in Table 1 overlapped with the 92 genes reported by Hendriksen et al. (2001) to be altered in the gliotic and degenerate hippocampus in a status epileptics model.
The present study is the first to demonstrate with high-density microarrays genomic changes in response to acute and chronic electroconvulsive seizure. The most robustly and broadly represented genes to change by ECS were found in the hippocampus. Genes that increased with chronic ECS are more likely mediators of the long-term beneficial effects of ECT and included those of the BDNF/TrkB/MAP kinase pathway, arachidonic acid pathway, VEGF, TRH, NPY, and regulators of neuronal sprouting and neurogenesis. The ability of ECT to rapidly treat drug-resistant depression might be attributable to a greater extent and speed to increase the expression of a subset of these genes, particularly genes of which changes are sustained with repeated ECT. An elucidation of genes that are similarly, albeit possibly more slowly, affected in the neocortex and hippocampus by antidepressant or mood-stabilizing drugs is a useful next step toward identifying novel gene targets for treating depression and bipolar disease. Such overlapping genes could be used to identify lead compounds (Palfreyman et al., 2002) that mimic the therapeutic response of ECT without producing seizures. For example, such an “ECT in a pill” could be discovered by screening compounds for their ability to alter the same 11 genes elevated in rat brain by ECS and by exercise, an effective treatment for mild depression (Hill et al., 1993; Labbe et al., 1988), or for compounds that augment genes that are elevated by chronic exposure to ECS and by conventional antidepressants.
Footnotes
The expert assistance from Peng Liu in reanalyzing gene selections and helpful discussions during this process are greatly appreciated. Data in this study were presented December 10, 2002, at the annual meeting of the American College of Neuropsychopharmacology in San Juan, Puerto Rico.
Correspondence should be addressed to C. A. Altar, Psychiatric Genomics, 19 Firstfield Road, Gaithersburg, MD 20878. E-mail: taltar@psygenomics.com.
DOI:10.1523/JNEUROSCI.5377-03.2004
Copyright © 2004 Society for Neuroscience 0270-6474/04/242667-11$15.00/0
References
- Altar CA (1999) Neurotrophins and depression. Trends Pharmacol Sci 20: 59–61. [DOI] [PubMed] [Google Scholar]
- Altar CA, Whitehead RE, Chen R, Wortwein G, Madsen TR (2003) Effects of electroconvulsive seizure and antidepressants on BDNF protein content in brain. Biol Psych 54: 703–709. [DOI] [PubMed] [Google Scholar]
- Austin MC, Whitehead RE, Edgar CL, Janosky JE, Lewis DA (2002) Localized decrease in serotonin transporter-immunoreactive axons in the prefrontal cortex of depressed subjects committing suicide. Neuroscience 114: 807–815. [DOI] [PubMed] [Google Scholar]
- Baik EJ, Kim EJ, Lee SH, Moon C (1999) Cyclooxygenase-2 selective inhibitors aggravate kainic acid induced seizure and neuronal cell death in the hippocampus. Brain Res 843: 118–129. [DOI] [PubMed] [Google Scholar]
- Barnea A, Roberts J (2001) Induction of functional and morphological expression of NPY in cortical cultures by BDNF: evidence for a requirement of ERK-dependent and ERK-independent mechanisms. Brain Res 919: 57–69. [DOI] [PubMed] [Google Scholar]
- Brakeman PR, Lanahan AA, O'Brien R, Roche K, Barnes CA, Huganir RL, Worley PF (1997) Homer: a protein that selectively binds metabotropic glutamate receptors. Nature 386: 284–288. [DOI] [PubMed] [Google Scholar]
- Caberlotto L, Hurd YL (1999) Reduced neuropeptide Y mRNA expression in the prefrontal cortex of subjects with bipolar disorder. NeuroReport 10: 1747–1750. [DOI] [PubMed] [Google Scholar]
- Caberlotto L, Fuxe K, Overstreet DH, Gerrard P, Hurd YL (1998) Alterations in neuropeptide Y and Y1 receptor mRNA expression in brains from an animal model of depression: region specific adaptation after fluoxetine treatment. Mol Brain Res 59: 58–65. [DOI] [PubMed] [Google Scholar]
- Chen AC, Shin KH, Duman RS, Sanacora G (2001) ECS-induced mossy fiber sprouting and BDNF expression are attenuated by ketamine pretreatment. J ECT 17: 27–32. [DOI] [PubMed] [Google Scholar]
- Davidson RJ, Lewis DA, Alloy LB, Amaral DG, Bush G, Cohen JD, Drevets WC, Farah MJ, Kagan J, McClelland JL, Nolen-Hoeksema S, Peterson BS (2002) Neural and behavioral substrates of mood and mood regulation. Biol Psychiatry 52: 478–502. [DOI] [PubMed] [Google Scholar]
- Drago F, Pulvirenti L, Spadaro F, Pennisi G (1990) Effects of TRH and prolactin in the behavioral despair (swim) model of depression in rats. Psychoneuroendocrinology 15: 349–356. [DOI] [PubMed] [Google Scholar]
- Drevets WC, Gadde K, Krishnan R (1999) Neuroimaging studies of depression. In: Neurobiology of mental illness (Charney DS, Nestler EJ, Bunney BJ, eds), pp 394–418. New York: Oxford UP.
- Duman RS, Heninger GR, Nestler EJ (1997) A molecular and cellular theory of depression. Arch Gen Psychiatry 54: 597–606. [DOI] [PubMed] [Google Scholar]
- Dwivedi Y, Rizavi HS, Roberts RC, Conley RC, Tamminga CA, Pandey GN (2001) Reduced activation and expression of ERK1/2 MAP kinase in the post-mortem brain of depressed suicide subjects. J Neurochem 77: 916–928. [DOI] [PubMed] [Google Scholar]
- Elliott RC, Miles MF, Lowenstein DH (2003) Overlapping microarray profiles of dentate gyrus gene expression during development- and epilepsy-associated neurogenesis and axon outgrowth. J Neurosci 23: 2218–2227. [DOI] [PMC free article] [PubMed] [Google Scholar]
- Fochtmann LJ (1994) Animal studies of electroconvulsive therapy: foundations for future research. Psychopharmacol Bull 30: 321–444. [PubMed] [Google Scholar]
- Fujimori K, Fujitani Y, Kadoyama K, Kumanogoh H, Ishikawa K, Urade Y (2003) Regulation of lipocalin-type prostaglandin D synthase gene expression by Hes-1 through E-box and interleukin-1 beta via two NF-kappa B elements in rat leptomeningeal cells. J Biol Chem 278: 6018–6026. [DOI] [PubMed] [Google Scholar]
- Hashimoto, K Watanabe, K-I, Nishimuara T, Iyo M, Shirayama Y, Minabe Y (1998) Behavioral changes and expression of heat shock protein hsp-70 mRNA, BDNF mRNA, and cyclooxygenase-2 mRNA in rat brain following seizures induce by systemic administration of kainic acid. Brain Res 804: 212–223. [DOI] [PubMed] [Google Scholar]
- Hatzinger M, Holsboer-Trachsler E (1999) Therapy refractory depression. Wien Med Wocheschr 149: 511–514. [PubMed] [Google Scholar]
- Hellsten J, Wennstrom M, Mohapel P, Ekdahl CT, Bengzon J, Tingstrom A (2002) Electroconvulsive seizures increase hippocampal neurogenesis after chronic corticosterone treatment. Eur J Neurosci 16: 283–290. [DOI] [PubMed] [Google Scholar]
- Hendriksen H, Katson NA, Ghijesen W, van Vilet EA, da Silva F, Gorter JA, Vreugdenhil E (2001) Altered hippocampal gene expression prior to the onset of spontaneous seizures in the rat post-status epilepticus model. Eur J Neurosci 14: 1475–1484. [DOI] [PubMed] [Google Scholar]
- Hill RD, Storandt M, Malley M (1993) The impact of long-term exercise training on psychological function in older adults. J Gerontol 48: 12–17. [DOI] [PubMed] [Google Scholar]
- Iritani S, Kuroki N, Niizato K, Ikeda K (2000) Morphological changes in neuropeptide Y-positive fiber in the hippocampal formation of schizophrenics. Prog Neuropsychopharmacol Biol Psychiatry 24: 241–249. [DOI] [PubMed] [Google Scholar]
- Kageyama R, Ohtsuka T (1999) The Notch-Hes pathway in mammalian neural development. Cell Res 9: 179–188. [DOI] [PubMed] [Google Scholar]
- Labbe EE, Welsh MC, Delaney D (1988) Effects of consistent aerobic exercise on the psychological functioning of women. Percept Mot Skills 67: 919–925. [DOI] [PubMed] [Google Scholar]
- Liotti M, Mayberg HS, McGinnis S, Brannan SL, Jerabek P (2002) Unmasking disease-specific cerebral blood flow abnormalities: mood challenge in patients with remitted unipolar depression. Am J Psychiatry 159: 1830–1840. [DOI] [PubMed] [Google Scholar]
- Lukasiuk K, Kontula L, Pitkane A (2003) cDNA profiling of epileptogenesis in the rat brain. Eur J Neurosci 17: 271–279. [DOI] [PubMed] [Google Scholar]
- Madsen TM, Treschow A, Bengzon J, Bolwig TG, Lindvall O, Tingstrom A (2000) Increased neurogenesis in a model of electroconvulsive therapy. Biol Psychiatry 47: 1043–1049. [DOI] [PubMed] [Google Scholar]
- Matzilevich DA, Rall JM, Moore AN, Grill RJ, Dash PK (2002) High-density microarray analysis of hippocampal gene expression following experimental brain injury. J Neurosci Res 67: 646–663. [DOI] [PubMed] [Google Scholar]
- Mikkelsen JD, Woldbye D, Kragh J, Larsen PJ, Bolwig TG (1994) Electro-convulsive shocks increase the expression of neuropeptide Y (NPY) mRNA in the piriform cortex and the dentate gyrus. Brain Res Mol Brain Res 23: 317–322. [DOI] [PubMed] [Google Scholar]
- Molteni R, Ying Z, Gomez-Pinnilla F (2002) Differential effects of acute and chronic exercise on plasticity-related genes in the rat hippocampus revealed by microarray. Eur J Neurosci 16: 107–116. [DOI] [PubMed] [Google Scholar]
- Nakamura S (1993) Involvement of phospholipase A2 in axonal regeneration of brain catecholamine neurons. NeuroReport 4: 371–374. [DOI] [PubMed] [Google Scholar]
- Nakamura S (1994) Effects of phospholipase A2 inhibitors on the antidepressant-induced axonal regeneration of noradrenergic locus coeruleus neurons. Microsc Res Tech 29: 204–210. [DOI] [PubMed] [Google Scholar]
- Newton S, Collier EF, Husberger J, Adams D, Terwilleger R, Selvanayagam E, Duman R (2003) Gene profile of electroconvulsive seizures: induction of neurotrophic and angiogenic factors. J Neurosci 23: 10841–10851. [DOI] [PMC free article] [PubMed] [Google Scholar]
- Nibuya M, Morinobu S, Duman RS (1995) Regulation of BDNF and trkB mRNA in rat brain by chronic electroconvulsive seizure and antidepressant drug treatments. J Neurosci 15: 7539–7547. [DOI] [PMC free article] [PubMed] [Google Scholar]
- Ogawa N, Mizuno S, Mori A, Nikina I, Ota Z, Yamamoto M (1984) Potential anti-depressive effects of thyrotropin releasing hormone (TRH) and its analogues. Peptides 5: 743–746. [DOI] [PubMed] [Google Scholar]
- Palfreyman MG, Hook DJ, Klimczak LJ, Brockman JR, Evans DM, Altar CA (2002) Novel directions in antipsychotic target identification using gene arrays. Curr Drug Target CNS Neurol Disord 1: 205–216. [DOI] [PubMed] [Google Scholar]
- Pekary AE, Meyerhoff JL, Sattin A (2000) Electroconvulsive seizures modulate levels of thyrotropin releasing hormone and related peptides in rat hypothalamus, cingulate and lateral cerebellum. Brain Res 884: 174–183. [DOI] [PubMed] [Google Scholar]
- Rapoport SI, Bosetti F (2002) Do lithium and anticonvulsants target the brain arachidonic acid cascade in bipolar disorder? Arch Gen Psych 59: 592–596. [DOI] [PubMed] [Google Scholar]
- Russo-Neustadt A, Beard RC, Cotman CW (1999) Exercise, antidepressant medications, and enhanced brain-derived neurotrophic factor expression. Neuropsychopharmacology 21: 679–682. [DOI] [PubMed] [Google Scholar]
- Sandhya TL, Ong WY, Horrocks LA, Farooqui AA (1998) A light and electron microscopic study of cytoplasmic phospholipase A2 and cyclooxygenase-2 in the hippocampus after kainate lesions. Brain Res 788: 223–231. [DOI] [PubMed] [Google Scholar]
- Satin A (1999) The role of TRH and related peptides in the mechanism of action of ECT. J ECT 15: 76–92. [PubMed] [Google Scholar]
- Sato M, Suzuki K, Nakanishi S (2001) NMDA receptor stimulation and brain-derived neurotrophic factor upregulate homer 1a mRNA via the mitogen-activated protein kinase cascade in cultured cerebellar granule cells. J Neurosci 21: 3797–3805. [DOI] [PMC free article] [PubMed] [Google Scholar]
- Skolnick P, Legutko B, Li X, Bymaster FP (2001) Current perspectives on the development of non-biogenic amine-based antidepressants. Pharmacol Res 43: 411–423. [DOI] [PubMed] [Google Scholar]
- Thomas U (2002) Modulation of synaptic signalling complexes by Homer proteins. J Neurochem 81: 407–413. [DOI] [PubMed] [Google Scholar]
- Tong L, Shen H, Perreau VM, Balazs R, Cotman CW (2001) Effects of exercise on gene-expression profile in the rat hippocampus. Neurobiol Dis 8: 1046–1056. [DOI] [PubMed] [Google Scholar]
- Wahlestedt C, Blendy JA, Kellar KJ, Heilig M, Widerlov E, Ekman R (1990) Electroconvulsive shocks increase the concentration of neocortical and hippocampal neuropeptide Y (NPY)-like immunoreactivity in the rat. Brain Res 507: 65–68. [DOI] [PubMed] [Google Scholar]
- Westrin A, Ekman R, Traskman-Bendz L (1999) Alterations of corticotropin releasing hormone (CRH) and neuropeptide Y (NPY) plasma levels in mood disorder patients with recent suicide attempts. Eur Neuropsychopharmacol 9: 205–211. [DOI] [PubMed] [Google Scholar]
- Xu R, Li X (2003) A comparison of parametric versus permutation methods with applications to general and temporal microarray gene expression data. Bioinformatics 19: 1284–1289. [DOI] [PubMed] [Google Scholar]
- Yagami T, Nakazato H, Ueda K, Asakura K, Kuroda T, Hata S, Sakaeda T, Sakaguchi G, Itoh N, Hashimoto Y, Hiroshige T, Kambayashi Y (2003) Prostaglandin E(2) rescues cortical neurons from amyloid beta protein-induced apoptosis. Brain Res 959: 328–335. [DOI] [PubMed] [Google Scholar]
- Zachrisson O, Balldin J, Ekman R, Naesh O, Rosengren L, Agren H, Blennow K (2000) No evident neuronal damage after electroconvulsive therapy. Psychiatry Res 96: 157–165. [DOI] [PubMed] [Google Scholar]
- Zetterstrom TS, Pei Q, Grahame-Smith DG (1998) Repeated electroconvulsive shock extends the duration of enhanced gene expression for BDNF in rat brain compared with a single administration. Mol Brain Res 57: 106–110. [DOI] [PubMed] [Google Scholar]
- Zhang MQ (2002) Extracting functional information from microarrays: a challenge for functional genomics. Proc Natl Acad Sci USA 99: 12509–12511. [DOI] [PMC free article] [PubMed] [Google Scholar]