

Abstract
Pulsatile secretion of gonadotropin-releasing hormone-1 (GnRH-1) is essential for reproduction. GnRH-1 induces gonadotropin release and is regulated by 17β-estradiol (E2). Although a subpopulation of GnRH-1 neurons expresses estrogen receptor (ER) β, it is unclear whether E2 acts directly on GnRH-1 neurons or indirectly through interneuronal connections. To test the hypothesis that E2 acts directly on GnRH-1 neurons to regulate neuronal activity, we used calcium imaging to monitor intracellular calcium oscillations in GnRH-1 neurons maintained in nasal explants. TTX was used to minimize synaptic input from other cells. Consistent with previous studies, TTX reduced the activity of individual GnRH-1 neurons to a basal level, while the population of cells maintained synchronized calcium oscillations. Exposure of GnRH-1 cells to TTX plus E2 increased the number of calcium peaks/cell, percentage of cells with ≥10 peaks, mean peak amplitude, and percentage of cells that contributed to each calcium pulse in explants maintained in vitro for 7 d (7 div) compared with TTX alone. These effects were induced within 30 min and were not mimicked by 17α-estradiol, E2 conjugated to BSA (which does not cross the plasma membrane), or seen at 21 div, when the percentage of GnRH-1 cells expressing ERβ transcripts declines. In addition, these effects were inhibited by the ER antagonist ICI 182,780 and prevented by inhibition of gene transcription. These data suggest that, via ERβ, E2 can rapidly act as a hormone-activated transcription complex and are the first to show that E2 directly increases GnRH-1 neuronal activity and synchronization.
Keywords: estrogen receptor β, LHRH, calcium imaging, pulsatility, estradiol, GnRH-1
Introduction
17β-Estradiol (E2) regulates multiple neuronal functions, including neurogenesis (McEwen et al., 2001), reproductive behavior (Meisel and Sachs, 1994), and neuroendocrine output (Moore and Price, 1932; Levine et al., 1985). The classical mechanism of E2 action is through intracellular estrogen receptors (ERs), ERα and ERβ, acting as transcription factors (Kuiper et al., 1996). Additionally, rapid actions of E2 have been documented (Wong and Moss, 1991; Kelly and Levin, 2001). These rapid effects can either occur through ERα and ERβ (Razandi et al., 1999; Abraham et al., 2003) or through a novel, membrane-associated ER (Kelly and Levin, 2001; Toran-Allerand et al., 2002; Qiu et al., 2003).
Gonadotropin-releasing hormone-1 (GnRH-1) neurons regulate reproduction in all vertebrates. In females, E2-induced positive and negative regulation of GnRH-1 neurons occurs during the estrous and menstrual cycles (Levine et al., 1985; Karsch et al., 1987). The mechanism of E2 action on GnRH-1 neurons, however, remains unclear. ERβ plays a functional role in the neuroendocrine system of both peripubertal (Temple et al., 2003) and adult mice (Abraham et al., 2003). Recent reports indicate that a subpopulation of GnRH-1 neurons contains ERβ transcript (Skynner et al., 1999; Sharifi et al., 2002) and protein (Hrabovsky et al., 2001), consistent with a possible direct action of E2, via ERβ, on GnRH-1 neurons.
Successful reproduction relies on synchronized, pulsatile release of GnRH-1 peptide from multiple cells. Thus, sampling across the GnRH-1 neuronal population is critical to elucidate mechanisms underlying GnRH-1 pulsatility. Such sampling is difficult in vivo because GnRH-1 neurons are diffusely distributed from olfactory bulbs to caudal hypothalamus (Wray, 2002). Therefore, taking advantage of the extra-CNS origin of these cells, several groups have established an in vitro model of postmitotic, primary GnRH-1 cells in nasal explants. Individual GnRH-1 neurons in nasal explants exhibit electrical and synaptic properties similar to in vivo GnRH-1 neurons, including responses to GABAergic and glutamatergic stimulation (Kusano et al., 1995). In addition to depolarized-induced GnRH-1 release (Terasawa et al., 1999a; Moore and Wray, 2000), as in vivo, GnRH-1 neurons in nasal explants release GnRH-1 in a pulsatile manner (Terasawa et al., 1999a; Funabashi et al., 2000) with the interpulse interval being species dependent. Examination of the GnRH-1 neuronal population in vitro revealed increases in intracellular calcium, observed with calcium imaging, that correlate with GnRH-1 release (Terasawa et al., 1999a; Moore and Wray, 2000), that display species-specific synchronized calcium oscillations with periodicities similar to GnRH-1 release in vivo (Terasawa et al., 1999b; Moore et al., 2002), and that are maintained in the absence of synaptic input (Moore et al., 2002). Recent studies indicate that a subpopulation of GnRH-1 neurons in vitro coexpresses ERβ (Sharifi et al., 2002), with the percentage in vitro similar to that found in vivo (Skynner et al., 1999). Thus, GnRH-1 neurons in this in vitro system maintain many intrinsic characteristics of GnRH-1 neurons in vivo (Fueshko and Wray, 1994; Wray 2002).
In this study, calcium imaging was used to determine whether E2 acts directly on GnRH-1 neurons to modify neuronal activity in individual GnRH-1 neurons and the GnRH-1 neuronal population. Here, we show that E2 acts directly on GnRH-1 neurons as a DNA transcription factor to increase GnRH-1 neuronal activity and facilitate synchronized pulsatile activity within the GnRH-1 neuronal population.
Materials and Methods
Materials. For preparation of nasal explants, BSA, d-glucose, apotransferrin, putrescine, sodium selenite, bovine insulin, l-ascorbic acid, fluorodeoxyuridine, and thrombin were purchased from Sigma (St. Louis, MO). Gey's balanced salt solution, Ham's F-12 Nutrient Mixture, l-glutamine, and penicillin-streptomycin-nystatin antibiotic mixture were supplied by Invitrogen (Grand Island, NY). Chicken plasma was purchased from Cocalico Biologicals (Reamstown, PA). For treatment of nasal explants, E2, 17β-triol-6-one-6-carboxymethyloxine:BSA (BSAE2), 17α-estradiol, 5,6-Dichlorobenzimidazole-1-β-d-ribofuranoside (DRB), and TTX were purchased from Sigma. ICI 182,780 was purchased from Tocris (Bristol, UK). For calcium imaging, Calcium Green-1 AM was purchased from Molecular Probes (Eugene, OR), and pluronic F-127 and DMSO were purchased from Sigma.
Nasal explant preparation. Nasal explants were prepared as described previously (Fueshko and Wray, 1994). Briefly, timed-pregnant NIH Swiss mice were obtained, and embryos were removed at embryonic day 11.5 (E11.5) in accordance with National Institutes of Health guidelines. Nasal regions were dissected under aseptic conditions and refrigerated in glucose-enriched Gey's balanced salt solution. Explants were adhered to coverslips via a plasma-thrombin clot and maintained in a defined serum-free medium (SFM) at 37°C in a humidified incubator with 5% CO2. On the third day in vitro, nasal explants were treated with fluorodeoxyuridine (8 × 10⁻⁵ m) for 3 d to inhibit cell proliferation. On the sixth day in vitro, and every 2-3 d after, explants were provided with fresh SFM. The explants were used for experiments on culture days 6-8 or 20-22.
Calcium imaging. Calcium imaging was conducted using previously described methods (Moore et al., 2002). Briefly, nasal explants were exposed to the indicator dye Calcium Green-1 AM (2.7 mm in 80% DMSO/20% pluronic F-127, diluted 1:200 with SFM) for 20 min in a humidified chamber. Explants were then washed twice with fresh SFM (10 min each) and transferred to a heated perfusion chamber (37.5°C; Warner Instruments, Hamden, CT). Medium was perfused across the explant at a rate of 100 μl/min via a peristaltic pump (Spectra Hardware, Westmoreland City, PA). Intracellular calcium oscillations were visualized using a Nikon microscope equipped with a 20× fluorescence objective and an intensified CCD camera (Video Scope International, Sterling, VA). The camera shutter was controlled by a G4 Macintosh computer via imaging software (IP Labs; Scanalytics, Vienna, VA). Excitation wavelengths were 450-490 nm, and emission was monitored at 520-560 nm.
Analysis of calcium imaging data. Intracellular calcium was monitored every 20 sec for 100 min. At the end of the 100 min period, explants were exposed to an acute dose of KCl (20 mm) to cause an abrupt increase in intracellular calcium to confirm the viability of the cells. Using IP Labs, ODs were measured within each cell, and background values were subtracted; thus, the corrected OD values represent only intracellular events. The traces of intracellular calcium were then analyzed by PULSAR (Merriam and Wachter, 1982) (Fig. 1) to determine when calcium peaks occurred (OD readings 2 SDs above baseline). Time points when peaks were detected in each cell were compiled into a single file for the entire neuronal population within the imaged field. The MATLAB program divided these data into 1 min intervals and assigned either a 0 (no calcium peaks detected during that 1 min period) or a 1 (one or more significant calcium peaks detected). These data were then transformed by the WAVELET analysis program to determine when calcium pulses occurred (Fig. 1). A pulse was defined as a period of time when multiple GnRH-1 neurons displayed synchronous calcium oscillations. For each pulse, the duration from start to finish, the interpulse interval (the time from the start of one pulse to the start of the next pulse), and the number of cells contributing to the pulse were determined.
Figure 1.
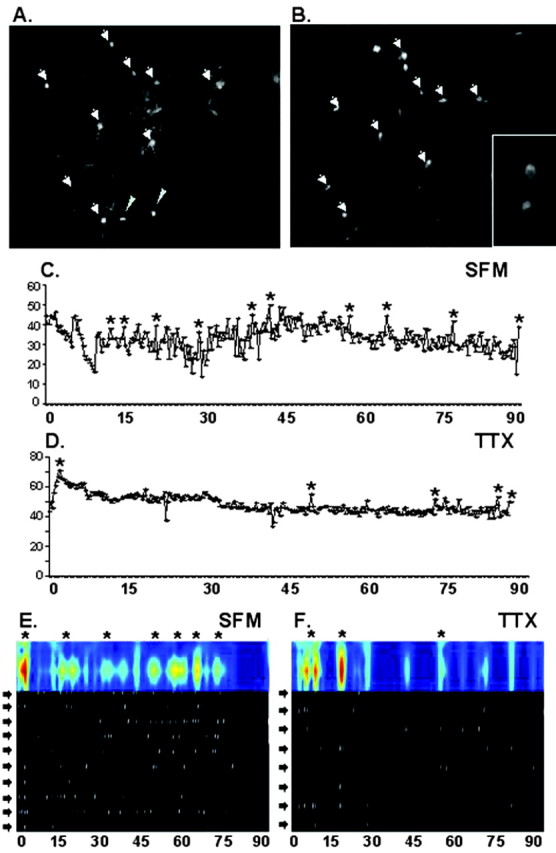
GnRH neurons exhibit synchronized calcium pulses. An example of cells visualized in a 7 div nasal explant labeled with Calcium Green (A), imaged for 100 min, followed by fixation and staining for GnRH-1 (B). The inset in B is a high magnification (40×) of two of the GnRH-1-immunoreactive cells. The arrowheads indicate Calcium Green-labeled cells that were also GnRH-1 positive (n = 9). The narrow arrowheads indicate cells that were labeled with calcium dye that were not GnRH-1 positive (n = 2). Note that after fixation (B), the explant shrinks slightly, and so the distances between cells in (A) and (B) will not be identical. Activity traces from individual GnRH-1 cells are shown in C (SFM) and D (TTX); the asterisk indicates a significant increase in intracellular calcium (peaks). Calcium peaks in GnRH-1 cells imaged in a single explant are shown in E (SFM; n = 10 cells) and F (TTX; n = 8 cells). In these panels, the x-axis is time in minutes. In the black and white section, each row is data from an individual cell (denoted by a black arrow), with the white lines representing the time at which a significant peak in intracellular calcium occurred. The colored trace above represents synchronized calcium oscillations across multiple cells (denoted with an asterisk). The more “intense” the pulsatile event, the closer to red the trace appears.
Immunocytochemistry. At the end of the data collection period, explants were fixed with 4% formalin in PBS for 1 hr. They were rinsed with PBS and incubated for 1 hr in 10% NGS with 0.1% sodium azide and 0.3% Triton X-100, followed by several rinses in PBS. Explants were then incubated overnight at 4°C in GnRH-1 antibody (SW1, 1:3000) (Wray et al., 1988). The next day, cultures were washed with PBS and incubated in goat anti-rabbit-conjugated Cy3 (1:800; Jackson ImmunoResearch, West Grove, PA). The staining was then compared with the calcium dye labeling to determine which cells were GnRH-1 cells (Fig. 1). Any cells that were not GnRH-1 positive were analyzed separately (<5%).
Transfections of MCF-7 cells. To assure that any effects of the BSA-E2 are not attributable to unconjugated E2, MCF-7 breast cancer cells were transfected with a construct containing an estrogen response element (ERE) linked to a luciferase reporter gene (Wang et al., 2003). Using the manufacturer's (Invitrogen, Carlsbad, CA) instructions, lipofectin was used to transfect this construct into MCF-7 cells. Briefly, cells were grown to 80-90% confluency in 6-well plates. For each well, 4 μg of DNA was brought up to 250 μl in OptiMEM medium. In a separate tube, 10 μl of lipofectin was also brought up to 250 μl in OptiMEM. After 10 min, the DNA and lipofectin mixtures were combined and allowed to incubate (20 min). This mixture was then added to 1.5 ml of OptiMEM (per well), and 2 ml of DNA-lipofectin construct was added to each well. After transfection (6-8 hr), the cells were treated with E2, BSA-E2, or no hormone for 18 hr. Cells were lysed, and their contents were harvested and assayed for luciferase activity. The only way for the luciferase to become activated is for E2 to bind to an intracellular ER, which then binds to the ERE. Therefore, the relative amount of luciferase activity accurately reflects free E2.
Experimental methods for 7 d in vitro nasal explants. Experimental groups consisted of two to four explants per treatment with an average of 14.8 ± 0.9 (range, 8-32) cells visualized/explant. The sodium channel blocker TTX was used to isolate GnRH-1 neurons from neuronal input to examine direct effects of E2 and E2 antagonist administration on calcium oscillations. All drugs were perfused continuously across the explant for the duration of the experiment and, where indicated, explants were treated after calcium dye loading before imaging. The following treatments were given in the presence of TTX (10-6 m in acetate buffer); E2 (2 × 10⁻⁶, 2 × 10⁻⁷, 2 × 10⁻⁹, and 2 × 10⁻¹⁰ m in EtOH) (Fig. 2), 17α-estradiol (2 × 10⁻⁶ m in EtOH), E2 plus ICI 182,780 (2 × 10⁻⁷ M in EtOH), BSA-E2 (2 × 10⁻⁷ M), BSA-E2 plus ICI 182,780, E2 plus DRB (150 μm given at time 0, 10 min prior, or 30 min before the beginning of imaging), and DRB (30 min before incubation). To remove any free E2, BSA-E2 was dissolved in 50 mm Tris-HCl, pH 8.5, and filtered through a 3 kDa cutoff filter (Amicon, Beverly, MA) immediately before use (Stevis et al., 1999). The retentate was resuspended in SFM to its final concentration (2 × 10⁻⁷ m).
Figure 2.

E2 has a direct effect on GnRH-1 neuronal activity. GnRH-1 neuronal responses to E2 were examined at four doses: 2 × 10⁻¹⁰, 2 × 10⁻⁹, 2 × 10⁻⁷, or 2 × 10⁻⁶ m in the presence of TTX. E2 treatment increased the number of calcium peaks per cell (A; mean ± SEM) and percentage of cells with ≥10 peaks (B) in a dose-dependent manner. Each treatment group contained n = 3 explants, 6-8 div. *Significantly different from other E2 doses (p < 0.05); #significantly different from all other treatments.
Several compounds were run on explants in the absence of TTX (Table 1). These included SFM plus vehicle (EtOH, acetate buffer, and 50 mm Tris-HCl), SFM plus E2 (2 × 10⁻⁷ m), SFM plus BSA-E2 (2 × 10⁻⁷ m), SFM plus BSA, and SFM plus DRB.
Table 1.
Summary of calcium imaging analysis of GnRH-1 neurons from non-TTX-treated explants at 7 and 21 div
|
|
Number of cells with peaks (%) |
Number of peaks/cell |
Mean peak amplitude |
Cells ≥ 10 peaks (%) |
Percentage of cells contributing to each pulse |
|---|---|---|---|---|---|
| 7 div | |||||
| SFM | 43/44 (97) | 9.3 ± 1.4 | 14.4 ± 0.3 | 14/44 (32) | 43.5 |
| E2 | 60/63 (95) | 6.2 ± 0.8 | 15.2 ± 0.4 | 12/63 (19) | 39.3 |
| ICI | 48/51 (94) | 9.6 ± 1.7 | 14.9 ± 0.4 | 19/51 (37) | 51.1 |
| E2 plus ICI | 34/36 (94) | 9.5 ± 1.9 | 14.6 ± 0.5 | 21/36 (58)a | 45.9 |
| BSA | 24/26 (92) | 5.7 ± 1.0 | 16.6 ± 0.8 | 4/26 (15) | 46.9 |
| BSA-E2 | 42/42 (100) | 8.2 ± 0.3 | 21.9 ± 0.6a | 10/42 (24) | 52.0 |
| DRB | 33/34 (97) | 7.8 ± 1.2 | 17.8 ± 0.8 | 9/34 (25) | 60.0a |
| 21 div | |||||
| SFM | 26/27 (96) | 12.12 ± 2.6 | 15.3 ± 0.6 | 10/27 (38) | 50.9 |
| E2 |
14/14 (100) |
6.2 ± 0.3a
|
11.7 ± 0.5 |
2/14 (14) |
50.0 |
Significantly different from SFM (p < 0.05 for ANOVA; p<0.01 for X2).
To determine the rapidity of E2 effects on calcium oscillations, a time course study was conducted. Four 7 d in vitro (div) explants were imaged during treatment with TTX for 30 min to establish a baseline. Estradiol was then added to the perfusate, and imaging was continued for an additional 80 min. The data were analyzed, and the percentage of cells contributing to each pulse was used for the following analysis. The data were separated into 10 min blocks, and each pulse was represented as the change in the percentage of cells contributing to the pulse relative to the percentage of cells contributing to pulses with TTX alone (41%). A scatterplot with a trendline was generated, and the time point at which the percentage of cells contributing to pulses reached the level of that for E2 plus TTX (66%) was determined.
Experimental methods for 21 div nasal explants. A previous study showed that expression of ERβ decreased significantly in GnRH-1 neurons from nasal explants older than 14 div (from ∼50 to <25%) (Sharifi et al., 2002). Nasal explants at 21 div were therefore used as one mechanism to determine whether estrogenic effects were mediated through the ERβ. Experimental groups consisted of two to three explants per treatment with an average of 11.8 ± 1.1 (range, 8-21) cells visualized/explant. The treatments given at 21 div were similar to those given at 7 div (as described above).
Statistical analysis. Statistical comparisons of frequency data were calculated using χ2 analysis. Comparisons of pulse duration, pulse amplitude, interpulse interval, peak amplitude, and number of calcium peaks per cell were made using ANOVA, followed by a Fisher's LSD post hoc test. All analyses were conducted using Statview statistical software (Abacus Concepts, Berkley, CA). χ2 data were considered significantly different if p < 0.01. ANOVA data were considered significantly different if p < 0.05. All data are expressed as mean ± SEM.
Results
Estradiol rapidly increases GnRH-1 neuronal activity
To determine whether E2 can act directly on GnRH-1 cells, four doses of E2 (2 × 10⁻¹⁰ to 2 × 10⁻⁶ M) were tested in the presence of TTX on 7 div explants. All doses increased GnRH-1 intracellular calcium above the level of TTX alone. However, the 2 × 10⁻⁹ and 2 × 10⁻⁷ M doses both increased the number of calcium peaks per cell as well as the percentage of cells with ≥10 pulses above the level of 2 × 10⁻⁶ and 2 × 10⁻¹⁰ M doses (Fig. 2). Based on these results, E2 at 2 × 10⁻⁷ M was used for all additional studies.
In explants at 7 div, E2 treatment in the presence of TTX significantly increased the number of calcium peaks/cell (more than twofold), the percentage of cells with ≥10 peaks (from 0 to 58%), the peak amplitude (>50%), and the percentage of cells contributing to each calcium pulse (25%) compared with TTX treatment alone (p < 0.001 for all parameters) (Table 2). Increases in these parameters were not found after treatment with 17α-estradiol (Fig. 3, Table 2) or by treatment with E2 in the absence of TTX (Table 1). In addition, increases in synchronous activity after E2 treatment were specific to the GnRH-1 neuronal population, because no synchronized activity and very few calcium peaks were observed in non-GnRH-1 neurons (n = 8) treated with TTX plus E2 (Fig. 3). GnRH-1 neurons in TTX-treated explants show a reduced neuronal activity compared with GnRH-1 neurons maintained in SFM alone (Tables 1, 2) (Moore et al., 2002). The E2-induced increase in GnRH-1 neurons activated in the presence of TTX resulted in many values similar to those observed in GnRH-1 neurons maintained in SFM alone. However, compared with GnRH-1 neurons maintained in SFM alone or TTX alone, the TTX plus E2 treatment significantly increased the percentage of GnRH-1 cells contributing to the calcium pulses (SFM, 41%; TTX, 40%; TTX plus E2, 66%). None of the treatments had an effect on the interpulse interval, which remained ∼18 min (data not shown). In addition, no treatments affected the activity of non-GnRH-1 neurons, which exhibited small numbers of peaks (approximately one to two) and showed no intrinsic synchronous activity.
Table 2.
Summary of calcium imaging analysis of GnRH-1 neurons at 7 and 21 div in the presence of TTX
|
|
Number of cells with peaks (%) |
Number of peaks/cell |
Mean peak amplitude |
Cells ≥ 10 peaks (%) |
Percentage of cells contributing to each pulse |
|---|---|---|---|---|---|
| 7 div | |||||
| TTX | 29/31 (94) | 4.2 ± 0.5a | 13.0 ± 1.1a | 0/31 (0)a | 40.6a |
| TTX plus 17α-estradiol | 51/54 (94) | 3.7 ± 0.4a | 13.1 ± 0.4a | 3/54 (6)a | 41.3a |
| TTX plus E2 | 58/59 (98) | 11.5 ± 0.8b | 20.5 ± 0.6b | 34/59 (58)b | 65.8b |
| TTX plus E2 plus ICI | 38/39 (97) | 4.6 ± 0.6a | 17.4 ± 0.9 | 4/39 (10)a | 59.9b |
| TTX plus BSA-E2 | 66/66 (100) | 6.3 ± 0.3a | 21.8 ± 0.5b | 7/66 (11)a | 60.7b |
| TTX plus BSA-E2 plus ICI | 20/21 (95) | 3.7 ± 0.3a | 16.7 ± 0.8a | 0/21 (0)a | 41.3a |
| 21 div | |||||
| TTX | 26/29 (90) | 4.9 ± 0.7 | 10.9 ± 0.8 | 2/29 (7) | 39.8 |
| TTX plus E2 |
21/26 (81) |
2.8 ± 0.6 |
9.7 ± 0.2 |
1/26 (4) |
49.4 |
Significantly different from TTX plus E2 within each age.
Significantly different from TTX.
Figure 3.
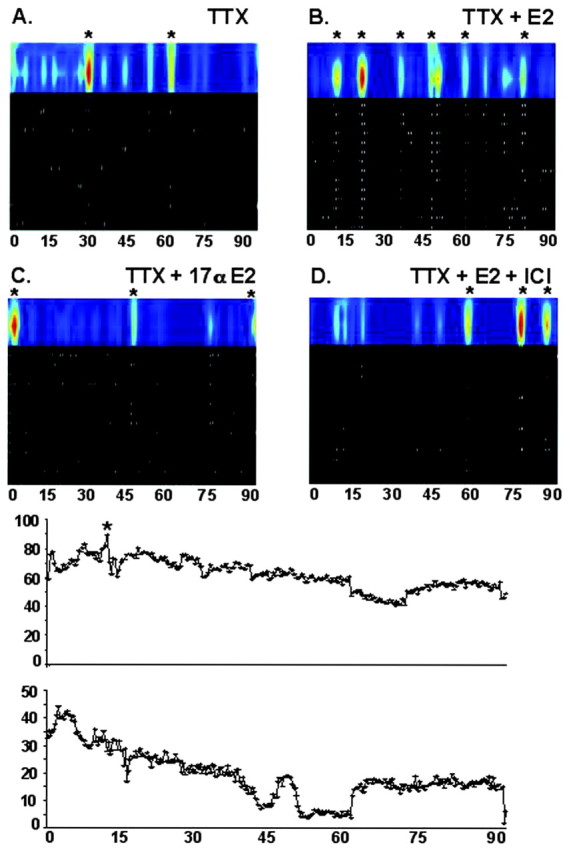
E2, but not 17α-estradiol, significantly increased GnRH-1 neuronal activity as well as the percentage of cells contributing to GnRH-1 pulses. Individual examples of calcium imaging traces of 7 div explants treated with TTX (A; n = 8 cells), TTX plus E2 (B; n = 14 cells), TTX plus 17α-estradiol (C; n = 13 cells), or TTX plus E2 plus ICI 182,780 (D; n = 13 cells). The x-axis is time (minutes). In the black and white section, each row is data from an individual cell across time, and the white lines represent the time at which a significant peak in intracellular calcium occurred. The colored trace above represents synchronized calcium oscillations across multiple cells (denoted with an asterisk). The more “intense” the pulsatile event, the closer to red the pulse appears. The bottom activity traces are individual examples of non-GnRH-1 neurons from an explant treated with TTX plus E2. The asterisk indicates a significant increase in intracellular calcium (peaks).
A time course analysis was conducted to determine the temporal rate of action of E2. In 7 div explants treated with TTX for 30 min then exposed to TTX plus E2, GnRH-1 neurons exhibited augmented synchronized calcium pulses (with a similar percentage as found for TTX plus E2; 66%) ∼28 min after E2 application.
Mechanism of E2 action on GnRH-1 neurons
Time-dependent expression of ERβ in GnRH-1 neurons
It has previously been demonstrated that ERβ expression in GnRH-1 neurons in nasal explants is decreased at 21 div compared with 7 div. Thus, as a first step toward determining whether the action of E2 is mediated by ERβ, the effects of E2 on GnRH-1 neuronal activity in older explants were examined. Unlike GnRH-1 neurons in 7 div explants, E2 had no effect on GnRH-1 neuronal activity at 21 div (Table 2).
ER antagonist
In 7 div explants, the stimulatory effects of E2 were blocked when ICI 182,780, an ER antagonist, was added in conjunction with E2 and TTX. ICI 182,780 is a pure antagonist for both ERα and ERβ, but because GnRH-1 neurons do not contain ERα, it was used to block ERβ. However, it is unclear whether this compound can block the putative membrane ER. GnRH-1 neurons in TTX plus E2 plus ICI 182,780-treated explants had significantly fewer calcium peaks/cell when compared with GnRH-1 neurons in TTX plus E2-treated explants (p ≤ 0.001) (Fig. 3). In addition, ICI 182,780 treatment significantly decreased the percentage of cells with ≥10 cells and peak amplitude (p < 0.05 and p ≤ 0.001) (Table 2, Fig. 3).
Gene transcription
To determine whether the estrogenic effects observed involved gene transcription, 7 div explants were either pretreated (10 or 30 min) with DRB (an RNA polymerase II inhibitor), followed by either no drug or TTX plus E2, or were given DRB at the same time as TTX plus E2 (time 0). The DRB treatment alone had no inhibitory effects, but when DRB was combined with TTX plus E2, no estrogenic effects were observed, regardless of the duration of preincubation (Fig. 4, Table 3).
Figure 4.

Inhibition of gene transcription reversed the effects of TTX plus E2 at three different time points. Individual examples of calcium imaging traces of 7 div explants treated with TTX plus E2 (A; n = 26 cells), TTX plus E2 plus DRB (B; 30 min before treatment; n = 12 cells), TTX plus E2 plus DRB (C; 10 min before treatment; n = 16 cells), or E2 plus TTX plus DRB (D; no pretreatment; n = 18 cells). The x-axis is time in minutes. In the black and white section, each row is data from an individual cell across time, and the white lines represent the time at which a significant peak in intracellular calcium occurred. The colored trace above represents synchronized calcium oscillations across multiple cells (denoted with an asterisk). The more “intense” the pulsatile event, the closer to red the pulse appears.
Table 3.
Summary of calcium imaging analysis of GnRH-1 neurons after inhibition of gene transcription
|
|
Number of cells with peaks (%) |
Number of peaks/cell |
Mean peak amplitude |
Cells ≥ 10 peaks (%) |
Percentage of cells contributing to each pulse |
|---|---|---|---|---|---|
| TTX plus E2 | 58/59 (98) | 11.5 ± 0.8a | 20.5 ± 0.6a | 34/59 (58)a | 65.8a |
| TTX plus DRB | 26/29 (90) | 5.2 ± 0.8 | 16.7 ± 0.7 | 3/29 (10) | 45.2 |
| TTX plus E2 plus DRB (30) | 41/44 (93) | 2.9 ± 0.3 | 14.1 ± 0.7 | 1/44 (2) | 44.2 |
| TTX plus E2 plus DRB (10) | 38/38 (100) | 3.9 ± 0.3 | 15.1 ± 0.6 | 0/38 (0) | 35.4 |
| TTX plus E2 plus DRB (0) |
38/40 (95) |
5.4 ± 0.5 |
18.1 ± 0.9 |
3/40 (8) |
75.4a
|
Significantly different from other treatments (p < 0.05 for ANOVA; p < 0.01 for Χ2).
Membrane receptor
To determine whether the effects of E2 on GnRH-1 neuronal activity were mediated via a membrane receptor, explants were treated with E2 conjugated to BSA to prevent passage through the plasma membrane. TTX plus BSA-E2 treatment was not significantly different than TTX on most measures (Table 2). The BSA-E2 did, however, increase the percentage of cells contributing to each pulse (p < 0.01) and the peak amplitude (p < 0.05) compared with TTX alone. These effects were reversed by treatment with ICI 182,780 (the percentage of cells contributing to pulses was 41.3%, and the mean peak amplitude was 16.7 ± 0.8). Measurements of luciferase activity from MCF-7 cells transfected with an ERE-luciferase reporter construct and treated with E2, BSA-E2, or no hormone suggested that the effects of BSA-E2 can be attributed to a small amount of free E2. The E2 treatment resulted in a 240% increase in luciferase activity above the no hormone controls. However, the BSA-E2 treatment also yielded a modest (59%), but significant, increase in luciferase activity
Discussion
This study investigated the action of E2 on GnRH-1 neuronal activity in an in vitro model system, devoid of humoral and CNS influences, in which many characteristics of GnRH-1 neurons in vivo are maintained. We show that in GnRH-1 cells, E2, in the presence of TTX, increased the number of calcium peaks/cell, the percentage of cells with ≥10 calcium peaks, the peak amplitude, and the percentage of cells contributing to each pulse in explants at 7 div, indicating a direct effect of E2 on GnRH-1 neuronal activity. E2 did not alter the GnRH-1 interpulse interval. A number of experiments were performed to examine the receptor transducing the E2 response. Changes in GnRH-1 neuronal activity did not occur when E2 was applied at 21 div, a time when few GnRH-1 neurons express ERβ, nor did any response occur at 7 div when 17α-estradiol was applied. When BSA-E2 was substituted for E2, no changes occurred in calcium peaks/cell or GnRH-1 cells with ≥10 calcium peaks. Increases in the percentage of cells contributing to pulses and the mean peak amplitude were observed but are attributable to a small amount of free E2 within the BSA-E2 preparation. Thus, only free E2 altered GnRH-1 neuronal activity. The effects of this E2 were reversed by treatment with ICI 182,780. Together, these data suggest E2 action on GnRH-1 neurons via ERβ. Classic E2-bound/ERβs act as DNA-binding proteins to alter transcription. When gene transcription was inhibited by administration of DRB, the effects of E2 on GnRH-1 neuronal activity were blocked. In summary, E2 can act directly on the GnRH-1 neuronal population to facilitate synchronization of neuronal activity. In addition, the effects of E2 on GnRH-1 neurons are rapid and mediated through a transcription-dependent mechanism.
Although commonly associated with reproduction, estrogen has actions throughout the nervous system and has been implicated as a neuroprotective agent (Wise, 2003). The mechanism(s) by which E2 regulates neuronal phenotypes is complex, involving both genomic and nongenomic pathways. The classical mechanism of estrogen action is for E2 to bind to intracellular ERs, which form dimers, bind to EREs, and directly regulate transcription of estrogen-sensitive genes. These transcriptional, or “genomic,” events have long been thought to take hours to days (Barnea and Gorski, 1970). However, rapid effects of E2 have been described. Application of E2 to hippocampal cells, hypothalamic cells, and neostriatal cells leads to rapid alterations of membrane excitability (Wong and Moss, 1991; Mermelstein et al., 1996; Qiu et al., 2003). In addition, E2 activates multiple second messenger signaling pathways, including: phosphatidylinositol 3-kinase (Ivanova et al., 2002), tyrosine kinase (Bi et al., 2000), MAPK (mitogen-activated protein kinase) (Bi et al., 2000), and cAMP (Gu and Moss, 1996). These “nongenomic” effects occur within seconds to minutes and are proposed to be mediated by membrane-associated ERs (Kelly and Wagner, 1999). Finally, a third mechanism of E2 action has been described recently. Here, E2 can rapidly induce transcription of genes by activating second messenger pathways, such as MAPK and IP3, which then go on to trigger DNA synthesis (Watters et al., 1997; Marino et al., 2001). These effects typically occur between 10 min and 1 hr and are also thought to occur through membrane ERs (Watters et al., 1997; Marino et al., 2001). Membrane action of E2 has been widely documented through use of BSA-E2 compounds. Using these membrane-insoluble E2s, studies have shown that ERα and ERβ, traditionally thought of as intracellular receptors, can be targeted to the membrane (Razandi et al., 1999). In addition, a novel membrane-associated ER, referred to as ERX, has been described recently (Toran-Allerand et al., 2002).
Several facts indicate that E2 is acting via ERβ, in the experiments reported here. First, ERα transcript has not been localized to GnRH-1 neurons in vivo (Herbison and Pape, 2001) and specifically not in GnRH-1 neurons maintained in the nasal explant system used in this study (Sharifi et al., 2002). Second, it has been demonstrated that ERβ can mediate rapid estrogenic actions within a subpopulation of GnRH-1 neurons (Abraham et al., 2003). Third, ERβ transcript expression in GnRH-1 neurons maintained in nasal explants directly correlates with the E2 response observed. At 7-14 div, ERβ was present in ∼50% of the GnRH-1 neurons (Sharifi et al., 2002), corresponding to the time point when a response to E2 was noted. Between 14 and 28 div, the percentage of GnRH-1 neurons expressing ERβ decreased (Sharifi et al., 2002), coinciding with the decline in responsiveness to E2 in GnRH-1 neurons at 21 div. Thus, the primary action of E2 on a subpopulation of GnRH-1 neurons is likely mediated rapidly through ERβ.
Intracellular ERs (ERα and ERβ) have been implicated primarily in genomic actions of E2. However, recently, E2 was shown to increase the phosphorylation of cAMP response element-binding protein within GnRH-1 neurons within 15 min of administration (Abraham et al., 2003). This effect was dependent on intracellular ERβ, because it was absent in ERβ knockout (ERβKO) mice as well as when E2 was conjugated to BSA (Abraham et al., 2003). Based on their data, Abraham et al. (2003) suggested a nongenomic estrogen action via ERβ within the cytoplasm. Abraham et al. (2003) did not, however, specifically rule out the involvement of gene transcription. In this study, the action of E2 on GnRH-1 neuronal activity mimicked a nongenomic “fast” action, but inhibition of gene transcription eliminated the estrogenic effects. Importantly, compared with controls, DRB treatment alone did not alter the neuronal activity of GnRH-1 neurons in nasal explants. These data indicate that the rapid action of E2 on GnRH-1 neurons was genomic. Such a rapid change is consistent with E2-activating transcription of immediate early genes, which are then involved in increasing GnRH-1 neuronal activity. In general, immediate early genes are produced within 15 min after exposure to a stimulus (Mercier et al., 2001). Within GnRH-1 neurons, expression of c-fos (a well known member of the immediate early gene family) has been shown to significantly increase during the preovulatory luteinizing hormone (LH) surge, a time when GnRH-1 neuronal activity and E2 are simultaneously elevated (Lee et al., 1990). To date, however, c-fos expression in GnRH-1 neurons in nasal explants has not been detected (S. Wray, unpublished observations). Thus, the identity of the E2-induced transcript(s) in GnRH-1 neurons that is responsible for the estrogenic effects within the GnRH-1 neuronal population is still unknown.
Estrogenic regulation of GnRH-1 neuronal activity is critical for reproduction, especially in postpubertal females. The sex of the animal at E11.5 from which the explants were generated was not known. However, ERβ-positive and -negative GnRH-1 cells were found consistently within a single explant, indicating that the results obtained were not dependent on the sex of the animal (Sharifi et al., 2002). Therefore, prenatal GnRH-1 cells maintained in vitro in SFM are a heterogeneous population with respect to expression of ERβ transcript in both male- and female-derived explants. No sex differences have been found in coexpression of cholecystokinin in GnRH-1 cells in nasal explants (P. Giacobini and S. Wray, unpublished observations), although expression of this neuropeptide has been shown to be sexually dimorphic within the GnRH-1 neuronal population in vivo (Ciofi, 2000). Similarly, there were no notable variations in the responses of the explants to E2 treatment in this study. Certainly, the time point at which the tissue is harvested (E11.5) is well before documented embryonic hormone surges that are thought to sexually differentiate the brain (MacLuskey and Naftolin, 1981). Thus, as with pulsatile GnRH-1 secretion, it appears that many properties of the GnRH-1 neuronal system are intrinsically programmed or established via nasal cues or both, and subsequently modified on entrance into the CNS.
One of the primary properties of GnRH-1 system regulation in the adult female is positive and negative feedback by E2. Because plasma E2 levels rise during the menstrual and estrous cycles, the GnRH-1 pulse frequency or amplitude increases as well (Freeman, 1994). Augmented release of GnRH-1 leads to a preovulatory LH surge (Freeman, 1994). Once ovulation occurs, E2 inhibits GnRH-1 pulsatility (Freeman, 1994). The negative feedback of E2 on GnRH-1 neurons requires ERα (Dorling et al., 2003; Wersinger et al., 1999). Because GnRH-1 neurons do not express ERα (Herbison and Pape, 2001), negative feedback is likely accomplished via interneuronal cell types (for review, see Petersen et al., 2003). ERβKO females are subfertile, with females getting pregnant ∼20% of the time a sperm plug is found (Krege et al., 1998). Although the cause of this fertility deficit is still unclear, reproductive dysfunction in ERβKO mice is consistent with deficits in E2-induced positive feedback. The identification of ERβ expression within GnRH-1 neurons (Hrabovsky et al., 2001; Kallo et al., 2001; Sharifi et al., 2002) provided a direct route for E2-positive feedback. Although the downstream signals induced after E2 exposure remain to be identified, the functional significance of E2 activation with respect to the GnRH-1 neuronal population is clear. E2 induced an upregulation of GnRH-1 neuronal activity and recruitment of an additional subpopulation of GnRH-1 neurons to the synchronized pulse. This would result in an increase in total GnRH-1 released in a single pulse, which could potentially mediate the rise in GnRH-1 that precedes the preovulatory LH surge.
In summary, this is the first report to show that E2 acts directly on a subpopulation of GnRH-1 neurons to increase neuronal activity and enhance the synchronicity of GnRH-1 pulses, an event associated with GnRH-1 secretion (Terasawa et al., 1999a; Moore and Wray, 2000; Moore et al., 2002). Furthermore, the data indicate that the actions of E2 are likely mediated via intracellular ERβ. Estradiol treatment recruited ∼25% additional cells to contribute to each GnRH-1 pulse. In adult mice, ∼20% of GnRH-1 neurons express ERβ (Skynner et al., 1999), and only a subset of GnRH-1 neurons appear to be involved in the generation of the preovulatory LH surge (Rajendren, 2001). The GnRH-1 cells examined in this study never entered the CNS and were maintained in a model system devoid of CNS cues, yet exhibit regulation by E2 that parallels observations made in reproductive-aged mice. Thus, based on our findings, we propose that in vivo, a subpopulation of ERβ-containing GnRH-1 neurons are recruited by rising levels of E2 before the preovulatory LH surge to mediate E2-induced positive feedback in the hypothalamic-pituitary-gonadal axis.
Footnotes
We thank Andree Reuss and Eric Sheng for technical assistance with these experiments. We also thank the Howard Hughes Medical Institute for support of Anushka Sunder and Eric Laing. Finally, we thank Dr. Heather Cameron for thoughtful comments on the content of this manuscript.
Correspondence should be addressed to Dr. Susan Wray, 36 Convent Drive, Building 36, Room 5A21, Bethesda, MD 20892-4156. E-mail: wrays@ninds.nih.gov.
Copyright © 2004 Society for Neuroscience 0270-6474/04/246326-08$15.00/0
References
- Abraham IM, Han SK, Todman MG, Korach KS, Herbison AE (2003) Estrogen receptor β mediates rapid estrogen actions on gonadotropin-releasing hormone neurons in vivo J Neurosci 23: 5771-5777. [DOI] [PMC free article] [PubMed] [Google Scholar]
- Barnea A, Gorski J (1970) Estrogen-induced protein. Time course of synthesis. Biochemistry 9: 1899-1904. [DOI] [PubMed] [Google Scholar]
- Bi R, Broutman G, Foy MR, Thompson RF, Baudry M (2000) The tyrosine kinase and mitogen-activated protein kinase pathways mediate multiple effects of estrogen in hippocampus. Proc Natl Acad Sci USA 97: 3602-3607. [DOI] [PMC free article] [PubMed] [Google Scholar]
- Ciofi P (2000) Phenotypical segregation among female rat hypothalamic gonadotropin-releasing hormone neurons as revealed by the sexually dimorphic coexpression of cholecystokinin and neurotensin. Neuroscience 99: 133-147. [DOI] [PubMed] [Google Scholar]
- Dorling AA, Todman MG, Korach KS, Herbison AE (2003) Critical role for estrogen receptor alpha in negative feedback regulation of gonadotropin-releasing hormone mRNA expression in the female mouse. Neuroendocrinology 78: 204-209. [DOI] [PubMed] [Google Scholar]
- Freeman ME (1994) The neuroendocrine control of the ovarian cycle of the rat. In: Physiology of reproduction (Knobil E, Neill JD, eds), pp 613-658. New York: Raven.
- Fueshko S, Wray S (1994) LHRH cells migrate on peripherin fibers in embryonic olfactory explant cultures: an in vitro model for neurophilic neuronal migration. Dev Biol 166: 331-348. [DOI] [PubMed] [Google Scholar]
- Funabashi T, Daikoku S, Shinohara K, Kimura F (2000) Pulsatile gonadotropin-releasing hormone (GnRH) secretion is an inherent function of GnRH neurons, as reveled by the culture of medial olfactory placode obtained from embryonic rats. Neuroendocrinology 71: 138-144. [DOI] [PubMed] [Google Scholar]
- Gu Q, Moss RL (1996) 17β-Estradiol potentiates kainate-induced currents via activation of the cAMP cascade. J Neurosci 16: 3620-3629. [DOI] [PMC free article] [PubMed] [Google Scholar]
- Herbison AE, Pape JR (2001) New evidence for estrogen receptors in gonadotropin-releasing hormone neurons. Front Neuroendcrinol 22: 292-308. [DOI] [PubMed] [Google Scholar]
- Hrabovszky E, Steinhauser A, Barabas K, Shughrue PJ, Petersen SL, Merchenthaler I, Liposits Z (2001) Estrogen receptor-b immunoreactivity in luteinizing hormone-releasing hormone neurons of the rat brain. Endocrinology 141: 3506-3509. [DOI] [PubMed] [Google Scholar]
- Ivanova T, Mendez P, Garcia-Segura LM, Beyer C (2002) Rapid stimulation of the PI3-kinase/Akt signalling pathway in developing midbrain neurons by oestrogen. J Neuroendocrinol 14: 73-79. [DOI] [PubMed] [Google Scholar]
- Kallo I, Butler JA, Barkovics-Kallo M, Goubillon ML, Coen CW (2001) Oestrogen receptor β-immunoreactivity in gonadotropin-releasing hormone-expressing neurones: regulation by oestrogen. J Neuroendocrinol 13: 741-748. [DOI] [PubMed] [Google Scholar]
- Karsch FJ, Cummins JT, Thomas GB, Clarke IJ (1987) Steroid feedback inhibition of pulsatile secretion of gonadotropin-releasing hormone in the ewe. Biol Reprod 36: 1207-1218. [DOI] [PubMed] [Google Scholar]
- Kelly MJ, Levin ER (2001) Rapid actions of plasma membrane estrogen receptors. TRENDS Endocrinol Metab 12: 152-156. [DOI] [PubMed] [Google Scholar]
- Kelly MJ, Wagner EJ (1999) Estrogen modulation of G-protein-coupled receptors. TRENDS Endocrinol Metab 10: 369-374. [DOI] [PubMed] [Google Scholar]
- Krege JH, Hodgin JB, Couse JF, Enmark E, Warner M, Mahler JF, Sar M, Korach KS, Gustafsson JA, Smithies O (1998) Generation and reproductive phenotypes of mice lacking the estrogen receptor beta. Proc Natl Acad Sci USA 95: 15677-15682. [DOI] [PMC free article] [PubMed] [Google Scholar]
- Kuiper GGJM, Enmark E, Pelto-Huikko M, Nilsson S, Gustafsson JA (1996) Cloning of a novel receptor expressed in rat prostate and ovary. Proc Natl Acad Sci USA 93: 5925-5930. [DOI] [PMC free article] [PubMed] [Google Scholar]
- Kusano K, Fueshko S, Gainer H, Wray S (1995) Electrical and synaptic properties of embryonic luteinizing hormone-releasing hormone neurons in explant cultures. Proc Natl Acad Sci USA 92: 3918-3922. [DOI] [PMC free article] [PubMed] [Google Scholar]
- Lee WS, Smith MS, Hoffman GE (1990) Luteinizing hormone-releasing hormone neurons express Fos protein during the proestrous surge of luteinizing hormone. Proc Natl Acad Sci USA 87: 5163-5167. [DOI] [PMC free article] [PubMed] [Google Scholar]
- Levine JE, Pau KY, Ramirez VD, Jackson GL (1985) Simultaneous measurement of luteinizing hormone-releasing hormone and luteinizing hormone release in unanesthetized, ovariectomized sheep. Endocrinology 111: 1449-1455. [DOI] [PubMed] [Google Scholar]
- MacLusky NJ, Naftolin F (1981) Sexual differentiation of the central nervous system. Science 211: 1294-1302. [DOI] [PubMed] [Google Scholar]
- Marino M, Distefano E, Trentalance A, Smith CL (2001) Estradiol-induced IP(3) mediates the estrogen receptor activity in human cells. Mol Cell Endocrinol 182: 19-26. [DOI] [PubMed] [Google Scholar]
- McEwen B, Akama K, Alves S, Brake WG, Bulloch K, Lee S, Li C, Yuen G, Milner TA (2001) Tracking the estrogen receptor in neurons: Implications for estrogen-induced synapse formation. Proc Natl Acad Sci USA 98: 7093-7100. [DOI] [PMC free article] [PubMed] [Google Scholar]
- Meisel RL, Sachs BD (1994) The physiology of male sex behavior. In: Physiology of reproduction (Knobil E, Neill JD, eds), pp 3-106. New York: Raven.
- Mercier G, Turque N, Schumacher M (2001) Early activation of transcription factor expression in Schwann cells by progesterone. Brain Res Mol Brain Res 97: 137-148. [DOI] [PubMed] [Google Scholar]
- Mermelstein PG, Becker JB, Surmeier DJ (1996) Estradiol reduces calcium currents in rat neostriatal neurons via a membrane receptor. J Neurosci 16: 595-604. [DOI] [PMC free article] [PubMed] [Google Scholar]
- Merriam GR, Watcher KW (1982) Algorithms for the study of episodic hormone secretion. Am J Physiol 243: 94-98. [DOI] [PubMed] [Google Scholar]
- Moore CR, Price D (1932) Gonadal hormone functions and the reciprocal influence between gonads and hypophysis, with its bearing on sex hormone antagonism. Am J Anat 50: 13-71. [Google Scholar]
- Moore Jr JP, Wray S (2000) Luteinizing hormone-releasing hormone (LHRH) biosynthesis and secretion in embryonic LHRH. Endocrinology 141: 4486-4495. [DOI] [PubMed] [Google Scholar]
- Moore Jr JP, Shang E, Wray S (2002) In situ GABAergic modulation of synchronous gonadotropin releasing-hormone-1 neuronal activity. J Neurosci 22: 8932-8941. [DOI] [PMC free article] [PubMed] [Google Scholar]
- Petersen SL, Ottem EN, Carpenter CD (2003) Direct and indirect regulation of GnRH neurons by estradiol. Biol Reprod 69: 1771-1778. [DOI] [PubMed] [Google Scholar]
- Qiu J, Bosch MA, Tobias SC, Grandy DK, Scanlan TS, Ronnekleiv OK, Kelly MJ (2003) Rapid signaling of estrogen in hypothalamic neurons involves a novel G-protein-coupled estrogen receptor that activates protein kinase C. J Neurosci 23: 9529-9540. [DOI] [PMC free article] [PubMed] [Google Scholar]
- Rajendren G (2001) Subsets of gonadotropin-releasing hormone (GnRH) neurons are activated during a steroid-induced luteinizing hormone surge and mating in mice: a combined retrograde tracing double immunohistochemical study. Brain Res 918: 74-79. [DOI] [PubMed] [Google Scholar]
- Razandi M, Pedram A, Greene GL, Levin ER (1999) Cell membrane and nuclear estrogen receptors (ERs) originate from a single transcript: studies of ERα and ERβ expressed in Chinese hamster ovary cells. Mol Endocrinol 13: 307-319. [DOI] [PubMed] [Google Scholar]
- Sharifi N, Reuss AE, Wray S (2002) Prenatal LHRH neurons in nasal explant cultures express estrogen receptor beta transcript. Endocrinology 143: 2503-2507. [DOI] [PubMed] [Google Scholar]
- Skynner MJ, Sim JS, Herbison AE (1999) Detection of estrogen receptor α and β messenger ribonucleic acids in adult gonadotropin-releasing hormone neurons. Endocrinology 140: 5195-5201. [DOI] [PubMed] [Google Scholar]
- Stevis PE, Deecher DC, Suhadolnik L, Mallis LM, Frail DE (1999) Differential effects of estradiol and estradiol-BSA conjugates. Endocrinology 140: 5455-5458. [DOI] [PubMed] [Google Scholar]
- Temple JL, Scordalakes EM, Bodo C, Gustafsson JA, Rissman EF (2003) Lack of functional estrogen receptor beta gene disrupts pubertal male sexual behavior. Horm Behav 44: 427-434. [DOI] [PubMed] [Google Scholar]
- Terasawa E, Keen KL, Mogi K, Claude P (1999a) Pulsatile release of luteinizing hormone-releasing hormone in cultured LHRH neurons derived from the embryonic olfactory placode of the rhesus monkey. Endocrinology 140: 1432-1441. [DOI] [PubMed] [Google Scholar]
- Terasawa E, Schanhofer WK, Keen KL, Luchansky L (1999b) Intracellular Ca2+ oscillations in luteinizing hormone-releasing hormone neurons derived from the embryonic placode of the rhesus monkey. J Neurosci 19: 5898-5909. [DOI] [PMC free article] [PubMed] [Google Scholar]
- Toran-Allerand CD, Guan X, MacLusky NJ, Horvath TL, Diano S, Singh M, Connolly ES, Nethrapalli IS, Tinnikov AA (2002) ER-X: a novel, plasma membrane-associated putative estrogen receptor that is regulated during development and after ischemic brain injury. J Neurosci 22: 8391-8401. [DOI] [PMC free article] [PubMed] [Google Scholar]
- Wang LH, Yang XY, Zhang X, Mihalic K, Xiao W, Farrar WL (2003) The cis decoy against the estrogen response element suppresses breast cancer cells via target disrupting c-fos not mitogen-activated protein kinase activity. Cancer Res 63: 2046-2051. [PubMed] [Google Scholar]
- Watters JJ, Campbell JS, Cunningham MJ, Krebs EG, Dorsa DM (1997) Rapid membrane effects of steroids in meuroblastoma cells: effects of estrogen on mitogen activated protein kinase signaling cascade and c-fos immediate early gene transcription. Endocrinology 138: 4030-4033. [DOI] [PubMed] [Google Scholar]
- Wersinger SR, Haisenleder DJ, Lubahn DB, Rissman EF (1999) Steroid feedback on gonadotropin release and pituitary gonadotropin subunit mRNA in mice lacking a function estrogen receptor alpha. Endocrine 11: 137-143. [DOI] [PubMed] [Google Scholar]
- Wise PM (2003) Estrogens: protective or risk factors in brain function? Prog Neurobiol 69: 181-191. [DOI] [PubMed] [Google Scholar]
- Wong M, Moss RL (1991) Electrophysiological evidence for a rapid membrane action of the gonadal steroid, 17 beta-estradiol, on CA1 pyramidal neurons of the rat hippocampus. Brain Res 543: 148-152. [DOI] [PubMed] [Google Scholar]
- Wray S (2002) Development of gonadotropin-releasing hormone-1 neurons. Front Neuroendocrinol 23: 292-316. [DOI] [PubMed] [Google Scholar]
- Wray S, Gahwiler BH, Gainer H (1988) Slice cultures of LHRH neurons in the presence and absence of brainstem and pituitary. Peptides 9: 1151-1175. [DOI] [PubMed] [Google Scholar]