

Abstract
The subventricular zone of the rodent brain retains the capacity of generating new neurons in adulthood. The newly formed neuroblasts migrate rostrally toward the olfactory bulb, where they differentiate as granular and periglomerular interneurons. The reported presence of differentiated neurons expressing the neuronal isoform of nitric oxide synthase (NOS) in the periphery of the neurogenic region and the organization of their varicose axons as a network in which the precursors are immersed raised the hypothesis that endogenous nitric oxide (NO) may participate in the control of neurogenesis in the subventricular zone. Systemic administration of the NOS inhibitors Nω-nitro-l-arginine methyl ester or 7-nitroindazole to adult mice produced a dose- and time-dependent increase in the number of mitotic cells in the subventricular zone, rostral migratory stream, and olfactory bulb, but not in the dentate gyrus of the hippocampus, without affecting apoptosis. In the subventricular zone, this effect was exerted selectively on a precursor subpopulation expressing nestin but not neuronal or glial cell-specific proteins. In addition, in the olfactory bulb, analysis of maturation markers in the newly generated neurons indicated that chronic NOS inhibition caused a delay in neuronal differentiation. Postmitotic cell survival and migration were not affected when NO production was impaired. Our results suggest that NO, produced by nitrergic neurons in the adult mouse subventricular zone and olfactory bulb, exerts a negative control on the size of the undifferentiated precursor pool and promotes neuronal differentiation.
Keywords: adult neurogenesis, neural phenotypes, neural precursor proliferation, neuroblasts, nitric oxide synthase, olfactory bulb, subventricular zone
Introduction
It is well established that neurogenesis persists in specific regions of the adult brain in many animal species (for review, see Gage, 2000). In mammals, newborn neurons generate in the dentate gyrus (DG) of the hippocampus (Eriksson et al., 1998) as well as in the subventricular zone (SVZ) under the lateral wall of the lateral ventricles (Lois and Alvarez-Buylla, 1993). Neuroblasts from the SVZ migrate tangentially along the rostral migratory stream (RMS) to reach the olfactory bulb (OB), where they differentiate as granular and periglomerular interneurons (Lois and Alvarez-Buylla, 1994; Doetsch and Alvarez-Buylla, 1996).
Nitric oxide (NO) is a diffusible intercellular messenger with multiple functions in the cardiovascular, immunological, and nervous systems (Moncada et al., 1991; Garthwaite and Boulton, 1995). In the brain, the neuronal isoform of NO synthase (nNOS) is expressed by specific neurons that are widely distributed (Bredt et al., 1990; Rodrigo et al., 1994). Nitrergic neurons participate in specific sensory motor functions (Moreno-López et al., 1996), synaptic formation and remodeling (Holscher, 1997), control of cerebral blood flow (Estrada et al., 1993; Iadecola, 1993), and postischemic neuroprotection and neurotoxicity (Estrada and de Felipe, 1998). We have recently shown that in the adult mouse brain, the SVZ is surrounded by differentiated neurons expressing nNOS; these neurons project rich axonal networks in which SVZ neuroblasts are immersed (Moreno-López et al., 2000). In addition, some neuroblasts contain nNOS once they reach the OB periglomerular area (Moreno-López et al., 2000). The spatial proximity between precursor cells and potential NO sources raises the question of whether NO may be one of the factors controlling neurogenesis in the adult brain.
The hypothesis that NO may participate in adult neurogenesis is strengthened by some additional experimental findings. First, a role for NO in embryonic brain development is well established on the basis of the variable anatomical distribution of nitrergic cells during ontogenesis (Bredt and Snyder, 1994; Keilhoff et al., 1996; Santacana et al., 1998) as well as on the consequences of preventing NO formation on brain development (Kuzin et al., 1996; Peunova et al., 2001). Second, NO is antiproliferative for several cell types in vitro (Garg and Hassid, 1989, 1990; Cornwell et al., 1994; Estrada et al., 1997), including tumoral cells of neuronal lineage (Peunova and Enikolopov, 1995; Murillo-Carretero et al., 2002). Finally, one of the mechanisms involved in the antiproliferative action of NO is the inhibition of the epidermal growth factor receptor (EGFR) (Estrada et al., 1997; Murillo-Carretero et al., 2002), and it is known that EGFR activation is required for the proliferation of SVZ neuronal precursors both in vitro (Reynolds and Weiss, 1992; Morshead et al., 1994; Gritti et al., 1999) and in vivo (Craig et al., 1996; Kuhn et al., 1997; Tropepe et al., 1997).
The purpose of this study was to analyze the consequences of chronically inhibiting NOS activity on SVZ-OB neurogenesis in the adult mouse. We found that NO modulates neuronal precursor proliferation in the SVZ and cell differentiation in the OB without affecting cell survival or migration.
Materials and Methods
Subjects. Adult CD1 mice (2-4 months of age) were used throughout this study. Care and handling of animals were performed in accordance with the Guidelines of the European Union Council (86/609/EU), following the Spanish regulations (BOE 67/8509-12) for the use of laboratory animals.
Administration of NOS inhibitors. Mice were injected with the broad spectrum NOS inhibitor Nω-nitro-l-arginine methyl ester (L-NAME) (30-90 mg/kg per day, i.p., for 1, 7, or 15 d), the inactive stereoisomer D-NAME (90 mg/kg per day, i.p., for 7 d), or the relatively specific nNOS inhibitor 7-nitroindazole (7-NI) (30 mg/kg every 12 or 24 hr, i.p., for 4 d). Control animals received the corresponding vehicles (PBS for L-NAME and D-NAME, or 10% DMSO in propylene glycol for 7-NI) with the same time sequences. Both inhibitors were reported to decrease cerebral NOS activity within the dose range used (Yoshida et al., 1994; Salter et al., 1995). The drugs were systemically administered for several reasons. First, systemic, but not intracerebroventricular or local, administration produces homogeneous NOS inhibition throughout the brain (Salter et al., 1995), therefore allowing the comparative study of NO action in different regions. Second, intracerebral drug administration would cause a surgical trauma, which may upregulate nNOS and initiate the expression of inducible NOS (iNOS) in the proximity of the lesioned area (Rao et al., 1999; Petrov et al., 2000; our observations), therefore creating a nonphysiological source of NO production.
NOS activity measurement. Mice were injected with either vehicle or L-NAME and killed 24 hr later by cervical dislocation. Brains were quickly removed and used for enzyme activity determination. NOS activity was measured after the conversion of [3H]-l-arginine to [3H]-l-citrulline, using the assay described by Bredt and Snyder (1994). Samples were assayed in the presence of 6 μm l-arginine, with or without EGTA, to differentiate calcium-dependent and calcium-independent NOS activities. This determination necessarily underestimates the inhibition occurring in vivo in treated animals, because L-NAME is a reversible inhibitor, and the enzyme activity is partially restored after L-NAME dilution during the assay.
Western blotting. Mice treated with L-NAME (90 mg/kg per day) for 7 d were deeply anesthetized, their brains were isolated, and the SVZ, OB, and hippocampus were microdissected and homogenized in lysis buffer [50 mm Tris-HCl, pH 7.4, 1% (v/v) Triton X-100, 0.5% (w/v) sodium deoxycholate, 1 mm phenylmethylsulfonylfluoride, 10 mg/ml leupeptin, 10 mg/ml pepstatin A, 10 mg/ml aprotinin, and 2 mm sodium orthovanadate]. Aliquots (50 μg of total protein) from each sample were processed for SDS-PAGE and immunoblotting, as described previously (Murillo-Carretero et al., 2002), using specific antibodies against either nNOS (1:5000; kindly provided by Dr. J. Rodrigo, Consejo Superior de Investigaciones Cientificas, Madrid, Spain) or endothelial NOS (eNOS; 1:5000; Santa Cruz Biotechnology, Santa Cruz, CA).
Blood pressure and heart rate measurements. Mice different from those used for brain analysis were trained during 8-10 d for noninvasive evaluation of blood pressure (BP) and heart rate, essentially as described by Krege et al. (1995), using a tail-cuff system (LE5001; Letica, Barcelona, Spain). The animals were then treated with L-NAME (90 mg/kg per day for 15 d), 7-NI (30 mg/kg, 12 hr, for 4 d), or the corresponding vehicles. Blood pressure and heart rate were measured at different times after injections along the treatment period.
Programmed cell death. The detection and quantification of apoptotic cells was performed using the terminal deoxynucleotidyl transferase-mediated dUTP nick-end labeling (TUNEL) staining method. Brain sections obtained from mice treated with L-NAME (90 mg/kg per day) for 1, 7, or 15 d were permeabilized with Triton X-100 and sequentially treated with collagenase and proteinase K for 1 hr and 10 min, respectively. The tissue was further fixed with 4% paraformaldehyde for 2 hr, washed with PBS, and immunostained with an antibody that recognizes the modified adhesion molecule polysialylated neural cell adhesion molecule (PSA-NCAM; Chemicon, Temecula, CA) to identify the neurogenic areas. Apoptotic nuclei were visualized using a commercial kit from Roche (Hertforshire, UK), following the standard protocol provided by the manufacturer. Nuclei were counterstained with 4′,6′-diamidino-2-phenylindole (DAPI).
Bromodeoxyuridine administration. Animals were injected with the thymidine analog bromodeoxyuridine (BrdU; 200-350 mg/kg, i.p.) to obtain a specific and quantitative labeling of dividing cells (Cameron and McKay, 2001). To determine the role of endogenous NO on neural precursor proliferation, mice were treated with either L-NAME (7 or 15 d), D-NAME (7 d), or 7-NI (4 d). On the last day of treatment, a total of 200 mg/kg of BrdU was administered and distributed in three doses separated by 2.5 hr intervals; the animals were killed 2.5 hr after the last BrdU injection (7.5 hr cumulative labeling).
The effects of NOS inhibition on neural precursor survival, migration, and differentiation were analyzed in mice that received 350 mg/kg of BrdU initially, distributed in five injections within a 10 hr period, followed by L-NAME administration (90 mg/kg per day) for the next 7 or 15 d. Animals were killed, and their brains were analyzed at the end of the L-NAME treatment.
Immunohistochemistry. Control and treated mice were deeply anesthetized with chloral hydrate (0.5 gm/kg) and transcardially perfused with 4% (w/v) paraformaldehyde in 0.1 m phosphate buffer, pH 7.4. The brains were removed, postfixed for an additional 2 hr, and cryoprotected by immersion in 30% sucrose solution overnight. Serial coronal sections (30 μm thick) of the SVZ, RMS, OB, and hippocampus were obtained using a cryostat and stored at -20°C in a cryoprotectant solution (glycerol and PBS, pH 7.4, 1:1 in volume). Free-floating cerebral sections were subjected to DNA denaturation by treatment with a solution containing 50% (v/v) formamide, 150 mm NaCl, and 15 mm sodium citrate at 65°C for 2 hr, followed by a 30 min incubation in 2N HCl at 37°C (Kuhn et al., 1997). For single BrdU immunohistochemistry, sections were first treated with 2% H2O2 and 60% (v/v) methanol in PBS for 30 min to block endogenous peroxidase activity and were then incubated for 30 min with a solution containing 2.5% (w/v) bovine serum albumin, 0.25% (w/v) sodium azide, and 0.1% (v/v) Triton X-100 in PBS (PAAT) to prevent nonspecific antibody binding. This solution was also used to dilute the primary and secondary antibodies. Incubation with the primary anti-BrdU antibody (1:100; mouse monoclonal; Dako, Glostrup, Denmark) was performed overnight at 4°C. After several rinses in PBS, sections were treated for 1 hr at room temperature with a biotinylated anti-mouse IgG secondary antibody (1:250; Sigma, St. Louis, MO) and exposed to the avidine-biotin-peroxidase complex (Pierce, Rockford, IL). The peroxidase reaction was made visible with diaminobenzidine (0.25 mg/ml) and hydrogen peroxide (0.003%; v/v). Sections were then mounted on slides, dehydrated, coverslipped with DePeX (Serva, Heidelberg, Germany), and analyzed under light microscopy.
Multiple immunofluorescence techniques were used to simultaneously detect BrdU and one or two of the following cell type-specific antigens: nestin, to label immature precursors (Lendahl et al., 1990); βIII-tubulin and neuronal nuclear antigen (NeuN), to identify young (Lee et al., 1990) and mature (Mullen et al., 1992) neurons, respectively; and glial fibrillary acidic protein (GFAP) as a marker for astroglial cells. For that, free-floating brain sections were treated for DNA denaturation and incubated with PAAT for 30 min at room temperature. Incubations with two or three primary (overnight; 4°C) or secondary (1 hr; room temperature) antibodies were performed simultaneously. After washing with PBS, the sections were mounted on slides with Vectashield (Vector Laboratories, Burlingame, CA), and fluorescent signals were detected using a BX60 Olympus (Tokyo, Japan) epifluorescence microscope and a Leica (Nussloch, Germany) Spectra confocal microscope. The following primary antibodies were used: rat monoclonal anti-BrdU antibody (1:100; Harlan, Indianapolis, IN), mouse monoclonal anti-βIII-tubulin antibody (1:400; Promega, Madison, WI), mouse monoclonal anti-NeuN antibody (1:100; Chemicon), rabbit polyclonal anti-GFAP antibody (1:1.000; Dako), and rabbit polyclonal anti-nestin antibody (1:5000; gift from Dr. M. Vallejo, Consejo Superior de Investigaciones Científicas, Madrid, Spain). The following secondary antibodies were used: anti-rabbit IgG labeled with FITC (1:200; Jackson ImmunoResearch, West Grove, PA), anti-mouse IgG labeled with cyanin 3 (Cy3; 1:4.000; Amersham Biosciences, Arlington Heights, IL), and anti-rat IgG labeled with either aminomethyl-coumarin or Cy5 (1:200; Jackson ImmunoResearch). All secondary antibodies were adsorbed against several species to prevent undesired cross-reactions. Omission of primary antibodies resulted in no detectable staining in all cases.
Quantification. Proliferating cells, detected by their BrdU-positive (BrdU+) nuclei, were counted in one of three sections with a 40× objective (Nikon, Tokyo, Japan) by stereological unbiased methods, essentially as described by Kuhn et al. (1997). Sections were obtained between the following coordinates rostral to bregma: SVZ, 0.38-1.42 mm; RMS, 1.94-2.96 mm; and OB, 3.2 mm to the rostral end, according to Franklin and Paxinos (1997). We analyzed 22 half-sections for each region in all animals and experimental groups. Figure 1, B-D, shows cartoons representing sections of the SVZ, RMS, and OB, respectively, at the rostrocaudal levels indicated in the sagittal view of the mouse brain illustrated in Figure 1A. For each region, the predetermined areas in which labeled nuclei were counted are indicated. The three-dimensional density of BrdU+ cells was estimated using the optical dissector technique (Howard and Reed, 1998) and expressed as the number of labeled nuclei per square millimeter. Total section thickness was used for dissector height.
Figure 1.

Schematic representation of the analyzed regions. A, Drawing of a sagittal section of the mouse brain, indicating the anatomical location of the coronal sections in B-D. Neural precursors in the lateral wall of the lateral ventricle (LV) migrate tangentially through the RMS to the OB and then migrate radially and differentiate in the granular and glomerular cell layers. B, Drawing of a coronal section through the subventricular zone showing the position of the areas (125 × 125 μm) in which BrdU+ cells were counted. The dotted line represents the midline. C, Drawing of a coronal section showing the position of the square (same size as in B) used to quantify the number of cells that recently underwent mitosis in the RMS. D, Coronal view of the OB, in which four areas (250 × 250 μm), including the granule cell (GrO) and the glomerular (Gl) layers, were analyzed. In some experiments, the number of BrdU+ cells was also counted in a rectangular area (25 × 1000 μm) in the central part of the OB, where tangentially migrating cells from the SVZ enter the OB before starting their radial migration. aci, Anterior commissure; AOB, accessory olfactory bulb; cc, corpus callosum; CPu, caudate-putamen; Epl, external plexiform layer; fi, fimbria hippocampi; HPC, hippocampus; N, neocortex. Scale bars: A, 1 mm; B-D, 500 μm.
Quantification in the hippocampus was performed as described, except that cells were counted in the total surface of the dentate gyrus in one of six sections between 1.22 and 3.80 mm caudal to bregma. To avoid differences in the overall intensity of staining that may affect the quantitative results when BrdU immunohistochemistry was applied to different groups of mice in different days, tissue sections from control and treated mice were always processed in parallel, and data from treated animals were expressed as percentages of the average value obtained from control brains.
To assess the phenotype of newborn cells in the SVZ and OB, multiple immunofluorescence followed by confocal analysis was used. We detected BrdU+ cells and determined whether they contained neuronal (βIII-tubulin or NeuN) or astroglial (GFAP) markers. In other cerebral sections, the presence of βIII-tubulin and nestin was analyzed in BrdU+ cells. In all cases, at least three sections per mouse in a minimum of three mice were analyzed for each region and condition. The number of double- or triple- labeled cells is expressed as a percentage of the number of BrdU+ cells counted, which is indicated for each experiment. The density of newborn cells expressing each antigen, or antigen combination, was calculated by applying these percentages to the density of BrdU+ cells in the corresponding region of the same animal. Analyses were performed in blind-coded slides. Data are presented as means ± SEM. The nonparametric Mann-Whitney U test was used for statistical comparisons.
Results
Cerebral NOS activity and expression
Systemic administration of L-NAME to adult mice produced a long-lasting inhibition of cerebral NOS activity that was dose dependent within the dose range used. As shown in Figure 2A, 24 hr after a single injection, a significant inhibition was still observed with both doses. No calcium-independent enzyme activity was detected in the brain tissue in any case. The possible influence of chronic NOS inhibition on the expression of the two constitutive NOS isoforms present in the brain was also investigated. After 7 d of treatment, the amounts of nNOS and eNOS protein in the SVZ, OB, and hippocampus were identical in animals receiving vehicle and in those injected with 90 mg/kg of L-NAME per day (Fig. 2B).
Figure 2.

Effect of systemic L-NAME administration on cerebral NOS. A, Calcium-dependent cerebral NOS activity 24 hr after intraperitoneal injections of vehicle or L-NAME at the indicated doses. Data represent the mean ± SD of two experiments; *p < 0.05, compared with mice injected with the vehicle. B, Western blots showing neuronal and endothelial NOS protein in the SVZ, OB, and hippocampus (HPC) of adult mice injected with vehicle (control) or L-NAME (90 mg/kg per day) for 7 d.
Cardiovascular effects of NOS inhibitors
Administration of L-NAME produced a transient and significant increase in arterial BP (Fig. 3). Two hours after injections, treated mice exhibited a mean BP of 174 ± 10 mmHg that returned to normal values (103 ± 5) within the following 6 hr. On the contrary, the nNOS inhibitor 7-NI (Kelly et al., 1995) caused only a mild effect on BP (Fig. 3). The kinetics for both drugs was maintained essentially the same during the treatment. No changes were observed in heart rate at any time after injections of either NOS inhibitor. The weight of the animal was also maintained without significant changes during the treatment period in L-NAME, 7-NI, and vehicle-injected mice.
Figure 3.

Effect of systemic administration of L-NAME (filled circles) and 7-NI (open circles) on mean arterial blood pressure (MABP). Animals were treated with L-NAME (90 mg/kg per day) for 15 d or with 7-NI (30 mg/kg, twice per day) for 4 d. At the indicated times after the last injection, arterial blood pressure was measured by the noninvasive tail-cuff technique, as described in Materials and Methods. Results are expressed as a percentage of the average MABP obtained in mice injected with vehicle. Data are presented as means ± SEM of values obtained in four (L-NAME) or six (7-NI) animals.
Effect of NOS inhibition on cell proliferation
Chronic administration of the NOS inhibitor L-NAME to adult mice, followed by cumulative labeling with BrdU for 7.5 hr before the animal was killed, produced an increase in the number of BrdU+ cells in the SVZ, RMS, and granular and glomerular layers of the OB (Figs. 4A-F, 5A,B; Table 1). The action of L-NAME increased with treatment duration in the OB and SVZ (Fig. 5A). In agreement with the biochemical data, L-NAME produced a dose-dependent rise in the number of cells undergoing mitosis (Fig. 5B). On the contrary, mice receiving similar doses of the inactive stereoisomer D-NAME presented a density of BrdU+ cells similar to that of control animals in the three regions (Fig. 5A). Administration of 7-NI also produced significant increases in the number of mitotic cells in the SVZ, RMS, and OB (Fig. 5C). For both NOS inhibitors, the effects observed in the OB and SVZ were larger than those found in the RMS. The densities of mitotic cells (BrdU+ cells/mm3) in each condition and region are shown in Table 1.
Figure 4.

Effect of NO synthesis inhibition on the proliferation of neural precursors in the forebrain. A-H, Photomicrographs show coronal sections processed for BrdU immunohistochemistry to point out recently divided cells in the subventricular zone (A, B), RMS (C,D), glomerular layer (Gl) of the olfactory bulb (E, F), and dentate gyrus of the hippocampus (G,H) obtained from two mice treated for 7 d with vehicle or L-NAME (90 mg/kg per day). cc, Corpus callosum; CPu, caudate-putamen; Epl, external plexiform layer; SGL, subgranular layer; LV, lateral ventricle. Scale bars: A-D, 100 μm; E, F, 50 μm; G, H, 150 μm.
Figure 5.
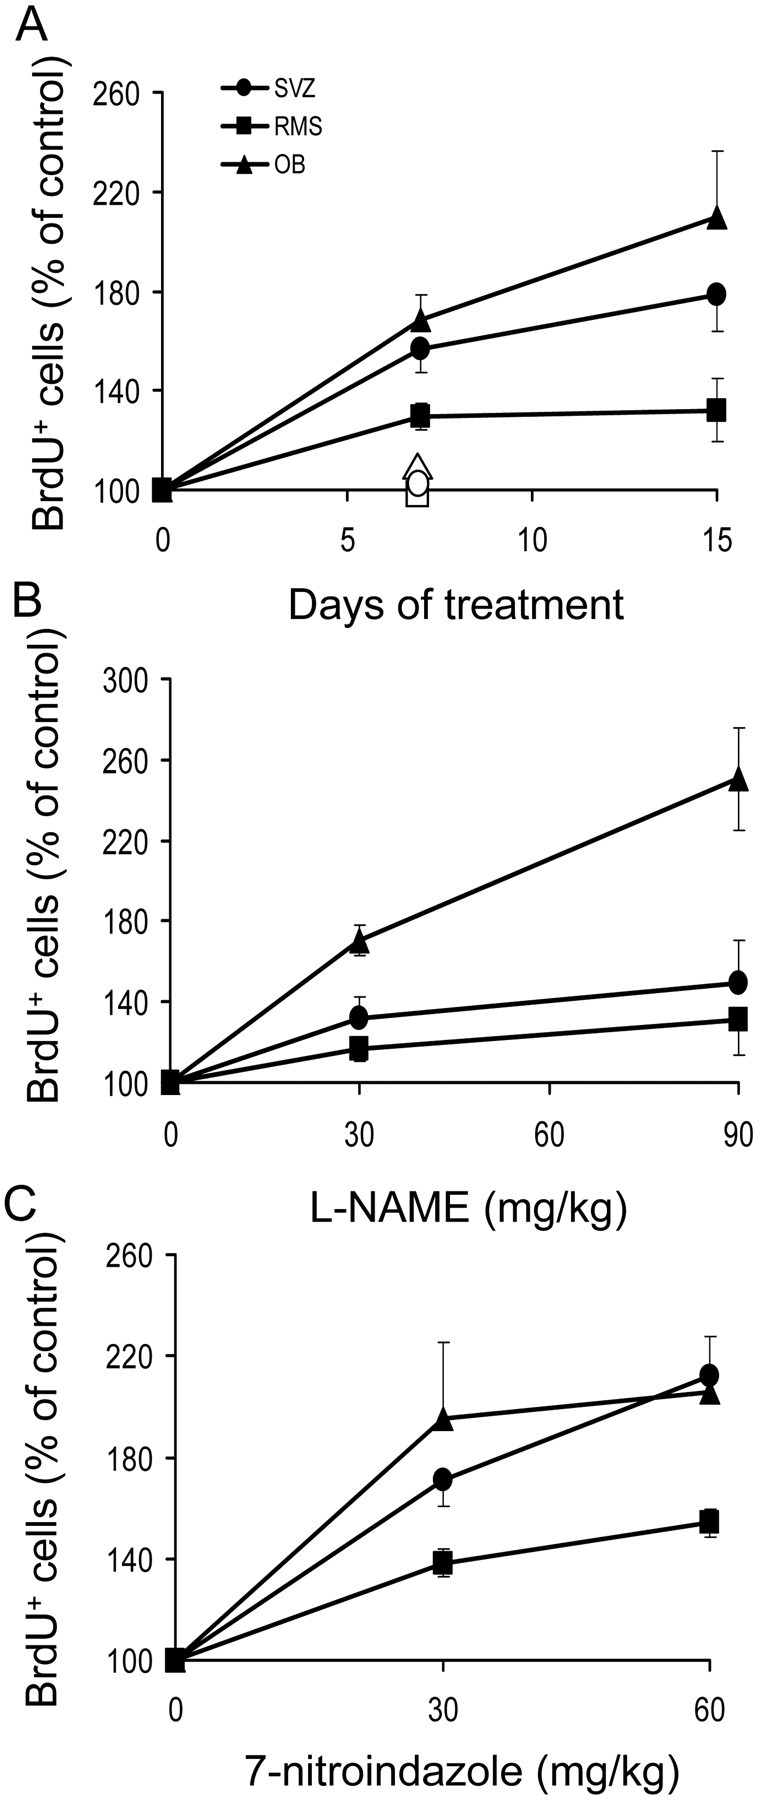
Quantitative effects of NO synthesis inhibition on neural precursor proliferation in the forebrain. A-C, Number of BrdU+ cells in the SVZ, RMS, and OB of mice treated with 90 mg/kg of L-NAME per day for 7 or 15 d (A), treated for 15 d with different doses of L-NAME (B), or receiving different doses of 7-NI for 4 d (C). The effects of D-NAME injections are shown with open symbols in A. After completion of the treatments, the animals were exposed to a 7.5 hr period of BrdU labeling. Results are expressed as a percentage of the values obtained in animals injected with vehicle and are presented as means ± SEM. At least four mice per group were used. All groups treated with L-NAME or 7-NI were significantly different from controls (p < 0.05; nonparametric Mann-Whitney U test).
Table 1.
Density of BrdU+ cells in control and treated mice
|
Treatment |
Subventricular zonea |
Rostral migratory streama |
Olfactory bulba |
|---|---|---|---|
| Vehicle (saline) | 36.2±2.9(14) | 101.9±4.9(14) | 0.32±0.02(14) |
| L-NAME | |||
| 7d, 90 mg/kg | 56.8±3.5*(5) | 132.0±5.2*(5) | 0.54±0.03*(5) |
| 15d, 90mg/kg | 59.9±4.8*(9) | 134.0±9.9*(10) | 0.67±0.07*(8) |
| 15d, 30mg/kg | 47.7±3.7*(5) | 118.5±6.0*(5) | 0.42±0.04*(5) |
| Vehicle (saline) | 31.8±2.8(4) | 98.3±6.4(4) | 0.25±0.01(3) |
| D-NAME | |||
| 7d, 90mg/kg | 33.8±3.4(4) | 93.9±1.9(4) | 0.28±0.02(4) |
| Vehicle (10%DMSO in propylene glycol) | 36.6±8.3(3) | 93.0±10.1(3) | 0.37±0.04(9) |
| 7-NI | |||
| 4d, 30mg/kg | 62.7±4.7*(3) | 129.2±4.9*(3) | 0.68±0.15*(6) |
| 4d,60mg/kg |
77.6±3.6*(3) |
143.1±6.0*(3) |
1.01±0.03*(7) |
aData are expressed as number of cells × 10−3/mm3. Mice received daily intraperitoneal injections of drugs for the indicated time periods and then received BrdU, as indicated in Materials and Methods. Data are presented as means ±SEM. The number of animals is shown in parenthesis. Values obtained from animals injected with vehicle are shown separately for each experimental group. *p≤0.05, compared with animals injected with vehicle.
To elucidate whether the effects of NOS inhibition on neurogenesis were structure specific, the number of cells undergoing mitosis was also evaluated in the DG of the hippocampus from the same animals (Fig. 4G,H). No changes were observed with any of the NOS inhibitors when BrdU+ cells were counted (L-NAME, 99.2 ± 6.3% of control, n = 3; 7-NI, 99.0 ± 21% of control, n = 5)
Programmed cell death
Because changes in precursor cell survival may contribute to the observed number of BrdU+ cells in L-NAME-treated mice, apoptosis was evaluated using the TUNEL technique in brain sections double stained with PSA-NCAM (Fig. 6). The density of apoptotic cells in the SVZ, RMS, and OB was similar in animals injected with vehicle, in those receiving one injection of L-NAME (90 mg/kg) 24 hr before perfusion, and in those injected daily for 7 or 15 d. The number of apoptotic cells per square millimeter in each case is presented in Table 2. Cells double labeled with TUNEL and PSA-NCAM constituted a minority (5-10%) of the total number of apoptotic cells in all cases.
Figure 6.

Example of the detection of apoptotic cells in the olfactory bulb. A, Coronal section of an adult mouse olfactory bulb stained with DAPI, showing the area (box) magnified in B-D. B-D, Nuclei stained with DAPI (B), apoptotic nucleus revealed by the TUNEL technique (C), and PSA-NCAM staining (D) in the same field. Arrows in B-D point to one cell undergoing apoptosis. Epl, External plexiform layer; Gl, glomerular layer. Scale bars: A, 100 μm; B-D, 10 μm.
Table 2.
Density of apoptotic cells in control and L-NAME-treated mice
|
|
Subventricular zone |
Rostral migratory stream |
Olfactory bulb |
||||||
|---|---|---|---|---|---|---|---|---|---|
| Treatment duration (d) |
Saline |
L-NAME |
Saline |
L-NAME |
Saline |
L-NAME |
|||
| 1 | 136 ± 18 | 102 ± 4 | 610 ± 111 | 505 ± 105 | 30 ± 4 | 27 ± 3 | |||
| 7 | 141 ± 8 | 142 ± 5 | 559 ± 42 | 551 ± 95 | 36 ± 2 | 31 ± 2 | |||
| 15 |
162 ± 2 |
161 ± 2 |
715 ± 64 |
673 ± 59 |
29 ± 2 |
31 ± 2 |
|||
Mice received daily intraperitoneal injections of L-NAME (90 mg/kg) for the indicated time periods, and their brain sections were used for detection of apoptotic cells by the TUNEL technique 24 hr after the last injection. Data are expressed as number of cells/mm3 and presented as means ± SEM. Three animals were used for each condition.
Characterization of dividing cells
The phenotype of newly generated BrdU+ cells was determined by double or triple labeling with specific markers in the SVZ and OB of part of the animals used for proliferation analysis. The results are shown in Table 3. Triple labeling for BrdU, the early neuron-specific protein βIII-tubulin, and the glial cell marker GFAP revealed that, as expected, the majority of recently divided cells in the SVZ was of neuronal lineage, whereas cells double labeled for BrdU and GFAP were found only occasionally (Table 3; Fig. 7I-K). In different brain sections, nestin, which is expressed by immature neural cells, was found to be present in ∼60 and 40% of the BrdU+ cells in the SVZ and OB, respectively. Chronic NOS inhibition resulted in an increase in the percentage of newborn cells expressing nestin, together with a decrease in those expressing βIII-tubulin in both the SVZ and OB (Table 3).
Table 3.
Effect of L-NAME on the frequency of phenotype-specific antigens in proliferating cells in the SVZ and OB
|
|
SVZ (percentage of BrdU+ cells) |
OB (percentage of BrdU+ cells) |
||||
|---|---|---|---|---|---|---|
|
|
Control |
L-NAME |
Control |
L-NAME |
||
| Nestin | 61.5 ± 2.5 | 83.7 ± 2.6* | 41.6 ± 2.4 | 54.8 ± 1.0* | ||
| βIII-tubulin | 64.0 ± 0.8 | 55.0 ± 3.8* | 51.9 ± 1.4 | 41.9 ± 1.1* | ||
| GFAP |
0.2 ± 0.1 |
0.3 ± 0.1 |
0.9 ± 0.2 |
0.7 ± 0.3 |
||
Mice received intraperitoneal injections of L-NAME (90 mg/kg per day) for 15 d and then received BrdU as indicated in Materials and Methods. Data are presented as means ± SEM (n = 3). *p≤0.05, compared with animals injected with vehicle.
Figure 7.
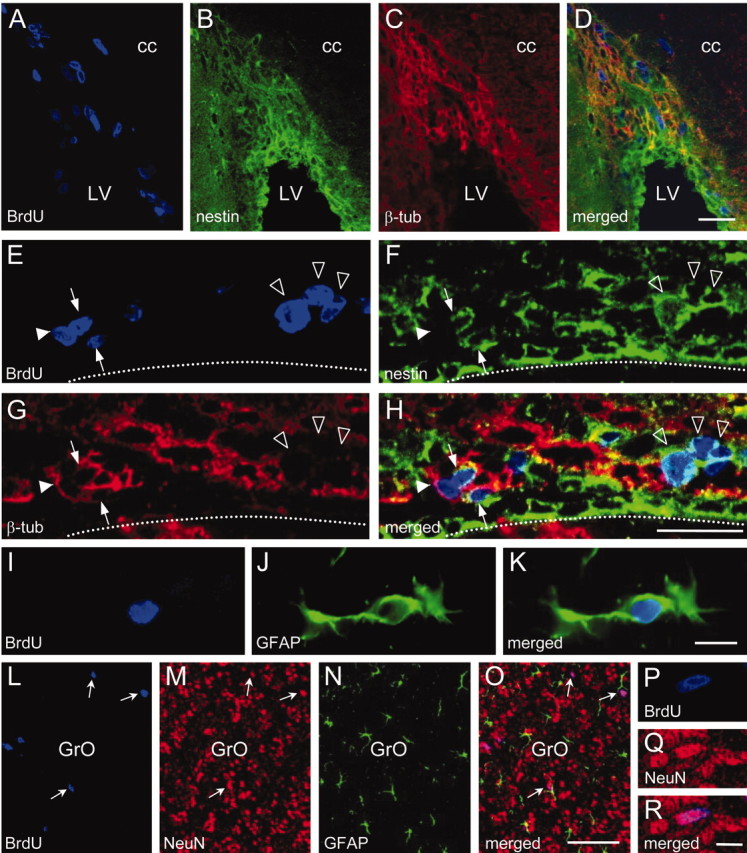
Characterization of BrdU+ cells in the subventricular zone and olfactory bulb. A-D, Confocal photomicrographs of a coronal section through the subventricular zone triple labeled for BrdU (A), the precursor marker nestin (B), and the young-neuron marker βIII-tubulin (β-tub) (C) obtained from an adult mouse treated with L-NAME (90 mg/kg per day) for 15 d and then injected with BrdU. The merged image is shown in D. E-H, High magnification confocal photomicrographs of a coronal section through the lateral wall of the lateral ventricle, showing recently divided cells expressing nestin (open arrowheads), β-tub (filled arrowhead), and double labeled for nestin and β-tub (arrows). The merged image is shown in H. The dotted line indicates the limits of the lateral ventricle. The section was obtained from the same mouse as in A. I-K, Epifluorescence photomicrographs showing a recently divided astrocyte (GFAP) located in the granular layer of a control mouse olfactory bulb. The merged image is shown in K. L-O, Confocal photomicrographs of a coronal section through the granule cell layer (GrO) of the olfactory bulb, triple labeled for BrdU, the mature-neuron marker NeuN, and the astrocytic marker GFAP from an adult mouse injected with BrdU and then treated with L-NAME (90 mg/kg per day) for 7 d. Some double-labeled neurons are indicated (arrows). P-R, High magnification confocal photomicrographs showing a newly formed neuron in the GrO (same mouse as in L). cc, Corpus callosum; LV, lateral ventricle. Scale bars: A-H, 25 μm; I-K, 10 μm; L-O, 50 μm; P-R, 5 μm.
To further investigate the cell subpopulation(s) that could be target(s) of endogenous NO, triple labeling was performed to allow the simultaneous visualization of BrdU, βIII-tubulin, and nestin in the SVZ and OB (Fig. 7A-H). Using this approach, three subpopulations were identified among the BrdU+ cells: cells presenting only nestin (nestin+/βIII-tubulin-), only βIII-tubulin (nestin-/βIII-tubulin+), or both (nestin+/βIII-tubulin+). Interestingly, as shown in Figure 8A, L-NAME produced a selective increase in the percentage of nestin+/βIII-tubulin- cells in both the SVZ and OB. In addition, a significant reduction in the percentage of the nestin-/βIII-tubulin+ subpopulation was observed in the SVZ but not in the OB. No significant changes in the percentage of nestin+/βIII-tubulin+ cells were observed in any case.
Figure 8.

Effect of NOS inhibition on the expression of nestin and βIII-tubulin (β-tub) by proliferating cells. A, B, Percentage (A) and density (B) of recently divided cells characterized as nestin+/βIII-tubulin-, nestin+/βIII-tubulin+, or nestin-/βIII-tubulin+ in the SVZ (left) and OB (right). Mice were treated for 15 d with 90 mg/kg of L-NAME per day (filled bars) or with vehicle (open bars) and then injected with BrdU as described in Figure 3. For each group of mice, a total of 1165 BrdU+ cells was analyzed in the SVZ and 714 in the OB. Data are expressed as means ± SEM (n = 3; *p < 0.05).
Values of the density of newborn cells expressing each marker combination in the SVZ and OB were obtained by multiplying the percentages of BrdU+ cells colabeled with βIII-tubulin, nestin, or both by the overall density of BrdU+ cells quantified in the corresponding region for each animal. The resulting data, presented in Figure 8B, revealed that in the SVZ, L-NAME treatment produced a fivefold increase in the density of newborn cells expressing nestin but not βIII-tubulin, no significant changes in the nestin+/βIII-tubulin+ subpopulation, and a significant reduction in the number of nestin-/βIII-tubulin+ cells. In the OB, chronic inhibition of NOS activity resulted in an enhancement in the density of the three cell types, although the largest effect was observed in the nestin+/βIII-tubulin- subpopulation with a 10-fold increase in cell number.
Cell survival and migration
In an attempt to determine whether endogenous NO could affect postmitotic cell survival and migration from the SVZ to the OB, adult mice first received BrdU and then daily injections of L-NAME (90 mg/kg) or vehicle for the following 7 or 15 d. At the end of the treatment period, the animals were killed and their brains were analyzed for BrdU immunohistochemistry. In this type of experiment, part of the initial labeling of the highly dividing precursor cells may disappear because of BrdU dilution in each mitotic cycle; however, terminal postmitotic cells ready to migrate or differentiate conserve their nuclear labeling and, therefore, their destination and fate can be followed (Lois and Alvarez-Buylla, 1994). The number of BrdU+ cells was counted in the SVZ, the RMS, the central part of the OB where cells arriving from the SVZ enter that structure before radial migration, and the granular and glomerular layers of the OB (Fig. 1D, frames). Figure 9, A-C, shows how the number of BrdU+ cells in the SVZ and RMS progressively decreased between 1 and 15 d after BrdU administration. In the central part of the OB, however, a large density of BrdU-labeled nuclei was observed 7 d after BrdU administration, followed by a dramatic reduction 1 week later when only a small number of labeled nuclei still remained in a paracentral position, whereas the others probably migrated radially toward the granular and glomerular layers (Fig. 9D-F). In the granular and glomerular layers of the OB, a progressive increase in BrdU+ cells was detected between days 1 and 15 after BrdU administration (Fig. 9G-I). Chronic L-NAME treatment did not produce significant changes in the density of BrdU+ cells in the analyzed regions, except for a small reduction in the SVZ cell number, 7 d after BrdU injections (Table 4).
Figure 9.
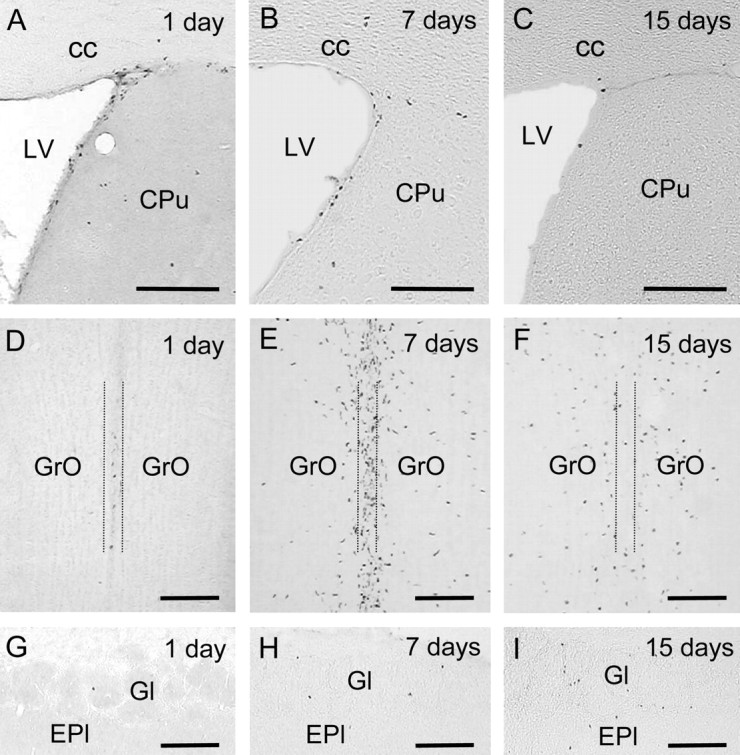
Anatomical distribution of BrdU+ nuclei at different times after BrdU administration in adult mice. A-I, BrdU immunohistochemistry in coronal sections through the subventricular zone (A-C) (∼0.38 mm rostral to bregma) and the central part (D-F) and glomerular area (G-I) of the olfactory bulb (∼4.28 mm rostral to bregma) from control mice perfused either the same day of BrdU administration (A,D,G), or 7 d (B,E,H) or 15 d (C,F,I) later. Note that the number of BrdU+ cells decreases with time in the subventricular zone, reaches a maximum at 7 d in the central part of the olfactory bulb (between the dotted lines), and increases with time in the granular (GrO) and glomerular (Gl) layers. cc, Corpus callosum; CPu, caudate-putamen; Epl, external plexiform layer; LV, lateral ventricle. Scale bars: A-C, G-I, 150 μm; D-F, 100 μm.
Table 4.
Effect of L-NAME on the anatomical distribution of postmitotic cells 1 and 2 weeks after BrdU administration
|
|
Subventricular zone |
Rostral migratory stream |
Central part of olfactory bulb |
Granular and glomerular layers of olfactory bulb |
||||||||
|---|---|---|---|---|---|---|---|---|---|---|---|---|
| Time after BrdU (d) |
Vehicle |
L-NAME |
Vehicle |
L-NAME |
Vehicle |
L-NAME |
Vehicle |
L-NAME |
||||
| 1a | 36.2 ± 2.9 (14) | 101.9 ± 4.9 (14) | 5.5 ± 0.9 (14) | 0.3 ± 0.0 (14) | ||||||||
| 7 | 18.7 ± 1.0 | 12.8 ± 0.9* | 24.9 ± 4.9 | 28.7 ± 5.8 | 266.8 ± 12.2 | 263.7 ± 43.5 | 1.7 ± 0.0 | 1.6 ± 0.2 | ||||
| 15 |
2.3 ± 0.2 |
2.6 ± 0.1 |
5.5 ± 0.8 |
5.9 ± 5.5 |
33.1 ± 2.8 |
26.0 ± 3.1 (2) |
2.3 ± 0.2 |
2.3 ± 0.1 |
||||
Mice were injected first with BrdU as indicated in Materials and Methods and then received L-NAME (90 mg/kg per day) or vehicle for the indicated time periods before they were killed. Data represent the number of BrdU+ cells × 10−3/mm3 and are expressed as means ± SEM (n = 3), except when shown in parenthesis. *p ≤ 0.05, compared with animals injected with vehicle.
Values obtained the same day of BrdU administration in animals that received a total of three injections and were killed 2.5 hr after the last BrdU injection. These data are the same as shown in Table 1 for the SVZ, RMS, and granular and glomerular layers of the OB.
Cell differentiation in the olfactory bulb
To study a possible effect of L-NAME on the differentiation of postmitotic cells, their phenotype was analyzed in the granular and glomerular layers of the OB from the same animals used for migration studies. Sections of the OB were immunostained for BrdU+, one neuron-specific marker, either βIII-tubulin or NeuN, and the astrocytic protein GFAP. Examples are shown in Figure 7, L-R, and quantitative data for the neuronal markers are presented in Figure 10. In control animals, the percentage of postmitotic cells labeled with the young-neuron antigen βIII-tubulin decreased with time between 7 and 15 d, probably as a consequence of cell maturation. During chronic NOS inhibition, the percentage of βIII-tubulin+ cells was not reduced with time, and the density of these cells slightly increased between 1 and 2 weeks (Fig. 10A,B, left). The mature-neuron marker NeuN was expressed by a similar percentage of cells at 7 and 15 d in control animals, resulting in a significant increase in the density of NeuN+ cells during the same time interval (Fig. 10A,B, right). In animals treated with L-NAME for 1 week, the density of postmitotic mature neurons in the OB was smaller than in control animals, although it reached a similar value 1 week later (Fig. 10B, right). In all cases, only occasional postmitotic cells contained GFAP, and no differences were observed between control and L-NAME-treated mice.
Figure 10.

Effect of NOS inhibition on the fate of newly generated cells in the granular and glomerular layers of the olfactory bulb. A, Percentages of BrdU+ cells that were positive for the neuronal markers βIII-tubulin (β-tub+; left) or NeuN (NeuN+; right) in control (○) and L-NAME-treated (•) mice. B, Density of postmitotic cells expressing βIII-tub (left) and NeuN (right) in the same animals. Mice were injected with BrdU and then treated with L-NAME or vehicle for the next 7 or 15 d. Data are expressed as means ± SEM (n = 3). At least 100 BrdU+ cells were analyzed per animal. *p < 0.05, as compared with mice injected with vehicle. #p < 0.05, as compared with values obtained 15 d after BrdU administration for the same condition.
Discussion
This work shows that physiologically produced NO reduces the number of cells undergoing proliferation in the adult mouse SVZ and OB, with a selective action on a specific cell subpopulation that expresses nestin but not neuronal- or glial-marker antigens. Endogenous NO primarily affects proliferation, because no alterations in survival or migration and only subtle effects in cell differentiation were observed during chronic NOS inhibition.
NOS inhibition enhanced neurogenesis in the mouse SVZ and OB
Chronic administration of two different NOS inhibitors, L-NAME and 7-NI but not of the inactive stereoisomer D-NAME, produced significant increases in the number of cells incorporating BrdU in the SVZ, RMS, and OB, with all doses used and at all of the time points tested. These results strongly suggest that endogenous NO downregulates neurogenesis in this system. Furthermore, the effectiveness of 7-NI, which is a selective inhibitor of nNOS in vivo (Kelly et al., 1995; Moore and Handy, 1997) and is devoid of the dramatic vascular effects of L-NAME, indicated that the NO involved in neurogenesis was of neuronal origin. The fact that the number of BrdU+ cells increased in the SVZ, but not in the DG, supports the idea that this is a rather specific and local effect and not the result of some general cerebral change derived from NO reduction.
The different response to NOS inhibition observed in the SVZ and DG may be explained by a different availability of endogenous NO in both regions. A previous report shows that 7-NI administration increases proliferation in the DG of rats 1 week after adrenalectomy (Park et al., 2001), when nNOS is overexpressed in the hippocampus (López-Figueroa et al., 1998), thus suggesting that, under normal conditions, neural precursors in this region are not exposed to effective NO concentrations. Alternatively, or in addition, it may occur that DG progenitors are less sensitive to NO action. In this sense, it is interesting that SVZ, but not DG, precursors increase their proliferation in response to EGF (Kuhn et al., 1997), the receptor of which is a possible molecular target of NO (see below).
The presence of nitrergic neurons and their varicose processes in the core of the SVZ (Moreno-López et al., 2000) provides a source of NO in close proximity with proliferating undifferentiated precursors and neuroblasts in this region. Together, both anatomical and functional findings suggest that nNOS-derived NO is a negative regulator of adult neurogenesis in physiological conditions in the SVZ.
Endogenous NO inhibited cell proliferation and did not affect apoptosis
The number of BrdU+ cells detected immediately after a short period of BrdU administration is generally considered a good index of cell proliferation. However, a possible influence of chronic NOS inhibition on apoptosis could modify the number of precursors ready to divide at the time of BrdU administration. Such a possibility is based on results obtained in cultured neurons, in which NO can either protect from (Ciani et al., 2002a,b) or induce apoptosis (Canals et al., 2001, 2003), depending on the culture conditions. Our results demonstrate that the number of cells dying at any given time point after L-NAME administration was not significantly different from those present in control animals, therefore ruling out any effect of endogenous NO on programmed cell death in the adult SVZ-OB. The possibility that the drug affected the proliferation of neuronal precursors is further supported by our previous findings that the addition of NO donors to cultured neuroblasts reduces the percentage of cells in the G2/M cell-cycle phase, as estimated by flow cytometry, but does not induce apoptosis (Murillo-Carretero et al., 2002). A cytostatic action of endogenously produced NO on neuronal precursors has also been elegantly demonstrated in the developing Xenopus brain (Peunova et al., 2001).
As opposed to the antiproliferative effect of nNOS-derived NO observed in adult animals (Park et al., 2001; our results), NO donor administration (Zhang et al., 2001) or iNOS-derived NO during ischemia (Zhu et al., 2003) have been reported to promote neurogenesis. Because in vitro studies demonstrate that NO is primarily a direct cytostatic agent in many cell types including neuroblasts (Garg and Hassid, 1990; Peunova and Enikolopov, 1995; Estrada et al., 1997; Sciorati et al., 1997; Nakaya et al., 2000; Murillo-Carretero et al., 2002), general increases in cerebral NO concentration, such as those derived from NO donor injections or iNOS induction, may promote neurogenesis by indirect mechanisms. In this sense, it is interesting that after stroke, NO stimulates the secretion of vascular endothelial growth factor (Zhang et al., 2003), which has been shown to induce neurogenesis both in vivo and in vitro (Jin et al., 2002).
Phenotypic characteristics of NO-sensitive cells
The cellular composition of the mouse SVZ has been carefully described by Doetsch et al. (1997). Rapidly dividing immature precursors, migrating neuroblasts, astrocytes, and ependymal cells were identified by their ultrastructural characteristics, and the study of different cell markers revealed the selective expression of βIII-tubulin in neuroblasts and GFAP in astrocytes. Nestin was reported to be present in many cell types, among which a subpopulation that did not express neuronal or glial cell markers and was considered by these authors as the undifferentiated precursor subpopulation, or type C cells. In our study, as expected, a large number of dividing cells expressed nestin, βIII-tubulin, or both, but only occasionally BrdU+ cells were positive for GFAP. In addition, some mitotic cells remained unidentified with the antigens used; they may be endothelial cells, or others. The effects of NOS inhibition in both the SVZ and OB were exerted primarily on the cell population expressing nestin but not βIII-tubulin, which may correspond to the type C cells identified by Doetsch et al. (1997) in the SVZ. The paucity of type C cells in the RMS (Doetsch et al., 1997) may be the reason why cell proliferation in this region was less affected after NOS inhibition. Our findings suggest that NO may physiologically control the size of the precursor population before these cells are committed toward a neuronal phenotype.
A variety of molecules are involved in the antiproliferative action of NO in different cell types (Lepoivre et al., 1994; Estrada et al., 1997; Sciorati et al., 1997; Nakaya et al., 2000). Among them, EGFR is a good candidate to be mediating the NO effects in the SVZ. It is well known that EGFR activation by EGF or transforming growth factor-α is essential for SVZ progenitor replication both in vivo and in vitro (Reynolds and Weiss, 1992; Craig et al., 1996; Kuhn et al., 1997; Tropepe et al., 1997). In vitro experiments have shown that neuroblastoma cells are most sensitive to the NO cytostatic action when grown in the presence of EGF and that NO directly inhibits the tyrosine kinase activity of the EGFR (Murillo-Carretero et al., 2002). Furthermore, Doetsch et al. (2002) recently reported that in the adult mouse SVZ, EGFR is selectively expressed in C cells, which, according to our results, are the cell targets of the NO antimitotic action.
Endogenous NO did not affect survival or migration of SVZ postmitotic cells but contributed to the differentiation of newly arrived neurons in the OB
The presence of nitrergic neurons in the proximity of neuroblast chains in the RMS and in the core of the OB (Moreno-López et al., 2000) suggests that NO might be implicated in cell migration in the adult brain, as reported during development (Tanaka et al., 1994; Contestabile, 2000). However, NOS inhibition did not modify the distribution of postmitotic cells at any time studied after BrdU injections. The small decrease in BrdU+ cell number found in the SVZ after 7 d of L-NAME administration was probably attributable to the accelerated dilution of BrdU because of the mitotic rate increase produced by the treatment. These results do not support a participation of endogenous NO on neither the migration properties of the recently generated cells nor their survival.
Seven and fifteen days after generation, a large number of cells abandoned the SVZ and arrived to the OB. Once in the final destination, these cells complete their maturation process, which results in the disappearance of the young-neuron marker βIII-tubulin and the progressive appearance of the mature-neuron marker NeuN (Cooper-Kuhn and Kuhn, 2002). Under NOS inhibition, the percentage of cells presenting the young-neuron marker remained stationary between 1 and 2 weeks, and there was a delay in the appearance of NeuN, suggesting that endogenous NO contributes to the maturation of neurons that recently arrived to the OB.
Concluding remarks
Together, the results indicate that endogenous NO, which is produced in the proximity of neuronal precursors in the SVZ, RMS, and OB, participates physiologically in the regulation of adult neurogenesis by exerting a negative control in the proliferation rate of undifferentiated precursors and by facilitating the neuronal differentiation process.
The role of the continuous arrival of newly formed neurons to the OB is not known, but it may be related to the process of learning new olfactory cues (Rochefort et al., 2002), which are of great importance in rodents. The function that we proposed for NO in the control of OB cell turnover allows the prediction that long-term modifications of NO production may result in abnormal olfactory-guided behaviors. Indeed, it has been reported that nNOS knock-out mice are aggressive and present abnormal sexual patterns (Nelson et al., 1995); they have severe alterations in two types of behaviors for which olfactory learning is crucial. The lack of adequate control of SVZ-OB neurogenesis in mice unable to produce neuronal NO may impair the acquisition of new olfactory cues and, therefore, contribute to the behavioral alterations described in these knock-out animals.
Footnotes
This work was supported by Fondo de Investigación Sanitaria Grant FIS00/1080 and Ministerio de Ciencia y Tecnología Grant SAF2002-02131. We thank Drs. Vallejo and Rodrigo for kindly providing the nestin and nNOS antibodies, respectively, and the Research Departments of the Hospital Ramón y Cajal (Madrid) and Hospital Universitario Virgen del Rocío (Sevilla) for allowing us to use their confocal microscopes during part of this study.
Correspondence should be addressed to Dr. Carmen Estrada, Área de Fisiología, Facultad de Medicina, Universidad de Cádiz, Plaza Fragela 9, 11003 Cádiz, Spain. E-mail: carmen.estrada@uca.es.
Copyright © 2004 Society for Neuroscience 0270-6474/04/240085-11$15.00/0
References
- Bredt DS, Snyder SH (1994) Transient nitric oxide synthase neurons in embryonic cerebral cortical plate, sensory ganglia and olfactory epithelium. Neuron 13: 301-313. [DOI] [PubMed] [Google Scholar]
- Bredt DS, Hawing PH, Snyder SH (1990) Localization of nitric oxide synthase indicating a neural role for nitric oxide. Nature 347: 768-770. [DOI] [PubMed] [Google Scholar]
- Cameron HA, McKay RDG (2001) Adult neurogenesis produces a large pool of new granule cells in the dentate gyrus. J Comp Neurol 435: 406-417. [DOI] [PubMed] [Google Scholar]
- Canals S, Casarejos MJ, Rodríguez-Martín E, de Bernardo S, Mena MA (2001) Neurotrophic and neurotoxic effects of nitric oxide on fetal midbrain cultures. J Neurochem 76: 56-68. [DOI] [PubMed] [Google Scholar]
- Canals S, Casarejos MJ, de Bernardo S, Rodríguez-Martín E, Mena MA (2003) Nitric oxide triggers the toxicity due to glutathion depletion in midbrain cultures through 12-lipoxigenase. J Biol Chem 278: 21542-21549. [DOI] [PubMed] [Google Scholar]
- Ciani E, Virgili M, Contestabile A (2002a) Akt pathway mediates a cGMP-dependent survival role of nitric oxide in cerebellar granule neurons. J Neurochem 81: 218-228. [DOI] [PubMed] [Google Scholar]
- Ciani E, Guidi S, Della Valle G, Perini G, Bartesaghi R, Contestabile A (2002b) Nitric oxide protects neuroblastoma cells from apoptosis induced by serum deprivation through cAMP-response element-binding protein (CREB) activation. J Biol Chem 277: 49896-49902. [DOI] [PubMed] [Google Scholar]
- Contestabile A (2000) Roles of NMDA receptor activity and nitric oxide production in brain development. Brain Res Brain Res Rev 32: 476-509. [DOI] [PubMed] [Google Scholar]
- Cooper-Kuhn CM, Kuhn HG (2002) Is it all DNA repair? Methodological considerations for detecting neurogenesis in the adult brain. Brain Res Dev Brain Res 134: 13-21. [DOI] [PubMed] [Google Scholar]
- Cornwell TL, Arnold E, Boerth NJ, Lincoln TM (1994) Inhibition of smooth muscle cell growth by nitric oxide and activation of cAMP-dependent protein kinase by cGMP. Am J Physiol 267: C1405-C1413. [DOI] [PubMed] [Google Scholar]
- Craig CG, Tropepe V, Morshead CM, Reynolds BA, Weiss S, van der Kooy D (1996) In vivo growth factor expansion of endogenous subependymal neural precursor cell populations in the adult mouse brain. J Neurosci 16: 2649-2658. [DOI] [PMC free article] [PubMed] [Google Scholar]
- Doetsch F, Alvarez-Buylla A (1996) Network of tangential pathways for neuronal migration in adult mammalian brain. Proc Natl Acad Sci USA 93: 14895-14900. [DOI] [PMC free article] [PubMed] [Google Scholar]
- Doetsch F, García-Verdugo JM, Alvarez-Buylla A (1997) Cellular composition and three-dimensional organization of the subventricular germinal zone in the adult mammalian brain. J Neurosci 17: 5046-5061. [DOI] [PMC free article] [PubMed] [Google Scholar]
- Doetsch F, Petreanu L, Caille I, García-Verdugo JM, Alvarez-Buylla A (2002) EGF converts transit-amplifying neurogenic precursors in the adult brain into multipotent stem cells. Neuron 36: 1021-1034. [DOI] [PubMed] [Google Scholar]
- Eriksson PS, Perfilieva E, Björk-Eriksson T, Alborn A-M, Nordborg C, Peterson DA, Gage FH (1998) Neurogenesis in the adult human hippocampus. Nat Med 4: 1313-1317. [DOI] [PubMed] [Google Scholar]
- Estrada C, de Felipe J (1998) Nitric oxide-producing neurons in the neocortex: morphological and functional relationship with intraparenchymal vasculature. Cereb Cortex 8: 193-203. [DOI] [PubMed] [Google Scholar]
- Estrada C, Mengual E, González C (1993) Local NADPH-diaphorase neurons innervate pial arteries and lie close or project to intracerebral blood vessels: a possible role for nitric oxide in the regulation of cerebral blood flow. J Cereb Blood Flow Metab 13: 978-984. [DOI] [PubMed] [Google Scholar]
- Estrada C, Gómez C, Martín-Nieto J, De Frutos T, Jiménez A, Villalobo A (1997) Nitric oxide reversibly inhibits the epidermal growth factor receptor tyrosine kinase. Biochem J 326: 369-376. [DOI] [PMC free article] [PubMed] [Google Scholar]
- Franklin KBJ, Paxinos G (1997) The mouse brain in stereotaxic coordinates. San Diego: Academic.
- Gage FH (2000) Mammalian neural stem cells. Science 287: 1433-1438. [DOI] [PubMed] [Google Scholar]
- Garg UC, Hassid A (1989) Nitric oxide-generating vasolidators and 8-bromo-cyclic guanosine monophosphate inhibit mitogenesis and proliferation of cultured rat vascular smooth muscle cells. J Clin Invest 83: 1774-1777. [DOI] [PMC free article] [PubMed] [Google Scholar]
- Garg UC, Hassid A (1990) Nitric oxide-generating vasodilators inhibit mitogenesis and proliferation of BALB/c 3T3 fibroblasts by a cyclic GMP-independent mechanism. Biochem Biophys Res Commun 171: 474-479. [DOI] [PubMed] [Google Scholar]
- Garthwaite J, Boulton CL (1995) Nitric oxide signaling in the nervous system. Annu Rev Physiol 57: 683-706. [DOI] [PubMed] [Google Scholar]
- Gritti A, Frölichsthal-Schoeller P, Galli R, Parati EA, Cova L, Pagano SE, Bjorson CR, Vescovi AL (1999) Epidermal and fibroblast growth factors behave as mitogenic regulators for a single multipotent stem cell-like population from the subventricular region of the adult mouse forebrain. J Neurosci 19: 3287-3297. [DOI] [PMC free article] [PubMed] [Google Scholar]
- Holscher C (1997) Nitric oxide, the enigmatic neuronal messenger: its role in synaptic plasticity. Trends Neurosci 20: 298-303. [DOI] [PubMed] [Google Scholar]
- Howard CV, Reed MG (1998) Unbiased stereology, pp 69-106. New York: Springer.
- Iadecola C (1993) Regulation of the cerebral microcirculation during neural activity: is nitric oxide the missing link? Trends Neurosci 16: 206-214. [DOI] [PubMed] [Google Scholar]
- Jin K, Zhu Y, Sun Y, Mao XO, Xie L, Greenberg DA (2002) Vascular endothelial growth factor (VEGF) stimulates neurogenesis in vitro and in vivo Proc Natl Acad Sci USA 99: 11946-11950. [DOI] [PMC free article] [PubMed] [Google Scholar]
- Keilhoff G, Seidel B, Noack H, Tischmeyer W, Stanek D, Wolf G (1996) Patterns of nitric oxide synthase at the messenger RNA and protein levels during early rat brain development. Neuroscience 75: 41193-41201. [DOI] [PubMed] [Google Scholar]
- Kelly PA, Ritchie IM, Arbuthnott GW (1995) Inhibition of neuronal nitric oxide synthase by 7-nitroindazole: effects upon local cerebral blood flow and glucose use in the rat. J Cereb Blood Flow Metab 15: 766-773. [DOI] [PubMed] [Google Scholar]
- Krege JH, Hodgin JB, Hagaman JR, Smithies O (1995) A noninvasive computerized tail-cuff system for measuring blood pressure in mice. Hypertension 25: 1111-1115. [DOI] [PubMed] [Google Scholar]
- Kuhn HG, Winkler J, Kempermann G, Thal LJ, Gage FH (1997) Epidermal growth factor and fibroblast growth factor-2 have different effects on neural progenitors in the adult rat brain. J Neurosci 17: 5820-5829. [DOI] [PMC free article] [PubMed] [Google Scholar]
- Kuzin B, Roberts I, Peunova N, Enikolopov G (1996) Nitric oxide regulates cell proliferation during Drosophila development. Cell 87: 639-649. [DOI] [PubMed] [Google Scholar]
- Lee MK, Rebhun LI, Frankfurter A (1990) Posttranslational modifications of class III beta-tubulin. Proc Natl Acad Sci USA 87: 7195-7199. [DOI] [PMC free article] [PubMed] [Google Scholar]
- Lendahl U, Zimmerman LB, McKay RDG (1990) CNS stem cells express a new class of intermediate filament protein. Cell 60: 585-595. [DOI] [PubMed] [Google Scholar]
- Lepoivre M, Flaman JM, Bobe P, Lemaire G, Henry Y (1994) Quenching of the tyrosyl free radical of ribonucleotide reductase by nitric oxide. Relationship to cytostasis induced in tumor cells by cytotoxic macrophages. J Biol Chem 269: 21891-21897. [PubMed] [Google Scholar]
- Lois C, Alvarez-Buylla A (1993) Proliferating subventricular zone cells in the adult mammalian forebrain can differentiate into neurons and glia. Proc Natl Acad Sci USA 90: 2074-2077. [DOI] [PMC free article] [PubMed] [Google Scholar]
- Lois C, Alvarez-Buylla A (1994) Long-distance neuronal migration in the adult mammalian brain. Science 264: 1145-1148. [DOI] [PubMed] [Google Scholar]
- López-Figueroa MO, Itoi K, Watson SJ (1998) Regulation of nitric oxide synthase messenger RNA expression in the rat hippocampus by glucocorticoids. Neuroscience 87: 439-446. [DOI] [PubMed] [Google Scholar]
- Moncada S, Palmer RM, Higgs EA (1991) Nitric oxide: physiology, pathophysiology, and pharmacology. Pharmacol Rev 43: 109-142. [PubMed] [Google Scholar]
- Moore PK, Handy RLC (1997) Selective inhibitors of neuronal nitric oxide synthase. Is no NOS really good NOS for the nervous system? Trends Pharmacol Sci 18: 204-211. [DOI] [PubMed] [Google Scholar]
- Moreno-López B, Escudero M, Delgado-García JM, Estrada C (1996) Nitric oxide production by brain stem neurons is required for normal performance of eye movements in alert animals. Neuron 17: 739-745. [DOI] [PubMed] [Google Scholar]
- Moreno-López B, Noval JA, González-Bonet L, Estrada C (2000) Morphological bases for a role of nitric oxide in adult neurogenesis. Brain Res 869: 244-250. [DOI] [PubMed] [Google Scholar]
- Morshead CM, Reynolds BA, Craig CG, McBurney MW, Staines WA, Morassutti D, Weiss S, van der Kooy D (1994) Neural stem cells in the adult mammalian forebrain. Neuron 13: 1071-1082. [DOI] [PubMed] [Google Scholar]
- Mullen RJ, Buck CR, Smith AM (1992) NeuN, a neuronal specific nuclear protein in vertebrates. Development 116: 201-211. [DOI] [PubMed] [Google Scholar]
- Murillo-Carretero M, Ruano MJ, Matarredona ER, Villalobo A, Estrada C (2002) Antiproliferative effect of nitric oxide on epidermal growth factor-responsive human neuroblastoma cells. J Neurochem 83: 119-131. [DOI] [PubMed] [Google Scholar]
- Nakaya N, Lowe SW, Taya Y, Chenchik A, Enikolopov G (2000) Specific pattern of p53 phosphorylation during nitric oxide-induced cell cycle arrest. Oncogene 19: 6369-6375. [DOI] [PubMed] [Google Scholar]
- Nelson RJ, Demas GE, Huang PL, Fishman MC, Dawson WL, Dawson TM, Snyder SH (1995) Behavioural abnormalities in male mice lacking neuronal nitric oxide synthase. Nature 378: 383-386. [DOI] [PubMed] [Google Scholar]
- Park C, Kang M, Kwon YK, Chung JH, Ahn H, Huh Y (2001) Inhibition of neuronal nitric oxide synthase enhances cell proliferation in the dentate gyrus of the adrenalectomized rat. Neurosci Lett 309: 9-12. [DOI] [PubMed] [Google Scholar]
- Petrov T, Page AB, Owen CR, Rafols JA (2000) Expression of the inducible nitric oxide synthase in distinct cellular types after traumatic brain injury: an in situ hybridization and immunocytochemical study. Acta Neuropathol (Berl) 100: 196-204. [DOI] [PubMed] [Google Scholar]
- Peunova N, Enikolopov G (1995) Nitric oxide triggers a switch to growth arrest during differentiation of neuronal cells. Nature 375: 68-73. [DOI] [PubMed] [Google Scholar]
- Peunova N, Scheinker V, Cline H, Enikolopov G (2001) Nitric oxide is an essential regulator of cell proliferation in Xenopus brain. J Neurosci 21: 8809-8818. [DOI] [PMC free article] [PubMed] [Google Scholar]
- Rao VL, Dogan A, Bowen KK, Dempsey RJ (1999) Traumatic injury to rat brain upregulates neuronal nitric oxide synthase expression and L-[3H]nitroarginine binding. J Neurotrauma 16: 865-877. [DOI] [PubMed] [Google Scholar]
- Reynolds BA, Weiss S (1992) Generation of neurons and astrocytes from isolated cells of the adult mammalian central nervous system. Science 255: 1707-1710. [DOI] [PubMed] [Google Scholar]
- Rochefort C, Gheusi G, Vincent J-D, Lledo P-M (2002) Enriched odor exposure increases the number of newborn neurons in the adult olfactory bulb and improves odor memory. J Neurosci 22: 2679-2689. [DOI] [PMC free article] [PubMed] [Google Scholar]
- Rodrigo J, Springall DR, Uttenthal O, Bentura ML, Abadia-Molina F, Riveros-Moreno V, Martínez-Murillo R, Polak JM, Moncada S (1994) Localization of nitric oxide synthase in the adult rat brain. Philos Trans R Soc Lond B Biol Sci 345: 175-221. [DOI] [PubMed] [Google Scholar]
- Salter M, Duffy C, Garthwaite J, Strijbos PJLM (1995) Substantial regional and hemispheric differences in brain nitric oxide synthase (NOS) inhibition following intracerebroventricular administration of Nω-nitro-l-arginine (L-NA) and its methyl ester (L-NAME). Neuropharmacology 34: 639-649. [DOI] [PubMed] [Google Scholar]
- Santacana M, Uttenthal LO, Bentura ML, Fernández AP, Serrano J, Martinez de Velasco J, Alonso D, Martinez-Murillo R, Rodrigo J (1998) Expression of neuronal nitric oxide synthase during embryonic development of the rat cerebral cortex. Brain Res Dev Brain Res 111: 205-222. [DOI] [PubMed] [Google Scholar]
- Sciorati C, Nistico G, Meldolesi J, Clementi E (1997) Nitric oxide effects on cell growth: GMP-dependent stimulation of the AP-1 transcription complex and cyclic GMP-independent slowing of cell cycling. Br J Pharmacol 122: 687-697. [DOI] [PMC free article] [PubMed] [Google Scholar]
- Tanaka M, Yoshida S, Yano M, Hanaoka F (1994) Roles of endogenous nitric oxide in cerebellar cortical development in slice cultures. NeuroReport 5: 2049-2052. [DOI] [PubMed] [Google Scholar]
- Tropepe V, Craig CG, Morshead CM, van der Kooy D (1997) Transforming growth factor-alpha null and senescent mice show decreased neural progenitor cell proliferation in the forebrain subependyma. J Neurosci 17: 7850-7859. [DOI] [PMC free article] [PubMed] [Google Scholar]
- Yoshida T, Limmroth V, Irikura K, Moskowitz MA (1994) The NOS inhibitor, 7-nitroindazole, decreases focal infarct volume but not the response to topical acetylcholine in pial vessels. J Cereb Blood Flow Metab 14: 924-929. [DOI] [PubMed] [Google Scholar]
- Zhang R, Zhang L, Zhan ZY, Lu M, LaPointe M, Chopp M (2001) A nitric oxide donor induces neurogenesis and reduces functional deficits after stroke in rats. Ann Neurol 50: 602-611. [DOI] [PubMed] [Google Scholar]
- Zhang R, Wang L, Zhang L, Cheng J, Zhu Z, Zhang Z, Chopp M (2003) Nitric oxide enhances angiogenesis via the synthesis of vascular endothelial growth factor and cGMP after stroke in the rat. Circ Res 92: 308-313. [DOI] [PubMed] [Google Scholar]
- Zhu DY, Liu SH, Sun HS, Lu YM (2003) Expression of inducible nitric oxide synthase after focal cerebral ischemia stimulates neurogenesis in the adult rodent dentate gyrus. J Neurosci 23: 223-229. [DOI] [PMC free article] [PubMed] [Google Scholar]