

Abstract
Mutations in the genes encoding the CNGA3 and CNGB3 subunits of the cyclic nucleotide-gated (CNG) channel of cone photoreceptors have been associated with autosomal recessive achromatopsia. Here we analyze the molecular basis of achromatopsia in two siblings with residual cone function. Psychophysical and electroretinographic analyses show that the light sensitivity of the cone system is lowered, and the signal transfer from cones to secondary neurons is perturbed. Both siblings carry two mutant CNGA3 alleles that give rise to channel subunits with different single-amino acid substitutions. Heterologous expression revealed that only one mutant forms functional channels, albeit with grossly altered properties, including changes in Ca2+ blockage and permeation. Surprisingly, coexpression of this mutant subunit with CNGB3 rescues the channel phenotype, except for the Ca2+ interaction. We argue that these alterations are responsible for the perturbations in light sensitivity and synaptic transmission.
Keywords: CNG channel, cone photoreceptor, CNGA3 gene, CNGB3 gene, vision, Ca2+permeation
Introduction
Achromatopsia is an autosomal recessive disorder, characterized by the total loss of color discrimination, photophobia, nystagmus, and severely reduced visual acuity (Sharpe and Nordby, 1990; Sharpe et al., 1999). Recent molecular genetic analyses have led to the identification of mutations in CNGA3, CNGB3, and GNAT2 that are associated with achromatopsia (Kohl et al., 1998).
All three genes encode key components of the phototransduction cascade in cone photoreceptors. GNAT2 encodes the α subunit of the G-protein transducin that is activated by the cone rhodopsins; CNGA3 and CNGB3 encode the subunits A3 and B3 (Bönigk et al., 1993; Kohl et al., 2000; Sundin et al., 2000; Wissinger et al., 2001) of the cyclic nucleotide-gated (CNG) channel that mediates the light response in cones (Yu et al., 1996; Wissinger et al., 1997; Gerstner et al., 2000).
Apart from complete forms of achromatopsia, several cases of incomplete achromatopsia have been described that are characterized by a residual ability to discriminate colors (Jäger, 1953; Goodman et al., 1963; Pokorny et al., 1979, 1982). The molecular basis of incomplete achromatopsia is, for the most part, unknown. Recently, mutations in the CNGA3 gene have been identified in a few patients with incomplete achromatopsia (Wissinger et al., 2001). Because those patients retain some cone function, we reasoned that mutant alleles encode functional channel subunits that alter the human cone visual pathway in characteristic ways.
Here we present a combined genetic, clinical, and electrophysiological approach to study a form of incomplete achromatopsia in two sisters who carry two heterozygous CNGA3 mutations. One mutation leads to a substitution of Thr to Arg in the S2-S3 linker (A3T224R); the other mutation leads to a substitution of Thr to Ser in the pore region (A3T369S) (Wissinger et al., 2001). On in vitro expression, only A3T369S forms functional channels that display altered ion permeation, gating, ligand sensitivity, and low apparent affinity for extracellular Ca2+. Surprisingly, coexpression of A3T369S with CNGB3 (B3) rescued most of the aberrant properties except for the lower Ca2+ affinity. The lower Ca2+ affinity is expected to perturb cone function in terms of light sensitivity and synaptic transmission, consistent with the sisters' visual deficits.
Materials and Methods
Subjects. All subjects provided informed consent to participate in the study. The compound heterozygotes, AH and NH, were 13 and 17 years of age, respectively, at the time of testing. The five control subjects (24-38 years of age) had normal, trichromatic color vision.
Molecular genetic analysis. Exons and flanking intron sequences of the CNGA3 and the CNGB3 genes were amplified by PCR from total genomic DNA (Kohl et al., 1998). PCR products were purified by Centricon-100 ultrafiltration (Amicon, Bedford, MA) and subjected to DNA sequencing with the use of the AmpliTaq FS dye terminator technique (Applied Biosystems, Weiterstadt, Germany). Sequences were separated on an ABI 377 DNA sequencer (Applied Biosystems), analyzed manually and independently by two experimenters, and assembled with SeqMan software (DNASTAR, Madison, WI).
Segregation analysis and exclusion of the mutations T224R and T369S in 100 control subjects (200 chromosomes) was performed by restriction fragment length polymorphism (RFLP) analysis of PCR-amplified fragments, including all available family members. In the RFLP assays, the presence of the respective mutations was assessed by the gain of an MnlI restriction site for 671C > G (T224R) and the gain of a BanII restriction site for 1106C > G (T369S).
Psychophysical and electroretinographic measurements. The cone contrast thresholds were measured on a red-green-blue (RGB) color monitor (19 inch Iiyama Trinitron) at a viewing distance of 2.5 m using a four-alternative forced choice staircase procedure (parameter estimation by sequential testing). The subject's task was to identify the orientation of a Landolt C figure, which was embedded in a neutral gray background [0.31 and 0.33 in Commission Internationale d'Eclairage (CIE) 1931 x and y chromaticity coordinates, respectively]. The color of the figure was varied along one of the cone isolation axes in the Judd-corrected CIE 1931 chromaticity diagram to selectively stimulate the long-wavelength-sensitive (L), middle-wavelength-sensitive (M), or short-wavelength-sensitive (S) cones or a combination of all three. The figure and the background were composed of circles varying randomly in position and luminance in six steps between 8 and 16 cd/m2 (mean luminance, 12 cd/m2) so that the orientation of the gap in the Landolt C figure could only be detected on the basis of cone contrast information. The thresholds for L, M, and S cones and for the various combinations were determined simultaneously by interleaved, independent staircases.
The threshold-versus-intensity (TVI) functions were measured in a Maxwellian view under conditions that isolate the L and M cones and suppress rod function. The subject was first dark-adapted for 30 min. A 628 nm target (2° in diameter) was superimposed on a 502 nm background (13° in diameter). It was presented once a second for 50 msec as a square-wave light pulse. A psychophysical adjustment procedure was used to determine the quantal absorptions required to detect the target at each background intensity. At each background intensity, the threshold was measured at least twice and averaged. The background intensity was increased in steps of 0.25 log units over a range of 7 log units. At each new intensity level, the subject was light-adapted for 30 sec. The subject's position in the Maxwellian view was maintained by a dental wax impression of the subject's teeth mounted on a machine tool rest and was monitored by infrared imaging of the position of the pupil relative to the aperture images of the target and background lights.
The fast cone flicker ERG was recorded binocularly with Dawson-Trick-Litzkow (DTL) electrodes inserted above the margin of the lower lid and referenced to the outer canthus, using an LKC Technology UTAS-A2000 Ganzfeld display. The recordings were made according to the International Society for Clinical Electrophysiology of Vision recommendations. The test flash originated from a xenon flash discharge tube, and the 86 cd/m2 background originated from a 24 V, 80 W halogen lamp. Before beginning the ERG recordings, the subject's pupils were dilated with 0.5% tropicamide (Mydriaticum; Hoffmann-La Roche, Basel, Switzerland), and the subject's eyes were dark-adapted for 30 min. ERG recordings in the presence of background were started 10 min after onset of the adapting field. Flash luminance was increased in steps of 0.2 log units by removing calibrated neutral-density filters (Wratten; Eastman Kodak Co., Rochester, NY). The amplitudes and phases of the response were determined in the frequency domain of the stimulus frequency (31.25 Hz) using a fast Fourier analysis.
The L cone-driven multifocal ERG (mfERG) response was recorded using DTL electrodes after the subject's pupils were dilated with 0.5% tropicamide. The stimulus consisted of 103 hexagonal elements and was generated on a flat-screen Sony Trinitron monitor. It subtended 84 × 75° of visual angle at a viewing distance of 18 cm. The cone-isolating stimuli were calculated from the emission spectra of the three phosphors (measured with a CAS 140 spectroradiometer; Instrument Systems, Munich, Germany) and the cone fundamentals of Stockman et al. (1999) and Stockman and Sharpe (2000), determined for 10° and larger viewing conditions. A maximum cone contrast of 47% was obtained for the L cone-isolating stimuli. The L cone-isolating condition was chosen because of the predominant occurrence of L cones and the small residual rod contrast of the stimulus. The rod system contribution to the mfERG was additionally suppressed by the bright, rapidly alternating stimulus and by maintaining the ambient luminance at 150 cd/m2. The mfERG stimulation and data collection were performed by Veris system software (version 3.0.1) from Electro-Diagnostic Imaging, Inc. (for details, see Albrecht et al., 2002).
Heterologous expression of CNG channels. Full-length cDNAs of wild-type (wt) CNGA3 and CNGB3 were constructed from overlapping cDNA and rapid amplification of cDNA end fragments and cloned into the vector pcDNA3.1/Zeo(+) or pcDNA3.1/Neo(+), respectively (Invitrogen, Carlsbad, CA). Mutants were generated using the QuickChange site-directed mutagenesis kit (Stratagene, La Jolla, CA). All inserts were sequenced to verify correct orientation and sequence. The constructs were expressed in human embryonic kidney 293 (HEK293) cells. Cells were grown at 37°C (with 5% CO2) in minimal essential medium (41090; Invitrogen) supplemented with 10% fetal calf serum, 1% nonessential amino acids, and 1% antibiotic-antimycotic solution. Cells were transfected for 20-22 hr by Ca2+ phosphate coprecipitation, transferred to poly-l-lysine-coated coverslips, and treated with 3 mm Na+ butyrate for 24-48 hr.
Immunocytochemistry. Transfected cells were fixed in 0.1 m phosphate buffer (PB), pH 7.4, containing 4% paraformaldehyde for 15 min. Fixed cells were preincubated with 10% normal goat serum (NGS) and 0.5% Triton X-100 in PB for 30 min, followed by incubation for 1 hr with antiserum against the human CNGA3 polypeptide (FPc46, diluted 1:250), washed in PB, and incubated with anti-rabbit HRP (Amersham Biosciences, Arlington Heights, IL; diluted 1:100 in 5% NGS and 0.5% Triton X-100 in PB). After several rinses in PB, antibodies were visualized using diaminobenzidine (0.05% DAB and 0.01% H2O2 in PB).
Electrophysiology. Ligand sensitivity was determined with the patch-clamp technique in inside-out patches of HEK293 cell membranes as described (Bönigk et al., 1999). Macroscopic currents were recorded under symmetric ionic conditions (in mm): 100 KCl, 10 HEPES, 10 EGTA, and 24.5 KOH, pH 7.4. Cyclic nucleotides and dithiothreitol were added to this solution as mentioned. Macroscopic currents were low-pass-filtered (3 kHz) and digitized at 20 kHz. Leak currents recorded in the absence of ligand were subtracted from currents in the presence of ligand.
The single-channel currents were recorded with a filter frequency of 5 kHz and a sample frequency of 48 kHz. For analysis, the data were filtered at 1-5 kHz (eight-pole Bessel filter) and digitized at 10-12.5 kHz. Single-channel currents were determined by fitting the sum of two to four Gaussian functions to the all-points histogram of recordings of the respective channels. Recordings were at least 4 sec in duration.
The blockage by extracellular Ca2+ was studied in outside-out patches similarly as described (Seifert et al., 1999). The pipette and bath solution contained (in mm): 105 KCl, 45 KOH, 10 HEPES, and 10 nitrilotriacetic acid (NTA), pH 7.4 (HCl). The free [Ca2+] in the bath was adjusted by adding CaCl2 and using the association constants from (Martell and Smith, 1974). Free [Ca2+] was measured with a Ca2+-sensitive electrode (KwikCal; WPI). The electrode was calibrated with Ca2+ buffers with a defined free Ca2+ concentration (Calbuf-1; WPI). Channels were activated with 1.5 mm cGMP. The leak current (Ileak) was estimated at the expected reversal potential of -40 mV by using the following solution (in mm): 118.7 N-methyl-d-glucamine, 31.3 KCl, 10 HEPES, and 10 NTA, pH 7.4 (HCl). Only patches that showed a Ileak of <20% of Itotal were considered for analysis. The blockage by extracellular Mg2+ was measured using a solution containing (in mm): 105 KCl, 45 KOH, 10 HEPES, and 10 EGTA, pH 7.4 (HCl). The free [Mg2+] was adjusted by adding MgCl2.
Occasionally, on coexpression of A and B subunits, mixed channel populations of homomeric and heteromeric channels were produced. The contribution of homomeric channels to the macroscopic current was estimated by two different methods. First, cAMP, unlike cGMP, is only a partial agonist that does not fully activate CNG channels of rods and cones (Tanaka et al., 1989; Altenhofen et al., 1991; Gordon and Zagotta, 1995; Zong et al., 1998; Gerstner et al., 2000). The activation by cAMP relative to that by cGMP differs between homomeric A3 and heteromeric A3/B3 channels (Gerstner et al., 2000). Saturating concentrations of cAMP (10 mm) elicit, on average, 17% of the maximal cGMP-activated current in A3 but 47% in A3/B3 channels (+80 mV). The difference in relative activation is even more pronounced for mutant channels: 4% in homomeric A3T369S channels compared with 59% in heteromeric A3T369S/B3 channels (data not shown). Therefore, relative cAMP activation is a useful measure for the homogeneity of a channel population. Second, heteromeric channels are more sensitive to the blockage by l-cis-diltiazem (Chen et al., 1993; Körschen et al., 1995; Gerstner et al., 2000). For A3/B3 channels, the voltage-dependent block by 10 μm l-cis-diltiazem was approximately half-maximal at +40 mV [blockage (mean ± SD), 50 ± 8%; N = 6; data not shown), whereas homomeric A3 channels were blocked under identical conditions only by 4 ± 1% (N = 7). l-cis-Diltiazem was not suitable to discriminate between A3T369S and A3T369S/B3 mutant channels because of a large across-patch variability of blockage in heteromeric A3T369S/B3 channels. For example, membrane patches from cells coexpressing A3T369S and B3 with relative cAMP activation of >50% exhibited blockages between 1 and 30% (+40 mV, 10 μm l-cis-diltiazem).
Results
Genetic analysis
Two sisters (AH and NH, family CHRO21) were diagnosed as incomplete achromats and genetically analyzed (Wissinger et al., 1998, 2001). Genotyping of markers closely linked to the ACHM2/CNGA3 locus revealed a segregation pattern consistent with linkage to this locus. In the CNGA3 gene in subject NH, two heterozygous C-to-G transversions were identified at nucleotide (nt) position 671 in exon 6 and nt 1106 in exon 7 (numeration according to GenBank entry AF065314). The transversions result in amino acid substitutions T224R and T369S, respectively. Residue Thr-224 is located in the intracellular loop between transmembrane segments S2 and S3; residue Thr-369 is located in the pore region (Fig. 1A). The transversions create additional restriction sites for MnlI (at nt 671) and BanII (at nt 1106), allowing the detection of the mutant alleles by RFLP (Fig. 1B). Segregation analysis using RFLP revealed independent inheritance of T224R and T369S. The affected siblings are compound heterozygous for the T224R and T369S mutations, whereas their parents carry either T224R (the father) or T369S (the mother) (Fig. 1C). Both mutations were excluded in 100 control subjects (200 chromosomes) and were also absent in any other patient with complete or incomplete achromatopsia. In addition, the father carries on his nontransmitted CNGA3 allele a C-to-T transition at nt 458, resulting in the substitution T153M (Fig. 1A). Because this mutation was also detected in controls, and because the father has no visual complaints, T153M probably represents a polymorphism.
Figure 1.
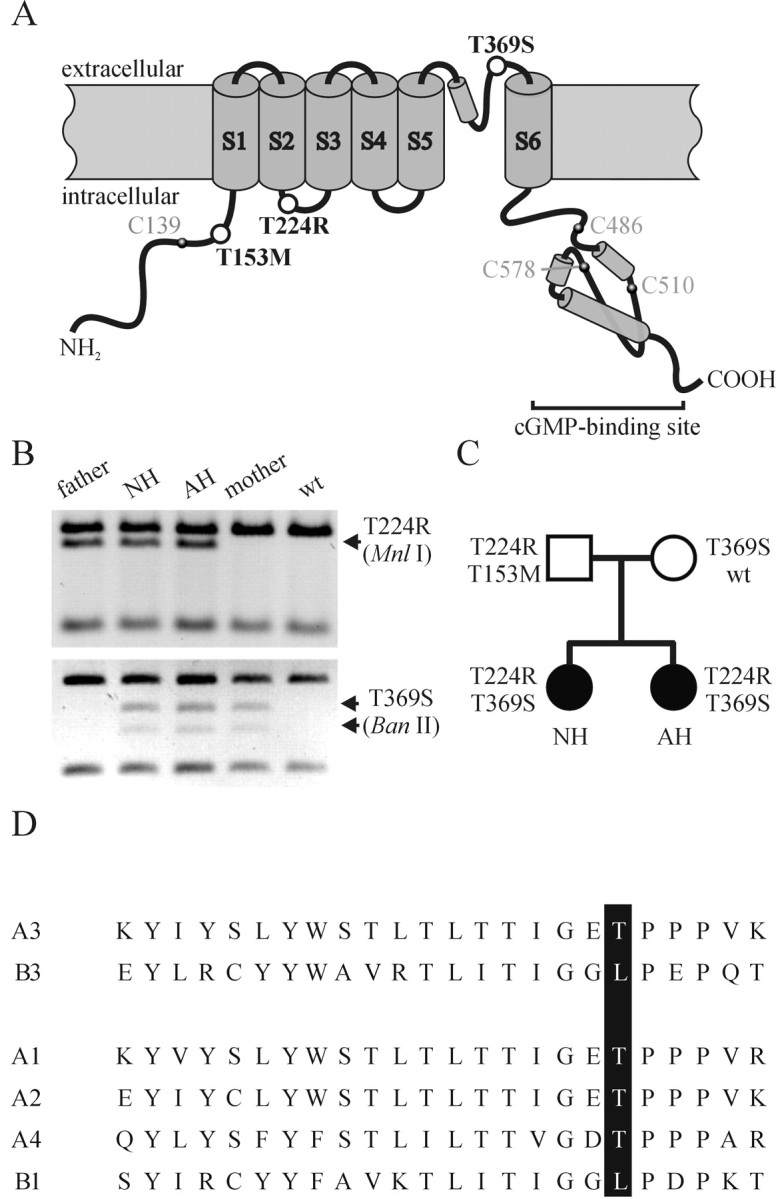
Molecular genetic analysis. A, Topology of CNGA3 with six transmembrane domains, the pore region, and the intracellular cGMP-binding site. The positions of the three mutations are indicated by open circles. The location of intracellular Cys residues that might be involved in redox reactions are indicated by filled circles. B, RFLP-based segregation analysis of CNGA3 mutations in family CHRO21. Restriction patterns are shown with MnlI for the detection of 671C>G (T224R) in exon 6 and BanII for the detection of 1106C> G(T369S) in exon 7. Arrows indicate bands that differ between wt and mutant alleles. C, Segregation of wt and mutant CNGA3 alleles in family CHRO21. Subjects AH and NH (filled circles) are incomplete achromats, whereas their parents (open square, father; open circle, mother) are without visual complaints. D, Pore region alignment for human CNGA1 (A1), CNGA2 (A2), CNGA3 (A3), CNGA4 (A4), CNGB1 (B1), and CNGB3 (B3). Amino acids corresponding to Thr-369 in A3 are shown with a black background.
We also sequenced all coding exons and flanking intron sequences of the CNGB3 gene in AH and NH and only found a single heterozygous polymorphism in intron 1 present in both siblings.
Psychophysical and electroretinographic characterization
AH and NH have photophobia but only occasionally exhibit the pendular nystagmus that is typical for complete achromats. The visual acuity of AH and NH was 0.3-0.5 (with spectacles) and 0.4-0.6 (with contact lenses), respectively. These values are intermediate between those of normal subjects (∼1.0) and complete achromats (≤0.2). AH performed well on the Farnsworth panel D-15 test, producing either no error (saturated version) or a single error (desaturated version). Her anomalous quotient (Rayleigh red-green equation) on the Nagel type I anomaloscope was 0.67 (slightly protanomalous, indicating a slight weakness or alteration in L cone function). NH performed weaker on both versions of the panel D-15 test, with a strong tendency to make confusions along the tritan axis (indicating a weakness in S cone function; see below). Her anomalous quotient on the Nagel type I anomaloscope was 0.40 (more strongly protanomalous than that of AH).
Specific tests of color discrimination and light sensitivity provided a more precise description of residual cone function. Color discrimination was analyzed using a cone contrast sensitivity test, designed to probe independently L, M, and S cone function. This test revealed that both sisters have reduced sensitivity along all three cone excitation axes, indicated as protan (L cone), deutan (M cone), and tritan (S cone) (Fig. 2A). AH's sensitivity is reduced for all colors by about the same extent. NH's sensitivity is similar to that of AH along the deutan and protan axes but is significantly poorer along the tritan axis, consistent with her performance on the panel D-15 test. In fact, in the cone contrast sensitivity test, NH was unable to see green and yellow along the tritan axis.
Figure 2.

Psychophysical analysis. A, Cone contrast thresholds plotted in the CIE 1931 chromaticity diagram. The continuous lines indicate the x and y chromaticity coordinates of saturated colors; the triangle (dashed line) includes all colors that can be displayed on the RGB color monitor. The dotted lines labeled Protan, Deutan, and Tritan refer to the cone excitation axes of the L, M, and S cones, respectively. They intersect at the point of neutral background chromaticity. Average cone contrast thresholds, measured for the right eye, are shown for subjects NH (filled squares) and AH (open squares). Similar results were obtained for the respective left eyes. Cone contrast thresholds of four normal subjects (measured for the right eye) were fitted by the ellipse (centered near the intersecting axes) using a least squares fit algorithm. B, Cone TVI functions. Incremental thresholds for a 628 nm target, flashed once every 1 sec for 50 msec, were measured as a function of the quantal flux density of a 502 nm background. The thresholds of NH (filled squares), AH (open squares), and four normal subjects (filled circles, representing mean ± SD) were measured in the respective right eyes.
Light sensitivity of the cone system was analyzed using TVI experiments (Fig. 2B) (Sharpe et al., 1989). Compared with normal subjects, both sisters displayed elevated cone thresholds (i.e., decreased light sensitivity), irrespective of their cones being in the dark-adapted state (absolute cone threshold) or in the light-adapted state. Although both sisters displayed decreased light sensitivity, their cones switched from the dark-adapted to the light-adapted state at approximately the same background intensities as do those of normal subjects (107-108 quanta · s-1 · °-2). Threshold values of NH increased with background intensities similarly to those of normal subjects, whereas threshold values of AH increased faster. AH felt uncomfortable at the highest background intensities because of photophobia; therefore, no measurements were made at >1010.5 quanta · s-1 · °-2.
Cone flicker ERG recordings revealed that the response amplitude in both sisters saturates at lower flash luminance values than that of normal subjects (Fig. 3A). The response amplitude in AH seems to be normal at low flash luminance, whereas in NH, it is smaller. In normal subjects as well as in both sisters, when a moderately intense Ganzfeld background (86 cd/m2) is present, the response-flash luminance relation is shifted to higher flash luminance values with larger maximal response amplitudes (Fig. 3A, right). An increase of the response amplitude in the presence of an adapting field has been described previously (Gouras and MacKay, 1989; Peachey et al., 1992). Notably, the phase between the flickering target presentation and the response was strongly shifted in both sisters, indicating an increased response delay (Fig. 3B). Unlike in normal subjects, the responses of AH and NH did not accelerate with flash luminance.
Figure 3.

ERG recordings. A, B, Fast cone flicker ERG recordings. A, Response amplitude as a function of flash luminance for a Ganzfeld flickering (31.25 Hz) stimulus presented in the dark (left) or on a background (86 cd/m2; right). Data points represent values measured in either the right or the left eye of NH (filled squares) and AH (open squares) or values measured in the right eyes of five normal subjects (filled circles, representing mean ± SD). Data of AH and NH (averaged over both eyes) and mean data of normal subjects have been fitted with the equation A = Amax I n/(I n + I1/2n), where A is the response amplitude; Amax, maximal amplitude; I, flash luminance; and I1/2, flash luminance of half-maximal response amplitude. Solid lines represent fitted curves with the following parameters: normal subjects, Amax, 69 μV; I1/2, 0.76 cd · sec/m2; n = 1.1 (no background); and Amax, 80 μV; I1/2, 2.49 cd · sec /m2; n = 1.2 (with background); AH, Amax, 25 μV; I1/2, 0.14 cd · sec/m2; n = 2.1 (no background); and Amax, 53 μV; I1/2, 1.31 cd · sec/m2; n = 1.2 (with background); and NH, Amax, 13 μV; I1/2, 0.39 cd · sec/m2; n = 1.5 (no background); and Amax, 20 μV; I1/2, 0.94 cd · sec/m2; n = 1.0 (with background). B, Phase (in degrees) between stimulus and response as a function of flash luminance. The stimulus was presented in the dark (left) or on a background (86 cd/m2; right). Symbols are as in A. C, mfERG summed over a visual angle of 84 × 75°. Responses to L cone-isolating stimuli of normal subjects (gray line, representing the mean response of 14 subjects) and AH (black lines) are shown. Responses of AH were measured either in the left (left) or right (right) eye, and responses of normal subjects were measured in the right eye. The potential at the time of stimulus onset was set to 0 μV. Symbols indicate the first minimum (N1) and the maximum (P1) of the respective response. N1 amplitudes are -3.2 μV (normal subjects), -3.3 μV (AH, left eye), and -2.6 μV (AH, right eye); N1 latencies are 15.7 msec (normal subjects), 14.0 msec (AH, left eye), and 16.5 msec (AH, right eye). Amplitude differences between N1 and P1 are 10.8 μV (normal subjects), 5.1 μV (AH, left eye), and 6.3 μV (AH, right eye); P1 latencies are 28.0 msec (normal subjects), 38.8 msec (AH, left eye), and 33.0 msec (AH, right eye).
Summed L cone-driven mfERG responses recorded from AH using a silent substitution technique to modulate L cone quantal catches while keeping S and M cone quantal catches constant (Albrecht et al., 2002) showed an initial negative component (N1), which was similar in amplitude and implicit time to that of normal subjects (Fig. 3C). The following positive peak (P1) was broadened and significantly reduced in amplitude and prolonged in implicit time in both eyes.
Characterization of homomeric wild-type and mutant CNGA3 channels
The CNG channel of cones is composed of CNGA3 and CNGB3 subunits (Bönigk et al., 1993; Gerstner et al., 2000). CNGA3 but not CNGB3 forms functional homomeric channels in heterologous expression systems.
The wt CNGA3 (A3) and the mutant subunits A3T153M, A3T224R, and A3T369S, present in family CHRO21, were studied either as homomeric or as heteromeric channels (by coexpression with the B3 subunits; see below). Immunostaining using the polyclonal antiserum FPc46 revealed that 17-25% of transfected HEK293 cells expressed A3, A3T153M, A3T224R, or A3T369S. We tested the function and Ca2+ permeability of wt and mutant CNGA3 subunits by Ca2+ imaging (Weyand et al., 1994). Stimulation by 8-bromo-cGMP evoked a Ca2+ influx in A3, A3T153M, and A3T369S but not in A3T224R (data not shown).
The electrophysiological properties of the channels were characterized in inside-out membrane patches excised from transfected HEK293 cells. Consistent with the Ca2+-imaging result, no cGMP-activated currents were detected in cells transfected with A3T224R constructs. The properties of A3T153M (data not shown) were not significantly different from those of A3, supporting the notion that A3T153M represents a polymorphism. Therefore, we restricted our further analysis to A3 and A3T369S.
Figure 4, A and B, shows currents of A3 and A3T369S, respectively, in the presence of low (left) and saturating (right) cGMP concentrations. The cGMP-activated currents of A3 and A3T369S differed in several aspects. First, at saturating cGMP concentrations and for similar current amplitudes, the current noise of A3T369S was larger than that of A3. Second, the I-V relation for fully activated A3 was almost linear, whereas that of A3T369S was outwardly rectifying (data not shown). Third, currents of A3T369S in excised patches displayed a pronounced “rundown” (Fig. 4C, open circles), whereas the current amplitude of A3 remained mostly unchanged, even for long recording times (Fig. 4C, filled circles). In the presence of 10 mm dithiothreitol (DTT) in the intracellular solution (Fig. 4C, shaded circles), rundown of A3T369S was attenuated. The effect of DTT indicates that the rundown is caused by the oxidation of intracellular sulfhydryl groups in A3T369S (see Fig. 1A). Last, the cGMP sensitivity of A3T369S was significantly lower compared with that of A3. Figure 4D shows dose-response relations for A3 and A3T369S. The mean value for half-maximal activation (K1/2) was 19.0 μm for A3 and 91.0 μm for A3T369S, demonstrating that A3T369S is almost fivefold less sensitive to cGMP than A3. Unlike the current amplitude, the cGMP sensitivity of A3T369S did not change with time (data not shown).
Figure 4.
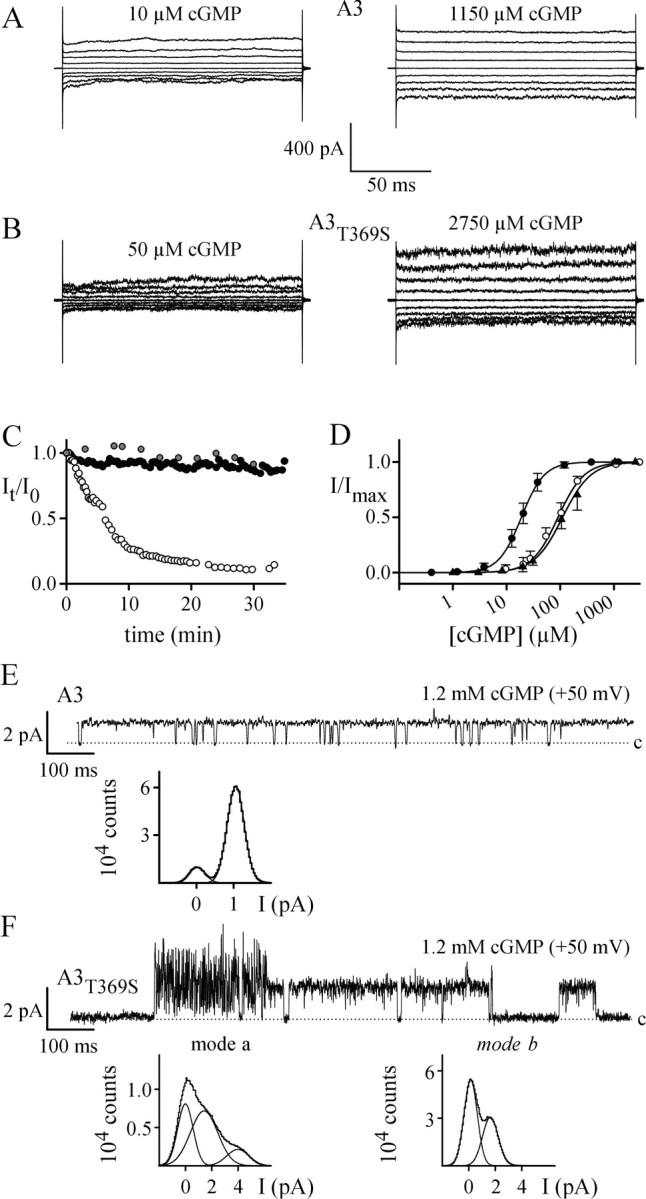
Electrophysiological properties of homomeric channels. A, Current recordings of A3 channels in inside-out patches. Voltages were applied from a holding voltage of 0 mV to voltages from -80 to +80 mV in 20 mV increments. A3 channels were activated with 10 μm or 1150 μm cGMP. B, Current recordings of A3T369S channels. A3T369S channels were activated with 50 or 2750 μm cGMP. The voltage protocol was as in A. C, Progressive decline of maximal cGMP-activated currents from A3T369S (open circles) that was not observed for A3 (filled circles). In the presence of 10 mm DTT in the intracellular solution, currents through A3T369S remained stable with time (shaded circles). Data points represent current amplitudes Itotal at +80 mV, normalized to the amplitude I0 of the first recording at t = 0. D, Ligand sensitivity of wt and mutant CNGA3 channels. Normalized currents (I/Imax) versus cGMP concentration for A3 (filled circles), A3T369S (open circles), and A3T224R/A3T369S (filled triangles) channels are shown (-80 mV). No cGMP-activated currents were observed with A3T224R. Solid lines were calculated with the Hill equation using the following parameters: K1/2, 19.0 ± 4.4 μm; n = 2.1 ± 0.3 (A3; N = 6); K1/2, 91.0 ± 19.9 μm; n = 1.8 ± 0.3 (A3T369S; N=14); and K1/2, 110.4 ± 30.6 μm; n = 1.7 ± 0.2 (A3T224R/A3T369S; N = 5). Error bars indicate SD. E, Single-channel properties of A3. A recording of a single A3 channel at 1.2 mm cGMP and +50 mV (low-pass-filtered at 1 kHz) is shown. The dotted line indicates the closed channel level. The graph shows an all-points histogram of the entire recording (250 sec). The all-points histogram was fitted with two Gaussian functions, revealing a single-channel conductance of 21 pS and a Po,max of 0.87. F, Single-channel properties of A3T369S. A recording of a single A3T369S channel at 1.2 mm cGMP and +50 mV (low-pass-filtered at 1 kHz) is shown. The dotted line indicates the closed channel level. A3T369S displays two gating modes (modes a, b) with different conductance levels. Graphs show all-points histograms of recordings of currents either in gating mode a (left) or gating mode b (right) at 1.2 mm cGMP and +50 mV (low-pass-filtered at 5 kHz). The two all-points histograms were fitted with three and two Gaussian functions, respectively, revealing single-channel conductances of 25 and 80 pS (mode a) and 30 pS (mode b).
The siblings are compound heterozygotes, having inherited one mutant allele from the mother (A3T369S) and the other mutant allele from the father (A3T224R). We simulated this condition by coexpression of the mutant subunits. The dose-response relation of the resulting channels (Fig. 4D, filled triangles) was not significantly different from that of the homomeric A3T369S channel. Similarly, coexpression of A3T224R with A3 or A3T153M did not change the properties compared with the respective homomeric channels (data not shown). These results argue that mutant A3T224R does not incorporate in heteromeric channels and probably represents a null allele.
The larger current noise of A3T369S might be attributable to a larger single-channel current (i) or a smaller maximal open probability (Po,max) or by a combination of both effects. Similarly, the outward rectification of A3T369S might be produced by the voltage dependence of Po, i, or both. We examined ion permeation and gating by measuring single-channel events. The unitary conductance of A3 was 21 pS (at +50 mV) and 19 pS (at -50 mV); the Po,max values at saturating cGMP were 0.87 and 0.89, respectively (Fig. 4E). The unitary current of A3T369S was severely altered in several aspects. Although A3 displayed only a single conductance and gating mode, A3T369S showed two distinct gating modes that differed in conductance and kinetic behavior (Fig. 4F). One gating mode (mode a) displayed extremely short, flickery openings. All-points histograms of currents derived from mode a were fitted best with the sum of three Gaussian functions, indicating at least two open states with conductances of 25 and 80 pS (+50 mV). The other gating mode (mode b) was characterized by relatively long openings to a conductance level of 30 pS (+50 mV). The determination of Po,max was hampered by the rundown that decreased the frequency of opening events with time. However, because the voltage dependence of the conductance levels was negligibly small (between ±50 mV), we propose that the enhanced outward rectification of A3T369S is caused by a decrease of Po,max at negative voltages. In summary, a larger single-channel conductance and a smaller Po,max account for the larger current noise and for the rectification of macroscopic currents of A3T369S. The two distinct gating modes of A3T369S are likely to represent two different conformations of the mutant channel. The existence of only a single gating mode of A3 suggests that the wt channel has a more stable conformation. Possibly, a less dense packed pore in A3T369S, attributable to four lacking methyl groups, allows the mutant channel to adopt several conformations.
CNG channels from rods and cones conduct mixed inward currents carried by Na+, Ca2+, and Mg2+ (Hodgkin et al., 1984; Yau and Nakatani, 1984; Perry and McNaughton, 1991; Haynes, 1995) (for review, see Yau and Baylor, 1989; Kaupp and Seifert, 2002). The Ca2+ entry is important because it provides a negative feedback that promotes both recovery from the light response and light adaptation (for review, see Pugh and Lamb, 2000). Because Ca2+ ions pass more slowly through the channel pore than Na+ ions, extracellular Ca2+ and Mg2+ block the Na+ current by competing for a common intrapore binding site that is formed by glutamate residues of CNGA subunits (Root and MacKinnon, 1993; Eismann et al., 1994; Seifert et al., 1999). We reasoned that the T369S substitution adjacent to Glu-368, the pore glutamate in human CNGA3, may perturb the binding of Ca2+. As a result, T369S might affect Ca2+ permeability and Ca2+ blockage. Therefore, we probed the Ca2+ affinity by measuring the Ca2+ blockage of the K+ current in excised outside-out patches (Eismann et al., 1994; Frings et al., 1995; Seifert et al., 1999). Increasing the extracellular Ca2+ concentration progressively blocked the current both in A3 (Fig. 5, filled circles) and A3T369S (open circles). The Ca2+ dependence of blockage is described by a simple binding isotherm. The mean values for half-maximal blockage (Ki) were 9.9 μm for A3 and 289.5 μm for A3T369S (at -80 mV) and 387.9 and 381.4 μm, respectively (at +80 mV). Thus, the affinity of the intrapore Ca2+-binding site is almost 30-fold lower (at -80 mV) in A3T369S compared with A3.
Figure 5.

Blockage by extracellular Ca2+ of A3 and A3T369S channels. Dose-response relations at -80 mV (left) and +80 mV (right) for the blockage of monovalent current by extracellular Ca2+ ions for A3 (filled circles) and A3T369S (open circles) channels are shown. Solid lines were calculated with the equation I/Imax = (1 - a) Ki/(Ki + c) + a, where c is Ca2+ concentration; Ki, concentration of half-maximal inhibition; and a, residual current nonsusceptible to blocking, using the following Ki values: 387.9 ± 36.0 μm (+80 mV) and 9.9 ± 1.4 μm (-80 mV) (A3; N = 6); and 381.4 ± 85.4 μm (+80 mV) and 289.5 ± 59.1 μm (-80 mV) (A3T369S; N = 5).
Coexpression of A and B subunits
To match the situation in the affected siblings, we coexpressed A3, A3T224R, or A3T369S with CNGB3 (B3). Although A3T224R, when coexpressed with B3, failed to form functional channels, giving credence to the notion that A3T224R represents a null allele, both A3 and A3T369S coassembled with B3 to form functional heteromeric channels. The contribution of homomeric channels to macroscopic currents was estimated from the differential cAMP sensitivity and blockage by l-cis-diltiazem (see Materials and Methods). Macroscopic currents carried by heteromeric A3/B3 and A3T369S/B3 channels displayed similar properties in many aspects (Fig. 6), in contrast to the distinct differences between the respective homomeric A3 and A3T369S channels. First, no obvious difference in current noise was observed for A3/B3 and A3T369S/B3 channels (Fig. 6A,B). Second, the difference in current rectification is small between A3/B3 versus A3T369S/B3, whereas the difference between the A3 versus A3T369S pair is sizeable. Third, the rundown of cGMP-activated currents that exists in homomeric A3T369S channels was not observed with heteromeric A3T369S/B3 or A3/B3 channels (Fig. 6C, open squares). This feature provided another convenient measure to ascertain a homogenous population of A3T369S/B3 channels; experiments with A3T369S/B3 channels were only considered from patches that showed no rundown. Most significantly, A3/B3 and A3T369S/B3 exhibited only a small difference in cGMP sensitivity (Fig. 6D): the A3T369S/B3 channel (open squares) is activated by cGMP with a K1/2 of 20.1 μm and A3/B3 (filled squares) with a K1/2 of 26.3 μm (at -80 mV). We also compared A3/B3 and A3T369S/B3 on the single-channel level. Like macroscopic currents, single-channel events of A3/B3 and A3T369S/B3 by and large were similar (see supplementary material, available at www.jneurosci.org).
Figure 6.

Electrophysiological properties of heteromeric channels. A, Current recordings of A3/B3 channels in inside-out patches. A3/B3 channels were activated with 13 or 1230 μm cGMP. The voltage protocol was as in Figure 4A. B, Current recordings of A3T369S/B3 channels in inside-out patches. A3T369S/B3 channels were activated with 13 or 5700 μm cGMP. The voltage protocol was as in Figure 4A. C, A progressive decline of maximal cGMP-activated currents of homomeric A3T369S (open circles) is not observed with heteromeric A3T369S/B3 channels (open squares). Data points represent current amplitudes measured at +80 mV and normalized to the amplitude of the first recording at t = 0. D, Ligand sensitivity of heteromeric channels. Normalized currents (I/Imax) at -80 mV versus cGMP concentration for A3/B3 (filled squares) and A3T369S/B3 (open squares) are shown. Symbols represent mean values ± SD. Error bars were omitted for N = 2 recordings. Solid lines were calculated with the Hill equation with the following parameters: K1/2, 26.3 ± 5.9 μm; n = 1.9 ± 0.1 (A3/B3; N = 4); and K1/2, 20.1 ± 1.5 μm; N = 2.1 ± 0.6 (A3T369S/B3; N = 3). For comparison, the dose-response relations for A3 (dotted line) and A3T369S (dashed line) are included. E, Voltage dependence of Ca2+ blockage. Mean Ki values of Ca2+ blockage versus voltage for homomeric A3 (filled circles; N = 6), A3T369S (open circles; N = 5), heteromeric A3/B3 (filled squares; N = 3), and A3T369S/B3 (open squares; N = 3) channels are shown. Ki values for A3T369S were obtained for -80 and +80 mV only. Error bars indicate SD.
Last, the dose-response relation of Ca2+ blockage was determined for A3/B3 and A3T369S/B3 channels. Figure 6E shows Ki values versus voltage for homomeric and heteromeric channels. Compared with the respective homomeric channels, heteromeric channels displayed higher Ki values at all voltages, indicating that incorporation of the B3 subunit reduces the Ca2+ affinity of the intrapore binding site. Similar effects on the Ca2+ affinity have been described for CNGB1a and CNGB1b, the B subunits of CNG channels in retinal rods and olfactory sensory neurons, respectively (Körschen et al., 1995; Dzeja et al., 1999). The Ki values for A3/B3 and A3T369S/B3 channels were mostly similar at positive voltages, whereas they differed significantly at negative voltages. Qualitatively similar results were obtained for blockage by Mg2+ (data not shown). The relief of blockage at negative membrane voltages has been interpreted as facilitated permeation of blocking ions (Colamartino et al., 1991; Frings et al., 1995; Seifert et al., 1999), suggesting that the different voltage dependence of the Ki values of A3/B3 and A3T369S/B3 confers a physiologically important difference in the molecular phenotype of wt and mutant channels. The higher Ki values at negative voltages indicate that A3T369S/B3 is more permeable to Ca2+ (and Mg2+) than A3/B3 under physiological conditions.
Discussion
In this study, we report the functional properties of mutant CNGA3 subunits identified in two sisters with incomplete achromatopsia. The psychophysical and ERG studies show that cone function, although preserved to a considerable extent, is impaired in characteristic ways. The severely altered properties of the homomeric mutant A3T369S seem to be inconsistent with the relatively mild phenotype. However, coexpression of A3T369S with wt B3 rescued most of the alterations, except for the Ca2+ permeability. This finding seems all the more surprising because CNG channels of rods and probably also cones comprise only a single B subunit and three A subunits (Weitz et al., 2002; Zheng et al., 2002; Zhong et al., 2002). However, A and B subunits are likely to entertain multiple sites of contact between each other, in particular in the cNMP-binding and C linker region. These contacts may “normalize” the structure of the pore region.
A plethora of studies have identified amino acid residues that seem to be important for specific channel functions such as gating and permeation. Most of these studies used homomeric channels. Our results underscore the necessity of examining the mutations in heteromeric channels.
In the following, we speculate about the functional consequences of the mutant channels that form the basis of the patient's phenotype.
Composition of mutant channels
The affected subjects are compound heterozygous for the mutations; i.e., they carry both the A3T369S and the A3T224R alleles. On heterologous expression, only A3T369S gave rise to functional channels, whereas A3T224R failed to form functional channels on its own or when coexpressed with B3. Furthermore, in coexpression studies, A3T224R did not change the properties of A3, A3T369S, or A3T153M. These results argue that, when heterologously expressed, functional channels are lacking the A3T224R subunit. Likewise, the native CNG channel may also not incorporate this mutant subunit. Alternatively, A3T224R may exert a dominant negative effect, rendering the heteromeric channel complex nonfunctional. Either explanation can account for the observed electrophysiological results. Irrespective of being a null mutant or a dominant negative mutant, A3T224R is expected to lower the density of functional channels in the cone outer segment of the affected siblings and their father. It can be deduced from the father's normal color vision that a fraction of wt subunits is sufficient for normal cone function. However, it is conceivable that a lower channel density may contribute to cone dysfunction when a second mutant subunit is present. We will return to this point later in the discussion.
The pore mutation produces multiple changes
The mutant A3T369S is remarkable because the conservative substitution in the pore loop affects all aspects of channel function, including gating and ligand sensitivity. In particular, the fivefold shift in ligand sensitivity is unexpected because the mutation is located at a position that is accessible only from the extracellular side (Becchetti et al., 1999a), whereas the binding site for cyclic nucleotides is located intracellularly (Kaupp et al., 1989). The effect of the pore mutation on the ligand affinity might be explained by the intimate reciprocal relationship between binding and gating in ligand-gated channels (Colquhoun, 1998). It has previously been suggested that the pore loop of CNG channels participates in gating rearrangements on the basis of the effect of amino acid substitutions on the open probability and ligand sensitivity (Bucossi et al., 1996; Bucossi et al., 1997; Becchetti and Gamel, 1999b; Gamel and Torre, 2000; Gavazzo et al., 2000). Most probably, structural alterations in the extracellular pore mouth of A3T369S propagate to intracellular regions of the channel that are involved in ligand binding and gating (e.g., S6, C linker, and cNMP-binding site). The sensitivity of A3T369S to the intracellular redox potential supports this possibility.
Cellular malfunction and phenotypic representation
The heteromeric A3T369S/B3 channel is characterized by a lower efficacy of Ca2+ blockage at negative membrane voltage attributable to an increase in Ca2+ permeability. In addition, a nonfunctional A3T224R subunit might reduce the channel density. Can we predict cellular consequences that might result from these alterations?
A lower efficacy of blockage by Ca2+ is expected to increase single-channel current. One of the consequences will be a rise of dark current noise and therefore a lower signal-to-noise ratio of the light response. If, in addition, the channel density is reduced, the signal-to-noise ratio should be even further reduced. Minor alterations are expected for the dark current and for intracellular [Ca2+] ([Ca2+]i). Although we cannot predict whether the dark current and [Ca2+]i are increased because of the single-channel properties or decreased because of a lower channel density, Ca2+-regulated negative feedback on the synthesis and degradation of cGMP (for review, see Pugh and Lamb, 2000), on the activity of the cone CNG channel, and on the activity of the Na+/Ca2+-K+ exchanger (Korenbrot and Rebrik, 2002) will ameliorate changes in dark current and [Ca2+]i. For example, at low [Ca2+]i, the Ca2+-binding proteins GCAP1 and GCAP2 stimulate GC activity (for review, see Koch et al., 2002). Moreover, at high [Ca2+]i, the cGMP sensitivity of photoreceptor CNG channels is lowered (Hsu and Molday, 1993; Gordon et al., 1995; Rebrik and Korenbrot, 1998; Korenbrot and Rebrik, 2002; Peng et al., 2003). Therefore, we favor the idea that enhanced current noise is the principal defect in the outer segment caused by the mutant CNG channel.
Are these predictions supported by the clinical manifestations? The contribution of cones to the photopic mfERG is considered small (for review, see Hood et al., 2002). However, a large change in dark current should be manifest in the N1 amplitude. The mfERG signals do not reveal any difference, but our measurements are lacking the resolution that would allow detection of small changes in dark current. All we can conclude is that the dark current cannot be grossly altered compared with that of normal cones. Likewise, the mechanism of light adaptation, which strongly depends on [Ca2+]i (for review, see Pugh and Lamb, 2000), seems to be similar in mutant and normal cones, suggesting that the dynamics of the light-induced changes in [Ca2+]i are by and large also similar. In contrast, the light sensitivity of the cone system is reduced in the patients as indicated by the increase in absolute cone threshold. We argue that an increase in intrinsic photoreceptor noise originating from the mutant CNG channel is responsible for the lower light sensitivity.
In cones, CNG channels are located not only in the outer segment but also in the synaptic terminal (Rieke and Schwartz, 1994; Savchenko and Kramer, 1997). The opening of synaptic CNG channels is expected to increase [Ca2+]i in the synaptic terminal by two distinct mechanisms: directly by the large Ca2+ permeability of the channel and indirectly by its depolarizing force activating voltage-dependent Ca2+ channels. It has been proposed that the activity of the CNG channel extends the voltage range within which synaptic transmission operates (Rieke and Schwartz, 1994; Savchenko and Kramer, 1997). If the synaptic CNG channel is identical to that in the outer segment, then [Ca2+]i in the synaptic terminal of the mutant cone might be altered. The Ca2+ dependence of neurotransmitter release is extremely steep. Therefore, the light-induced changes in synaptic [Ca2+]i are no longer tuned to the dynamic range of neurotransmitter release. This effect could account for the reduction in light sensitivity, the smaller amplitude and delay of the b wave, and the alterations of the P1 component of the mfERG. Unfortunately, little is known about the regulation of the synaptic CNG channel (Savchenko and Kramer, 1997) and, therefore, about potential feedback mechanisms that may attenuate the changes in synaptic [Ca2+]i. In conclusion, alterations in both the outer segment and the synapse may contribute to the phenotype.
Phenotypic differences between the sisters
The sisters show the symptoms of incomplete achromatopsia with different severity, suggesting that their disorder is produced not only by the mutant CNGA3 alleles but also by other genetic factors. However, some of the phenotypic differences might have simple explanations. The differences in visual acuity and color vision performance might be explained by different retinal loci used by AH and NH for optical fixation: the maximum visual acuity correlates with cone density, which is maximal in the central fovea and decreases with retinal eccentricity (Hirsch and Curcio, 1989; Curcio et al., 1990). Normal subjects use the central fovea for fixation that enables maximal visual acuity. Because S cones are absent in the central fovea (Curcio et al., 1991), normal subjects display cone contrast sensitivities that are lower for S cones than for L and M cones. Possibly, NH uses an almost foveal fixational locus to achieve maximal visual acuity but at the expense of elevated S cone contrast thresholds. In contrast, AH may use a parafoveal locus with lower M and L cone density but higher S cone density, resulting in a lower visual acuity but higher S-cone contrast sensitivity compared with NH.
The psychophysical TVI experiments revealed that background light increases detection thresholds of AH more effectively than those of NH. This difference might result from different postreceptoral pathways (Stiles, 1953; Wandell and Pugh, 1980a,b; Miyahara et al., 1996) used by AH and NH for threshold detection at higher background intensities. The malfunction of cone photoreceptors might enhance interindividual variability in the contribution of the different pathways to target sensitivity. Such interindividual variability is also likely to be present in normal trichromatic observers (Sharpe and Volbrecht, 1990).
Footnotes
This work was supported by Federal Ministry of Education and Research IB2 Grant Fö.01KS9602 and Interdisciplinary Center of Clinical Research Tübingen IB2 Grant IZKF to L.T.S., a Hermann-und-Lilly-Schilling-Professur to L.T.S., and Deutsche Forschungsgemeinschaft Grant SFB 430/A5 to B.W. Antiserum FPc46 was kindly provided by Dr. Ingo Weyand (Institut für Biologische Informationsverarbeitung 1, Forschungszentrum Jülich).
Correspondence should be addressed to either of the following: Dr. Dimitri Tränkner, Forschungszentrum Jülich, IBI-1, 52425 Jülich, Germany, E-mail: d.traenkner@fz-juelich.de; or Dr. Bernd Wissinger, Molekulargenetisches Labor, Auf der Morganstelle 15, 72076 Tübingen, Germany, E-mail: wissinger@uni-tuebingen.de.
Copyright © 2004 Society for Neuroscience 0270-6474/04/240138-10$15.00/0
D.T., H.J., and S.K. contributed equally to this work.
References
- Albrecht J, Jägle H, Hood DC, Sharpe LT (2002) The multifocal electroretinogram (mfERG) and cone isolating stimuli: variation in L- and M-cone driven signals across the retina. J Vis 2: 543-558. [DOI] [PubMed] [Google Scholar]
- Altenhofen W, Ludwig J, Eismann E, Kraus W, Bönigk W, Kaupp UB (1991) Control of ligand specificity in cyclic nucleotide-gated channels from rod photoreceptors and olfactory epithelium. Proc Natl Acad Sci USA 88: 9868-9872. [DOI] [PMC free article] [PubMed] [Google Scholar]
- Becchetti A, Gamel K, Torre V (1999a) Cyclic nucleotide-gated channels: pore topology studied through the accessibility of receptor cysteines. J Gen Physiol 114: 377-392. [DOI] [PMC free article] [PubMed] [Google Scholar]
- Becchetti A, Gamel K (1999b) The properties of cysteine mutants in the pore region of cyclic-nucleotide-gated channels. Pflügers Arch 438: 587-596. [DOI] [PubMed] [Google Scholar]
- Bönigk W, Altenhofen W, Müller F, Dose A, Illing M, Molday RS, Kaupp UB (1993) Rod and cone photoreceptor cells express distinct genes for cGMP-gated channels. Neuron 10: 865-877. [DOI] [PubMed] [Google Scholar]
- Bönigk W, Bradley J, Müller F, Sesti F, Boekhoff I, Ronnett GV, Kaupp UB, Frings S (1999) The native rat olfactory cyclic nucleotide-gated channel is composed of three distinct subunits. J Neurosci 19: 5332-5347. [DOI] [PMC free article] [PubMed] [Google Scholar]
- Bucossi G, Eismann E, Sesti F, Nizzari M, Seri M, Kaupp UB, Torre V (1996) Time-dependent current decline in cyclic GMP-gated bovine channels caused by point mutations in the pore region expressed in Xenopus oocytes. J Physiol (Lond) 493: 409-418. [DOI] [PMC free article] [PubMed] [Google Scholar]
- Bucossi G, Nizzari M, Torre V (1997) Single-channel properties of ionic channels gated by cyclic nucleotides. Biophys J 72: 1165-1181. [DOI] [PMC free article] [PubMed] [Google Scholar]
- Chen T-Y, Peng Y-W, Dhallan RS, Ahamed B, Reed RR, Yau K-W (1993) A new subunit of the cyclic nucleotide-gated cation channel in retinal rods. Nature 362: 764-767. [DOI] [PubMed] [Google Scholar]
- Colamartino G, Menini A, Torre V (1991) Blockage and permeation of divalent cations through the cyclic GMP-activated channel from tiger salamander retinal rods. J Physiol (Lond) 440: 189-206. [DOI] [PMC free article] [PubMed] [Google Scholar]
- Colquhoun D (1998) Binding, gating, affinity and efficacy: the interpretation of structure-activity relationships for agonists and of the effects of mutating receptors. Br J Pharmacol 125: 924-947. [DOI] [PMC free article] [PubMed] [Google Scholar]
- Curcio CA, Sloan KR, Kalina RE, Hendrickson AE (1990) Human photoreceptor topography. J Comp Neurol 292: 497-523. [DOI] [PubMed] [Google Scholar]
- Curcio CA, Allen KA, Sloan KR, Lerea CL, Hurley JB, Klock IB, Milam AH (1991) Distribution and morphology of human cone photoreceptors stained with anti-blue opsin. J Comp Neurol 312: 610-624. [DOI] [PubMed] [Google Scholar]
- Dzeja C, Hagen V, Kaupp UB, Frings S (1999) Ca2+ permeation in cyclic nucleotide-gated channels. EMBO J 18: 131-144. [DOI] [PMC free article] [PubMed] [Google Scholar]
- Eismann E, Müller F, Heinemann SH, Kaupp UB (1994) A single negative charge within the pore region of a cGMP-gated channel controls rectification, Ca2+ blockage, and ionic selectivity. Proc Natl Acad Sci USA 91: 1109-1113. [DOI] [PMC free article] [PubMed] [Google Scholar]
- Frings S, Seifert R, Godde M, Kaupp UB (1995) Profoundly different calcium permeation and blockage determine the specific function of distinct cyclic nucleotide-gated channels. Neuron 15: 169-179. [DOI] [PubMed] [Google Scholar]
- Gamel K, Torre V (2000) The interaction of Na+ and K+ in the pore of cyclic nucleotide-gated channels. Biophys J 79: 2475-2493. [DOI] [PMC free article] [PubMed] [Google Scholar]
- Gavazzo P, Picco C, Eismann E, Kaupp UB, Menini A (2000) A point mutation in the pore region alters gating, Ca2+ blockage, and permeation of olfactory cyclic nucleotide-gated channels. J Gen Physiol 116: 311-325. [DOI] [PMC free article] [PubMed] [Google Scholar]
- Gerstner A, Zong X, Hofmann F, Biel M (2000) Molecular cloning and functional characterization of a new modulatory cyclic nucleotide-gated channel subunit from mouse retina. J Neurosci 20: 1324-1332. [DOI] [PMC free article] [PubMed] [Google Scholar]
- Goodman G, Ripps H, Siegel IM (1963) Cone dysfunction syndromes. Arch Ophthalmol 70: 214-231. [DOI] [PubMed] [Google Scholar]
- Gordon SE, Zagotta WN (1995) Localization of regions affecting an allosteric transition in cyclic nucleotide-activated channels. Neuron 14: 857-864. [DOI] [PubMed] [Google Scholar]
- Gordon SE, Downing-Park J, Zimmerman AL (1995) Modulation of the cGMP-gated ion channel in frog rods by calmodulin and an endogenous inhibitory factor. J Physiol (Lond) 486: 533-546. [DOI] [PMC free article] [PubMed] [Google Scholar]
- Gouras P, MacKay CJ (1989) Growth in amplitude of the human cone electroretinogram with light adaptation. Invest Ophthalmol Vis Sci 30: 625-630. [PubMed] [Google Scholar]
- Haynes LW (1995) Permeation and block by internal and external divalent cations of the catfish cone photoreceptor cGMP-gated channel. J Gen Physiol 106: 507-523. [DOI] [PMC free article] [PubMed] [Google Scholar]
- Hirsch J, Curcio CA (1989) The spatial resolution capacity of human foveal retina. Vision Res 29: 1095-1101. [DOI] [PubMed] [Google Scholar]
- Hodgkin AL, McNaughton PA, Nunn BJ (1984) The effect of light adaptation on the response of the light-sensitive current of toad rods to changes of Ca and Na. J Physiol (Lond) 351: 10P. [Google Scholar]
- Hood DC, Frishman LJ, Saszik S, Viswanathan S (2002) Retinal origins of the primate multifocal ERG: implications of the human response. Invest Ophthalmol Vis Sci 43: 1673-1685. [PubMed] [Google Scholar]
- Hsu Y-T, Molday RS (1993) Modulation of the cGMP-gated channel of rod photoreceptor cells by calmodulin. Nature 361: 76-79. [DOI] [PubMed] [Google Scholar]
- Jäger W (1953) Typen der inkompletten Achromatopsie. Ber Dtsch Ophthalmol Ges 58: 44-47. [Google Scholar]
- Kaupp UB, Seifert R (2002) Cyclic nucleotide-gated ion channels. Physiol Rev 82: 769-824. [DOI] [PubMed] [Google Scholar]
- Kaupp UB, Niidome T, Tanabe T, Terada S, Bönigk W, Stühmer W, Cook NJ, Kangawa K, Matsuo H, Hirose T, Miyata T, Numa S (1989) Primary structure and functional expression from complementary DNA of the rod photoreceptor cyclic GMP-gated channel. Nature 342: 762-766. [DOI] [PubMed] [Google Scholar]
- Koch K-W, Duda T, Sharma RK (2002) Photoreceptor specific guanylate cyclases in vertebrate phototransduction. Mol Cell Biochem 230: 97-106. [PubMed] [Google Scholar]
- Kohl S, Marx T, Giddings I, Jägle H, Jacobson SG, Apfelstedt-Sylla E, Zrenner E, Sharpe LT, Wissinger B (1998) Total colour blindness is caused by mutations in the gene encoding the α-subunit of the cone photoreceptor cGMP-gated cation channel. Nat Genet 19: 257-259. [DOI] [PubMed] [Google Scholar]
- Kohl S, Baumann B, Broghammer M, Jägle H, Sieving P, Kellner U, Spegal R, Anastasi M, Zrenner E, Sharpe LT, Wissinger B (2000) Mutations in the CNGB3 gene encoding the β-subunit of the cone photoreceptor cGMP gated channel are responsible for achromatopsia (ACHM3) linked to chromosome 8q21. Hum Mol Genet 9: 2107-2116. [DOI] [PubMed] [Google Scholar]
- Korenbrot JI, Rebrik TI (2002) Tuning outer segment Ca2+ homeostasis to phototransduction in rods and cones. Adv Exp Med Biol 514: 179-203. [DOI] [PubMed] [Google Scholar]
- Körschen HG, Illing M, Seifert R, Sesti F, Williams A, Gotzes S, Colville C, Müller F, Dosé A, Godde M, Molday L, Kaupp UB, Molday RS (1995) A 240 kDa protein represents the complete β subunit of the cyclic nucleotide-gated channel from rod photoreceptor. Neuron 15: 627-636. [DOI] [PubMed] [Google Scholar]
- Martell AE, Smith RM (1974) Critical stability constants. New York: Plenum.
- Miyahara E, Pokorny J, Smith VC (1996) Increment threshold and purity discrimination spectral sensitivities of X-chromosome-linked color-defective observers. Vision Res 36: 1597-1613. [DOI] [PubMed] [Google Scholar]
- Peachey NS, Alexander KR, Derlacki DJ, Fishman GA (1992) Light adaptation, rods, and the human cone flicker ERG. Vis Neurosci 8: 145-150. [DOI] [PubMed] [Google Scholar]
- Peng C, Rich ED, Thor CA, Varnum MD (2003) Functionally important calmodulin binding sites in both N- and C-terminal regions of the cone photoreceptor cyclic nucleotide-gated channel CNGB3 subunit. J Biol Chem 278: 34533-34540. [DOI] [PubMed] [Google Scholar]
- Perry RJ, McNaughton PA (1991) Response properties of cones from the retina of the tiger salamander. J Physiol (Lond) 433: 561-587. [DOI] [PMC free article] [PubMed] [Google Scholar]
- Pokorny J, Smith VC, Verriest G, Pinckers AJGL (1979) Congenital and acquired color vision defects. New York: Grune and Stratton.
- Pokorny J, Smith VC, Pinckers AJGL, Cozijnsen M (1982) Classification of complete and incomplete autosomal recessive achromatopsia. Graefes Arch Clin Exp Ophthalmol 219: 121-130. [DOI] [PubMed] [Google Scholar]
- Pugh Jr EN, Lamb TD (2000) Phototransduction in vertebrate rods and cones: molecular mechanisms of amplification, recovery and light adaptation. In: Handbook of biological physics (Stavenga DG, DeGrip WJ, Pugh Jr EN, eds), pp 183-255. Amsterdam: Elsevier.
- Rebrik TI, Korenbrot JI (1998) In intact cone photoreceptors, a Ca2+-dependent, diffusible factor modulates the cGMP-gated ion channels differently than in rods. J Gen Physiol 112: 537-548. [DOI] [PMC free article] [PubMed] [Google Scholar]
- Rieke F, Schwartz EA (1994) A cGMP-gated current can control exocytosis at cone synapses. Neuron 13: 863-873. [DOI] [PubMed] [Google Scholar]
- Root MJ, MacKinnon R (1993) Identification of an external divalent cation-binding site in the pore of a cGMP-activated channel. Neuron 11: 459-466. [DOI] [PubMed] [Google Scholar]
- Savchenko A, Kramer RH (1997) Cyclic nucleotide-gated channels in synaptic terminals of retinal cones mediate feedback modulation of neurotransmitter release by nitric oxide. J Gen Physiol 110: 17a. [Google Scholar]
- Seifert R, Eismann E, Ludwig J, Baumann A, Kaupp UB (1999) Molecular determinants of a Ca2+-binding site in the pore of cyclic nucleotide-gated channels: S5/S6 segments control affinity of intrapore glutamates. EMBO J 18: 119-130. [DOI] [PMC free article] [PubMed] [Google Scholar]
- Sharpe LT, Nordby K (1990) Total colour blindness: an introduction. In: Night vision: basic, clinical and applied aspects (Hess RF, Sharpe LT, Nordby K, eds), pp 253-289. Cambridge, UK: Cambridge UP.
- Sharpe LT, Volbrecht VJ (1990) Estimating middle-wavelength and long-wavelength cone sensitivity with large, long-duration targets and small, brief targets. Perception 19: 745-757. [DOI] [PubMed] [Google Scholar]
- Sharpe LT, Fach C, Nordby K, Stockman A (1989) The incremental threshold of rod vision and Weber's law. Science 244: 355-356. [DOI] [PubMed] [Google Scholar]
- Sharpe LT, Stockman A, Jägle H, Nathans J (1999) Opsin genes, cone photopigments, color vision and colorblindness. In: Color vision: from genes to perception (Gegenfurtner K, Sharpe LT, eds), pp 3-52. Cambridge, UK: Cambridge UP.
- Stiles WS (1953) Further studies of visual mechanisms by the two-colour threshold technique. Union Int Phys Pure Appliquée 1: 65-103. [Google Scholar]
- Stockman A, Sharpe LT (2000) The spectral sensitivities of the middle- and long-wavelength-sensitive cones derived from measurements in observes of known genotype. Vision Res 40: 1711-1737. [DOI] [PubMed] [Google Scholar]
- Stockman A, Sharpe LT, Fach C (1999) The spectral sensitivity of the human short-wavelength sensitive cones derived from thresholds and color matches. Vision Res 39: 2901-2927. [DOI] [PubMed] [Google Scholar]
- Sundin OH, Yang J-M, Li Y, Zhu D, Hurd JN, Mitchell TN, Silva ED, Maumenee IH (2000) Genetic basis of total colour blindness among the Pingelapese islanders. Nat Genet 25: 289-293. [DOI] [PubMed] [Google Scholar]
- Tanaka JC, Eccleston JF, Furman RE (1989) Photoreceptor channel activation by nucleotide derivatives. Biochemistry 28: 2776-2784. [DOI] [PubMed] [Google Scholar]
- Wandell BA, Pugh Jr EN (1980a) A field-additive pathway detects brief-duration, long-wavelength incremental flashes. Vision Res 20: 613-624. [DOI] [PubMed] [Google Scholar]
- Wandell BA, Pugh Jr EN (1980b) Detection of long-duration, long-wavelength incremental flashes by a chromatically coded pathway. Vision Res 20: 625-636. [DOI] [PubMed] [Google Scholar]
- Weitz D, Ficek N, Kremmer E, Bauer PJ, Kaupp UB (2002) Subunit stoichiometry of the CNG channel of rod photoreceptors. Neuron 36: 881-889. [DOI] [PubMed] [Google Scholar]
- Weyand I, Godde M, Frings S, Weiner J, Müller F, Altenhofen W, Hatt H, Kaupp UB (1994) Cloning and functional expression of a cyclic-nucleotide-gated channel from mammalian sperm. Nature 368: 859-863. [DOI] [PubMed] [Google Scholar]
- Wissinger B, Müller F, Weyand I, Schuffenhauer S, Thanos S, Kaupp UB, Zrenner E (1997) Cloning, chromosomal localization and functional expression of the gene encoding the α-subunit of the cGMP-gated channel in human cone photoreceptors. Eur J Neurosci 9: 2512-2521. [DOI] [PubMed] [Google Scholar]
- Wissinger B, Jägle H, Kohl S, Broghammer M, Baumann B, Hanna DB, Hedels C, Apfelstedt-Sylla E, Randazzo G, Jacobson SG, Zrenner E, Sharpe LT (1998) Human rod monochromacy: linkage analysis and mapping of a cone photoreceptor expressed candidate gene on chromosome 2q11. Genomics 51: 325-331. [DOI] [PubMed] [Google Scholar]
- Wissinger B, Gamer D, Jagle H, Giorda R, Marx T, Mayer S, Tippmann S, Broghammer M, Jurklies B, Rosenberg T, Jacobson SG, Sener EC, Tatlipinar S, Hoyng CB, Castellan C, Bitoun P, Andreasson S, Rudolph G, Kellner U, Lorenz B, et al. (2001) CNGA3 mutations in hereditary cone photoreceptor disorders. Am J Hum Genet 69: 722-737. [DOI] [PMC free article] [PubMed] [Google Scholar]
- Yau K-W, Baylor DA (1989) Cyclic GMP-activated conductance of retinal photoreceptor cells. Annu Rev Neurosci 12: 289-327. [DOI] [PubMed] [Google Scholar]
- Yau K-W, Nakatani K (1984) Cation selectivity of light-sensitive conductance in retinal rods. Nature 309: 352-354. [DOI] [PubMed] [Google Scholar]
- Yu W-P, Grunwald ME, Yau K-W (1996) Molecular cloning, functional expression and chromosomal localization of a human homolog of the cyclic nucleotide-gated ion channel of retinal cone photoreceptors. FEBS Lett 393: 211-215. [DOI] [PubMed] [Google Scholar]
- Zheng J, Trudeau MC, Zagotta WN (2002) Rod cyclic nucleotide-gated channels have a stoichiometry of three CNGA1 subunits and one CNGB1 subunit. Neuron 36: 891-896. [DOI] [PubMed] [Google Scholar]
- Zhong H, Molday LL, Molday RS, Yau K-W (2002) The heteromeric cyclic nucleotide gated channel adopts a 3A:1B stoichiometry. Nature 420: 193-198. [DOI] [PMC free article] [PubMed] [Google Scholar]
- Zong X, Zucker H, Hofmann F, Biel M (1998) Three amino acids in the C-linker are major determinants of gating in cyclic nucleotide-gated channels. EMBO J 17: 353-362. [DOI] [PMC free article] [PubMed] [Google Scholar]