Abstract
Seeing target motion is a vital capability of the visual system in humans and animals. Physically, motion is described by its acceleration, speed, and direction. Motion-sensitive neurons in all the visual areas examined to date are selective for the direction and speed of motion. Here, we show by single-unit recording that one-third of motion-sensitive neurons in the pigeon's pretectal nucleus also encode the acceleration of stimulus motion. These neurons are characterized by plateau-shaped speed-tuning curves in which the firing rate is the same over a wide range of speeds, a feature that allows these neurons to encode unambiguously the rate of change of speed over time. Acceleration-sensitive neurons also show transient responses to the offset of motion in the preferred and/or nonpreferred directions; acceleration-insensitive neurons do not. We observed the same sensitivity to target acceleration for brief ramps of stimulus speed and for sinusoidal modulation of speed. The locations of acceleration-sensitive and -insensitive neurons are segregated in the pretectal nucleus. The visual responses of pretectal neurons indicate that the visual and vestibular systems share not only a spatial but also a temporal reference frame that can detect the acceleration produced by self-motion of an organism.
Keywords: acceleration, optokinetic nystagmus, receptive field, speed-tuning curve, vestibular system, visual system
Introduction
The ability of humans and animals to see target motion is one of the most fundamental properties of their visual systems. Extensive studies on various species have reported that motion-sensitive neurons are selective for the direction and speed of visual stimulus motion in the visual cortex (Maunsell and Van Essen, 1983; Petersen et al., 1985; Hammond et al., 1988; Lisberger and Movshon, 1999; Priebe and Lisberger, 2002; Liu and Newsome, 2003) as well as in the pretectum and the accessory optic system (Winterson and Brauth, 1985; Natal and Britto, 1987; Soodak and Simpson, 1988; Hoffmann and Distler, 1989; Mustari and Fuchs, 1989; Frost et al., 1990; Klauer et al., 1990; Wolf-Oberhollenzer and Kirschfeld, 1994; Li et al., 1996; Fu et al., 1998a,b; Zhang et al., 1999; Gu et al., 2001; Ibbotson and Price, 2001; Wang et al., 2001; Clifford and Ibbotson, 2003; Crowder et al., 2003). However, motion is physically described by its acceleration, as well as its direction and speed.
It would be natural to hypothesize that some motion-sensitive neurons might code the visual acceleration in their firing rates. For example, Krauzlis and Lisberger (1994) have shown that visual acceleration is an important component of the visual inputs to models of smooth pursuit eye movements and that such models do not accurately reproduce the temporal dynamics of smooth pursuit if the visual acceleration input is omitted. Lisberger and Movshon (1999) showed that the firing rate of individual neurons in macaque area MT (middle temporal visual area) is tuned for target speed but does not show an obvious relationship to target acceleration. However, visual acceleration could be estimated by pooling the responses of a population of MT neurons. Might stimulus acceleration be represented more explicitly in the firing rate of individual neurons further downstream in the visual motor system, for example in the pretectum and the accessory optic system?
In non-mammalian vertebrates such as the pigeon, the nucleus lentiformis mesencephali in the pretectum and the nucleus of the basal optic root in the accessory optic system are thought to be homologous to the nucleus of the optic tract and the terminal nuclei of the accessory optic tract in mammals (Fite, 1985; McKenna and Wallman, 1985). Both are involved in optokinetic nystagmus, an oculomotor reflex that monitors self-motion and strives to stabilize the image on the retina by compensatory movements of the eyes. Self-motion of an organism is also monitored by the vestibular system, and there are a number of spatial and temporal similarities between the responses of vestibular afferent neurons to self-motion and the responses of neurons in the optokinetic system to image motion. Both have high levels of spontaneous activity, and both are characterized by excitatory responses to motion in one direction and inhibitory responses to motion in the opposite direction of adequate stimuli (Klinke, 1978; Fu et al., 1998a,b; Wylie and Crowder, 2000; Ibbotson and Price, 2001). Furthermore, the visual responses of optokinetic neurons seem to be organized in the same spatial coordinate frame as the semicircular canals of the vestibular apparatus (Miles, 1984; Wylie et al., 1998). The firing rates of vestibular neurons are modulated in relation to head acceleration; might the responses of optokinetic neurons show similar responses to image acceleration? The present study provides an affirmative answer.
Materials and Methods
Sixty-eight pigeons (Columba livia) were used following the policy on the use of animals established by the Society for Neuroscience. Each pigeon was anesthetized with urethane (20%, 1 ml/100 gm) and then placed in a stereotaxic apparatus. Its body temperature was maintained at ∼41 °C. The left caudal forebrain and rostral tectum were surgically exposed, and the dura mater overlying the nucleus lentiformis mesencephali was excised. The right eye was kept open, and the left eye was covered. A screen of 130 × 140° was positioned 40 cm away from the viewing eye. The horizontal meridian of the visual field was rotated counterclockwise from the bird's view by 38° (Britto et al., 1990; Fu et al., 1998a,b) to match the pigeon's normal viewing conditions (Erichsen et al., 1989).
Two kinds of visual stimuli were generated by a workstation (Silicon Graphics Indigo 2): (1) single black squares of 5-10° visual angle in size; and (2) whole-screen square-wave grating patterns consisting of black and white stripes (0.04-0.5 cycles/degree). The stimuli were projected with a three-color projector (Electrohome ECP4) that could automatically focus over the whole screen. The luminance of the black and white stripes was 0.1 and 6.6 cd/m2; contrast was 0.97. Visual cells were recorded extracellularly from the nucleus lentiformis mesencephali according to its stereotaxic coordinates (Karten and Hodos, 1967) with a micropipette (2 μm tip diameter; 5-15 MΩ impedance) filled with 2 m sodium acetate and 2% pontamine sky blue (Gu et al., 2001). Neuronal spikes were amplified, displayed, and fed into the computer for quantitative analysis.
The grating pattern was moved perpendicularly to its orientation and randomly in eight directions (45° apart, with nasal 0°) to measure the firing rate of a cell in each direction. The preferred direction of the cell then was estimated by fitting a Gaussian function to the directional data. The nonpreferred or null direction was usually opposite to the preferred direction. The grating pattern then was oriented orthogonal to and moved in the preferred and null directions at a series of speeds (2, 4, 8, 16, 32, 48, 64, 80, 96, and 128°/sec) to measure the speed-tuning curve in each direction. To objectively determine the shape of the speed-tuning curve in each cell, we compared the firing rates evoked by motion at the middle speed (48°/sec) and its two adjacent speeds (32 and 64°/sec). The flatness of the speed-tuning curve was characterized by the equation: fluctuation index = (fmax - fmin)/(fmin - fspont), where fmax and fmin are the maximal and minimal firing rate produced by motion at 32, 48, and 64°/sec, and fspont is the spontaneous rate. The fluctuation index must be ≥0, with zero representing a perfectly flat speed-tuning plateau. Visual stimulus accelerations of 20-480°/sec2 were obtained by providing constant ramp changes in speed. The size of the ramps ranged from 2 to 128°/sec, with the starting and ending speeds chosen to fall within the range defining the plateau in the speed-tuning curve, and the durations ranged from 0.2 to 3 sec. In addition, we delivered sinusoidally modulated stimulus speeds at frequencies of 0.5-2 Hz.
Visual stimuli were presented in randomly interleaved trials, with an interval of at least 5 sec between trials to allow the cell to recover from any motion adaptation. Each trial began by presenting a stimulus that was stationary for 2-3 sec and then started to move either at constant speed or with a speed trajectory that provided steady acceleration or deceleration in the form of constantly changing speeds over time. Neuronal spikes were analyzed by averaging firing rates accumulated in three to nine repeats with the computer. For stimuli that provided non-zero stimulus acceleration, the acceleration component of the response was defined as faccel - fspeed, where faccel is the firing rate evoked by stimulus acceleration at a given value and fspeed is the firing rate expected from the speed-tuning curve obtained by providing stimulus motion at a constant speed. To evaluate the response to target acceleration and deceleration as a function of time and estimate the time-to-peak response and the magnitude of the response, the histograms of neural responses were fitted with either log-normal (Eq. 1) or polynomial (Eq. 2) functions, as follows:
 |
i |
 |
ii |
where F is the firing rate, t is the time from acceleration onset, tc is the time-to-peak response, F0 is the response to constant speed, A is the peak response to acceleration, w is the width of the function, ln is the logarithm to base e, and a, b, c, and d are coefficients (see Origin 7.0).
At the end of some experiments, the recording sites of visual neurons were marked with pontamine sky blue applied by negative current pulses of 10-20 μA in intensity and 0.5 sec in duration at 1 Hz for 10-15 min. Under deep anesthesia, the brain was removed from the skull, fixed in 4% paraformaldehyde for 6-12 hr, and soaked in 30% sucrose solution in a refrigerator overnight. Frozen sections were cut at 100 μm thickness and counterstained with neutral red. Sections were dehydrated and covered for subsequent microscopic observation (Gu et al., 2001).
Results
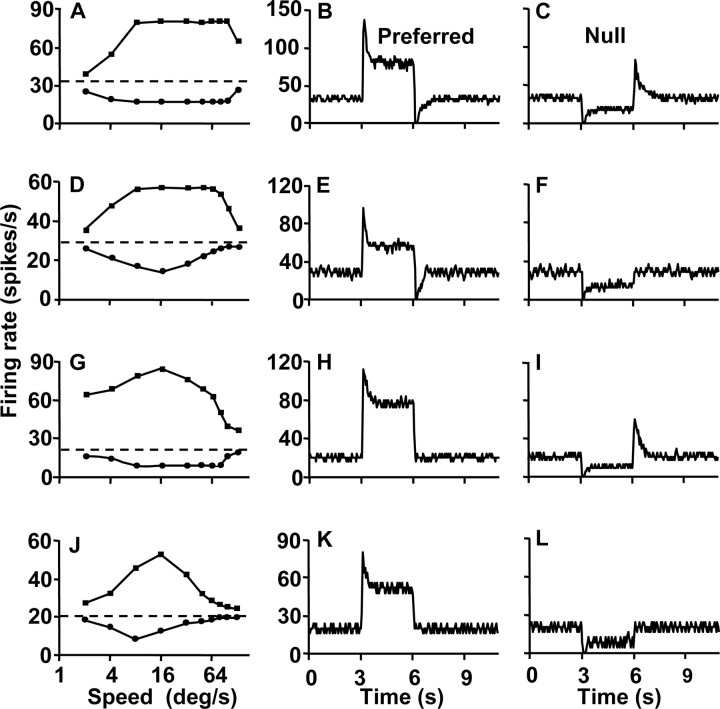
The present study made extracellular recordings from 190 motion-sensitive neurons from the pretectal nucleus lentiformis mesencephali in the pigeon and examined their receptive field organization, speed-tuning curves, and visual responses to stimulus motion at speeds that were constant or smoothly changed over time. We will show that these neurons could be categorized into two groups based on the shape of speed-tuning curves defined by the fluctuation index. A group of 59 cells (31%) was characterized by plateau-shaped speed-tuning curves in the preferred and/or null directions (Fig. 1A,D,G). The remaining 131 cells (69%) possessed bell-shaped speed-tuning curves for stimulus motion in both directions (Fig. 1J). The first group of cells responded to visual acceleration in the direction(s) with the plateau-shaped speed-tuning curve(s), whereas the cells with bell-shaped speed-tuning curves for both directions of motion did not respond to visual acceleration in either direction.
Figure 1.
Speed-tuning curves and transient responses of motion-sensitive neurons in the pigeon nucleus lentiformis mesencephali. Three acceleration-sensitive neurons and one speed-sensitive neuron are shown in the four rows of graphs that demonstrate responses of a pn-cell, p-cell, n-cell, and ss-cell from top to bottom. A, D, G, J, Speed-tuning curves derived by plotting mean response as a function of speed for stimulus motion at constant speed. The horizontal dashed line shows the baseline firing rate at zero speed, and the connected sets of points above and below the dashed line show response to target motion in the preferred and nonpreferred (null) directions. B, E, H, K, Transient responses to the onset and offset of a step of stimulus speed in the preferred direction. C, F, I, L, Transient responses to the onset and offset of a step of stimulus speed in the nonpreferred direction. The stimulus motion began and ended at 3 and 6 sec on the x-axis. Firing rate curves were obtained by averaging five repeats of each stimulus with a bin width of 50 msec.
Properties of speed-tuning curves and responses to steps of stimulus speed
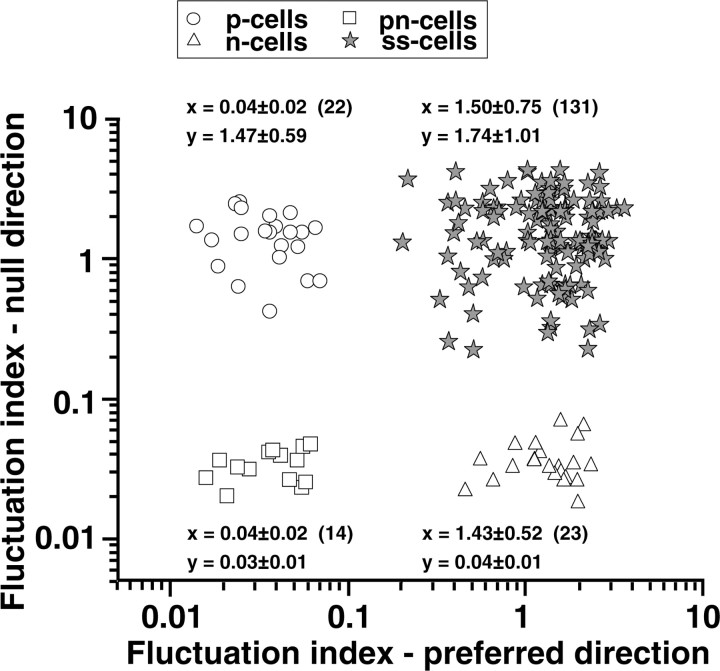
Figure 2 summarizes the shape of the speed-tuning curves for our entire sample of neurons by plotting the fluctuation index for motion in the null direction as a function of that in the preferred direction. The scatter plot shows four separate clusters of neurons, with no hint of a continuum between the groups. We defined tuning curves as bell shaped or plateau shaped depending on whether the fluctuation index was greater or less than 0.1.
Figure 2.
Scatter plot showing classification of 190 pretectal neurons into four distinct groups based on the shape of speed-tuning curves. Each point summarizes the speed-tuning curves of an individual neuron and plots the fluctuation index for motion in the null direction as a function of that for motion in the preferred direction (x-axis). Fluctuation index values given above or below each cluster of points are mean ± SD; numerals in parentheses are the number of neurons examined.
Among the 59 neurons that had plateau-shaped tuning curves, we found neurons characterized by plateau-shaped speed-tuning curves in both the preferred and null directions (24%; pn type) (Fig. 1A), plateau-shaped speed-tuning curves for motion in the preferred direction and upside-down bell-shaped tuning curves in the null direction (37%; p type) (Fig. 1D), and bell-shaped speed-tuning curves in the preferred direction and plateau-shaped speed-tuning curves in the null direction (39%; n type) (Fig. 1G). All 131 neurons of the second group had bell-shaped speed-tuning curves in both the preferred and null directions (ss type) (Fig. 1J).
Within their plateau spans, 14 pn-type cells had an average fluctuation index of 0.04 in the preferred direction and 0.03 in the null direction. The average fluctuation index of 22 p-type cells was also 0.04 for motion in the preferred direction, and that of 23 n-type cells was 0.04 in the null direction. In contrast, the average fluctuation index of 131 neurons with bell-shaped speed-tuning curves was 1.50 in the preferred direction and 1.74 in the null direction (Fig. 2). The classification based on the fluctuation index matched well with visual inspection of graphs of the firing rates of these cells as a function of speed. The span length of the plateau-shaped speed-tuning curves, defined as the speed range over which firing rate varied by <10%, averaged 83 ± 20°/sec.
We observed a consistent relationship between the shape of the speed-tuning curves and the presence of transient responses to the onset or offset of motion at constant speed. That relationship is documented here as a prelude to showing that it is also diagnostic for the presence or absence of responses related to target acceleration or deceleration. All 190 neurons examined in the present study showed a transient burst of firing, followed by a sustained response for the onset of stimulus motion at a constant speed in the preferred direction (Fig. 1B,E,H,K). In addition, the 59 cells that had plateau-shaped speed-tuning curves for stimulus motion in their preferred and/or null directions showed transients in response to the offset of motion in the preferred and/or null direction. The neuron illustrated in Figure 1A-C (pn type) had plateau-shaped speed-tuning curves for motion in both the preferred and nonpreferred directions and showed a negative transient when the preferred direction motion stopped (Fig. 1B) and a positive transient when the null direction motion ceased (Fig. 1C). Comparison across the first three rows of Figure 1 shows that the negative transient for the offset of motion in the preferred direction is linked with plateau-shaped speed-tuning curves in the preferred direction (Fig. 1A,B,D,E). Positive transients for the offset of motion in the nonpreferred direction were linked with plateau-shaped tuning curves for motion in the nonpreferred direction (Fig. 1A,C,G,I). Neurons with bell-shaped speed-tuning curves for both directions of motion failed to show offset transients for either direction of motion (Fig. 1J-L). Below, we summarize these relationships quantitatively across the full sample of neurons.
Examples of acceleration sensitivity of pretectal neurons
As stimulus speed accelerates through a ramp increase or decrease in speed, visual motion neurons might respond only to the sequence of stimulus speeds, as defined by their speed-tuning curves, or they might show an additional response that can be attributed to the stimulus acceleration. The neurons with plateau-shaped speed-tuning curves provide an opportunity to test these two possibilities cleanly because a ramp of target speed along the plateau would not change the firing rate because of target speed. The 59 neurons with plateau-shaped speed-tuning curves in one or both directions were examined for their sensitivity to stimulus acceleration, and all of them consistently produced responses to acceleration or deceleration during stimulus motion in the direction with plateau-shaped speed-tuning curves but not in the direction with bell-shaped speed-tuning curves.
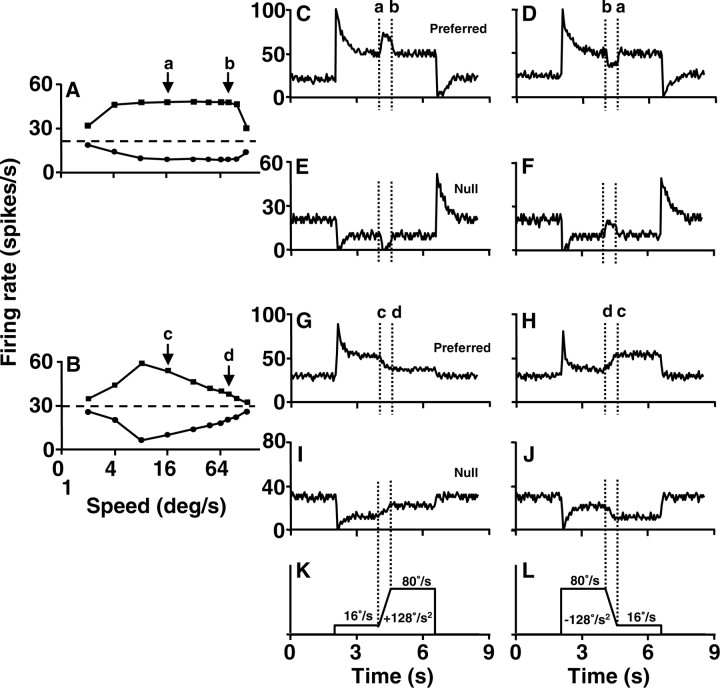
Consider the example neuron illustrated in Figure 3, A and C-F, that had plateau-shaped speed-tuning curves for motion in both the preferred and null directions. Stimulus acceleration or deceleration between 16 and 80°/sec (Fig. 3K,L) along the plateau-shaped speed-tuning curve in the preferred direction (Fig. 3A, interval between a and b) should have caused no change in the speed component of firing rate. However, it did cause pulses of the increased (Fig. 3C, interval between a and b) or decreased (Fig. 3D, interval from b to a) firing rate that appear to be related directly to stimulus acceleration. Similarly, acceleration or deceleration across speeds that fell on the plateau of the speed-tuning curve in the null direction also caused pulses of the decreased (Fig. 3E) or increased (Fig. 3F) firing rate.
Figure 3.
Examples of responses to stimulus acceleration for two pretectal neurons. A, B, Speed-tuning curves like those in the first column of Figure 1, for a pn-cell (A) and an ss-cell (B). C-F, Responses to stimulus acceleration for the pn-cell shown in A. G-J, Responses to stimulus acceleration for the ss-cell shown in B. For each cell, the first and second rows of the firing rate traces show the responses to stimulus motion in the preferred and nonpreferred direction. The first and second columns show responses to smooth target accelerations that caused increases and decreases in the firing rates in the cell in A but not in the cell in B. The changes in the firing rates induced by acceleration or deceleration in G-J are actually attributable to changes in speed along the bell-shaped speed-tuning curves (see Fig. 4). K, L, Trajectories of stimulus speed for the two columns of firing rate traces. The vertical dotted lines in C-L bracket the duration of stimulus acceleration and deceleration. Letters a, b, c, and d with arrows indicate the range and direction of changes in speed along the speed-tuning curves. Each firing rate trace was obtained by averaging nine repeats of a given stimulus with a bin width of 50 msec.
Neurons with bell-shaped speed-tuning curves showed qualitatively different responses to target acceleration and deceleration. Consider the example neuron illustrated in Figure 3, B and G-J. When target speed in the preferred direction was ramped from 16 to 80°/sec, the firing rate underwent a ramp decrease (Fig. 3G, interval between c and d), exactly as would be predicted from the fact that the stimulus speeds moved to the right along the descending limb of the bell-shaped speed-tuning curve, along the extent of speeds between the arrows labeled c and d in Figure 3B. Deceleration from 80 to 16°/sec in the preferred direction caused a ramp increase in the firing rate (Figure 3H, interval between d and c), exactly as would be predicted by moving along the speed-tuning curve from right to left between the arrows labeled d and c in Figure 3B. Similarly, an increase (Fig. 3I) or decrease (Fig. 3J) in firing rate because of the change in stimulus speed appeared during acceleration or deceleration along the upside-down bell-shaped speed-tuning curve for stimulus motion in the null direction (Fig. 3B).
Quantitative analysis of acceleration sensitivity of pretectal neurons
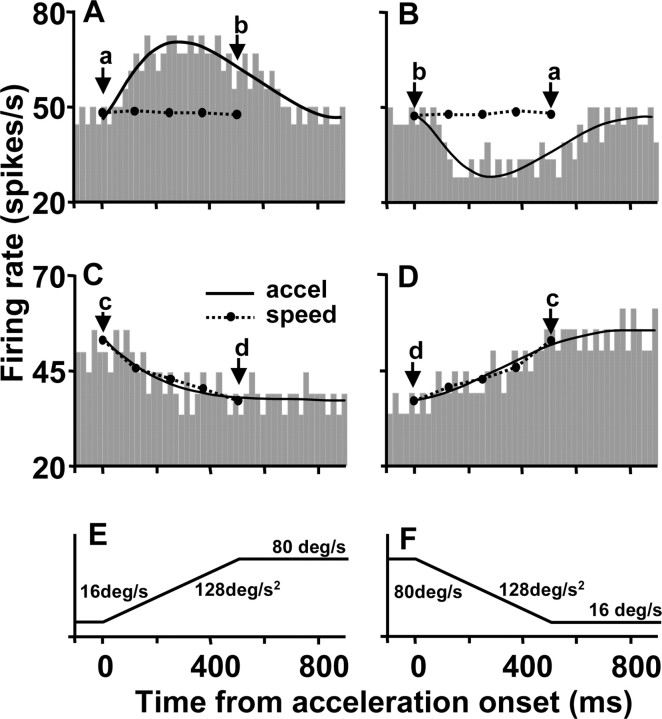
Figure 4 plots the firing rate of the two pretectal neurons from Figure 3 as a function of time during stimulus acceleration and deceleration for motion in the preferred direction. For the neuron with a plateau-shaped speed-tuning curve (Figs. 3A,C,D, 4A,B), the firing rate showed a transient increase or decrease with time courses that paralleled the stimulus acceleration and deceleration, respectively. In contrast to the actual firing rate measured during acceleration and deceleration (histograms), the speed-tuning curves for this neuron predicted that there should be little or no change in firing during the acceleration or deceleration (Fig. 4, solid symbols connected by dotted lines). The predictions were obtained by plotting the firing rate for each speed in the static speed-tuning curves as a function of the time when that speed was traversed during acceleration or deceleration. The actual firing rate was 56% higher or lower than that predicted by the speed-tuning curves. The result was completely different when the same analysis was done for the neuron in Figures 3 (B, G, H) and 4 (C, D). The actual firing rate during acceleration and deceleration (Fig. 4C,D, histograms) followed the exact time course predicted by the static speed-tuning curve (filled symbols connected by dotted lines). Note that the responses of these neurons during stimulus acceleration and deceleration were fitted well by log-normal and polynomial curves for neurons that did and did not fire in relation to stimulus acceleration, respectively.
Figure 4.
Time course of neural responses to target acceleration and deceleration. A, B, Responses of the acceleration-sensitive neuron shown in Figure 3, A and C-F, to acceleration and deceleration in the preferred direction. C, D, Responses of the speed-sensitive neurons shown in Figure 3, B and G-J, to acceleration and deceleration in the preferred direction. E, F, Trajectories of stimulus speed during target accelerations of duration 0.5 sec between 16 and 80°/sec. Histograms show the actual responses of neurons, obtained by averaging nine repeats of a given stimulus with a time bin of 20 msec. Solid curves are log-normal (A, B) or polynomial (C, D) fits to the histograms. Dashed curves with filled symbols represent predictions of the responses to acceleration and deceleration given by the static speed-tuning curve. They were obtained by plotting the firing rate in the static speed-tuning curve as a function of the time when each speed was attained during acceleration.
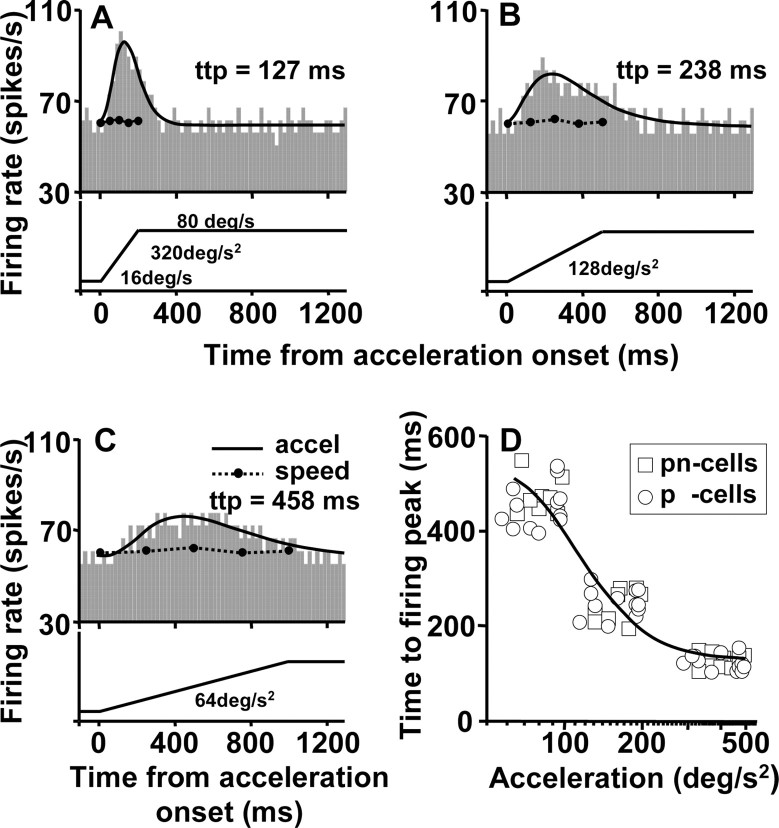
Additional analysis of the responses to stimulus acceleration during motion in the preferred direction indicated that the time taken for the firing rate to reach its peak was shorter for larger acceleration. An example neuron is illustrated in Figure 5, A-C. The time to peak for the log-normal curves fitted to the histograms was 127, 238, and 458 msec for acceleration values of 320, 128, and 64°/sec2, respectively. Figure 5D summarizes the time-to-peak firing for 20 neurons with plateau-shaped speed-tuning curves for stimulus motion in the preferred direction. Our sample was restricted to 20 neurons because we performed this analysis only for the neurons in our sample that showed acceleration responses during target motion in the preferred direction (pnand p-cells) and for which we were able to sample responses to three values of acceleration. Each neuron is represented by three symbols for each of the three different durations of target acceleration. The points plot at different values of acceleration because the span of the acceleration was customized for the span of the plateau in the speed-tuning curve for each neuron. Still, the points cluster into three groups, showing that the time-to-peak response averaged 128, 246, and 462 msec when target acceleration averaged 396, 158, and 79°/sec2, respectively.
Figure 5.
Analysis of the time needed for the firing rate to reach its peak in an acceleration-sensitive neuron. A-C, Responses to stimulus acceleration for accelerations of 320, 128, and 64°/sec2, respectively. Histograms show the actual responses of neurons, obtained by averaging nine repeats of a given stimulus with a time bin of 20 msec. Solid curves show log-normal fits to the histograms. D, Graph showing time to peak as a function of the value of stimulus acceleration. There are three points for each neuron, at low, medium, and high values of stimulus acceleration. The solid curve shows the result of fitting a sigmoid function to the group data.
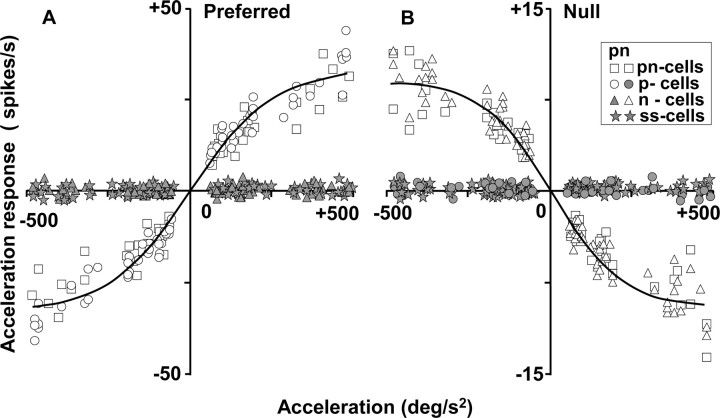
For each of 49 pretectal neurons that were tested during three values of target acceleration and deceleration (8 pn-cells, 12 p-cells, 14 n-cells, and 15 ss-cells), we estimated the response to acceleration as the peak difference between the fits to the histograms and the prediction from the static speed-tuning curve (faccel - fspeed) and plotted these estimates as a function of the magnitude of stimulus acceleration or deceleration (Fig. 6). Each cell was tested for visual responses to acceleration or deceleration at ∼80, 160, and 400°/sec2, where the exact values differed from cell to cell for the reasons given above. For pn- and p-cells (Fig. 6, open squares and circles), the size of the response to acceleration for motion in the preferred direction (Fig. 6A) became more positive as acceleration increased and more negative as deceleration increased. For example, the average response was 12.2 ± 3.0 spikes/sec at an average acceleration value of 79 ± 14°/sec2 and 29.5 ± 6.9 spikes/sec at 396 ± 69°/sec2. For stimulus motion in the null direction, the response to target acceleration and deceleration was examined for pn- and n-cells (Fig. 6B, open squares and triangles). Deceleration from a high speed to a low speed caused a positive response that increased as a function of the magnitude of the deceleration. Acceleration from a low speed to a high speed in the null direction caused negative responses that again increased in magnitude as a function of the magnitude of the acceleration. For example, the average firing rate was decreased by 3.7 ± 0.7 spikes/sec at an average deceleration value of 80 ± 11°/sec2 and by 9.1 ± 2.2 spikes/sec at 400 ± 54°/sec2. Thus, Figure 6 provides a consistent picture of responses to target acceleration and deceleration: for motion in both the preferred and null directions, stimulus acceleration caused a positive neural response whether it either increased speed in the preferred direction or decreased speed in the null direction.
Figure 6.
Quantitative analysis of the relationship of the acceleration response of pretectal neurons to the value of target acceleration for motion in the preferred (A) and null (B) directions. Each graph contains six symbols for each of 49 cells (8 pn-cells, 12 p-cells, 14 n-cells, and 15 ss-cells) because each cell was examined for response to acceleration and deceleration at small, medium, and large values. The solid curves are Boltzmann fits to the data. Open symbols and gray-filled symbols show the responses of neurons that were and were not responsive to stimulus acceleration during motion in the preferred and null directions.
When the same analysis was performed for ss-cells and for the direction of motion with bell-shaped speed-tuning curves in pand n-cells, the data plotted along the x-axis in Figure 6. The p-cells had bell-shaped speed-tuning curves for motion in the null direction, and they are plotted on the x-axis in Figure 6B (filled circles). The n-cells had bell-shaped speed-tuning curves for motion in the preferred direction, and they are plotted on the x-axis in Figure 6A (filled triangles). The ss-cells had bell-shaped speed-tuning curves for motion in both directions, and they plotted on the x-axis in Figure 6, A and B (filled stars). Thus, Figure 6 documents a strong relationship between the presence of a response to target acceleration and the shape of the speed-tuning curves. Responses to acceleration were remarkably consistent across cells for target motion in directions that had plateau-shaped speed-tuning curves and were consistently zero in directions that had bell-shaped speed-tuning curves.
Relationship between response transients and acceleration sensitivity of pretectal neurons
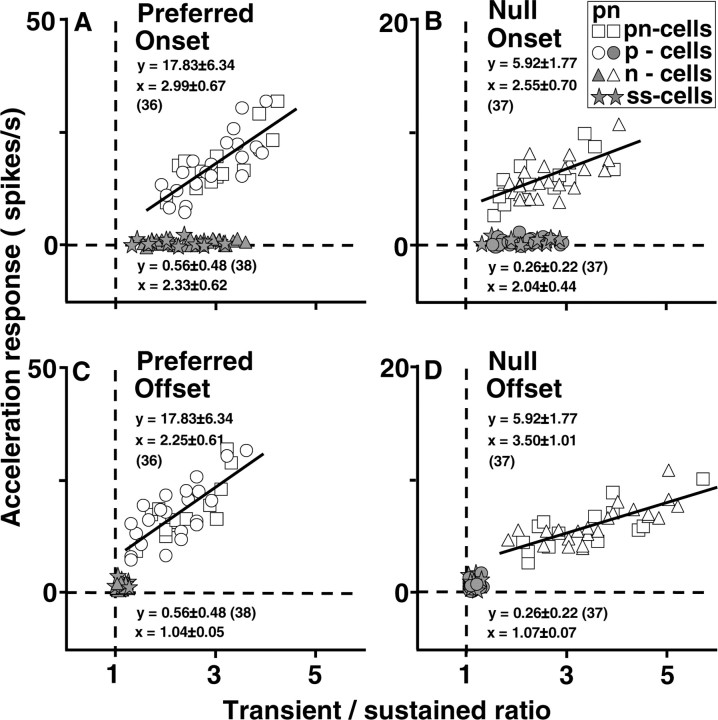
To assess the relationship between the acceleration response of pretectal neurons and their onset and offset transients, we measured the transient/sustained ratio for each neuron separately for the onset and offset of motion in the preferred and null direction. The transient/sustained ratio was defined as the peak change in firing rate within the first 50 msec after the first change in firing rate divided by the steady change in firing rate in the interval from 1000 to 3000 msec after the change. All measurements of transient and sustained response were referenced to the firing rate before the change in stimulus motion. We represented the size of the response to target acceleration as the difference between the peak of the actual firing and that predicted by the static speed-tuning curve for the middle value of the three values of target acceleration in the preferred direction. The data have been summarized in four scatter plots that show the relationship between the acceleration response and the transient/sustained ratio in all 74 pretectal neurons examined for responses to stimulus acceleration (14 pn-cells, 22 p-cells, 23 n-cells, and 15 ss-cells). For the onset of motion in the preferred direction (Fig. 7A), all 74 neurons showed some degree of transient response, although the transient/sustained ratio was generally larger for the neurons with acceleration responses than those without acceleration responses for motion in the preferred direction (2.99 ± 0.67 vs 2.33 ± 0.62). The same general situation appeared for the onset of motion in the null direction (Fig. 7B). The transient/sustained ratio was 2.55 ± 0.70 versus 2.04 ± 0.44 for the neurons with and without acceleration responses for stimulus motion in the null direction. For the offset of motion, in contrast, there was a cluster of points at the intersection of the two dashed lines (Fig. 7C,D), indicating that neurons with no acceleration responses during motion in the preferred or null direction also failed to emit transient responses at the offset of motion in that direction (transient/sustained ratio, ∼1). For the neurons with acceleration responses in the preferred direction, the transient/sustained ratio for the offset of motion in the preferred direction was 2.25 ± 0.61 (Fig. 7C). For the neurons with acceleration responses in the null direction, the transient/sustained ratio for the offset of motion in the null direction was 3.50 ± 1.01 (Fig. 7D). In all four graphs (Figs. 7A-D), there was a linear relationship between the magnitude of the responses to smooth stimulus acceleration and the size of the transient/sustained ratio in neurons with plateau-shaped speed-tuning curves and sensitivity to stimulus acceleration. The correlation coefficients for these neurons in Figure 7, A-D, were 0.79, 0.68, 0.77, and 0.75, respectively; the regression slopes were 7.45, 1.70, 7.70, and 1.32, respectively.
Figure 7.
Relationship between the amplitudes of onset and offset transients and the acceleration responses of 74 pretectal neurons. The responses of 14 pn-cells (squares), 22 p-cells (circles), 23 n-cells (triangles), and 15 ss-cells (stars) are shown. Each neuron contributed one symbol for each graph. The four graphs plot the size of the response to the middle value of stimulus acceleration during target motion in the preferred (A, C) and null (B, D) direction, as a function of the transient/sustained ratio for four different phases of the responses to steps of stimulus speed. A, Onset responses in the preferred direction. B, Onset responses in the null direction. C, Offset responses in the preferred direction. D, Offset responses in the null direction. The lines show the result of regression for neurons with non-zero responses to acceleration. Open symbols and gray filled symbols show the responses of neurons that were and were not responsive to stimulus acceleration in the preferred and null directions. The correlation coefficients in A-D are 0.79, 0.68, 0.77, and 0.75, respectively. Statistical data are shown next to each cluster of symbols, with the number of cells examined given in parentheses.
The relationships outlined in Figure 7 suggest that although all the pretectal neurons examined in the present study produced transient firing at the onset of motion, the onset transient of the acceleration-sensitive neurons contains an acceleration-related component. In contrast, the transient firing at the offset of motion is unique to neural responses to the directions of motion that also have acceleration sensitivity and plateau-shaped speed-tuning curves. The neurons with bell-shaped speed-tuning curves in both the preferred and the null directions produced onset transients but no offset transients at all, and they were not sensitive to acceleration in either direction.
Responses to sine waves of stimulus speed
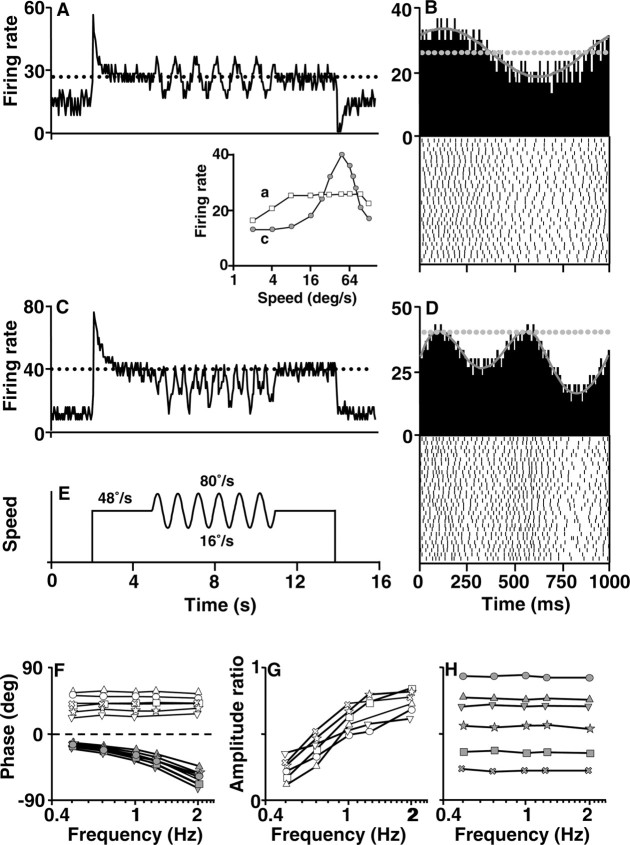
Neurons with sensitivity to target acceleration should have characteristic features when tested with sinusoidal modulations of stimulus speed: the firing rate should lead stimulus speed, and the amplitude of modulation of firing rate should increase as a function of the frequency of the sine wave of target speed. Figure 8 verifies this prediction for neurons in the nucleus lentiformis mesencephali that showed acceleration sensitivity during motion in the preferred direction. When tested with sinusoidal modulation of stimulus speed during stimulus motion in the preferred direction, the exampleacceleration-sensitive neuron in Figure 8 A showed sinusoidal modulation of firing rate that is also clear in the histograms accumulated from multiple cycles of the 1 Hz sine wave (Fig. 8 B). Its speed-tuning curve was plateau shaped (Fig. 8, inset, a). In contrast, the neuron illustrated in Figure 8, C and D, had a bell-shaped speed-tuning curve and showed no sensitivity to stimulus acceleration during ramps of target speed in the preferred direction. For sinusoidal oscillations of target speed, it showed a complicated response that included higher-frequency components. The latter response can be attributed to the peaked speed-tuning curve of this neuron (Fig. 8, inset, c) and the fact that each cycle of the sine wave was taking stimulus speed across the peak of the speed-tuning curve. Because the response of the neuron was related only to stimulus speed, it showed frequency doubling (Lisberger and Movshon, 1999).
Figure 8.
Responses to sinusoidal modulation of target speed for neurons that did and did not respond to the accelerations delivered as ramps of stimulus speed. A, C, Firing rate of acceleration-sensitive (A) and nonsensitive (C) neurons to the stimulus speed profile in E. Traces are the averages of five responses in 50 msec bins. In the inset, squares and circles indicate the speed-tuning curves for the neurons with responses to sinusoidal motion trajectories that appear in A and C, respectively. B, D, Cycle averages and rasters showing the relationship between the sine wave of speed and the firing rate from 30 cycles of motion. The horizontal dashed lines in A-D represent the firing rate evoked by steady motion at the mean speed during the sinusoidal modulation of stimulus speed, which was 48°/sec. F, Phase shift versus stimulus frequency for 12 neurons. Open and gray symbols show responses of six acceleration-sensitive and six nonsensitive cells, respectively. Positive values of phase shift indicate that the firing rate led stimulus speed. G, H, Ratio of neural response amplitude to stimulus amplitude for acceleration-sensitive (G) and nonsensitive (H) cells.
Quantitative analysis of the responses of six neurons that were sensitive to stimulus acceleration in the preferred direction showed that the firing rate peaked in advance of the peak of stimulus speed across the frequency range we tested and the phase lead was not significantly changed as the frequency was increased (F(4,25) = 0.0056; p > 0.5; one-way ANOVA) (Fig. 8F). The modulation of firing rate increased as a function of stimulus frequency (Fig. 8G): the ratio defined as the peak change in firing rate induced by acceleration divided by the steady rate evoked by motion at the plateau or optimal speed increased from ∼20% at 0.5 Hz to 70% at 2 Hz. This relationship was expected because the peak stimulus acceleration increased when the frequency was increased while keeping the peak-to-peak speed constant. In contrast, the symbols below the horizontal dashed line in Figure 8F plot the responses of six neurons that had not shown any sensitivity to target acceleration during ramps of target speed. For sinusoidal variation of target speed, these neurons showed firing rates that lagged stimulus speed (Fig. 8F, symbols below horizontal dashed line), and phase lag increased from -15 to -60° as the frequency of modulation of stimulus speed was increased from 0.5 to 2 Hz. The modulation of firing rate was independent of stimulus frequency (F(4, 25) = 0.0044; p > 0.5; one-way ANOVA) (Fig. 8H).
We analyzed the responses of only 12 neurons during sinusoidal stimulus motion because of the limited duration of recordings from these neurons and our choice to evaluate their responses primarily during transient stimulus accelerations. However, the consistency of the responses to sinusoidal target motion in the 12 neurons, and their clear relationship to the responses recorded during accelerations caused by ramps of target speed, implies that a larger sample would have revealed the same division into two groups.
Recording sites
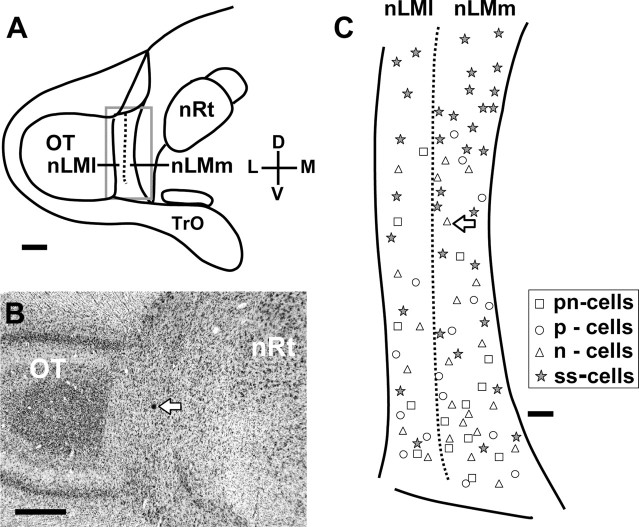
The recording sites of 53 acceleration-sensitive cells (14 pn-cells, 16 p-cells, and 23 n-cells) and 34 speed-sensitive cells were marked with dye and all localized within the nucleus lentiformis mesencephali (Fig. 9). Most of the acceleration-sensitive (70%) and speed-sensitive (74%) cells were located in the medial or magnocellular division and others (30% acceleration-sensitive cells vs 26% speed-sensitive cells) in the lateral or parvocellular division of the pretectal nucleus. It seems that the locations of pn-, p-, and n-cells may be not type dependent in the nucleus. If the nucleus was divided dorsoventrally into three length-equal parts, the percentage of these locations in the dorsal, middle, and ventral parts of the pretectal nucleus was 13, 25, and 62% for the acceleration-sensitive cells and 53, 29, and 18% for the speed-sensitive cells, respectively. Thus, there is some degree of functional segregation in the pretectal nucleus in terms of selectivity to different parameters of visual stimulus motion.
Figure 9.
Topographic distribution of the recording sites of 53 acceleration-sensitive neurons and 34 acceleration-insensitive neurons in the pigeon's nucleus lentiformis mesencephali (nLM), which is divided into medial or magnocellular (nLMm) and lateral or parvocellular (nLMl) divisions. A, Schematic diagram shows the location of nLM in a cross section of the pigeon's brain. The area framed by a rectangle is enlarged in C showing the distribution. B, Histological cross section shows the dye-marked location of an acceleration-sensitive neuron in nLM (C, arrow). OT, Optic tectum; nRt, nucleus rotundus; Tro, optic tract; D, dorsal; L, lateral; V, ventral; M, medial. Scale bars: A, B, 1 mm; C, 200 μm.
Discussion
The present study provides electrophysiological evidence that the visual system in birds contains specific acceleration detectors. These detectors are sensitive to the temporal derivative of motion speeds but not to speed itself across a wide range of speeds. The view that a subset of pretectal neurons is sensitive to stimulus acceleration was supported in our data by the internal consistency of their responses to step changes in stimulus speed (onset and offset transients), ramp changes in stimulus speed (smooth accelerations), and sine wave modulations of stimulus speed. The acceleration-sensitive neurons are characterized by an unusual plateau-shaped speed-tuning curve, which allows them to unambiguously detect changes in speeds over time over the range defined by the plateau. It seems likely that the plateau-shaped speed-tuning curve is an adaptation that is directly related to sensing stimulus acceleration, and it was striking to us that some neurons showed plateau-shaped tuning curves and acceleration sensitivity for motion in one direction paired with a peaked tuning curve and acceleration insensitivity for motion in the opposite direction. We doubt that the visual responses to acceleration are attributable to “jerk” defined as the rate of changes in acceleration in previous studies on the vestibular system (Angelaki et al., 1993; Jones et al., 1998) because the acceleration we used is constant.
Our data have provided evidence that stimulus acceleration is represented in a rate code (i.e., in the firing rates of individual neurons in the nucleus lentiformis mesencephali). This contrasts with the responses of neurons in area MT of the monkey. Monkey MT neurons have bell-shaped speed-tuning curves (Maunsell and Van Essen, 1983; Liu and Newsome, 2003), and individual neurons do not appear to code stimulus acceleration in their firing rates. However, the acceleration of visual motion can be decoded from the population response of MT neurons (Lisberger and Movshon, 1999), implying that it is represented in the population response but not in the response of individual neurons. It would be interesting to know whether some neurons in the monkey homolog of the nucleus lentiformis mesencephali, in the pretectum, would show plateau-shaped speed-tuning curves and sensitivities to stimulus acceleration like those recorded in pigeons.
All of the pretectal neurons in our sample showed some degree of transient responses to the onset of stimulus motion, regardless of whether they were acceleration-sensitive or -insensitive neurons. Thus, onset transients are not necessarily linked to acceleration responses. However, the transient/sustained ratios at the onset of motion in the preferred direction were larger in the acceleration-sensitive neurons, and the value of the transient/sustained ratio was related to the amount of acceleration responsiveness, indicating that part of the transient is related to the presence of response to stimulus acceleration. Previous studies have shown that many directional cells produce transient responses to the onset of motion (Ibbotson et al., 1998; Lisberger and Movshon, 1999; Wylie and Crowder, 2000; Priebe and Lisberger, 2002) and to the appearance of a stationary pattern (Müller et al., 2001; Gu et al., 2002). The onset transients in these cases could convey information about stimulus motion or edge detection (Awatramani and Slaughter, 2000) and may originate from the retinal bipolar cells and/or some synaptic mechanisms (Awatramani and Slaughter, 2000; Müller et al., 2001). The transient responses of acceleration-sensitive neurons to the offset of motion are a unique feature of their responses that is linked to their acceleration sensitivity. The importance of this link is emphasized by the finding that larger offset transients were associated with larger acceleration responses. In previous studies, offset responses after prolonged stimulation have been attributed to neuronal adaptation (Petersen et al., 1985; Hammond et al., 1988; Ibbotson et al., 1998).
Perceptual performance may depend on sensory activity in a small number of neurons best tuned to the stimulus and/or on information contained in the population response of a large number of neurons that vary widely in their properties (Britten and Newsome, 1998). The present study indicates that two-thirds of pretectal cells are selective for the direction and speed of motion and one-third of pretectal cells are additionally tuned to the acceleration of visual motion. Therefore, optokinetic nystagmus is most likely to be guided by visual information contained in the population response of pretectal neurons to all the parameters of motion including direction, speed, and acceleration. It is also conceivable that sensing visual acceleration is also particularly important for the stabilization of flight in flying birds such as pigeons.
Self-motion detection by humans and animals requires multi-modal interaction between visual, vestibular, and somatosensory information (Fukushima and Fukushima, 1991; Bremmer et al., 2002; Nishiike et al., 2002; Schlack et al., 2002). The vestibular and visual systems not only share a spatial reference frame (Miles, 1984; Wylie et al., 1998) but also have some physiological properties in common. For example, both the vestibular receptors and optokinetic neurons show high levels of spontaneous activity and encode stimulus motion direction. We have added an additional parallel between the vestibular and visual neurons in the optokinetic system. They are both sensitive to acceleration, although their physiological modalities (mechanical vs. visual) are quite different (Klinke, 1978; Fu et al., 1998a,b; Wylie and Crowder, 2000; Ibbotson and Price, 2001).
Footnotes
This work was supported by the National Natural Science Foundation of China Project 90208008 and the Chinese Academy of Sciences Brain-Mind Project. We sincerely thank Prof. Stephen G. Lisberger of the Howard Hughes Medical Institute and the University of California at San Francisco (San Francisco, CA) for invaluable and generous comments on this manuscript and Dr. Yu-Xi Fu and Hui-Jing Yuan for writing the computer programs.
Correspondence should be addressed to Dr. Shu-Rong Wang, Laboratory for Visual Information Processing, Institute of Biophysics, Chinese Academy of Sciences, 15 Datun Road, Beijing 100101, China. E-mail: wangsr@sun5.ibp.ac.cn, srwang@hotmail.com.
Copyright © 2004 Society for Neuroscience 0270-6474/04/247690-09$15.00/0
References
- Angelaki DE, Bush GA, Perachio AA (1993) Two-dimensional spatiotemporal coding of linear acceleration in vestibular nuclei neurons. J Neurosci 13: 1403-1417. [DOI] [PMC free article] [PubMed] [Google Scholar]
- Awatramani GB, Slaughter MM (2000) Origin of transient and sustained responses in ganglion cells of the retina. J Neurosci 20: 7087-7095. [DOI] [PMC free article] [PubMed] [Google Scholar]
- Bremmer F, Klam F, Duhamel JR, Ben Hamed S, Graf W (2002) Visual-vestibular interactive responses in the macaque ventral intraparietal area (VIP). Eur J Neurosci 16: 1569-1586. [DOI] [PubMed] [Google Scholar]
- Britten KH, Newsome WT (1998) Tuning bandwidths for near-threshold stimuli in area MT. J Neurophysiol 80: 762-770. [DOI] [PubMed] [Google Scholar]
- Britto LR, Gasparotto OC, Hamassaki DE (1990) Visual telencephalon modulates directional selectivity of accessory optic neurons in pigeons. Vis Neurosci 4: 3-10. [DOI] [PubMed] [Google Scholar]
- Clifford CW, Ibbotson MR (2003) Fundamental mechanisms of visual motion detection: models, cells and functions. Prog Neurobiol 68: 409-437. [DOI] [PubMed] [Google Scholar]
- Crowder NA, Lehmann H, Parent MB, Wylie DRW (2003) The accessory optic system contributes to the spatio-temporal tuning of motion-sensitive pretectal neurons. J Neurophysiol 90: 1140-1151. [DOI] [PubMed] [Google Scholar]
- Erichsen JT, Hodos W, Evinger C, Bessette BB, Phillips SJ (1989) Head orientation in pigeon: postral, locomotor and visual determinants. Brain Behav Evol 33: 268-278. [DOI] [PubMed] [Google Scholar]
- Fite KV (1985) Pretectal and accessory-optic visual nuclei of fish, amphibia and reptiles: themes and variations. Brain Behav Evol 26: 71-90. [DOI] [PubMed] [Google Scholar]
- Frost BJ, Wylie DR, Wang YC (1990) The processing of object and self-motion in the tectofugal and accessory optic pathways of birds. Vision Res 30: 1677-1688. [DOI] [PubMed] [Google Scholar]
- Fu YX, Gao HF, Guo MW, Wang SR (1998a) Receptive field properties of visual neurons in the avian nucleus lentiformis mesencephali. Exp Brain Res 118: 279-285. [DOI] [PubMed] [Google Scholar]
- Fu YX, Xiao Q, Gao HF, Wang SR (1998b) Stimulus features eliciting visual responses from neurons in the nucleus lentiformis mesencephali in pigeons. Vis Neurosci 15: 1079-1087. [DOI] [PubMed] [Google Scholar]
- Fukushima K, Fukushima J (1991) Otolith-visual interaction in the control of eye movement produced by sinusoidal vertical linear acceleration in alert cats. Exp Brain Res 85: 36-44. [DOI] [PubMed] [Google Scholar]
- Gu Y, Wang Y, Wang SR (2001) Directional modulation of visual responses of pretectal neurons by accessory optic neurons in pigeons. Neuroscience 104: 153-159. [DOI] [PubMed] [Google Scholar]
- Gu Y, Wang Y, Wang SR (2002) Visual responses of neurons in the nucleus of the basal optic root to stationary stimuli in pigeons. J Neurosci Res 67: 698-704. [DOI] [PubMed] [Google Scholar]
- Hammond P, Mouat GSV, Smith AT (1988) Neural correlates of motion aftereffects in cat striate cortical neurons: monocular adaptation. Exp Brain Res 72: 1-20. [DOI] [PubMed] [Google Scholar]
- Hoffmann KP, Distler C (1989) Quantitative analysis of visual receptive fields of neurons in nucleus of the optic tract and dorsal terminal nucleus of the accessory optic tract in macaque monkeys. J Neurophysiol 62: 416-428. [DOI] [PubMed] [Google Scholar]
- Ibbotson MR, Price NS (2001) Spatiotemporal tuning of directional neurons in mammalian and avian pretectum: a comparison of physiological properties. J Neurophysiol 86: 2621-2624. [DOI] [PubMed] [Google Scholar]
- Ibbotson MR, Clifford CW, Mark RF (1998) Adaptation to visual motion in directional neurons of the nucleus of the optic tract. J Neurophysiol 79: 1481-1493. [DOI] [PubMed] [Google Scholar]
- Jones TA, Jones SM, Colbert S (1998) The adequate stimulus for avian short latency vestibular responses to linear translation. J Vestib Res 8: 253-272. [PubMed] [Google Scholar]
- Karten HJ, Hodos W (1967) A stereotaxic atlas of the brain of the pigeon (Columba livia). Baltimore: Johns Hopkins UP.
- Klauer S, Sengpiel F, Hoffmann KP (1990) Visual response properties and afferents of the nucleus of the optic tract in the ferret. Exp Brain Res 83: 178-189. [DOI] [PubMed] [Google Scholar]
- Klinke R (1978) Physiology of the sense of equilibrium. In: Fundamentals of sensory physiology (Schmidt RF, ed), pp 205-217. Heidelberg: Springer.
- Krauzlis RJ, Lisberger SG (1994) A model of visually-guided smooth pursuit eye movements based on behavioral observations. J Comput Neurosci 1: 265-283. [DOI] [PubMed] [Google Scholar]
- Li Z, Fite KV, Montgomery NM, Wang SR (1996) Single-unit responses to whole-field visual stimulation in the pretectum of Rana pipiens Neurosci Lett 218: 193-197. [DOI] [PubMed] [Google Scholar]
- Lisberger SG, Movshon JA (1999) Visual motion analysis for pursuit eye movements in area MT of macaque monkeys. J Neurosci 19: 2224-2246. [DOI] [PMC free article] [PubMed] [Google Scholar]
- Liu J, Newsome WT (2003) Functional organization of speed tuned neurons in visual area MT. J Neurophysiol 89: 246-256. [DOI] [PubMed] [Google Scholar]
- Maunsell JH, Van Essen DC (1983) Functional properties of neurons in middle temporal visual area of the macaque monkey. I. Selectivity for stimulus direction, speed, and orientation. J Neurophysiol 49: 1127-1147. [DOI] [PubMed] [Google Scholar]
- McKenna OC, Wallman J (1985) Accessory optic system and pretectum of birds: comparisons with those of other vertebrates. Brain Behav Evol 26: 91-116. [DOI] [PubMed] [Google Scholar]
- Miles FA (1984) Sensing self-motion: visual and vestibular mechanisms share the same frame of reference. Trends Neurosci 7: 303-305. [Google Scholar]
- Müller JR, Metha AB, Krauskopf J, Lennie P (2001) Information conveyed by onset transients in responses of striate cortical neurons. J Neurosci 21: 6978-6990. [DOI] [PMC free article] [PubMed] [Google Scholar]
- Mustari MJ, Fuchs AF (1989) Response properties of single units in the lateral terminal nucleus of the accessory optic system in the behaving primate. J Neurophysiol 61: 1207-1220. [DOI] [PubMed] [Google Scholar]
- Natal CL, Britto LR (1987) The pretectal nucleus of the optic tract modulates the direction selectivity of accessory optic neurons in rats. Brain Res 419: 320-323. [DOI] [PubMed] [Google Scholar]
- Nishiike S, Nakagawa S, Nakagawa A, Uno A, Tonoike M, Takeda N, Kubo T (2002) Magnetic cortical responses evoked by visual linear forward acceleration. NeuroReport 13: 1805-1808. [DOI] [PubMed] [Google Scholar]
- Petersen SE, Baker JF, Allman JM (1985) Direction-specific adaptation in area MT of the owl monkey. Brain Res 346: 146-150. [DOI] [PubMed] [Google Scholar]
- Priebe NJ, Lisberger SG (2002) Constraints on the source of short-term motion adaptation in macaque area MT. II. Tuning of neural circuit mechanisms. J Neurophysiol 88: 370-382. [DOI] [PMC free article] [PubMed] [Google Scholar]
- Schlack A, Hoffmann KP, Bremmer F (2002) Interaction of linear vestibular and visual stimulation in the macaque ventral intraparietal area (VIP). Eur J Neurosci 16: 1877-1886. [DOI] [PubMed] [Google Scholar]
- Soodak RE, Simpson JI (1988) The accessory optic system of rabbit. I. Basic visual response properties. J Neurophysiol 60: 2037-2054. [DOI] [PubMed] [Google Scholar]
- Wang Y, Gu Y, Wang SR (2001) Directional responses of basal optic neurons are modulated by the nucleus lentiformis mesencephali in pigeons. Neurosci Lett 311: 33-36. [DOI] [PubMed] [Google Scholar]
- Winterson BJ, Brauth SE (1985) Direction-selective single units in the nucleus lentiformis mesencephali of the pigeon (Columba livia). Exp Brain Res 60: 215-226. [DOI] [PubMed] [Google Scholar]
- Wolf-Oberhollenzer F, Kirschfeld K (1994) Motion sensitivity in the nucleus of the basal optic root of the pigeon. J Neurophysiol 71: 1559-1573. [DOI] [PubMed] [Google Scholar]
- Wylie DR, Crowder NA (2000) Spatiotemporal properties of fast and slow neurons in the pretectal nucleus lentiformis mesencephali in pigeons. J Neurophysiol 84: 2529-2540. [DOI] [PubMed] [Google Scholar]
- Wylie DR, Bischof WF, Frost BJ (1998) Common reference frame for neural coding of translational and rotational optic flow. Nature 392: 278-282. [DOI] [PubMed] [Google Scholar]
- Zhang T, Fu YX, Hu J, Wang SR (1999) Receptive field properties of visual neurons in the nucleus of the basal optic root in pigeons. Neuroscience 91: 33-40. [DOI] [PubMed] [Google Scholar]


