

Abstract
To obtain a more complete description of individual neurons, it is necessary to complement the electrical patch pipette measurements with technologies that permit a massive parallel recording from many sites on neuronal processes. This can be achieved by using voltage imaging with intracellular dyes. With this approach, we investigated the functional structure of a mitral cell, the principal output neuron in the rat olfactory bulb. The most significant finding concerns the characteristics of EPSPs at the synaptic sites and surprisingly small attenuation along the trunk of the primary dendrite. Also, the experiments were performed to determine the number, location, and stability of spike trigger zones, the excitability of terminal dendritic branches, and the pattern and nature of spike initiation and propagation in the primary and secondary dendrites. The results show that optical data can be used to deduce the amplitude and shape of the EPSPs evoked by olfactory nerve stimulation at the site of origin (glomerular tuft) and to determine its attenuation along the entire length of the primary dendrite. This attenuation corresponds to an unusually large mean apparent “length constant” of the primary dendrite. Furthermore, the images of spike trigger zones showed that an action potential can be initiated in three different compartments of the mitral cell: the soma-axon region, the primary dendrite trunk, and the terminal dendritic tuft, which appears to be fully excitable. Finally, secondary dendrites clearly support the active propagation of action potentials.
Keywords: mitral cells, voltage imaging, voltage-sensitive dyes, dendrites, synaptic integration, olfaction
Introduction
Understanding the biophysical properties of single neurons and how they process information is fundamental to understanding how the brain works; however, the detailed functional structure of nerve cells is not fully understood. For a more complete description of nerve cells, it is necessary to complement the patch-electrode approach with technologies that permit parallel recording from many sites on neuronal processes. This can be achieved by using voltage imaging, a fast multisite optical measurement with intracellular voltage-sensitive dyes (Zecevic, 1996; Antic et al., 1999, 2000).
We used voltage imaging to examine individual mitral cells from the rat olfactory bulb. Mitral cells directly receive information from olfactory receptor neurons and play a central role in the integration of odor information in the olfactory bulb. They have been studied in considerable detail (Shepherd et al., 2004). These studies include anatomical characteristics (Pinching and Powell, 1971, 1972; Mori and Yoshihara, 1995; Lodovichi et al., 2003), pioneering work and additional studies on regional electrical characteristics of mitral cells (Bischofberger and Jonas, 1997; Chen et al., 1997; Christie and Westbrook, 2003; Debarbieux et al., 2003), synaptic interactions with sensory neurons and local neurons of the olfactory bulb (Nicoll, 1971; Nowycky et al., 1981; Carlson et al., 2000; Urban and Sakmann, 2002), and properties of mitral cell responses to electrical and odorant stimulation (Freeman, 1974; Harrison and Scott, 1986; Hamilton and Kauer, 1989; Charpak et al., 2001; Margrie et al., 2001; Wachowiak and Cohen, 2001; Cang and Isaacson, 2003; Margrie and Schaefer, 2003; Xu et al., 2003). The results of these studies show that mitral cells are complex operational units. It is tempting to hypothesize that additional information on regional electrical properties might allow full understanding of the anatomical and electrical structure of mitral cells in functional terms.
At present, the exact correlation between the anatomical structure and the function of mitral cells as well as their precise computational task are not known. It has been hypothesized, in general terms, that information is processed at two different levels by the mitral cell: in the glomerular layer and at the level of the soma and secondary dendrites in the external plexiform layer. The full experimental verification of this hypothesis requires spatially well resolved recording from multiple sites on mitral cell processes. In this work, we used voltage imaging to investigate the following five questions, which were not possible to resolve with conventional recording methods. (1) What are the basic characteristics of the evoked EPSP at the site of origin and its attenuation in the primary dendrite? (2) What are the number, location, and stability of spike trigger zones? (3) What is the level of excitability of dendritic branches in the tuft? (4) What is the pattern of spike initiation and propagation in the primary dendrite? (5) What is the nature of action potential (AP) propagation (passive or active) in the secondary dendrites? Answering these questions is a prerequisite for the accurate quantitative understanding (numerical simulation) of the input-output function of mitral cells.
Materials and Methods
Slices, patch-clamp recording, and intracellular application of the dye. Experiments were performed on olfactory bulb slices from 18- to 30-d-old Sprague Dawley rats. The animals were decapitated after halothane anesthesia, and 400-μm-thick horizontal slices were cut in ice-cold solution using a custom-made rotary slicer with ceramic circular blade (Specialty Blades Inc., Staunton, VA) rotating at 70 rmp. Slices were incubated at 35°C for 30 min and thereafter maintained at room temperature (23-25°C). All measurements were done at room temperature. The extracellular solution used during slicing and recording contained (in mm): 125 NaCl, 25 NaHCO3, 20 glucose, 2.5 KCl, 1.25 NaH2PO4, 2 CaCl2, and 1 MgCl2, pH 7.4, when bubbled with oxygen (95% O2, 5%CO2). Somatic whole-cell recordings were made with 3-6 MΩ patch pipettes using an Axopatch 200B or a Multiclamp 700A amplifier (Axon Instruments, Union City, CA). The pipette solution contained (in mm): 115 potassium-gluconate or potassium-methyl-sulfate, 20 KCl, 4 Mg-ATP, 10 phosphocreatine, 0.3 Na-GTP, 10 HEPES, pH 7.3, adjusted with KOH, and 1 mg/ml of the voltage-sensitive dye JPW3028 [the di-methyl analog of JPW1114 (Antic and Zecevic, 1995)]. Mitral cells can easily be distinguished and “patched” under visual control using infrared DIC video microscopy on an upright microscope (Model Eclipse E600FN; Nikon, Tokyo, Japan).
Glass pipettes were first filled from the tip with dye-free solution by applying negative pressure for ∼1 min and then back-filled with dye solution. The dye JPW3028 is a doubly positively charged analog of the (aminostyryl) pyridinium series of lipophilic voltage-sensitive dyes that is still sufficiently water soluble to be used for microinjection. Its close analog is available from Molecular Probes (Eugene, OR) as D-6923 (Antic and Zecevic, 1995; Zecevic, 1996). Dye-free solution in the tip was necessary because a major problem in injecting vertebrate neurons with fluorescent dyes from patch pipettes is the leakage of the dye from the electrode into the extracellular medium before the electrode is attached to the neuron. The amount of dye-free solution was adjusted to ensure that no dye leaks from the electrode before a cell is attached to the tip, but the dye solution has to be sufficiently close to the tip for the staining to take place within ∼1 hr. It was possible to load mitral cells with voltage-sensitive dye without increasing the background fluorescence of the surrounding tissue. Intracellular staining was completed by free diffusion of the dye into the soma within 15-60 min, depending on the electrode resistance. After diffusion of the dye into the soma was completed, the patch electrode with the dye was carefully detached from the neuron by forming an outside-out patch, and the preparation was typically incubated for 2 hr at room temperature to allow for the dye to spread into distal processes. The slow spread of the dye is not caused by the size of the dye molecule because other dyes of similar size can diffuse very quickly (Grinvald et al., 1987; Antic and Zecevic, 1995). The spread of JPW3028 is apparently limited by its high affinity for lipid membranes. To obtain simultaneous electrical recording from the soma, the cell body was repatched before making optical measurements in most of our experiments.
Antidromic or synaptically evoked action potentials were initiated in mitral cells by single volleys delivered through miniature extracellular stimulating electrodes (bipolar, concentric, Model MCE-100; Rhodes Medical Instruments, Woodland Hills, CA) placed in the external plexiform layer and the olfactory nerve layer.
Optical recording. We used a stationary stage upright microscope equipped with two camera ports. One camera port had a standard high-resolution CCD camera for DIC video-microscopy. The other camera port had a fast data acquisition camera. In the initial experiments we used the NeuroCCD Imaging System (RedShirtImaging, Fairfield, CT) based on a Pixel Vision FastOne camera (80 × 80 pixels; back-illuminated, cooled CCD characterized by 2.7 kHz full-frame rate, 14 bit A-to-D resolution, well depth of 300,000 electrons/msec, frame shift time of 26 μsec, and a read noise of 35 electrons rms at 1 kHz frame rate). This system was replaced by a camera with lower read noise (nine electrons rms at 1 kHz frame rate), a possibility to increase the frame rate from 2 kHz (full frame) to 3 kHz (2 × 2 binned) and 5 kHz (3 × 3 binned), and faster frame shift time (7 μsec) (NeuroCCD-SM, RedShirtImaging). The analysis and display of data were made using the NeuroPlex program (RedShirtImaging) written in IDL (Interactive Data Language, Research Systems, Boulder, CO) running on an IBM-PC computer. The brain slice was placed on the stage of the microscope and the fluorescent image of the stained cell was projected by a water-immersion objective [40×/0.9 numerical aperture (NA), Nikon or 60×/1 NA, Nikon] via an optical coupler (0.1×) onto the CCD chip. The spatial resolution in voltage imaging is determined by the magnification of the objective and the number of pixels of the CCD chip and is ultimately limited by the light-scattering properties of the preparation. In our experiments, the spatial resolution could be further improved by using higher-magnification objectives, for example 100×, or different optical couplers that will increase magnification. Higher spatial resolution, however, comes at the expense of signal-to-noise ratio. Furthermore, with higher magnification a smaller fraction of the cell would be projected onto the CCD. Thus, the 40× and 60× objectives were selected as a compromise between imaging area, spatial resolution, and the signal-to-noise ratio.
A 250 W xenon, short-gap arc lamp (Osram, XBO 250 W/CR ORF) powered by a low-ripple power supply (Model 1700XT/A; Opti-Quip, Highland Mills, NY) was used as a source for excitation light. The best signals were obtained using an excitation interference filter of 520 ± 45 nm, a dichroic mirror with the central wavelength of 570 nm, and a 610 nm barrier filter (a Schott RG610).
With the sensitivity of the intracellular dyes used (1-6% ΔF/F per 100 mV in recording from dendritic processes), relatively good signal-to-noise ratios could be obtained in single-trial recordings with modest spatial averaging (see Fig. 2) from regions on terminal branches of the primary dendrite (tuft) as well as from the regions on secondary dendrites that were >1000 μm away from the soma. It was possible to monitor, at multiple sites, both action potentials and subthreshold synaptic potentials. Signal averaging, both spatial and temporal, was used where possible to improve the signal-to-noise ratio. The dominant noise in recording from the most distal neuronal processes in our experiments was independent of light intensity and determined by the read noise of the CCD camera. This is an important methodological aspect, implying that cameras with lower dark noise, when they become available, will improve the sensitivity of voltage imaging in a linear manner until the shot noise becomes dominant (Wu and Cohen, 1993).
Figure 2.

Spatial resolution and sensitivity of voltage imaging. A, Low resolution (top) and high resolution image (bottom) of the terminal dendritic tuft. B, Recordings of action potential signals from four individual locations on the dendritic tuft in single-trial measurements (no averaging). C, The signal-to-noise ratio with spatial averaging of four pixels from B. D, The signal-to-noise ratio with spatial averaging of the entire tuft area. E, An evoked EPSP recorded from 4 individual locations on the dendritic tuft; 20 trials were averaged. F, Spatial average of four pixels shown in E. G, Spatial average of the entire tuft area.
Slow changes in light intensity caused by bleaching of the dye (see Fig. 4C, exponentially decaying baseline) were ∼100 times slower than the rising phase of an action potential and had no effect on timing information used to draw conclusions in this work. This was confirmed by correcting for the bleaching effect by subtracting an appropriate exponential function derived from the recording trials with no stimulation. All traces in Figures 2 and 3 were corrected for bleaching. The data in the other Figures were not corrected for bleaching.
Figure 4.

Voltage imaging of the spike initiation and propagation pattern in a mitral cell stained with voltage-sensitive dye. The two consecutive spikes evoked by a single stimulus have different initiation sites and propagation patterns. A, A composite image of a mitral cell obtained with a conventional high-resolution CCD camera. Soma, primary dendrite (d′), terminal dendritic tuft, and a secondary dendrite (d″) are clearly visible in this fluorescence measurement. B, Single frame recording of the same cell obtained with a fast low resolution (80 × 80 pixels) CCD camera used for voltage imaging. C, Optical recording of action potentials evoked by olfactory nerve stimulation (single volley, 40 μA, 0.1 msec) obtained simultaneously from three different regions (B, red, blue, and green rectangles). D, The propagation of the first of the two spikes shown in C; expanded time scale. The earliest action potential (red trace) was initiated in the tuft and propagated toward the soma (blue trace) and secondary dendrite (green trace). The spike occurred with a delay of 2 msec in the distal part of secondary dendrite, ∼300 μm away from the soma. The propagation delay and the constant shape of the spike indicate active propagation. Action potential signals are scaled to the same height. E, The recordings from two selected locations [tuft (red) and soma (blue)] on the expanded time scale used to determine the propagation velocity of the first spike. F, Color-coded representation of the data showing spatial and temporal dynamics of the first synaptically evoked spike from C. The peak of the action potential, in this and all subsequent figures, is shown in red. Consecutive frames represent data points around the peak of the action potential separated by 0.37 msec. The first action potential was clearly initiated in the tuft (red arrow) and propagated to the soma. G, The recordings from two selected locations [tuft (red) and soma (blue)] on the expanded time scale used to determine the propagation velocity of the second spike. H, Color-coded representation of the data showing spatial and temporal dynamics of the second synaptically evoked spike from C. The second spike was initiated in the soma (red arrow) andpropagated to the tuft.
Figure 3.

Voltage imaging of the EPSP from the terminal tuft and along the primary dendrite. A, High- and low-resolution image of a mitral cell. B, Single-trial optical recordings from 10 different regions on the primary and oblique dendrites showing signals corresponding to an evoked action potential. The colored rectangles indicate pixels averaged to obtain traces 1-10. The amplitude of the action potential measured from the soma by a patch electrode was 93 mV (resting potential-to-peak). The amplitude of optical signals (ΔF/F) corresponding to a spike of constant size varied with the location (1-10) because of unequal sensitivity of the optical measurement from different locations. The sensitivity profile, determined from action potential measurements, provides a calibration for the conversion of optical signals to membrane potential changes. In the measurements shown, the calibration factors (from the tuft to the most proximal part of the primary dendrite) are 1; 0.74; 0.56; 0.63; 0.53; 0.38; 0.40; 0.32 and 0.47 for the left and 0.59 for the right oblique branch. C, Calibration of optical signals (ΔF/F) in terms of membrane potential (in millivolts). All traces represent the average output of the same group of 35 pixels that receive light from the dendritic tuft (red rectangles in A). Twenty trials were averaged to improve the signal-to-noise ratio. Trace 1 shows an optical signal corresponding to an action potential (red trace) of 93 mV used as a calibration standard. Trace 2 is a subthreshold EPSP signal evoked by olfactory nerve stimulation and calibrated to be 9 mV in amplitude at the site of origin (tuft). Trace 3 shows a threshold EPSP signal recorded from the tuft after the action potential was blocked by intracellular application of QX-314. In the measurement shown in trace 3, the stimulus delivered to the olfactory nerve was identical to the one applied in the measurement shown in trace 1. The EPSP signal in trace 3 (also superimposed over trace 1 as a black trace) overlaps closely with the local response preceding a spike in trace 1, indicating that the spike is eliminated by QX-314, whereas the synaptic potential was unchanged. D, The amplitude of EPSP signals on a voltage scale at 10 recording sites. The calibration of optical signals shows that EPSP at location 8 (red), only 15 μm away from soma, is 13.2 mV in amplitude. Electrical recording from the soma (D, trace 11) was similar (12.5 mV). Traces 9 and 10 are signals from left and right oblique dendritic branches. E, The peak amplitude of EPSP plotted as a function of distance along the primary dendrite measured from the site of origin (terminal tuft). F, The shape of EPSP as a function of distance from the site of origin (tuft). Red trace, Optical recording from the tuft. Blue trace, Electrical recording from the soma. The EPSP has a slower rate of rise in the soma compared with the tuft. G, Action potentials generated by numerical simulation. Trace 1, The control action potential in the primary dendrite. Trace 2, The action potential in the tuft with fully active dendritic branches. Trace 3, The action potential in the tuft with fully passive dendritic branches.
Pharmacological effects and photodynamic damage. Previous work has shown that certain voltage-sensitive dyes have little or no pharmacological effect when applied from the outside or inside to some invertebrate neurons within a limited concentration range (Ross et al., 1977; Gupta et al., 1981; Antic and Zecevic, 1995). With mitral cells, we found that the resting membrane potential and action potentials recorded electrically from the soma were not affected during the staining period (Fig. 1). The average somatic resting membrane potential and action potential amplitude for these cells at the beginning of the experiment were -53.6 ± 4.0 and 86.7 ± 5.3 mV, respectively (n = 47). In stable experiments these values remained unchanged throughout the staining period. The staining was terminated when the intensity of the fluorescence light measured from the soma reached a preset level determined empirically to correspond to an adequate signal-to-noise ratio.
Figure 1.

Pharmacological effects and photodynamic damage. A, The resting membrane potential and action potential size and shape remained constant from the start (black) to the end of the 54 min staining period (gray). The resting membrane potential was -54mV. Whole-cell recording from the soma with the patch pipette was used to deposit the dye. B, The 1st (black) and 30th (gray) 200 msec optical recording trial of the evoked spike signal in the dendritic tuft. No photodynamic damage was detected after a total of 6 sec exposure to high-intensity excitation light.
In our early work on Helix neurons we saw very little photodynamic damage. It was possible to average 100 trials with no noticeable change in action potential amplitude or waveform (Antic and Zecevic, 1995). Mammalian slice preparations have generally been found to be more sensitive to photodynamic injury than invertebrate preparations (Grinvald et al., 1982; Antic et al., 1999). Mitral cells, however, tolerated well the high-intensity excitation light during successive recording trials if the exposures were kept relatively short (100-200 msec) and separated by dark intervals lasting several minutes. In a stable experiment, it was routinely possible to acquire ∼30 recording trials (illumination time: 200 msec per trial) before any effect of photodynamic damage was observed (Fig. 1 B). Nonetheless, the illumination time was kept as short as possible; the computer-controlled shutter was opened only for the recording period (100-200 msec) plus the time required for the mechanical shutter to fully open (∼20 msec).
The length of primary and secondary dendrites was measured from the point of origin on the soma. All values are presented as mean ± SEM.
Computer model. Multicompartmental modeling was used to estimate the upper limit for the possible error in calibrating optical signals from terminal dendritic branches in the tuft (where direct electrical measurement is not possible). The simulations were performed using the NEURON simulation environment (Hines and Carnevale, 1977). We modified a previously described model (Shen et al., 1999; Chen et al., 2002) to include the anatomical reconstruction of the dendritic tuft (http://senselab.med.yale.edu/senselab/modeldb). The basic morphology of the tuft dendritic branches labeled with the calcium indicator Oregon Green was determined on a confocal microscope (Fig. 2G) and incorporated into the simulation.
Results
Experiments were performed on 134 mitral cells. The signal-to-noise ratio in the voltage-sensitive dye recording from neuronal processes varied as a function of (1) the amount of the dye injected, (2) the morphology of the cell, and (3) the proximity of the cell to the surface of the slice. The best recordings were obtained from mitral cells that had a relatively high concentration of the dye, were close to the surface of the slice, and were “flat,” having the cell body and both primary and secondary dendrites in the same plane of focus. The results shown in the figures come from eight representative mitral cells that were selected on the basis of the most suitable morphology and the highest signal-to-noise ratio. The data from the remaining neurons are consistent with the experiments illustrated in the Figures.
EPSP characteristics in the glomerular tuft and trunk of the primary dendrite
We investigated the characteristics of the evoked EPSP at the site of origin (tuft) and its attenuation along the primary dendrite. Reliable monitoring of subthreshold potentials necessitates higher sensitivity than monitoring action potentials. First, we established the limits of the present sensitivity at the desired spatial resolution. Our results showed consistently that the highest sensitivity was achieved in recording from thin terminal branches in the tuft, because of the favorable surface-to-volume ratio of these structures. The effect is based on the fact that the cytoplasm and the internal membranes (e.g., endoplasmic reticulum membranes) of the stained cell also contain the dye. Dye bound to internal membranes does not contribute to the signal because it is not in the membrane that changes potential. This internal dye contributes to the resting fluorescence, nonetheless, and degrades the fractional change in fluorescence (ΔF/F) for the unit change in membrane potential. An example of this effect is obvious in Figure 3B, where ΔF/F in response to the same voltage change (spike) increases continually in the primary dendrite, having the lowest value close to the soma and the highest at the branch point, just before the tuft. The primary dendrites in mitral cells had the average diameter (measured under DIC) at the junction point with the soma of 6.5 ± 0.3 μm; the primary dendrites tapered toward its distal end having an average diameter of 4.0 ± 0.2 μm at 20 μm away from the soma and an average diameter of 2.5 ± 0.2 μm at the most distal end at the entrance into the glomerulus (n = 15). The surface-to-volume ratio is even more favorable in the terminal dendritic branches, with the average diameter of 0.8 μm, as determined using an electron microscope (Kasowski et al., 1999). In addition, the higher sensitivity of recording from the tuft is accompanied by the improved signal-to-noise ratio (for the same ΔF/F) based on a large membrane surface area of the terminal dendritic arborization. Larger membrane surface area results in the larger amount of the membrane-bound dye and higher light intensity; higher light intensity, in turn, results in the higher signal-to-noise ratio under our experimental conditions (dominant noise is statistical, shot noise). This is a fortunate feature of voltage imaging because thin dendritic branches receive all of the excitatory synaptic inputs in mitral cells, are not accessible to direct electrical measurement, and are likely to be the key compartment for signal integration.
Figure 2 illustrates in detail the spatial resolution and sensitivity of voltage imaging from small dendritic structures (single pixels received light from a 4 × 4 μm area in the object plane). The images of the dendritic tuft of a mitral cell (top image = low resolution; bottom image = high resolution) are shown in Figure 2A; single pixel recordings of action potential signals from four individual locations on the dendritic tuft in single-trial measurements (no averaging) are shown in B. Action potential signals could easily be resolved from individual locations. An improvement in the signal-to-noise ratio with minimal spatial averaging (signals from the same four pixels shown in B are averaged) is illustrated in C. A dramatic improvement with more extensive spatial averaging (the whole tuft; 184 pixels) made the optical recording shown in D appear similar in signal-to-noise ratio to electrode measurements.
Measurements of the same type were performed during an evoked synaptic potential at the dendritic tuft (Fig. 2E-G). Because EPSP was approximately five times smaller in amplitude than an action potential, we averaged 20 individual trials to obtain a signal-to-noise ratio similar to the one corresponding to action potentials (the signal-to-noise ratio increases with the square root of the number of averages). Figure 2E-G again illustrates the striking improvement in the sensitivity of recording with both spatial averaging and averaging of individual repetitive events. This sensitivity was routinely obtained from mitral cells that were positioned relatively close to the surface of the slice (not deeper than 70 μm) and that had the primary dendrite and its tuft close to the focal plane.
Figure 3 illustrates a representative example from a series of measurements designed to determine the characteristics of the evoked EPSP at the site of origin and its attenuation along the primary dendrite. First, a spike was elicited and optically recorded from multiple sites in a single-trial measurement to serve as a calibration standard (Fig. 3B, traces 1-10).
The calibration of optical data from multiple sites in terms of membrane potential requires a voltage signal that has a known amplitude at all recording locations on neuronal processes (Zecevic and Antic, 1998). Usually, such a signal is not available; however, the action potential amplitude in mitral cells is constant along the entire length of the primary dendrite, as established by direct electrical measurements (Bischofberger and Jonas, 1997; Chen et al., 1997; Christie and Westbrook, 2003) and thus can be used as a calibration signal. The calibration protocol is illustrated in Figure 3C. In the experiment shown in Figure 3, the spike signal corresponds to an action potential of 93 mV, as determined from a patch-electrode recording from the soma. This information was used to calibrate optical signals from all locations that fully support action potentials. For example, after the spike, a subthreshold EPSP was evoked by a weaker stimulus to the olfactory nerve layer and recorded optically in a single-trial measurement from the site of origin, the dendritic tuft (Fig. 3C, trace 2). The EPSP size was determined, by comparing it with the spike signal, to be 9 mV in amplitude. To standardize the recording conditions in measurements from different cells, we adjusted the stimulus intensity to produce an EPSP of the size sufficient to evoke an action potential in ∼50% of trials (threshold EPSP). When signal averaging was used, we selected trials without action potential for off-line averaging. All trials were saved and inspected to confirm that individual EPSPs used for the average were very nearly identical in shape and size.
In some of the experiments, we blocked action potential initiation in the mitral cell by 10 mm QX-314 added to the pipette solution. The blockade of sodium channels by QX-314 eliminated action potentials and facilitated averaging EPSPs. Also, we established that QX-314 did not affect the shape or size of the EPSP. This result indicated that the contribution of sodium voltage-gated channels to the EPSP was either absent or minimal.
A typical threshold EPSP recorded from the dendritic tuft is shown in Figure 3C; trace 1 shows the EPSP that was suprathreshold for spike initiation in the absence of QX-314 (red trace) and an EPSP alone (black trace) after the spike was blocked with QX-314. The amplitude and shape of the EPSP were mostly unaltered. In the cell shown, the EPSP was monitored optically and calibrated in terms of membrane potential along a 260 μm primary dendrite. The optical signals are shown on a voltage scale in Figure 3D. The recordings from eight locations on the primary dendrite (traces 1-8), including the terminal tuft and two sites on oblique dendrites (traces 9 and 10) are shown together with the electrical recording from the soma (trace 11). The calibration of the EPSP in the tuft revealed the peak amplitude of 18 mV. The EPSP amplitude in the soma, determined from optical data, was 13.2 mV (Fig. 3D, trace 8). The direct electrical recording of the EPSP in the soma (D, trace 11) showed an amplitude of 12.5 mV. This result indicates that the error in calibrating optical signals can be very small.
The series of measurements of this type provided information about the characteristics of the EPSPs at the synaptic sites and its attenuation along the primary dendrite. The threshold EPSP had a peak amplitude of 17.4 ± 0.9 mV, n = 51, as measured in the tuft. The EPSP was initiated with a delay that varied from 2 to 12 msec (8.98 ± 0.52; n = 51) depending on the position of the stimulating electrode in the olfactory nerve layer. The time to peak of the EPSP was 10.6 ± 0.8 msec. It declined in amplitude by 50% in 28 ± 0.9 msec after the peak (n = 46).
To determine the EPSP attenuation in the primary dendrite, its peak amplitude was plotted as a function of distance from the site of origin (tuft) in Figure 3E. The average length of the primary dendrite in these measurements was 341 ± 10 μm(n = 28). On average, the EPSP attenuated by 35 ± 9% in 300 μm (n = 4) in the experiments in which QX-314 was applied intracellularly to block action potentials. Additional measurements were performed to determine the attenuation of the EPSP under control conditions, without QX-314. Besides its blocking effect on fast and noninactivating Na+ currents (Narahashi et al., 1972; Strichartz, 1973; Connors and Prince, 1982), QX-314 has been reported to block various other voltage-gated channels, including h-channels (Perkins and Wong, 1995), A-channels, and various other potassium conductances (Andersen and Hablitz, 1993), thereby modifying significantly effective membrane resistance and hence the attenuation of subthreshold electrical signals in dendritic cables of certain classes of neurons (Berger et al., 2001; Williams and Stuart, 2002). Our measurements showed that attenuation of the EPSP in the primary dendrite of mitral cells was unaffected by QX-314 (Fig. 3E). On average, the EPSP attenuated by 33 ± 3% in 300 μm(n = 10) under control conditions, which was not significantly different from the attenuation in the presence of QX-314 (p = 0.76; unpaired t test). To compare the attenuation of the EPSP obtained in our measurements with the results reported for other cell types, we approximated the decay of the peak EPSP amplitude with distance by a single exponential and used this relationship to extract the length of the primary dendrite over which a typical threshold EPSP attenuates to 1/e of its initial amplitude in the tuft. This distance, sometimes called the mean apparent “length constant” (Berger et al., 2001) or mean 1/e attenuation (Larkum et al., 1998), is a useful functional measure of the efficacy of signal transfer between two points on a particular dendrite, although the length constant of a cable is strictly defined only for the infinite cylinder of the uniform diameter (Rall, 1977; Zador et al., 1995). The mean apparent length constant in the primary dendrites of mitral cells was unusually long, corresponding to 1246 ± 217 μm(n = 10) for control and 1007 ± 256 μm(n = 4) for experiments in the presence of QX-314.
Two additional lines of evidence are consistent with the result that attenuation of the EPSP in the primary dendrite of mitral cells was unaffected by QX-314.
First, we found that the effective input resistance of mitral cells remained unchanged after application of QX-314. For these measurements, the soma of a mitral cell was first patched using control intracellular solution, and the apparent input resistance was determined at the resting membrane potential from the voltage drop (∼5 mV) across the membrane caused by the injection of a constant hyperpolarizing current pulse of 50 pA. The patch electrode with control intracellular solution was then removed (by forming an outside-out patch), and the neuron was repatched with a patch electrode containing QX-314. The input resistance was again determined, at the same resting membrane potential, after the AP was completely blocked by intracellular QX-314. The success rate of these experiments was ∼70%; only cells that maintained stable membrane potential were included in the analysis. The average effective input resistance was practically identical under control conditions (97 ± 9 MΩ) and after the AP was completely blocked by intracellular QX-314 (95 ± 7 MΩ) (n = 5). This result indicates that h-conductance and other membrane conductances sensitive to the blocking effect of QX-314 contribute very little or not at all to the apparent input resistance of the mitral cell.
Second, we determined that mitral cells do not have substantial h-conductance. The sag in the hyperpolarizing response to a current pulse, indicative of h-conductance, as well as the h-current under voltage clamp, were practically absent for membrane hyperpolarization pulses of up to 40 mV. Larger hyperpolarization did reveal the presence of sag and a small h-current that could be eliminated by QX-314 (data not shown), indicating the presence of a low density of h-channels. Such large swings in membrane potential are not physiological, and we did not investigate this phenomenon further.
The mean 1/e attenuation of the EPSP in the primary dendrite of the mitral cell corresponded to ∼1.2 mm. More pronounced attenuation in the mitral cell primary dendrite could be inferred from the data obtained by double-patch measurements reported previously (Chen et al., 2002, their Fig. 2). This information, however, cannot be simply compared with our measurements because the cell in Chen et al. (2002), their Figure 2, was polarized by a holding current of 110 pA applied to the soma to keep the resting membrane potential stable. The need for holding current is indicative of the electrical leak (Chen et al., 2002, their Fig. 2, legend) that, as a rule, results in more pronounced attenuation. Other similar experiments, using double-patch recording from mitral cells, showed levels of attenuation that were similar to our present measurements [EPSP reduction by ∼25% of its amplitude in 300 μ (derived from Bischofberger and Jonas (1997), their Figs. 3, 4)].
The extent of widening of the EPSP with distance from the site of origin is obtained directly from optical data. Figure 3F shows a recording of the EPSP measured optically from the dendritic tuft (red) superimposed with the electrical recording of the EPSP in the soma (blue). The voltage transient had a rise time that was faster in the tuft than in the soma by a factor of 1.4.
The calibration procedure described above rests on the assumption that the amplitude of an action potential in the thin dendritic branches in the tuft (where electrical recording is not possible) is the same as in the trunk of the primary dendrite. There is no direct information that this is true, but an upper limit for the possible error introduced by this assumption can be estimated. We used a numerical simulation of the mitral cell (Shen et al., 1999; Chen et al., 2002) and modified the model to include anatomical reconstruction of the dendritic tuft. The basic morphology of the tuft dendritic branches labeled with the calcium indicator Oregon Green was determined for a typical mitral cell using a two-photon microscope and incorporated into a compartmental model (Fig. 3G). The amplitude of the action potential in the tuft dendritic branches was determined in the model for two extreme cases: fully passive (no voltage-gated channels included) and fully active dendrites (uniform distribution of the full complement of both sodium and potassium channels throughout the whole neuron). The model signals from the tuft illustrated in Figure 3G (traces 2, 3) were chosen to correspond in size to the mean value of signals from the midpoint on eight terminal tuft branches. In the case of fully active tuft branches, this average action potential in the tuft (trace 2) had amplitude 12% larger than the control spike (trace 1) in the primary dendrite (despite the uniform distribution of voltage-gated channels). In the model, this is caused by an action potential propagating into the sealed cables. In the simulation with fully passive tuft branches, the action potential in the tuft (trace 3) had an amplitude that was 18% smaller than the control spike in the primary dendrite. Thus, the possible error in calibrating optical signals in the tuft in terms of membrane potential is likely to be between +12 and -18%. The actual error limits must be substantially narrower because we demonstrated that tuft dendrites can initiate spikes and therefore must be excitable.
In the experiments on synaptic potential attenuation along the primary dendrite, it was important to strictly limit the analysis to the subset of neurons with resting membrane potential and other electrical characteristics that were stable throughout the experiment. In the cells that slowly depolarized after electrode attachment and required a current to be passed across the membrane to maintain the resting membrane potential, we obtained similar results concerning the characteristics of the EPSP in the tuft but markedly different results concerning the EPSP attenuation. In these cells, the decline of EPSP with distance from the tuft was much more pronounced, by up to a factor of 5, compared with fully stable neurons. It is most likely that strong attenuation was caused by an electrical leak in the membrane that resulted from cell injury. The data from unstable cells were excluded.
Action potential initiation and propagation in the primary dendrite
The purpose of this series of experiments was to examine two fundamental determinants of the electrical structure of mitral cells: (1) the number and position of trigger zones for spikes evoked by EPSPs resulting from electrical stimulation of the olfactory nerve and (2) the pattern of action potential propagation within the neuron.
A typical recording from multiple sites is illustrated in Figure 4. A stimulating electrode was positioned in the olfactory nerve layer, and the nerve was stimulated to produce an EPSP-evoked spike in the postsynaptic mitral cell. Figure 4A shows a high-resolution CCD image of the mitral cell, stained with voltage-sensitive dye, used to document anatomical details. Figure 4B shows an image of a portion of the mitral cell obtained with the fast, low-resolution (80 × 80 pixel) CCD camera used for voltage imaging. A series of frames was collected at 2.7 kHz during action potential initiation and propagation. Optical signals from selected regions on the neuron, corresponding to evoked spikes, were displayed as a function of time and analyzed, as illustrated in Figure 4, C and D.
The temporal and spatial characteristics of the initiation and propagation of the spike were obtained directly from optical data. In the measurement shown in Figure 4, a single volley applied to the olfactory nerve resulted in two action potentials in the mitral cell; signals from three selected regions of the cell, scaled to the same height, are shown on a slow time scale in Figure 4C. In Figure 4D, signals corresponding to the first spike are compared on an expanded time scale. The spike clearly appeared first in the dendritic tuft (red trace) and propagated toward the soma (blue trace) and into the secondary dendrite (green trace).
The temporal and spatial dynamics of spike initiation can be displayed together using a color-coded display, as in Figure 4, F and H. Each frame in E and G shows the spatial distribution of membrane potential at one point in time. The temporal dimension of the events is shown by a time sequence of frames separated by 0.37 msec. The same information is visualized most completely as a movie (supplemental movie, available at www.jneurosci.org/cgi/content/full/24/30/6703/DC1).
The color-coded display for the first of the two action potentials (Fig. 4F) showed that the earliest spike was found in the tuft. The actual recordings from two selected locations (tuft and soma) were used to determine spike propagation velocity (Fig. 4E). The color-coded display indicates clearly the position of the spike trigger zone in the tuft. This result is a direct confirmation that terminal dendritic branches in the tuft are excitable.
Although the first spike was initiated at the glomerular tuft, the second action potential originated from the soma-axon region and backpropagated toward the tuft. The color-coded display for the second spike (Fig. 4H), as well as corresponding traces from the tuft and the soma (Fig. 4G), illustrates this sequence of events. Clearly the two spikes were initiated at different trigger zones and propagated in the opposite directions along the primary dendrite. The whole sequence of events is shown as a movie on-line (supplemental movie, available at www.jneurosci.org/cgi/content/full/24/30/6703/DC1).
We found consistently that different action potentials in a train have different sites of origin and a different pattern of propagation (n = 14). Although the exact biophysical mechanism for this phenomenon is unknown, this information is important in understanding how spatially localized inhibitory inputs modify repetitive firing in mitral cells.
The results from a series of experiments (n = 23) of the type shown in Figure 4 were analyzed to determine the number and position of spike initiation sites in mitral cells as a function of olfactory nerve stimulus intensity. Typical results are illustrated in Figure 5. We found that, depending on stimulus intensity, the spike could be initiated in three different regions in the same mitral cell: (1) the glomerular tuft, (2) the axo-somatic part of the neuron, and (3) the trunk of the primary dendrite.
Figure 5.

Multiple spike trigger zones in two mitral cells (E, F). Color-coded representation of changes in fluorescence light intensity corresponding to action potentials evoked by olfactory nerve stimulation of different intensity. The peak of the action potential is shown in red. Individual frames are separated by 0.37 msec. Red arrow indicates the position of the trigger zone. A, A strong stimulus (60 μA, 0.1 msec) initiated the spike in the dendritic tuft. B, A weak stimulus (25 μA, 0.1 msec) initiated the spike in the soma-axon region. C, A medium stimulus (30 μA, 0.1 msec) initiated the spike in the trunk of the primary dendrite. D, A medium stimulus (40 μA, 0.1 msec) initiated the spike in the trunk of the primary dendrite of another mitral cell.
In these measurements, the stimulus strength was standardized for each individual mitral cell as the amplitude of the constant current pulse, 0.1 msec in duration, that initiated a spike at one of the three trigger zones: (1) the high-threshold spike trigger zone in the glomerular tuft (“strong” stimulus), (2) the trunk of the primary dendrite (“medium” stimulus), and (3) the low-threshold initiation site in the soma-axon region (“weak” stimulus). In absolute terms the starting weak stimulus, delivered from a constant current source, ranged from 5 to 50 μA in different experiments. Stimulus strength was typically increased by a factor of 2 to initiate a shift in the spike trigger zone from the soma to the tuft. The medium stimulus strength was between these two values. The position of the trigger zone in the tuft (Fig. 5A) was clear and invariable in all measurements (n = 23). Also, spike initiation in the soma-axon region consistently produced images showing backpropagation of the regenerative event toward distal dendrites (Fig. 5B) (n = 20). In a small proportion of neurons (13%) it was not possible to activate the soma-axon trigger zone before the tuft initiation site. The most likely explanation is that the somatic region was damaged in these experiments. The initiation of the spike in the trunk required fine tuning of the stimulus intensity and repetitive imaging of the cell. It was attempted in 12 neurons and successfully recorded in 67% of these cells. In these neurons, an action potential developed simultaneously across regions of the dendritic trunk that had variable length and variable positions. In the remaining four neurons, the spike initiation site alternated only between the soma-axon region and the tuft. As should be expected, it was also possible to initiate a spike simultaneously at two locations, tuft and soma-axon region, if the stimulus intensity and resting membrane potential were carefully tuned to produce this effect (data not shown).
The spike propagation velocity can be obtained directly from the recordings of the type illustrated in Figure 4. The average velocity in the primary dendrite was 1.0 ± 0.1 m/sec (n = 34). We compared propagation velocities in 10 neurons for the spikes that propagated toward the soma with action potentials propagating away from the soma; no significant difference was found (p < 0.366; t test).
It is reasonable to assume that the site of spike initiation is one of the important determinants of the mitral cell input-output function. We therefore investigated whether a shift of the spike trigger zone could be monitored reliably during evoked feedback inhibition mediated by reciprocal synapses on secondary dendrites (Chen et al., 1997; Urban and Sakmann, 2002; Shepherd et al., 2004). We hypothesized that feedback inhibition should predominantly influence the region that is closer to the soma and secondary dendrites favoring spike initiation in the tuft. Indeed, in some experiments, such a shift in the position of the trigger zone was clearly recorded. An example is shown in Figure 6. First, we monitored the initiation of the spike evoked by a single volley to the olfactory nerve (Fig. 6B). The stimulus was adjusted in amplitude to initiate the spike in the axon-soma region, as shown in the color-coded representation of the data (Fig. 6C). In the next measurement, an identical single volley to the olfactory nerve was preceded by an action potential evoked by direct stimulation of the soma (Fig. 6D,E). This spike presumably propagated down secondary dendrites causing feedback inhibition that primarily influenced the soma-axon trigger zone. The subsequent spike (second spike in D), evoked by standard olfactory nerve stimulus, was now initiated in the tuft.
Figure 6.
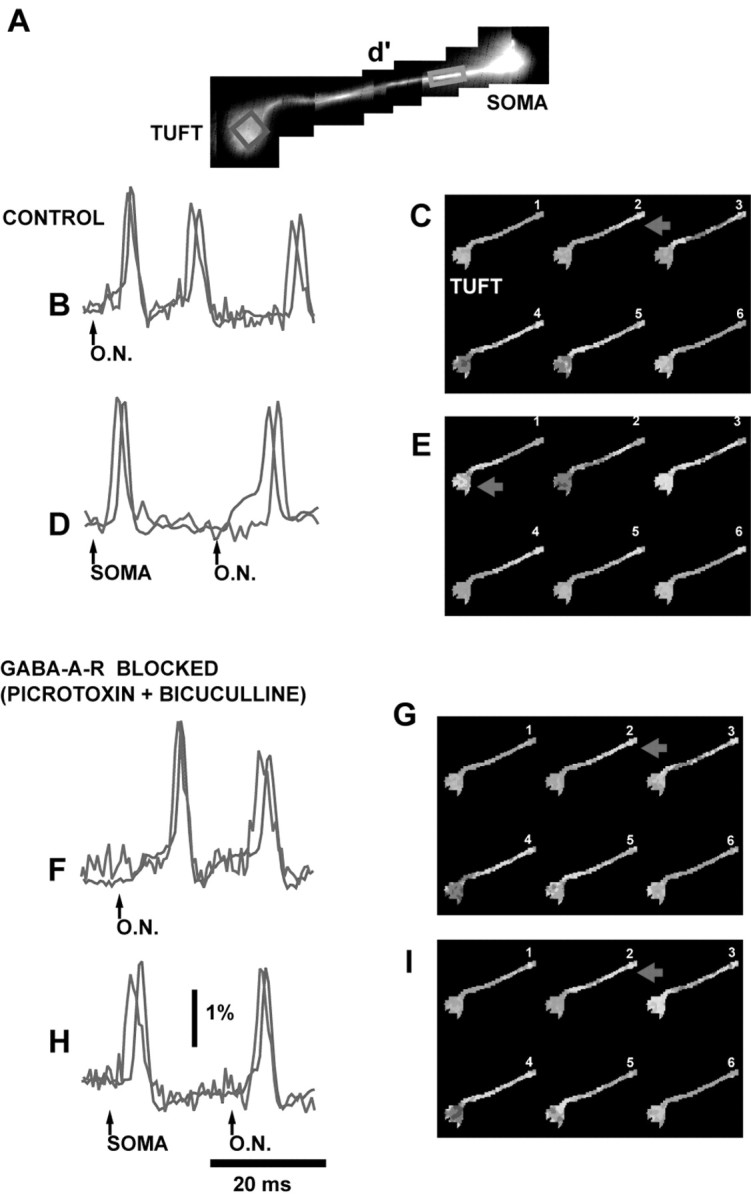
Feedback inhibition in secondary dendrites shifts the site of spike initiation. A, High-resolution composite image of a mitral cell stained with the voltage-sensitive dye. B, F, The initiation and propagation of an action potential evoked by a single volley to the olfactory nerve (60 μA, 0.1 msec) recorded optically from the tuft (red) and close to the soma (blue). The recordings from two different locations were compared on an expanded time scale in control solution (B) and with GABA-A receptors blocked with picrotoxin and bicuculline (F). Action potentials started in the soma-axon region under both conditions. D, H, The single volley to the olfactory nerve was preceded by an action potential evoked by direct stimulation of the soma to induce feedback inhibition in secondary dendrites. Under control conditions, the initiation of the subsequent spike by olfactory nerve stimulation was shifted to the tuft (D). After GABA-A receptors were blocked, the initiation of the spike evoked by ON stimulation was unchanged (H). C, E, G, I , Color-coded representation of the data shown in B, D, F, and H for the spike evoked by ON stimulation. C and E illustrate the shift in the initiation site evoked by preceding activity under control conditions. G and I illustrate that the trigger zone shift was absent after feedback inhibition was removed by blocking GABA-A receptors.
To test the hypothesis that the shift in the spike initiation site was caused by feedback inhibition mediated by GABA, we blocked GABA-A receptors with a bath-applied mixture of 10 μm picrotoxin and 10 μm bicuculline. The same stimulation protocol was then repeated (Fig. 6F-I). We found that the shift in the position of the trigger zone could not be induced in the absence of GABA-mediated reciprocal inhibition; however, this was not a robust phenomenon. In 50% of the experiments performed on 12 mitral cells, the soma-axon trigger zone was not sufficiently stable under control conditions to allow a reliable test of the kind shown in Figure 6. In these cells the location of the trigger zone for the spike evoked by a single volley to the olfactory nerve alternated spontaneously between the soma-axon and tuft region in different trials. In the remaining six mitral cells, the trigger zone was stable under control conditions, and the shift from the soma-axon to the tuft trigger zone with conditioning activity was consistently recorded. In two of these mitral cells, it was possible to test GABA blockers using the full procedure described above, and the hypothesized effect was clearly recorded as shown in Figure 6. The remaining four cells did not survive long enough to perform the test with GABA blockers.
Action potential initiation and propagation in secondary dendrites
The nature of nerve impulses in secondary dendrites (active propagation or passive spread) is important for describing the control of the input-output function of mitral cells by dendrodendritic synapses. Our experiments show that secondary dendrites of mitral cells support active propagation of action potentials. This conclusion is based on two lines of evidence. The first comes from experiments in which action potentials were evoked in the distal parts of secondary dendrites by direct electrical stimulation. First, we monitored the regular propagation of a spike, evoked by stimulating the olfactory nerve, from the soma into the secondary dendrite (Fig. 7S-1). In the next measurement, we stimulated the distal part of the secondary dendrite directly with an extracellular electrode. This stimulation always resulted in a locally evoked spike that propagated toward the soma and into other branches of the secondary dendrite (Fig. 7S-2). Propagation of the action potential into the other branch of the secondary dendrite appears incomplete in the Figure because the distal part of that branch is out of focus and signal is lost in the noise. Complete propagation was recorded after focusing the objective to that branch (data not shown). This finding (n = 19) shows unambiguously that secondary dendrites can initiate and actively propagate action potentials. The spike propagation velocity in secondary dendrites was consistently (and significantly; p = 0.02; t test; n = 5) lower for the spikes that propagated toward the soma (0.13 ± 0.04 m/sec) compared with action potentials propagating away from the soma (0.35 ± 0.16 m/sec) (Fig. 7B). The difference in the spike propagation velocity is obvious in the color-coded representation of the data (Fig. 7C). A result of this sort might be expected because the capacitative load could be substantially smaller for an action potential traveling toward the tapering end of the dendritic cable compared with a spike propagating toward the large cell body (Rall, 1977).
Figure 7.

Secondary dendrites support active propagation of action potentials. A, Fluorescence image of a mitral cell with two parallel branches of a secondary dendrite. A frame obtained with the CCD camera used for voltage imaging is shown below the high-resolution image. B, An action potential was evoked in the tuft of the primary dendrite, by a single volley delivered via a stimulating electrode in the olfactory nerve layer (S-1; 80 μA, 0.1 msec), or in the distal region of the secondary dendrite by direct stimulation with a stimulating electrode positioned next to the dendrite (S-2; 40 μA, 0.1 msec). The site of spike initiation was determined by comparing optical signals from two selected regions (red and black rectangles superimposed on the CCD image of the cell in A). Signals were scaled to the same height. The spike initiated in the tuft (S-1) propagated from the somatic region into the secondary dendrites. The action potentials initiated distally in secondary dendrites propagated in the opposite direction. C, Color-coded representation of the same data as shown in B. Spatial and temporal dynamics of evoked signals clearly show the two patterns of propagation described above. The propagation velocity is markedly higher for impulses traveling away from the soma.
The second line of evidence is based on the propagation of the action potential waveform during a pharmacological block of voltage-gated sodium channels (Stuart and Sakmann, 1994). An action potential was first recorded by an electrode in the soma and optically along a secondary dendrite (Fig. 8, black traces). Sodium channels were then blocked by bath application of TTX (1 μm), and a spike waveform was produced in the soma under voltage clamp using the digitized spike as a command potential. It is important in this comparison that the simulated spike had an amplitude and waveform identical to the control spike at the site of origin (soma). This is not possible to determine on the basis of electrical recording alone without an additional voltage-measuring electrode in the soma, because series resistance compensation is never perfect (Armstrong and Gilly, 1992); however, a good match could be achieved by using optical measurement. The amplitude of the voltage-clamp command potential was adjusted until the optical signal from the soma in the TTX solution was very nearly identical to the control spike signal from the same area. After that, the control and simulated spikes from identical locations were compared in the secondary dendrites. The results (Fig. 8) showed a dramatic and progressive reduction in amplitude of the simulated action potential in TTX solution with distance from the soma relative to control spikes. In fact, action potential-associated optical signals from distal dendritic segments (>350 μm) were completely abolished in TTX (n = 5). This result is another clear confirmation that action potentials in secondary dendrites propagate actively.
Figure 8.

Secondary dendrites support active propagation of action potentials. Action potential signals from selected regions on secondary dendrites (1-3) are compared for a spike evoked by depolarizing the soma under control conditions (black traces) and for a spike-like waveform signal (red traces) produced in the soma by voltage-clamp commands under conditions that block sodium channels (TTX).
Discussion
The most original finding of these studies concerns the characteristics of EPSPs at the synaptic sites and their attenuation along the primary dendrite. The other key findings are the following. (1) An action potential can be initiated in three different compartments of the mitral cell: the soma-axon region, the primary dendrite trunk, and the terminal dendritic tuft. The images of spike trigger zones indicate their precise position. (2) Terminal dendritic branches in the tuft are excitable and capable of initiating spikes. (3) The pattern of action potential initiation and propagation in the primary dendrite depends on input characteristics and, probably, on the preceding activity of the mitral cell. (4) Secondary dendrites support active propagation of action potentials. Taken together, these findings restrain a number of free parameters in the formal descriptions (computer models) that reflect our current understanding of mitral cells.
EPSP characteristics in the glomerular tuft of the primary dendrite
Monitoring synaptic potentials at the synaptic sites provides ways to contribute to the fundamental question of how effective are synapses at distal dendritic sites in the control of action potential output (Williams and Stuart, 2002).
We showed that the amplitude of the evoked threshold EPSPs in the small-diameter terminal dendritic branches is far from voltage saturation, contrary to predictions based on theoretical arguments (London and Segev, 2001; Williams and Stuart, 2002). Furthermore, the attenuation of the EPSPs in the primary dendrite (Fig. 3E) corresponds to the mean 1/e attenuation of ∼1.2 mm. This level of attenuation is weak in comparison with the apparent length constant values obtained from other classes of neurons using the patch pipette recordings. Significantly shorter apparent length constants have been reported for spinal motoneurons in culture [263 μm in Larkum et al. (1998)], neocortical layer V pyramidal neurons in acute brain slices [290 μm in Stuart and Spruston (1998), their Fig. 6A]; 273 μm in Berger at al. (2001); 250 μm in Williams and Stuart (2002), their Fig. 2c] and hippocampal pyramidal neurons [240 μm in Magee and Cook (2000), their Fig. 1d]. Dual patch pipette measurements have been performed from proximal segments of large dendritic processes. If these data are extrapolated to the EPSPs generated in the most distal apical tuft, ∼1000 μm from the soma in neocortical pyramidal neurons, the expected attenuation (∼100-fold) would virtually eliminate somatic EPSPs (Stuart and Spruston, 1998; Williams and Stuart, 2002). This extrapolation is in striking contrast to our experimental data showing fairly small attenuation of the EPSPs evoked in the terminal dendritic tuft of mitral cells. The differences in the apparent length constant must be on the basis of passive and active conductances and geometrical factors. For example, the apical dendrites of both neocortical (Stuart and Spruston, 1998; Berger et al., 2001; Williams and Stuart, 2002) and hippocampal (Magee, 1999) neurons possess hyperpolarization-activated channels (h-conductance). The impact of the h-conductance is to introduce additional electrical shunt across the membrane, thus increasing voltage attenuation between the distal dendritic branches and the soma. Also, an unusually large diameter (3-5 μm) of the mitral cell primary dendrite will radically reduce attenuation. The exact functional significance of weak attenuation of subthreshold signals in the primary dendrite has not been explored. In general terms, the large apparent length constant will make the soma and the primary dendrite, including the terminal tuft, virtually isopotential. This would speak against the hypothesis that electrical signals are processed independently in different compartments of mitral cell; however, the functional organization of a nerve cell is not simply related to an apparent length constant obtained from the spread of an evoked EPSP in an olfactory bulb slice. An important level of complexity arises from the powerful effect that the background synaptic activity will have on the filtering properties of the dendritic cables. Better understanding of these effects, now predicted on theoretical grounds (London and Segev, 2001), requires multisite measurements during synaptic activity of varying intensities. A more complete description of the electrical behavior of mitral cell and its different anatomical compartments must await this information.
Previous studies, technically restricted to large dendritic processes (Magee and Cook, 2000; Berger at al., 2001; Williams and Stuart, 2002), examined a relatively small fraction of all excitatory synaptic inputs. Because most synapses are formed at terminal dendritic branches (Bannister and Larkum, 1995), they need to be included in future analyses. Voltage imaging described in this work opens up that territory. Also, monitoring of EPSPs at the site of origin and their interaction with spike trigger zones highlights the open question of the mechanisms responsible for the differences in the excitation threshold between different spike initiation sites. The soma-axon trigger zone has a markedly lower threshold for excitation compared with the distal initiation zones in the dendritic trunk and apical tuft. A similar result was reported previously for rat neocortical (Stuart et al., 1997; Zhu, 2000) and hippocampal (Richardson et al., 1987; Spruston et al., 1995) pyramidal neurons. In these neurons, distal dendritic inputs must exceed a high threshold to evoke action potentials. The mechanisms and functional significance of these regional differences in excitability have been elegantly explored (Mainen et al., 1995; Hoffman et al., 1997; Colbert and Pan, 2002) but more complete understanding will require additional studies.
Action potential initiation and propagation in the primary dendrite (multiple trigger zones)
Multiple spike trigger zones might have a unique meaning in mitral cells because their characteristic morphology could make these neurons functionally subdivided. It was proposed that signal interactions occur more or less independently at two different levels: in the distal dendrites in the glomerular layer and at the level of the soma and secondary dendrites in the external plexiform layer (Chen and Shepherd, 1997; Chen et al., 1997; Margrie et al., 2001; Schoppa and Westbrook, 2001). Furthermore, both the primary and secondary dendrites of mitral cells are presynaptic to inhibitory interneurons in the olfactory bulb (Shepherd et al., 2004) and capable of fast release of glutamate after depolarization. Also, unlike dendrites of most neurons, mitral cell dendrites, both primary and secondary, support fully regenerative spikes (Bischofberger and Jonas, 1997; Chen et al., 1997; Xiong and Chen, 2002; Christie and Westbrook, 2003; this work). Clearly, multiple trigger zones in separate functional compartments, if they exist, add a new level of complexity to the elaborate electrical structure of mitral cells.
How the interaction of synaptic potentials with spike initiation sites with different firing thresholds modulates the output of mitral cells is not clear. The level of complexity involved in predicting the behavior of a mitral cell can be illustrated by a recent study of the interaction between axonal and dendritic spike initiation sites in cortical layer V pyramidal neurons (Larkum et al., 2001). These experiments showed that initiation zones in the distal dendrite and in the axon interact to generate various spiking output patterns. The input-output transform recorded experimentally in response to relatively simple stimulation patterns could be explained by a set of rules about how synaptic inputs influence the interaction between two initiation zones. For example, a synaptically evoked action potential generated in the axon will backpropagate to the distal dendritic trigger zone and facilitate the initiation of calcium action potentials when it coincides, within a certain time window, with distal dendritic input. The calcium action potential then resulted in a burst of action potentials at the axonal spike initiation site. These rules, however, become exceedingly complex (and difficult to study) when the input is not simple (Larkum et al., 2001). Obviously, full understanding of these rules will require additional experimental work. Mitral cells provide an excellent model for such studies.
Action potential initiation and propagation in the secondary dendrite
The significance of action potential propagation in secondary dendrites is based on the key role of dendrodendritic synapses on secondary dendrites in both feedback and lateral inhibition of mitral cells (Chen et al., 2000; Margrie et al., 2001; Urban and Sakmann, 2002; Shepherd et al., 2004). Thus, it is essential to determine whether spike signals in secondary dendrites are propagated without decrement or spread passively with attenuation. The first indication that secondary dendrites might support active propagation of action potentials came from the report of Chen and Shepherd (1998). Five other subsequent studies directly explored spike propagation in secondary dendrites (Margrie et al., 2001; Lowe, 2002; Xiong and Chen, 2002; Christie and Westbrook, 2003; Debarbieux et al., 2003). Margrie et al. (2001), using dual patch-clamp measurements and Ca2+ imaging, concluded that the spatial spread of activation is decremental and limited to distal parts of the secondary dendrites. In contrast, the results of other experiments based on Ca2+ imaging (Lowe, 2002; Xiong and Chen, 2002; Christie and Westbrook, 2003; Debarbieux et al., 2003) are all in favor of active propagation. Our results provide direct and definitive evidence for active propagation. Also, voltage imaging allows further systematic studies of the dynamics and modulations of repetitive firing in the distal parts of secondary dendrites that are not accessible to microelectrodes.
Footnotes
This work was supported by National Institutes of Health Grants NS4273and DC03918.W.R.C. was also supported by the Whitehall Foundation. We are grateful to Leslie Loew and Joe Wuskel for kindly providing dyes; to Mike Hines for help with the model; to Larry Cohen, Matt Wachowiak, Dejan Vucinic, and Efstratios Kosmidis for helpful comments on this manuscript; and to Jovan Mijovic for the expert help with the optical apparatus.
Correspondence should be addressed to Dejan Zecevic, Department of Cellular and Molecular Physiology, Yale University School of Medicine, 333 Cedar Street, New Haven, CT 06510. E-mail: dejan.zecevic@yale.edu.
Copyright © 2004 Society for Neuroscience 0270-6474/04/246703-12$15.00/0
References
- Andersen M, Hablitz JJ (1993) Local anesthetics block transient outward potassium currents in rat neocortical neurons. J Neurophysiol 69: 1966-1975. [DOI] [PubMed] [Google Scholar]
- Antic SD, Zecevic D (1995) Optical signals from neurons with internally applied voltage-sensitive dyes. J Neurosci 15: 1392-1405. [DOI] [PMC free article] [PubMed] [Google Scholar]
- Antic S, Major G, Zecevic D (1999) Fast optical recordings of membrane potential changes from dendrites of pyramidal neurons. J Neurophysiol 82: 1615-1621. [DOI] [PubMed] [Google Scholar]
- Antic SD, Wuskell JP, Loew L, Zecevic D (2000) Functional profile of the giant metacerebral neuron of helix aspersa: temporal and spatial dynamics of electrical activity in situ. J Physiol (Lond) 527: 55-69. [DOI] [PMC free article] [PubMed] [Google Scholar]
- Armstrong CL, Gilly WF (1992) Access resistance and space clamp problems associated with whole-cell patch clamping. Methods Enzymol 207: 100-122. [DOI] [PubMed] [Google Scholar]
- Bannister NJ, Larkum A (1995) Dendritic morphology of CA1 pyramidal neurons from the rat hippocampus. 2. Spine distribution. J Comp Neurol 360: 161-171. [DOI] [PubMed] [Google Scholar]
- Berger T, Larkum ME, Luscher HR (2001) High I(h) channel density in the distal apical dendrite of layer V pyramidal cells increases bidirectional attenuation of EPSPs. J Neurophysiol 85: 855-868. [DOI] [PubMed] [Google Scholar]
- Bischofberger J, Jonas P (1997) Action potential propagation into the presynaptic dendrites of rat mitral cells. J Physiol (Lond) 504: 359-365. [DOI] [PMC free article] [PubMed] [Google Scholar]
- Carlson GC, Shipley MT, Keller A (2000) Long-lasting depolarizations in mitral cells of the rat olfactory bulb. J Neurosci 20: 2011-2021. [DOI] [PMC free article] [PubMed] [Google Scholar]
- Cang J, Isaacson JS (2003) In vivo whole-cell recording of odor-evoked synaptic transmission in the rat olfactory bulb. J Neurosci 23: 4108-4116. [DOI] [PMC free article] [PubMed] [Google Scholar]
- Charpak S, Mertz J, Beaurepaire E, Moreaux L, Delany K (2001) Odor-evoked calcium signals in dendrites of rat mitral cells. Proc Natl Acad Sci USA 98: 1230-1234. [DOI] [PMC free article] [PubMed] [Google Scholar]
- Chen WR, Shepherd GM (1997) Membrane and synaptic properties of mitral cells in slices of rat olfactory bulb. Brain Res 745: 189-196. [DOI] [PubMed] [Google Scholar]
- Chen WR, Shepherd GM (1998) Activation of olfactory dendrodendritic reciprocal synapses through NMDA receptors and its dependence on action potential propagation in the mitral cell secondary dendrites. Assoc Chemorecept Sci Abstr 20: 274. [Google Scholar]
- Chen WR, Midtgaard J, Shepherd GM (1997) Forward and backward propagation of dendritic impulses and their synaptic control in mitral cells. Science 278: 463-467. [DOI] [PubMed] [Google Scholar]
- Chen WR, Xiong W, Shepherd GM (2000) Analysis of relations between NMDA receptors and GABA release at olfactory bulb reciprocal synapses. Neuron 25: 625-633. [DOI] [PubMed] [Google Scholar]
- Chen WR, Shen GY, Shepherd GM, Hines ML, Midtgaard J (2002) Multiple modes of action potential initiation and propagation in mitral cell primary dendrite. J Neurophysiol 88: 2755-2764. [DOI] [PubMed] [Google Scholar]
- Christie JM, Westbrook GL (2003) Regulation of backpropagating action potentials in mitral cell lateral dendrites by A-type potassium currents. J Neurophysiol 89: 2466-2472. [DOI] [PubMed] [Google Scholar]
- Colbert CM, Pan E (2002) Ion channel properties underlying axonal action potential initiation in pyramidal neurons. Nat Neurosci 5: 533-538. [DOI] [PubMed] [Google Scholar]
- Connors BW, Prince DA (1982) Effects of local anesthetic QX-314 on the membrane properties of hippocampal pyramidal neurons. J Pharmacol Exp Ther 220: 476-481. [PubMed] [Google Scholar]
- Debarbieux F, Audinat E, Charpak S (2003) Action potential propagation in dendrites of rat mitral cells in vivo. J Neurosci 23: 5553-5560. [DOI] [PMC free article] [PubMed] [Google Scholar]
- Freeman WJ (1974) Relation of glomerular neuronal activity to glomerular transmission attenuation. Brain Res 65: 91-107. [DOI] [PubMed] [Google Scholar]
- Grinvald AR, Hildesheim IC, Farber R, Anglister L (1982) Improved fluorescent probes for the measurement of rapid changes in membrane potential. Biophys J 39: 301-308. [DOI] [PMC free article] [PubMed] [Google Scholar]
- Grinvald A, Salzberg BM, Lev-Ram V, Hildesheim R (1987) Optical recording of synaptic potentials from processes of single neurons using intracellular potentiometric dyes. Biophys J 51: 643-651. [DOI] [PMC free article] [PubMed] [Google Scholar]
- Gupta RK, Salzberg BM, Grinvald A, Cohen LB, Kamino K, Lesher S, Boyle MB, Waggoner AS, Wang CH (1981) Improvements in optical methods for measuring rapid changes in membrane potential. J Membr Biol 58: 123-137. [DOI] [PubMed] [Google Scholar]
- Hamilton KA, Kauer JS (1989) Patterns of intracellular potentials in salamander mitral/tufted cells in response to odor stimulation. J. Neurophysiol 62: 609-625. [DOI] [PubMed] [Google Scholar]
- Harrison TA, Scott JW (1986) Olfactory bulb responses to odor stimulation: analysis of response pattern and intensity relationship. J Neurophysiol 56: 1571-1589. [DOI] [PubMed] [Google Scholar]
- Hines ML, Carnevale NT (1977) The NEURON simulation environment. Neural Comput 9: 1179-1210. [DOI] [PubMed] [Google Scholar]
- Hoffman DA, Magee JC, Colbert CM, Johnston D (1997) K+ channel regulation of signal propagation in dendrites of hippocampal pyramidal neurons. Nature 387: 869-875. [DOI] [PubMed] [Google Scholar]
- Kasowski HJ, Kim H, Greer CA (1999) Compartmental organization of the olfactory bulb glomerulus. J Comp Neurol 407: 261-274. [PubMed] [Google Scholar]
- Larkum ME, Launey T, Dityatev A, Lusher H-R (1998) Integration of excitatory postsynaptic potentials in dendrites of motoneurons of rat spinal cord slice cultures. J Neurophysiol 80: 924-935. [DOI] [PubMed] [Google Scholar]
- Larkum ME, Zhu J, Sakmann B (2001) Dendritic mechanisms underlying the coupling of the dendritic with the axonal action potential initiation zone of adult rat layer 5 pyramidal neurons. J Physiol (Lond) 533: 447-466. [DOI] [PMC free article] [PubMed] [Google Scholar]
- Lodovichi C, Belluscio L, Katz LC (2003) Functional topography of connections linking mirror-symmetric maps in the mouse olfactory bulb. Neuron 28: 265-276. [DOI] [PubMed] [Google Scholar]
- London M, Segev I (2001) Synaptic scaling in vitro and in vivo. Nat Neurosci 4: 853-855. [DOI] [PubMed] [Google Scholar]
- Lowe G (2002) Inhibition of backpropagating action potentials in mitral cell secondary dendrites. J Neurophysiol 88: 64-85. [DOI] [PubMed] [Google Scholar]
- Magee JC (1999) Dendritic Ih normalizes temporal summation in hippocampal CA1 neurons. Nat Neurosci 2: 508-514. [DOI] [PubMed] [Google Scholar]
- Magee JC, Cook EP (2000) Somatic EPSP amplitude is independent of synapse location in hippocampal pyramidal neurons. Nat Neurosci 3: 895-903. [DOI] [PubMed] [Google Scholar]
- Mainen ZF, Joerges J, Huguenard JR, Sejnowski TJ (1995) A model of spike initiation in neocortical pyramidal neurons. Neuron 15: 1427-1439. [DOI] [PubMed] [Google Scholar]
- Margrie TW, Schaefer AT (2003) Theta oscillation coupled spike latencies yield computational vigour in a mammalian sensory system. J Physiol (Lond) 546: 363-374. [DOI] [PMC free article] [PubMed] [Google Scholar]
- Margrie TW, Sakmann B, Urban NN (2001) Action potential propagation in mitral cell lateral dendrites is decremental and controls recurrent and lateral inhibition in the mammalian olfactory bulb. Proc Natl Acad Sci USA 98: 319-324. [DOI] [PMC free article] [PubMed] [Google Scholar]
- Mori K, Yoshihara Y (1995) Molecular recognition and olfactory processing in the mammalian olfactory system. Prog Neurobiol 45: 585-619. [DOI] [PubMed] [Google Scholar]
- Narahashi T, Frazier DT, Moore JW (1972) Comparison of tertiary and quaternary amine local anesthetics in their ability to depress membrane ionic conductances. J Neurophysiol 3: 267-276. [DOI] [PubMed] [Google Scholar]
- Nicoll RA (1971) Pharmacological evidence for GABA as the transmitter in granule cell inhibition in the olfactory bulb. Brain Res 35: 137-149. [DOI] [PubMed] [Google Scholar]
- Nowycky MC, Mori K, Shepherd GM (1981) Blockade of synaptic inhibition reveals long-lasting synaptic excitation in isolated turtle olfactory bulb. J Neurophysiol 46: 649-658. [DOI] [PubMed] [Google Scholar]
- Perkins KL, Wong KS (1995) Intracellular QX-314 blocks the hyper-polarization-activated inward current in hippocampal CA1 pyramidal cells. J Neurophysiol 73: 911-915. [DOI] [PubMed] [Google Scholar]
- Pinching AJ, Powell TP (1971) The neuron types of the glomerular layer of the olfactory bulb. J Cell Sci 9: 305-345. [DOI] [PubMed] [Google Scholar]
- Pinching AJ, Powell TP (1972) Experimental studies on the axons intrinsic to the glomerular layer of the olfactory bulb. J Cell Sci 10: 637-655. [DOI] [PubMed] [Google Scholar]
- Rall W (1977) Core conductor theory and cable properties of neurons. In: Handbook of physiology, the nervous system (Kandel ER, ed), pp 39-97. Bethesda, MD: American Physiological Society.
- Richardson TV, Turner RR, Miller JJ (1987) Action-potential discharge in hippocampal CA1 pyramidal neurons. J Neurophysiol 58: 981-996. [DOI] [PubMed] [Google Scholar]
- Ross WN, Salzberg BM, Cohen LB, Grinvald A, Davila HV, Waggoner AS, Wang CH (1977) Changes in absorption, fluorescence, dichroism, and birefringence in stained giant axons: optical measurement of membrane potential. J Membr Biol 33: 141-183. [DOI] [PubMed] [Google Scholar]
- Schoppa NE, Westbrook GL (2001) Glomerulus-specific synchronization of mitral cells in the olfactory bulb. Neuron 31: 639-651. [DOI] [PubMed] [Google Scholar]
- Shen GY, Chen WR, Midtgaard J, Shepherd GM, Hines ML (1999) Computational analysis of action potential initiation in mitral cell soma and dendrites based on dual patch recordings. J Neurophysiol 82: 3006-3020. [DOI] [PubMed] [Google Scholar]
- Shepherd GM, Chen WR, Greer CA (2004) Olfactory bulb. In: The synaptic organization of the brain (Shepherd GM, ed), pp 165-216. New York: Oxford UP.
- Spruston N, Schiller Y, Stuart G, Sakmann B (1995) Activity-dependent action potential invasion and calcium influx into hippocampal CA1 dendrites. Science 268: 297-300. [DOI] [PubMed] [Google Scholar]
- Strichartz GR (1973) The inhibition of sodium currents in myelinated nerve by quaternary derivatives of lidocaine. J Gen Physiol 62: 37-57. [DOI] [PMC free article] [PubMed] [Google Scholar]
- Stuart GJ, Sakmann B (1994) Active propagation of somatic action potentials into neocortical pyramidal cell dendrites. Nature 367: 69-72. [DOI] [PubMed] [Google Scholar]
- Stuart GJ, Spruston N (1998) Determinants of voltage attenuation in neocortical pyramidal neuron dendrites. J Neurosci 18: 3501-3510. [DOI] [PMC free article] [PubMed] [Google Scholar]
- Stuart G, Schiller J, Sakmann B (1997) Action potential initiation and propagation in rat neocortical pyramidal neurons. J Physiol (Lond) 505: 617-632. [DOI] [PMC free article] [PubMed] [Google Scholar]
- Urban NN, Sakmann B (2002) Reciprocal intraglomerular excitation and intra- and interglomerular lateral inhibition between mouse olfactory bulb mitral cells. J Physiol (Lond) 542: 355-367. [DOI] [PMC free article] [PubMed] [Google Scholar]
- Wachowiak M, Cohen LB (2001) Representation of odorants by receptor neuron input to the mouse olfactory bulb. Neuron 32: 723-735. [DOI] [PubMed] [Google Scholar]
- Williams SR, Stuart GJ (2002) Dependence of EPSP efficacy on synapse location in neocortical pyramidal neurons. Science 295: 1907-1910. [DOI] [PubMed] [Google Scholar]
- Wu JY, Cohen LB (1993) Fast multi-site optical measurement of membrane potential. In: Fluorescent and luminescent probes for biological activity (Mason WT, ed), pp 389-404. New York: Academic.
- Xiong W, Chen WR (2002) Dynamic gating of spike propagation in the mitral cell lateral dendrites. Neuron 34: 115-126. [DOI] [PubMed] [Google Scholar]
- Xu F, Liu N, Kida I, Rothman DL, Hyder F, Shepherd G (2003) Odor maps of aldehydes and esters revealed by functional MRI in the glomerular layer of the mouse olfactory bulb. Proc Natl Acad Sci USA 100: 11029-11034. [DOI] [PMC free article] [PubMed] [Google Scholar]
- Zador AM, Agmon-Snir H, Segev I (1995) The morphoelectrotonic transform: a graphical approach to dendritic function. J Neurosci 15: 1669-1682. [DOI] [PMC free article] [PubMed] [Google Scholar]
- Zecevic D (1996) Multiple spike-initiation zones in single neurons revealed by voltage-sensitive dyes. Nature 381: 322-325. [DOI] [PubMed] [Google Scholar]
- Zecevic D, Antic S (1998) Fast optical measurement of membrane potential changes at multiple sites on an individual neuron. Histochem J 30: 197-216. [DOI] [PubMed] [Google Scholar]
- Zhu JJ (2000) Maturation of layer 5 neocortical pyramidal neurons: amplifying salient layer 1 and layer 4 inputs by Ca2+ action potentials in adult rat tuft dendrites. J Physiol (Lond) 526: 571-587. [DOI] [PMC free article] [PubMed] [Google Scholar]