

Abstract
ATP opens ionotropic P2X channels through a process that is poorly understood. We made an array of mutant rat P2X2 channels containing unique alanine substitutions in the transmembrane segments with the goal of identifying possible secondary structure and mapping gating domains in the pore. Alteration of channel function was measured as a change in ATP potency, 2′-3′-O-(4-benzoylbenzoyl)ATP (BzATP) efficacy, and deactivation kinetics. Four mutants (V45A, Y47A, V51A, and D349A) failed to respond to ATP. Seven (H33A, Q37A, I40A, L41A, Y43A, F44A, and I50A) of 22 mutations in the first transmembrane segment (TM1) produced channels with altered potencies, and two mutants (Y43A and F44A) were active in the absence of agonist. The pattern of hits was consistent with a helical secondary structure. In contrast, nine (I328A, P329A, N333A, L338A, T339A, S340A, G342A, G344A, and S345A) of 24 mutations in the second transmembrane segment (TM2) resulted in a change in potency, but no regular pattern of impact was apparent. Many of the same mutations that altered ATP potency also changed the relative efficacy of the partial agonist BzATP. Together, these data suggest that both TM1 and TM2 participate in the conformational changes that occur during receptor activation and help to define domains involved in conformational switching within or near the pore.
Keywords: ATP, P2X, purinergic, channel, gating, alanine mutagenesis
Introduction
P2X receptors are ligand-gated ion channels (LGICs) that use the energy of ATP binding to initiate a depolarizing flux of cations across cell membranes. Calcium ions carry a disproportionately large percentage of this current (Benham and Tsien, 1987), and P2X receptors have one of the most substantial Ca2+ fluxes of all LGIC families (Egan and Khakh, 2004). The resulting rise in intracellular Ca2+ evokes transmitter release from central and peripheral neurons, promotes hormone release from endocrine glands, triggers contraction of smooth muscle, regulates airway ciliary motility, and activates downstream signaling cascades in a variety of cells (North, 2002).
In the absence of extracellular ATP, P2X receptors adopt a conformation that occludes the flow of ions through the transmembrane pore, and, in the presence of ATP, this occlusion is removed. The mechanism by which ATP is able to drive the reaction is unknown, in part because the structure of the channel is poorly understood. P2X receptors are multimeric proteins made of at least three subunits with two putative transmembrane segments each (Nicke et al., 1998, 2003). Both the first and second transmembrane segments (TM1 and TM2) are thought to line the pore, an idea that is supported by empirical data (Rassendren et al., 1997; Egan et al., 1998; Haines et al., 2001a; Jiang et al., 2001) and by the fact that more than three transmembrane domains are needed to form a cation-permeable pore (Spencer and Rees, 2002). This hypothesis is bolstered by reports that genetic manipulation of either segment leads to changes in channel function. For example, site-directed mutagenesis of TM1 alters agonist selectivity of channel gating, suggesting that it plays a role in the binding-gating process (Haines et al., 2001b). In contrast, TM2 contains residues that regulate specific properties of ion flow through the channel, including conductance (Nakazawa et al., 1998), permeability (Migita et al., 2001), Ca2+ flux (Egan and Khakh, 2004), and gating (Khakh et al., 1999; Virginio et al., 1999).
We sought to establish a more precise map of binding-gating domains in the ion channel pore of the rat P2X2 receptor. We mutated, one at a time, all of the residues in TM1 and TM2 to alanine and studied the effects of these mutations on agonist potency and efficacy. We assume that a precise rearrangement of one or more protein interfaces occurs within the pore when the receptor binds ATP and that mutation to hydrophobic alanine may have a measurable effect if the substituted residue contributes to the stability of an interface (Yifrach and MacKinnon, 2002; Kortemme et al., 2004). Furthermore, we looked for a pattern in the severity of the effects as a gauge of secondary structure (Collins et al., 1997). α-Helices are a common component of the pore domains of most ion channels (Spencer and Rees, 2002), and amphipathic helices are thought to line the P2X2 receptor channel (Brake et al., 1994). We find that alanine scanning mutagenesis supports the hypothesis that TM1 is helical and suggests that dynamic changes occur in both transmembrane segments as ATP opens the channel.
Materials and Methods
Molecular biology and cell culture. Mutations were generated in the rat P2X2 receptor (Brake et al., 1994) using the Quikchange site-directed mutagenesis kit (Stratagene, La Jolla, CA). Each mutation was verified using the 32P-Terminator Sequenase kit (Amersham Biosciences, Piscataway, NJ) or by an automated DNA sequencing service (Lark Technology, Houston, TX). Human embryonic kidney-293 (HEK-293) cells were grown in DMEM (Invitrogen, Carlsbad, CA), 10% fetal bovine serum (HyClone, South Logan, UT), and antibiotics in a humidified 5% CO2 atmosphere. The cells were transiently transfected by lipofection (Lipofectamine; Invitrogen) with the gene of interest and, when appropriate, a cDNA encoding the reporter green fluorescent protein (GFP). They were used in experiments 12-48 hr later.
Functional analysis of purinergic currents. Whole-cell currents were measured at room temperature from cells held at -60 mV using the amphoteracin B perforated-patch technique and Axopatch 200 series amplifiers (Axon Instruments, Union City, CA) as described previously (Migita et al., 2001). Data were digitized at 10 kHz with 16-bit accuracy using Macintosh G4 computers (Apple Computer, Cupertino, CA), ITC-16 analog-to-digital boards (Instrutech, Port Washington, NY), and external operations compiled in IGOR Pro (Wavemetrics, Lake Oswego, OR). The pipette solution contained the following: 130 mm Csmethanesulfonate, 24 mm CsCl, 1 mm MgCl2, 1 mm CaCl2, 10 mm HEPES, and 200 μg/ml amphoteracin B. The extracellular solution was as follows (in mm): 154 NaCl, 1 MgCl2, 1 CaCl2, 10 glucose, and 10 HEPES. The averaged cell capacitance for a sample of 100 cells was 14.6 ± 0.5 pF. Salts and drugs were obtained from Sigma-Aldrich (St. Louis, MO) unless noted otherwise.
Pharmacology. We generated dose-response curves for ATP and 2′-3′-O-(4-benzoylbenzoyl)ATP (BzATP) by applying these drugs through an RSC-200 Rapid Solution Changer (Biologic, Claix, France). In most cases, drugs were applied for 2 sec. However, in some cases, the effects of lower concentrations took longer to reach equilibrium, and drugs were applied until a steady-state current was recorded. Concentration clamp was reached in <50 msec (the average 10-90% rise time, measured by switching between solutions containing different concentrations of KCl, was 41.0 ± 0.1 msec; n = 17), and we waited 3 min or more between successive applications to minimize receptor desensitization. In each cell, agonist-gated current was normalized by dividing its peak amplitude by the average of that of two or more applications of 30 μm ATP. Concentration-response curves for individual cells were then fit with the Hill equation using the Levenberg-Marquardt algorithm implemented in IGOR Pro, as follows: Y = Ymax/[1 + (EC50/X)nH], where Y is the response, and X is the concentration. The fit was used to estimate the maximum response (Ymax), the concentration of agonist needed to evoke a half-maximal response (EC50), and the Hill slope (nH). The values of each of these parameters were appropriately pooled to determine differences among groups. We were unable to generate complete concentration-response curves for both ATP and BzATP in the same cell because these experiments outlasted the typical lifespan of the recording. Thus, the relative efficacy (ϵ′) of BzATP for each receptor was determined by generating full BzATP concentration-response curves in individual cells, normalizing these data to the response of the same cell to 30 μm ATP, fitting the data to the Hill equation described above, and then dividing individual estimates of Ymax,BzATP from single cells by the averaged Ymax,ATP of the pooled data of ATP on that receptor. The mutation-induced change in free energy required to open the channel (Δ(ΔG)) was calculated from the differences in EC50 values of mutant and wild-type (WT) receptor as follows: (Δ(ΔG)) = -RT × ln(EC50,mut/EC50,wt), where R is the molar gas constant, T is the temperature (K°), and EC50,mut and EC50,wt are the half-maximal ATP concentrations for the mutant and WT receptors, respectively (Mottig et al., 2001).
Deactivation. The rate of current deactivation on washout of ATP was determined from the length of time it took for the holding current to fall from 90 to 10% of the plateau current in response to ATP applied at a concentration equal to the EC50 value for the receptor under investigation. Although we were able to rapidly apply ATP to voltage-clamped cells, the rate of activation in many cases exceeded the time constant of our drug-application system. For this reason, we do not report activation rates here.
ATP assay. The concentration of ATP in the culture medium was measured using a luciferen-firefly tail extract assay as described previously (Dietrich et al., 2000).
Statistics. Data are reported as mean ± SEM for n number of cells. Differences in agonist potency were determined from statistical tests using the negative logarithm of the EC50 value (i.e., pEC50) (Kenakin, 1997). Significance was determined by ordinary one-way ANOVA and Tukey's post hoc test using InStat 3.0b (GraphPad, San Diego, CA). A comparison between two groups was made using Student's t test.
Results
The data presented here are from WT and 49 mutant P2X2 receptors with unique alanine substitutions in their two putative transmembrane-spanning segments. Forty-five mutants gave measurable inward currents when challenged with ATP, and, in most cases, mutant and WT channels behaved in a similar manner. However, some mutants displayed peak currents that were smaller on average than the WT receptor, were constitutively active, or had altered pharmacological properties, and these differences are described in detail below. The other four mutants (V45A, Y47A, V51A, and D349A) showed little or no current in response to high (1 mm) concentrations of ATP. These were remade using cDNA encoding a fusion construct of yellow fluorescent protein (YFP) tethered to the C terminus of the P2X2 channel as template (Fisher and Khakh, 2003). All four of the P2X2-YFP constructs produced detectable fluorescence in both the cytoplasm and surface membrane when expressed in HEK-293 cells and viewed with a confocal microscope, suggesting that the protein is made and properly targeted. These mutants were not studied further.
We investigated the effect of alanine substitutions on channel function in the following manner. We looked first at the effect of mutagenesis on holding current because this gave some indication of the level of constitutive activity. Next, we measured the potency and time course of the full agonist, ATP, to see whether the energetics of binding-gating had changed. Then, we looked for differences in the relative efficacy of the partial agonist, BzATP, again, to gauge the effect of mutagenesis on the ability of the channel to change conformations. We found that we could alter agonist pharmacology by mutagenesis of either TM1 or TM2, suggesting that both segments play a role in opening the channel.
Membrane current in the absence of ATP
Two different sources contribute to the holding current measured in a voltage-clamped cell at rest. The first is the leak current that results from the flow of ions through the glass-membrane seal, and the second is the sum of all of the membrane currents through the ion channels open at rest. We measured an average holding current of 0.75 ± 0.08 pA/pF (n = 26) in HEK-293 cells expressing the WT receptor, and this was not significantly different from that measured in cells expressing enhanced GFP (eGFP) alone (1.96 ± 0.62 pA/pF; n = 4). Most of the mutant receptors also displayed small holding currents of 0.5-2.0 pA/pF (Table 1). Y43A and F44A channels were exceptions. Expression of these two channels resulted in a large number of round cells floating in the culture dish 24 hr after transfection. The detached cells fluoresced and therefore expressed the reporter protein GFP. By inference, we assumed that they also expressed mutant P2X2 receptors. We considered the possibility that cell death resulted from an ongoing activation of Y43A and F44A by endogenous ATP present in the culture medium. We tested this hypothesis in two ways. First, we incubated cells expressing these proteins in apyrase (10 U/ml), an enzyme that degrades ATP, from the end of the transfection until the start of the experiment; this had no effect on survival rate or holding current (data not shown). Second, we measured the concentration of ATP in the medium using a luciferin-luciferase assay; it was 2.27 ± 0.77 nm (n = 6) in control medium and 5.82 ± 1.07 nm (n = 4) in medium used to culture cells expressing either mutant for 24 hr. These concentrations were too low to cause significant activation of even the most sensitive receptors (see below). We next considered the possibility that the mutations rendered the receptors constitutively active and that death reflected an ongoing transmembrane flux through mutant channels open at rest. To test this, we eliminated the floating cells and recorded membrane current from a sample of the remainder in a solution that contained no ATP. Cells transfected with either Y43A or F44A showed significantly larger holding currents (∼40-50 pA/pF) despite the fact that the seal resistances measured in the gigaohm range before perforation of the patch began. The data suggest that the Y43A and F44A mutants are active in the absence of ATP. Although both channels showed large peak currents in response to saturating concentrations of ATP (Table 1), the larger holding currents rendered the cells unsuitable for further experimentation. In experiments described below, we chose weakly fluorescing cells to further characterize the Y43A and F44A mutants. Our rationale was that cells showing lower levels of GFP expression also express fewer mutant receptors and that these cells are generally healthier because their baseline current is smaller and resting [Ca2+]in is low. The lightly fluorescing cells had average holding currents of 3.71 ± 1.13 and 8.5 ± 1.87 pA/pF and peak currents of 93.4 ± 26.2 and 140.8 ± 30.1 pA/pF for Y43A (n = 18) and F44A (n = 12), respectively, and the magnitude of these currents did not change during the course of an experiment.
Table 1.
ATP pharmacology of alanine-substituted mutants
|
|
n |
/basal (pA/pF) |
EC50 (μm) |
pEC50 |
nH |
Ymax (pA/pF) |
(Ymax//30μm) |
Δ(ΔG) (kcal/mol) |
|---|---|---|---|---|---|---|---|---|
| Mock | 4 | 1.96 ± 0.62 | 0 ± 0 | |||||
| WT | 26 | 0.75 ± 0.08 | 5.25 | 5.28 ± 0.07 | 1.76 ± 0.17 | 420 ± 36 | 1.15 ± 0.05 | |
| TM1 | ||||||||
| G30A | 7 | 0.81 ± 0.16 | 3.98 | 5.40 ± 0.06 | 1.64 ± 0.27 | 268 ± 43 | 1.05 ± 0.02 | 0.16 ± 0.08 |
| F31A | 7 | 0.60 ± 0.03 | 4.27 | 5.37 ± 0.03 | 1.88 ± 0.21 | 444 ± 36 | 1.04 ± 0.02 | 0.13 ± 0.04 |
| V32A | 6 | 0.75 ± 0.07 | 11.75 | 4.93 ± 0.07 | 2.00 ± 0.21 | 173 ± 14 | 1.26 ± 0.13 | −0.48 ± 0.10 |
| H33A | 7 | 0.93 ± 0.09 | 1.18 | 5.93 ± 0.07** | 2.21 ± 0.32 | 197 ± 48 | 0.98 ± 0.02 | 0.88 ± 0.10 |
| R34A | 6 | 0.78 ± 0.08 | 13.04 | 4.86 ± 0.04 | 2.00 ± 0.24 | 27 ± 12** | 1.49 ± 0.21 | −0.59 ± 0.06 |
| M35A | 7 | 0.83 ± 0.06 | 7.08 | 5.15 ± 0.09 | 1.45 ± 0.12 | 213 ± 62 | 1.19 ± 0.09 | −0.17 ± 0.12 |
| V36A | 6 | 0.86 ± 0.12 | 5.37 | 5.27 ± 0.06 | 1.64 ± 0.21 | 357 ± 71 | 1.08 ± 0.04 | 0.01 ± 0.08 |
| Q37A | 7 | 0.85 ± 0.15 | 33.11 | 4.48 ± 0.04** | 1.85 ± 0.13 | 203 ± 24 | 1.95 ± 0.21 | −1.08 ± 0.06 |
| L38A | 5 | 0.64 ± 0.03 | 5.50 | 5.26 ± 0.02 | 2.09 ± 0.24 | 298 ± 39 | 1.07 ± 0.04 | 0.03 ± 0.02 |
| L39A | 5 | 0.51 ± 0.04 | 6.03 | 5.22 ± 0.09 | 2.15 ± 0.18 | 311 ± 49 | 1.05 ± 0.04 | 0.08 ± 0.13 |
| I40A | 5 | 1.19 ± 0.09 | 0.96 | 6.02 ± 0.07** | 2.07 ± 0.23 | 209 ± 68 | 1.02 ± 0.02 | 1.01 ± 0.08 |
| L41A | 5 | 0.83 ± 0.09 | 15.14 | 4.82 ± 0.06* | 1.77 ± 0.07 | 218 ± 20 | 1.31 ± 0.08 | −0.63 ± 0.08 |
| L42A | 7 | 0.90 ± 0.05 | 3.89 | 5.41 ± 0.12 | 1.67 ± 0.16 | 384 ± 84 | 1.12 ± 0.07 | 0.17 ± 0.16 |
| Y43A | 9 | 39.54 ± 10.03** | 0.35 | 6.46 ± 0.19** | 1.37 ± 0.62 | 270 ± 52 | 1.01 ± 0.01 | 1.60 ± 0.26 |
| F44A | 9 | 48.99 ± 7.94** | 0.60 | 6.22 ± 0.20** | 2.06 ± 0.30 | 312 ± 17 | 0.99 ± 0.02 | 1.29 ± 0.28 |
| V45A | 6 | 1.02 ± 0.17 | nd | nd | nd | 4 ± 1** | nd | nd |
| W46A | 6 | 0.98 ± 0.14 | 7.76 | 5.11 ± 0.04 | 1.55 ± 0.17 | 399 ± 57 | 1.07 ± 0.05 | −0.22 ± 0.05 |
| Y47A | 5 | 1.23 ± 0.16 | nd | nd | nd | 2 ± 0** | nd | nd |
| V48A | 6 | 1.01 ± 0.06 | 3.98 | 5.40 ± 0.06 | 1.65 ± 0.13 | 218 ± 18 | 1.02 ± 0.01 | 0.16 ± 0.08 |
| F49A | 6 | 1.04 ± 0.11 | 5.88 | 5.23 ± 0.10 | 2.14 ± 0.36 | 272 ± 68 | 1.04 ± 0.02 | −0.07 ± 0.13 |
| I50A | 7 | 1.03 ± 0.03 | 27.54 | 4.56 ± 0.04** | 1.88 ± 0.15 | 225 ± 89 | 1.91 ± 0.19 | −0.98 ± 0.03 |
| V51A | 5 | 1.15 ± 0.14 | nd | nd | nd | 2 ± 0** | nd | nd |
| Q52A | 6 | 0.56 ± 0.14 | 10.72 | 4.97 ± 0.07 | 2.20 ± 0.43 | 275 ± 41 | 1.16 ± 0.02 | −0.42 ± 0.10 |
| K53A | 7 | 0.63 ± 0.09 | 8.91 | 5.05 ± 0.04 | 2.31 ± 0.20 | 206 ± 53 | 1.10 ± 0.04 | −0.32 ± 0.06 |
| S54A | 6 | 0.77 ± 0.12 | 8.32 | 5.08 ± 0.09 | 1.79 ± 0.31 | 206 ± 79 | 1.17 ± 0.07 | 0.27 ± 0.12 |
| TM2 | ||||||||
| I328A | 6 | 0.74 ± 0.11 | 0.62 | 6.21 ± 0.11** | 1.70 ± 0.22 | 272 ± 52 | 0.99 ± 0.02 | 1.26 ± 0.15 |
| P329A | 9 | 1.22 ± 0.11 | 1.70 | 5.77 ± 0.06** | 1.62 ± 0.29 | 416 ± 69 | 1.04 ± 0.02 | 0.70 ± 0.11 |
| T330A | 6 | 0.97 ± 0.11 | 3.55 | 5.45 ± 0.10 | 1.93 ± 0.30 | 286 ± 99 | 1.07 ± 0.05 | 0.23 ± 0.14 |
| I331A | 6 | 0.99 ± 0.10 | 4.57 | 5.34 ± 0.08 | 1.97 ± 0.25 | 305 ± 35 | 1.01 ± 0.02 | 0.08 ± 0.10 |
| I332A | 5 | 0.94 ± 0.09 | 3.55 | 5.45 ± 0.06 | 1.91 ± 0.18 | 245 ± 70 | 1.02 ± 0.02 | 0.23 ± 0.09 |
| N333A | 9 | 1.22 ± 0.06 | 1.07 | 5.97 ± 0.07** | 1.57 ± 0.10 | 339 ± 44 | 1.01 ± 0.01 | 0.94 ± 0.09 |
| L334A | 6 | 0.71 ± 0.07 | 4.37 | 5.36 ± 0.10 | 1.23 ± 0.10 | 363 ± 67 | 1.08 ± 0.05 | 0.11 ± 0.13 |
| T336A | 6 | 0.76 ± 0.08 | 5.62 | 5.25 ± 0.14 | 1.67 ± 0.15 | 222 ± 47 | 1.09 ± 0.05 | −0.05 ± 0.19 |
| L338A | 12 | 1.01 ± 0.08 | 27.54 | 4.56 ± 0.07** | 1.66 ± 0.22 | 283 ± 20 | 2.39 ± 0.30 | −0.98 ± 0.10 |
| T339A | 7 | 1.19 ± 0.10 | 1.55 | 5.81 ± 0.07** | 1.98 ± 0.21 | 370 ± 56 | 1.01 ± 0.01 | 0.72 ± 0.09 |
| S340A | 9 | 0.87 ± 0.06 | 19.50 | 4.71 ± 0.06** | 2.38 ± 0.15 | 211 ± 3 | 1.61 ± 0.14 | −0.78 ± 0.09 |
| I341A | 10 | 1.96 ± 0.13 | 7.59 | 5.12 ± 0.09 | 1.94 ± 0.07 | 229 ± 32 | 1.26 ± 0.13 | −0.22 ± 0.13 |
| G342A | 18 | 1.24 ± 0.19 | 26.30 | 4.59 ± 0.04** | 1.68 ± 0.12 | 289 ± 33 | 2.04 ± 0.15 | −0.95 ± 0.06 |
| V343A | 10 | 1.80 ± 0.09 | 0.66 | 6.18 ± 0.07** | 1.41 ± 0.13 | 301 ± 68 | 1.00 ± 0.01 | 1.23 ± 0.10 |
| G344A | 14 | 1.11 ± 0.17 | 66.07 | 4.18 ± 0.07** | 1.68 ± 0.14 | 251 ± 39 | 2.76 ± 0.26 | −1.50 ± 0.10 |
| S345A | 11 | 0.83 ± 0.16 | 15.49 | 4.81 ± 0.07** | 1.44 ± 0.13 | 236 ± 5 | 1.47 ± 0.09 | −0.64 ± 0.10 |
| F346A | 10 | 0.88 ± 0.12 | 6.46 | 5.19 ± 0.10 | 1.88 ± 0.12 | 397 ± 48 | 1.09 ± 0.04 | −0.12 ± 0.14 |
| L347A | 6 | 1.01 ± 0.03 | 12.02 | 4.92 ± 0.08 | 1.79 ± 0.16 | 217 ± 48 | 1.31 ± 0.09 | −0.49 ± 0.10 |
| C348A | 7 | 1.02 ± 0.09 | 10.72 | 4.97 ± 0.08 | 1.72 ± 0.20 | 457 ± 28 | 1.25 ± 0.15 | −0.43 ± 0.10 |
| D349A | 5 | 1.21 ± 0.14 | nd | nd | nd | 3 ± 1** | nd | nd |
| W350A | 8 | 0.87 ± 0.07 | 8.51 | 5.07 ± 0.09 | 1.81 ± 0.12 | 278 ± 35 | 1.18 ± 0.09 | −0.29 ± 0.12 |
| I351A | 6 | 1.03 ± 0.13 | 9.77 | 5.01 ± 0.06 | 2.21 ± 0.32 | 246 ± 49 | 1.13 ± 0.06 | −0.37 ± 0.08 |
| L352A | 9 | 0.85 ± 0.10 | 8.32 | 5.08 ± 0.05 | 2.11 ± 0.07 | 276 ± 38 | 1.11 ± 0.03 | −0.27 ± 0.07 |
| L353A |
6 |
1.12 ± 0.14 |
9.12 |
5.04 ± 0.08 |
2.03 ± 0.16 |
223 ± 39 |
1.08 ± 0.04 |
−0.32 ± 0.11 |
Data from experiments like those shown in Figure 1./basal is the holding current measured in the absence of agonist; all other parameters are defined in Results./basal and Ymax of Y43A and F44A were determined in one set of experiments, and EC50, nH, and Ymax//30 μm were determined in another, also as described in Results. Mock, Cells expressing only GFP; n, the number of times that complete concentration-response curves were generated in single cells; nd, not determined. We did not test for differences in Ymax//30μm or Δ(ΔG). The average cell capacitance was 14.6 ± 0.5 pF (n = 100).
*p < 0.05; **p < 0.01.
The large holding currents seen in the absence of ATP suggests that Y43A and F44A are constitutively active receptors, an effect that would be expected if the conformational equilibrium constant between the open and closed states of the channel has changed in a manner that favors the active state (Colquhoun, 1998).
Alanine substitutions alter ATP potency
Figure 1 shows representative raw data obtained from three different cells using our fast drug-application system. To control for desensitization, increasing or decreasing concentrations of ATP were tested two or more times in each cell. We found that repeated 2 sec challenges of the same concentration gave similar results when the interdrug interval was 3 min and that the measured affinities were the same regardless of the order in which the different concentrations were applied. T339A showed a more profound desensitization during the administration of agonist and required 5 min or more to recover the full response to subsequent applications. However, it was still possible to generate reliable dose-response curves as long as the altered rate of recovery was taken into account (Fig. 1C).
Figure 1.
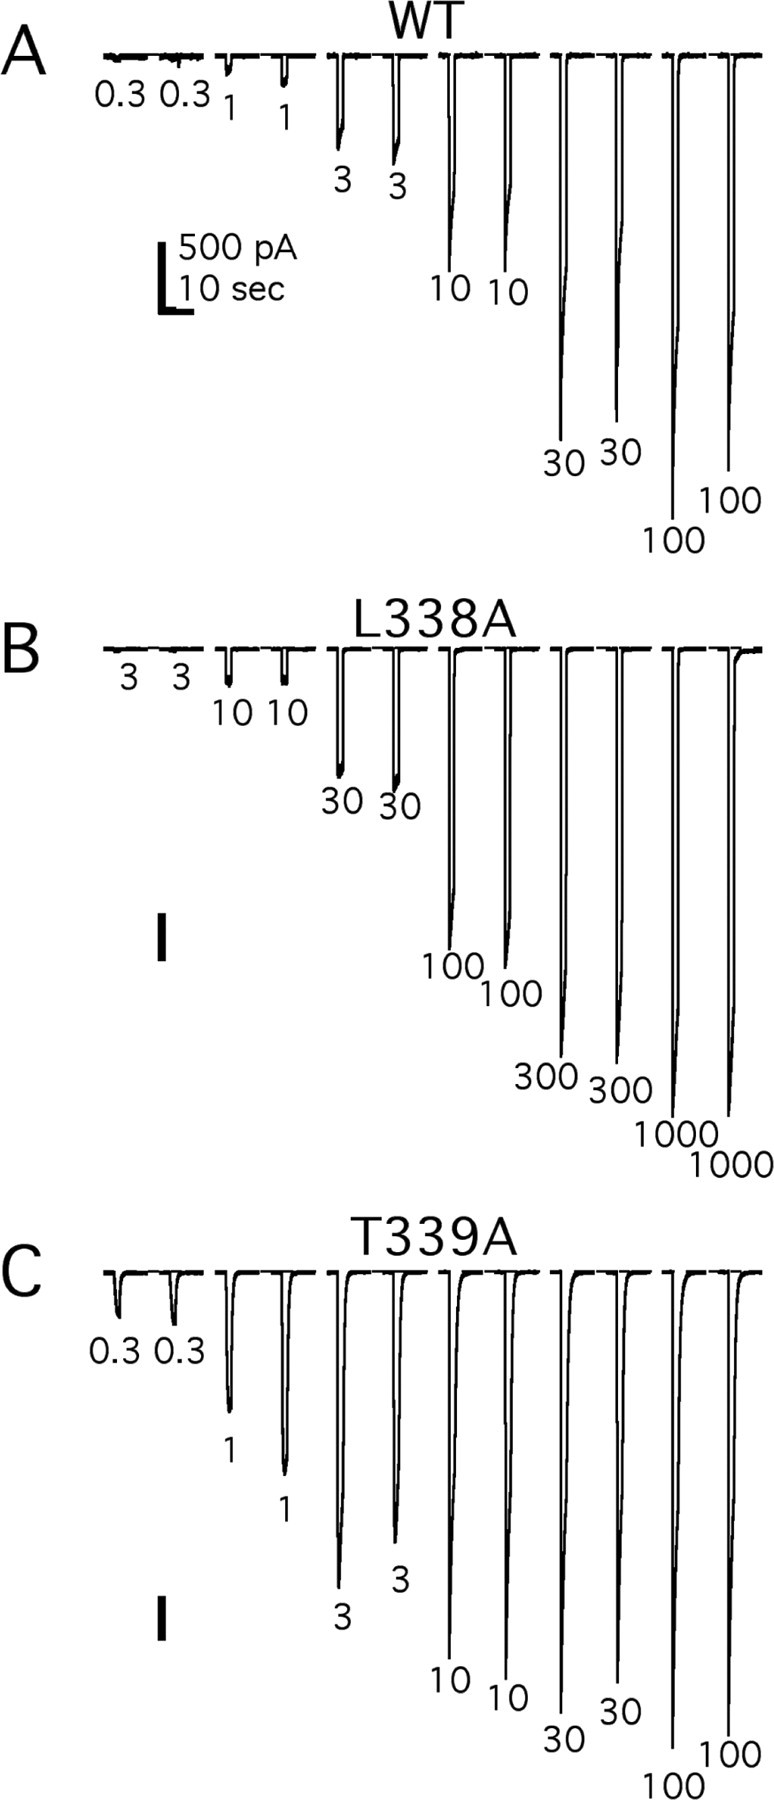
ATP evokes reproducible currents in HEK-293 cells expressing WT and mutant P2X2 receptors. A, Twelve raw data traces from the WT receptor. Each trace is 15 sec of current, and the gaps indicate interdrug intervals of 3 min. Each concentration of ATP (0.3, 1, 3, 10, 30, 100, 300, or 1000 μm) was applied twice for 2 sec with similar results. B, C, Raw data from two mutant receptors showing a lesser (L338A) or greater (T339A) sensitivity to ATP than the WT receptor. Again, each trace is 15 sec long, and the gaps indicate interdrug intervals of either 3 min (WT and L338A) or 5 min (T339A).
Experiments like those pictured in Figure 1 were duplicated in all 45 functional mutant receptors. Each mutant was tested four or more times, data from single cells were fit with the Hill equation to estimate nH, Ymax, and the pEC50 value of ATP (Fig. 2), and these estimates were pooled to determine differences among groups (Table 1). ATP (30 μM) caused no inward current (0.38 ± 0.23 pA/pF; n = 4) in cells expressing only eGFP.
Figure 2.
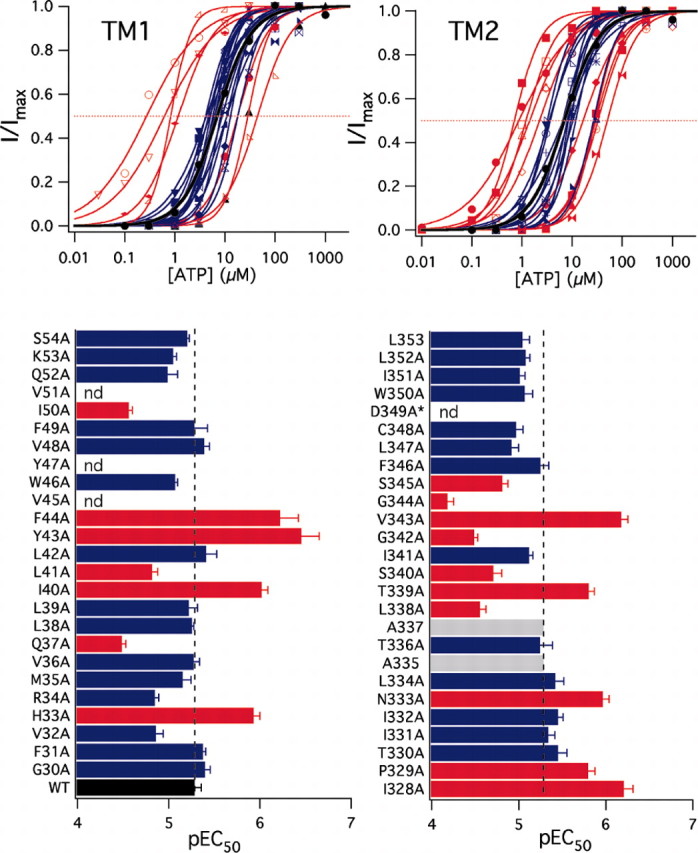
Pharmacological characterization of the response to ATP. Concentration-response curves were generated for the WT receptor and each of the functional alanine-substituted P2X2 mutants. Top, Concentration-response curves generated for TM1 (left) and TM2 (right) mutants; these show the averaged values of the pooled responses to increasing concentrations of ATP. Data are shown as the averaged peak current amplitude for each concentration of ATP divided by the averaged amplitude of the peak response to the highest concentration of ATP (I/Imax). This sets the limits of the range of the response from 0 (no response) to 1 (maximum response) and makes it easier to compare the relative positions of the concentration-response curves on the x-axis. The solid lines are the best fits of the averaged data to Y = 1/[1 + (Xhalf/X)rate]. In this figure, we do not show the error bars of the pooled responses for the sake of clarity; error bars are shown in Figure 4 for the most relevant receptors. The solid black line is the best fit of the WT data. Blue lines are not significantly different from the WT receptor. Red lines are significantly different. Bottom, The averaged pEC50 values for WT and mutant receptors determined from the pooled data of individual determinations in single cells. Red bars denote significant differences from WT, blue bars are not significant, and gray bars mark the position of the endogenous alanines (Ala335 and Ala337) in TM2. nd, Not determined.
We made four observations. First, peak current density was essentially unaffected. Ymax is an estimate of the current density derived from the plateau of the concentration-response curve. In our experiments, it ranged from ∼170 to 450 pA/pF for 44 of 45 functional mutants and was statistically the same as that of the WT receptor. The R34A channel had a significantly (p < 0.01) smaller peak current density (Ymax equaled 27 ± 12 pA/pF). It is impossible to draw firm conclusions from current amplitudes of LGICs expressed in HEK-293 cells because a change in this parameter can result from altered expression, targeting, and/or function. However, although smaller than normal, ATP-gated currents through the R34A receptor were large enough to permit construction of full concentration-response curves as described below.
Second, nH was unchanged. P2X receptors show cooperative behavior in both binding and gating (Ding and Sachs, 1999, 2002), and mutations that affect either process would be expected to alter nH. However, we found that the nH of the mutant receptors ranged from 1.16 to 2.38 (Table 1) and that these values were not statistically different (p > 0.05) from that of the WT receptor (1.76 ± 0.17; n = 26). The fact that alanine substitutions do not change nH might reflect the inability of these mutations to alter the energetics of binding and gating. Another possibility is that ATP is a highly efficacious agonist and, as such, requires a dramatic change in binding-gating efficiency to produce a measurable change in nH (Colquhoun, 1998). We used a less efficacious agonist, BzATP, to address this concern, and these results are described later in the paper.
Third, several mutants displayed altered sensitivities to ATP. The EC50 value is the molar concentration of an agonist required to produce 50% of the maximal current and reflects both the affinity of the agonist for its binding site and the ability of the channel to gate. We found that the EC50 value (derived from the averaged pEC50) of the WT receptor was 5.25 μM (n = 26) with 95% confidence limits of 3.46-7.94 μM, a range in keeping with those described previously (Khakh et al., 2001). Mutagenesis had no effect on ATP potency in 28 of 45 alanine-substituted receptors, and these receptors were not studied further. In contrast, eight mutants (Q37A, L41A, I50A, L338A, S340A, G342A, G344A, and S345A) showed a decrease in potency, and nine (H33A, I40A, Y43A, F44A, I328A, P329A, N333A, T339A, and V343A) showed an increase. Some of the largest effects occurred in the two mutants (Y43A and F44A) that showed large holding currents in the absence of agonist; these had leftward-shifted ATP concentration-response curves and were 9-15 times more sensitive to ATP (EC50 values of 347 and 603 nm, respectively) than the WT receptor. In TM1, a recognizable pattern of susceptibility to mutagenesis was apparent. His33, Gln37, Ile40, Tyr43, Tyr47, and Ile50 form a pattern in which every third or fourth residue was affected by substitution of alanine; such a pattern is consistent with a helical secondary structure. The two other mutants with altered ATP sensitivities (Leu41 and Phe44) lay immediately beside the stretch of six residues listed above, and all eight residues line the same face of the helix. No such pattern was seen in TM2. Rather, the alanine-sensitive residues cluster into two groups. The first is made of Ile328, Pro329, and Asn333, three residues that are positioned at or near the extracellular entrance to the pore. These had leftward-shifted concentration-response curves and EC50 values of 0.6-1.7 μM. The second group is a near contiguous stretch of eight residues from Leu338 to Ser345. Seven of these had altered ATP potencies ranging from ∼0.7 to 66 μM; I341A was the exception and resembled the WT receptor. The fact that so many neighboring residues are altered by alanine mutagenesis argues against a lipid-facing, helical topology for this part of TM2. A similar conclusion was drawn from a study using the substituted cysteine accessibility method (Egan et al., 1998).
Fourth, potency and deactivation changed in parallel. We determined the effect of alanine mutagenesis on the rate of decay of the ATP-gated current by measuring the time it took for the response to fall from 90 to 10% of its peak response (90-10 time) on washout of drug (Table 2). In each case, ATP was applied in a concentration equal to the EC50 value of the receptor under investigation. We found that the WT receptor had a 90-10 time of 286 ± 32 msec (n = 10). Deactivation took significantly longer in 9 of 10 mutant receptors having leftward-shifted ATP concentration-response curves, an effect that was particularly pronounced for the constitutively active TM1 receptors Y43A (2677 ± 129 msec) and F44A (2127 ± 242 msec), and P329A (2706 ± 146 msec) and V343A (5045 ± 201 msec) of TM2. All eight mutants with rightward-shifted concentration-response curves decayed quicker, often approaching or surpassing the time resolution of our drug application system. Both G342A (37 ± 1 msec) and G344A (90 ± 18 msec) showed fast deactivation on washout of ATP, perhaps because the mutations produced a stiffer protein that destabilized the open state of the channel. Overall, the changes in deactivation kinetics suggest that one effect of the alanine substitutions is to alter the equilibrium between the open and closed states of the channel.
Table 2.
90-10% fall time
|
|
n |
90-10 time (sec) |
|---|---|---|
| WT | 10 | 0.28 ± 0.03 |
| H33A | 6 | 0.46 ± 0.05 |
| Q37A | 5 | 0.06 ± 0.01* |
| I40A | 6 | 1.57 ± 0.15* |
| L41A | 6 | 0.07 ± 0.01* |
| Y43A | 9 | 2.68 ± 0.13* |
| F44A | 5 | 2.13 ± 0.24* |
| I50A | 9 | 0.11 ± 0.02* |
| I328A | 5 | 0.85 ± 0.19* |
| P329A | 7 | 2.71 ± 0.15* |
| N333A | 6 | 1.44 ± 0.19* |
| L338A | 5 | 0.06 ± 0.00* |
| T339A | 7 | 1.05 ± 0.09* |
| S340A | 5 | 0.04 ± 0.00* |
| G342A | 5 | 0.04 ± 0.00* |
| V343A | 5 | 5.06 ± 0.16* |
| G344A | 6 | 0.09 ± 0.02* |
| S345A |
5 |
0.15 ± 0.04*
|
All drugs were applied at concentrations equal to the EC50 value of the receptor under investigation.
p<0.01 for log(90 - 10 time).
The relative efficacy of BzATP is changed
Efficacy is a measure of the ability of the receptor to function after binding agonist. In the case of an LGIC, it reflects the ease with which the protein assumes a conformation that allows transmembrane current to flow (Colquhoun, 1998). Any mutation that alters the ability of the receptor to move between conformations changes efficacy and in so doing may alter the size of the peak response. In the case of a very efficacious agonist like ATP, a large change is needed before peak current is affected. In a final set of experiments, we determined the effect of mutagenesis on the relative efficacy (ϵ′) of BzATP, a partial agonist that produces ∼65-70% of the maximal response of the WT receptor to ATP (Evans et al., 1995; Bianchi et al., 1999). Because BzATP is less efficacious than ATP, its peak current is more sensitive to changes (Fig. 3). We constructed BzATP concentration-response curves for the mutants with altered sensitivities to ATP. We found that the sensitivity of the mutants to both ATP and BzATP changed in parallel and that the maximal BzATP response was different in 13 of 17 mutants (Fig. 4). The EC50 value of BzATP of the WT receptor was 17.38 μM and ϵ′ (equal to Imax,BzATP/Imax,ATP) was 0.69 ± 0.03 (n = 6). Every mutant (Q37A, L41A, I50A, L338A, S340A, G342A, G344A, and S345A) that showed a significant rightward-shifted ATP concentration-response curve also had an ϵ′ that was <50% of control (Table 3). Such effects suggest that these mutant receptors have a harder time reaching the open state than does the WT receptor. Five of nine mutants (Y43A, I328A, N333A, T339A, and V343A) with leftward-shifted ATP concentration-response curves had increased ϵ′, and, in some cases, the effect was large enough to impart the characteristics of a full agonist on BzATP. The effects on ϵ′ were spread throughout TM1 and TM2, and every residue in the stretch from Leu338 through Ser345 (except Ile341) was changed. The largest changes in potency and ϵ′ occurred in the Gly342-Val343-Gly344 region. Mutating Gly342 and Gly344 greatly reduced both potency and ϵ′, whereas alanine mutagenesis of Val343 produced a receptor at which BzATP was a full agonist. Again, together, the data suggest that both TM1 and TM2 undergo conformational changes as the result of occupation of the extracellular binding site, implying that both segments play a role in channel gating.
Figure 3.

Representative raw data traces for the effect of BzATP on WT and three P2X2 mutants. Each set of traces shows the effects of both ATP and BzATP on a different receptor. Agonist concentrations are indicated below or next to each current trace. Currents elicited by ATP are marked with asterisks. Theϵ′ was determined from experiments like these by dividing the normalized Ymax,BzATP/I30μm,ATP by the averaged value of Ymax,ATP/I30μm,ATP for that mutant determined in separate experiments. Each trace shows 12 sec of raw data, and gaps indicate 3 min of wait time between drug applications.
Figure 4.

Concentration-response curves plotted from the averaged data of the pooled responses to ATP (filled circles) and BzATP (open circles) determined in experiments like those shown in Figure 3. All currents are normalized to the effect of 30 μm ATP.
Table 3.
BzATP pharmacology of alanine-substituted mutants
|
|
n |
EC50 (μm) |
pEC50 |
ϵ′ |
|---|---|---|---|---|
| WT | 6 | 17.38 | 4.76 ± 0.13 | 0.69 ± 0.03 |
| H33A | 13 | 7.94 | 5.10 ± 0.08 | 0.66 ± 0.09 |
| Q37A | 6 | 72.44 | 4.14 ± 0.05 | 0.26 ± 0.02** |
| I40A | 5 | 1.51 | 5.82 ± 0.03 | 0.86 ± 0.03 |
| L41A | 6 | 33.11 | 4.48 ± 0.02 | 0.32 ± 0.02** |
| Y43A | 7 | 1.26 | 5.90 ± 0.13 | 0.90 ± 0.04* |
| F44A | 11 | 1.00 | 5.99 ± 0.06 | 0.80 ± 0.03 |
| I50A | 7 | 37.15 | 4.43 ± 0.09 | 0.33 ± 0.05** |
| I328A | 5 | 1.38 | 5.86 ± 0.04 | 0.89 ± 0.01** |
| P329A | 5 | 3.47 | 5.46 ± 0.11 | 0.66 ± 0.01 |
| N333A | 7 | 4.07 | 5.39 ± 0.06 | 0.94 ± 0.02** |
| L338A | 10 | 74.13 | 4.13 ± 0.11 | 0.28 ± 0.05** |
| T339A | 6 | 8.51 | 5.07 ± 0.09 | 0.96 ± 0.03** |
| S340A | 7 | 75.86 | 4.12 ± 0.07 | 0.31 ± 0.04** |
| G342A | 5 | 63.10 | 4.20 ± 0.04 | 0.36 ± 0.01** |
| V343A | 4 | 1.91 | 5.72 ± 0.13 | 1.01 ± 0.15** |
| G344A | 8 | 91.20 | 4.04 ± 0.05 | 0.11 ± 0.02** |
| S345A |
5 |
21.38 |
4.67 ± 0.13 |
0.42 ± 0.03*
|
Data from experiments like those pictured in Figure 3.
* and ** denote differences in ϵ′ (equal to Ymax,BzATP/Ymax,ATP) between WT and mutant receptors at p<0.05 and p<0.01, respectively.
Discussion
Although it is impossible to compose a hard-and-fast model of P2X structure without definitive data in the form of a crystal, it is tempting to suggest one based on KcsA, a potassium channel of known structure (Doyle et al., 1998). KcsA is an oligomer of four subunits, and, like P2X receptors, each subunit has two transmembrane segments. The first segment forms an outer helix that anchors the protein in the lipid membrane, and the second forms an inner helix that lines the pore. Furthermore, the gate is made of a narrow, hydrophobic constriction of the inner helices that serves as an energy barrier to the flow of ions. This constriction is relieved, and the channel opens, when the inner helices bend outward by 30° at a flexible gating hinge that has a conserved glycine as a key component (Jiang et al., 2002). Although the tertiary and quarternary structures of the KcsA and P2X channels are likely to be significantly different, we expect that some of the lessons learned from the K+ channel structure may also apply to ionotropic ATP-gated channels. In this report, we test the common but unproven assumptions that, like KcsA, the transmembrane domains of P2X receptors are helical (Brake et al., 1994) and rearrange on opening. Alanine and tryptophan mutagenesis have been used with good success to predict secondary structure (Kortemme et al., 2004) and identify gating domains (Yifrach and MacKinnon, 2002) in a number of ion channels. In general, this technique works better for large, tightly packed proteins with multiple transmembrane domains (Sharp et al., 1995; Monks et al., 1999; Li-Smerin et al., 2000; Panchenko et al., 2001; Hackos et al., 2002; Jenkins et al., 2002; Yarov-Yarovoy et al., 2002; Guzman et al., 2003) than for simpler two-transmembrane channels (Collins et al., 1997). Nonetheless, we found that it did produce a recognizable pattern for one of the two transmembrane segments of the P2X2 receptor. TM1 showed a regular pattern of potency-sensitive substitutions that extends across the entire membrane from His33 to Ile50 (Fig. 5A). Such a pattern is unlikely to occur by chance and may suggest that TM1 is helical. If so, then the reactive side of this helix probably faces away from lipid because alanine substitutions at protein-lipid interfaces should be benign. Furthermore, all of the polar and charged residues that fall between His33 and Ile50 line the same face as the alanine-sensitive mutants, again suggesting that this side faces away from the neutral environment of the lipid membrane. By inference then, the unreactive-neutral side may be partially embedded in lipid and, in so doing, act to stablize the protein by virtue of its amphipathic nature. Furthermore, two findings suggest that this domain also participates in opening the channel. First, alanine substitutions at two positions, Tyr43 and Phe44, produced larger than normal holding currents in the absence of ATP. We eliminated the possibility that this reflects ongoing activation of the receptors by ATP in the culture medium, leading us to believe that the mutations produce constitutively active channels. Mutations that cause constitutive activity result from a change in the equilibrium between the open and closed states (Colquhoun, 1998); if so, then our evidence suggests that Tyr43 and Phe44 participate in the rearrangement of protein that occurs during gating. This idea is supported by the fact that alanine mutagenesis of these sites produced some of the largest changes in the energetics of gating with Δ(ΔG) values equaling ∼1-2 kcal/mol. Such large changes might occur if mutagenesis stabilizes an open state or destabilizes a closed state, an outcome that would also explain the 10 times slower deactivation rates of the two receptors. The second finding is that many of the mutations in TM1 lead to significant changes in the efficacy of BzATP. Again, a change in efficacy reflects a difference in the energetics of gating between WT and mutant receptors. Our experiments do not differentiate a change in the conformation of the ligand-binding core from a change in the conformation of the gate. Indeed, experiments like ours (i.e., perturbation of agonist potency by alanine mutagenesis) have been used to identify putative ATP binding sites of the extracellular loops of the P2X1 and P2X2 receptors (North, 2002; Roberts and Evans, 2004). However, it is unlikely that the mutations that we describe here directly bind ATP because they lie within the plane of the membrane.
Figure 5.

A helical net representation of the transmembrane segments of the P2X2 receptor. Loss-of-function mutants have thick black borders. Alanine substitutions that affect ATP potency are shown in gray. A, TM1 shows a distinct pattern of alanine hits that line one face of the helix. B, Hot spots in TM2 form two groups centered around Pro329 and Gly342, respectively.
No regular pattern of hits was seen in TM2. Rather, the alanine-sensitive residues cluster into two groups (Fig. 5B). The first group includes Iso328 and Pro329 of P2X2, two neutral amino acids that are conserved in all members of the family except the P2X7 receptor, and polar Asn333. Proline is disfavored in helices because its inability to hydrogen bond produces kinks or bends in the secondary structure (Petsko and Ringe, 2004), and it is more likely to signal a β turn (Williams et al., 1987). We found that the P329A mutation altered agonist potency and resulted in ATP-gated currents that took 10 times longer to deactivate than the WT receptor, effects consistent with a slowed rate of channel closure that may happen because P329A alters the orientation or tilt of TM2 in the membrane. However, the P329A mutation caused only a modest change in ΔG (∼0.7 kcal/mol) and did not alter the efficacy of the partial agonist BzATP. Proline-to-alanine mutations also cause relatively mild effects on the gating of glycine channels (Lynch et al., 1997), and other substitutions are more severe (Saul et al., 1999). In light of this, a more complete analysis of the effects of additional mutagenesis on Pro329 of the P2X2 receptor seems warranted. The effects of alanine mutagenesis of Ile328 and Asn333 are harder to explain. The fact that Ile328 is conserved throughout the family argues that it plays some role in the function of the protein. The pore is thought to be relatively wide near Ile328 and Asn333 (Rassendren et al., 1997; Migita et al., 2001), and it seems unlikely that these residues contribute to a constriction that occludes current when the channel is closed. Rather, it is possible that they form a part of the linker that connects the extracellular ATP binding site located near the extracellular mouth of the channel (Ennion et al., 2000; Jiang et al., 2000) to the intrapore gate.
The second group of hot spots in TM2 is a near contiguous stretch of residues from Leu338 to Ser345. The lack of periodicity in this stretch suggests that TM2 does not form a static, lipid-embedded helix in this part of the transmembrane segment. A similarly contiguous pattern was noted in experiments that tested the ability of hydrated Ag+ to modify cysteine-substituted mutants of TM2 of P2X2 (Egan et al., 1998). Within this stretch is a motif (G-V/L-A/G) that is found in all of the functional murine P2X receptors, and circumstantial evidence suggests that it forms a part of the channel gate. Specifically, G342 is conserved in all family members, and mutating it to cysteine results in a thiolate that is accessible from either side of the membrane to water-soluble thio-reactive reagents (Egan et al., 1998); this could occur if the amino acid occupies a position at the transition between the “inside” and the “outside” of the transmembrane pore. Furthermore, mutating the homologous position of the P2X4 receptor prevents the transition between gating modes that occurs in lowered extracellular Ca2+ (Khakh et al., 1999). We found that mutating either Gly342 or Gly344 to alanine had the multiple effects, including a dramatic decrease in ATP potency, a large change in ΔG, quicker deactivation, and a fall in BzATP efficacy. This is surprising because glycine and alanine are approximately the same size, have the same relative hydrophobicity, and safely substitute for each other in mutagenesis (Bordo and Argos, 1991). The difference is that glycine has more conformational freedom than alanine, and an alanine-for-glycine swap would be expected to increase the rigidity of the peptide. If gating involves movement of the G-V-G segment, then the large effect of alanine substitutions at these spots may be explained by a decrease in the ability of the receptor to switch between conformations in response to the energy supplied by binding ATP. Glycine forms a part of the “gating hinge” of some ion channels (Jiang et al., 2002), and, by analogy then, it is possible that the alanine substitutions at Gly342 and Gly344 of the P2X2 receptor alter ATP potency by disrupting the ability of a TM2 gating domain to change conformation. Mutating Val343 to alanine had the opposite effect and produced receptors with the longest deactivation rate of any mutant receptor. Alanine is smaller than valine, and this may impair packing in a gating domain of the protein, making it easier for the channel to open.
Our results present the most complete map to date of the functional domains of the transmembrane segments of a P2X receptor. Several additional experiments now seem reasonable. We suggest that TM1 and TM2 repack on opening, a finding that should not be surprising in light of empirical data showing that the diameter of the pore increases by several angstroms on opening (Eickhorst et al., 2002). As such, it will be interesting to determine the effect of scanning alanine mutagenesis on this dilation. Single-channel analysis of the effect of alanine substitutions on gating kinetics is also a worthwhile goal, although these experiments will be arduous at best because full openings are difficult to resolve (Bean, 1990; Ding and Sachs, 1999). Chemical cross-linkers and cysteine-substituted mutants have been used to provide a preliminary map of the relative positions of opposing residues within the pore (Spelta et al., 2003). Our data suggest that additional combinations are possible, an idea worth testing in the near future. Finally, several alanine-substituted mutants are extremely sensitive to ATP, and membranes expressing these proteins may provide a more useful bioassay to detect ATP release from living tissue than is currently available (Lazarowski et al., 2003).
The manner in which ATP binding is translated into P2X channel gating will remain a mystery until the crystal structure of the protein is solved. In the meantime, our data provide a road-map for future experiments.
Footnotes
This work was supported by the National Institutes of Health. We thank Angela Lipka for help with tissue culture and transfections, Mary Ellsworth for measuring the concentration of ATP in the medium, and Baljit Singh Khakh and Graeme Henderson for reviewing this manuscript. The cDNA encoding P2X2-YFP was a gift from Dr. Baljit Singh Khakh (Medical Research Council Laboratory of Molecular Biology, Cambridge, UK).
Correspondence should be addressed to Dr. Terrance M. Egan, Department of Pharmacological and Physiological Science, Saint Louis University School of Medicine, 1402 South Grand Boulevard, St. Louis, MO 63104. E-mail: egantm@slu.edu.
K. Migita's present address: Department of Pharmacology, Fukuoka University School of Medicine, 7-45-1 Nanakuma, Jounan-ku Fukuoka, Fukuoka 814-0180, Japan.
Copyright © 2004 Society for Neuroscience 0270-6474/04/249378-•$15.00/0
References
- Bean BP (1990) ATP-activated channels in rat and bullfrog sensory neurons: concentration dependence and kinetics. J Neurosci 10: 1-10. [DOI] [PMC free article] [PubMed] [Google Scholar]
- Benham CD, Tsien RW (1987) A novel receptor-operated Ca2+-permeable channel activated by ATP in smooth muscle. Nature 328: 275-278. [DOI] [PubMed] [Google Scholar]
- Bianchi BR, Lynch KJ, Touma E, Niforatos W, Burgard EC, Alexander KM, Park HS, Yu H, Metzger R, Kowaluk E, Jarvis MF, van Biesen T (1999) Pharmacological characterization of recombinant human and rat P2X receptor subtypes. Eur J Pharmacol 376: 127-138. [DOI] [PubMed] [Google Scholar]
- Bordo D, Argos P (1991) Suggestions for “safe” residue substitutions in site-directed mutagenesis. J Mol Biol 217: 721-729. [DOI] [PubMed] [Google Scholar]
- Brake AJ, Wagenbach MJ, Julius D (1994) New structural motif for ligand-gated ion channels defined by an ionotropic ATP receptor. Nature 371: 519-523. [DOI] [PubMed] [Google Scholar]
- Collins A, Chuang H, Jan YN, Jan LY (1997) Scanning mutagenesis of the putative transmembrane segments of Kir2.1, an inward rectifier potassium channel. Proc Natl Acad Sci USA 94: 5456-5460. [DOI] [PMC free article] [PubMed] [Google Scholar]
- Colquhoun D (1998) Binding, gating, affinity and efficacy: the interpretation of structure-activity relationships for agonists and of the effects of mutating receptors. Br J Pharmacol 125: 924-947. [DOI] [PMC free article] [PubMed] [Google Scholar]
- Dietrich HH, Ellsworth ML, Sprague RS, Dacey Jr RG (2000) Red blood cell regulation of microvascular tone through adenosine triphosphate. Am J Physiol Heart Circ Physiol 278: H1294-H1298. [DOI] [PubMed] [Google Scholar]
- Ding S, Sachs F (1999) Single channel properties of P2X2 purinoceptors. J Gen Physiol 113: 695-720. [DOI] [PMC free article] [PubMed] [Google Scholar]
- Ding S, Sachs F (2002) Evidence for non-independent gating of P2X2 receptors expressed in Xenopus oocytes. BMC Neurosci 3: 17. [DOI] [PMC free article] [PubMed] [Google Scholar]
- Doyle DA, Morais Cabral J, Pfuetzner RA, Kuo A, Gulbis JM, Cohen SL, Chait BT, MacKinnon R (1998) The structure of the potassium channel: molecular basis of K+ conduction and selectivity. Science 280: 69-77. [DOI] [PubMed] [Google Scholar]
- Egan TM, Khakh BS (2004) Contribution of calcium ions to P2X channel responses. J Neurosci 24: 3413-3420. [DOI] [PMC free article] [PubMed] [Google Scholar]
- Egan TM, Haines WR, Voigt MM (1998) A domain contributing to the ion channel of ATP-gated P2X2 receptors identified by the substituted cysteine accessibility method. J Neurosci 18: 2350-2359. [DOI] [PMC free article] [PubMed] [Google Scholar]
- Eickhorst AN, Berson A, Cockayne D, Lester HA, Khakh BS (2002) Control of P2X2 channel permeability by the cytosolic domain. J Gen Physiol 120: 119-131. [DOI] [PMC free article] [PubMed] [Google Scholar]
- Ennion S, Hagan S, Evans RJ (2000) The role of positively charged amino acids in ATP recognition by human P2X1 receptors. J Biol Chem 275: 35656. [PubMed] [Google Scholar]
- Evans RJ, Lewis C, Buell G, Valera S, North RA, Surprenant A (1995) Pharmacological characterization of heterologously expressed ATP-gated cation channels (P2X purinoceptors). Mol Pharmacol 48: 178-183. [PubMed] [Google Scholar]
- Fisher JA, Khakh BS (2003) Fret imaging and electrophysiological studies of P2X channels. Soc Neurosci Abstr 29: 250.4. [Google Scholar]
- Guzman GR, Santiago J, Ricardo A, Marti-Arbona R, Rojas LV, Lasalde-Dominicci JA (2003) Tryptophan scanning mutagenesis in the alphaM3 transmembrane domain of the Torpedo californica acetylcholine receptor: functional and structural implications. Biochemistry 42: 12243-12250. [DOI] [PubMed] [Google Scholar]
- Hackos DH, Chang TH, Swartz KJ (2002) Scanning the intracellular s6 activation gate in the shaker K+ channel. J Gen Physiol 119: 521-532. [DOI] [PMC free article] [PubMed] [Google Scholar]
- Haines WR, Voigt MM, Migita K, Torres GE, Egan TM (2001a) On the contribution of the first transmembrane domain to whole-cell current through an ATP-gated ionotropic P2X receptor. J Neurosci 21: 5885-5892. [DOI] [PMC free article] [PubMed] [Google Scholar]
- Haines WR, Migita K, Cox JA, Egan TM, Voigt MM (2001b) The first transmembrane domain of the P2X receptor subunit participates in the agonist-induced gating of the channel. J Biol Chem 276: 32793-32798. [DOI] [PubMed] [Google Scholar]
- Jenkins A, Andreasen A, Trudell JR, Harrison NL (2002) Tryptophan scanning mutagenesis in TM4 of the GABAA receptor alpha1 subunit: implications for modulation by inhaled anesthetics and ion channel structure. Neuropharmacology 43: 669-678. [DOI] [PubMed] [Google Scholar]
- Jiang LH, Rassendren F, Surprenant A, North RA (2000) Identification of amino acid residues contributing to the ATP-binding site of a purinergic P2X receptor. J Biol Chem 275: 34190-34196. [DOI] [PubMed] [Google Scholar]
- Jiang LH, Rassendren F, Spelta V, Surprenant A, North RA (2001) Amino acid residues involved in gating identified in the first membrane-spanning domain of the rat P2X2 receptor. J Biol Chem 276: 14902-14908. [DOI] [PubMed] [Google Scholar]
- Jiang Y, Lee A, Chen J, Cadene M, Chait BT, MacKinnon R (2002) The open pore conformation of potassium channels. Nature 417: 523-526. [DOI] [PubMed] [Google Scholar]
- Kenakin TP (1997) Pharmacologic analysis of drug-receptor interaction, Ed 3. Philadelphia: Lippincott-Raven.
- Khakh BS, Bao XR, Labarca C, Lester HA (1999) Neuronal P2X transmitter-gated cation channels change their ion selectivity in seconds. Nat Neurosci 2: 322-330. [DOI] [PubMed] [Google Scholar]
- Khakh BS, Burnstock G, Kennedy C, King BF, North RA, Seguela P, Voigt M, Humphrey PP (2001) International union of pharmacology. XXIV. Current status of the nomenclature and properties of P2X receptors and their subunits. Pharmacol Rev 53: 107-118. [PubMed] [Google Scholar]
- Kortemme T, Kim DE, Baker D (2004) Computational alanine scanning of protein-protein interfaces. Sci STKE 2004: l2. [DOI] [PubMed] [Google Scholar]
- Lazarowski ER, Boucher RC, Harden TK (2003) Mechanisms of release of nucleotides and integration of their action as P2X- and P2Y-receptor activating molecules. Mol Pharmacol 64: 785-795. [DOI] [PubMed] [Google Scholar]
- Li-Smerin Y, Hackos DH, Swartz KJ (2000) Alpha-helical structural elements within the voltage-sensing domains of a K+ channel. J Gen Physiol 115: 33-50. [DOI] [PMC free article] [PubMed] [Google Scholar]
- Lynch JW, Rajendra S, Pierce KD, Handford CA, Barry PH, Schofield PR (1997) Identification of intracellular and extracellular domains mediating signal transduction in the inhibitory glycine receptor chloride channel. EMBO J 16: 110-120. [DOI] [PMC free article] [PubMed] [Google Scholar]
- Migita K, Haines WR, Voigt MM, Egan TM (2001) Polar residues of the second transmembrane domain influence cation permeability of the ATP-gated P2X2 receptor. J Biol Chem 276: 30934-30941. [DOI] [PubMed] [Google Scholar]
- Monks SA, Needleman DJ, Miller C (1999) Helical structure and packing orientation of the S2 segment in the Shaker K+ channel. J Gen Physiol 113: 415-423. [DOI] [PMC free article] [PubMed] [Google Scholar]
- Mottig H, Kusch J, Zimmer T, Scholle A, Benndorf K (2001) Molecular regions controlling the activity of CNG channels. J Gen Physiol 118: 183-192. [DOI] [PMC free article] [PubMed] [Google Scholar]
- Nakazawa K, Inoue K, Ohno Y (1998) An asparagine residue regulating conductance through P2X2 receptor/channels. Eur J Pharmacol 347: 141-144. [DOI] [PubMed] [Google Scholar]
- Nicke A, Baumert HG, Rettinger J, Eichele A, Lambrecht G, Mutschler E, Schmalzing G (1998) P2X1 and P2X3 receptors form stable trimers: a novel structural motif of ligand-gated ion channels. EMBO J 17: 3016-3028. [DOI] [PMC free article] [PubMed] [Google Scholar]
- Nicke A, Rettinger J, Schmalzing G (2003) Monomeric and dimeric byproducts are the principal functional elements of higher order P2X1 concatamers. Mol Pharmacol 63: 243-252. [DOI] [PubMed] [Google Scholar]
- North RA (2002) Molecular physiology of P2X receptors. Physiol Rev 82: 1013-1067. [DOI] [PubMed] [Google Scholar]
- Panchenko VA, Glasser CR, Mayer ML (2001) Structural similarities between glutamate receptor channels and K+ channels examined by scanning mutagenesis. J Gen Physiol 117: 345-360. [DOI] [PMC free article] [PubMed] [Google Scholar]
- Petsko GA, Ringe D, eds (2004) Protein structure and function. London: New Science.
- Rassendren F, Buell G, Newbolt A, North RA, Surprenant A (1997) Identification of amino acid residues contributing to the pore of a P2X receptor. EMBO J 16: 3446-3454. [DOI] [PMC free article] [PubMed] [Google Scholar]
- Roberts JA, Evans RJ (2004) ATP binding at human P2X1 receptors. Contribution of aromatic and basic amino acids revealed using mutagenesis and partial agonists. J Biol Chem 279: 9043-9055. [DOI] [PubMed] [Google Scholar]
- Saul B, Kuner T, Sobetzko D, Brune W, Hanefeld F, Meinck HM, Becker CM (1999) Novel GLRA1 missense mutation (P250T) in dominant hyperekplexia defines an intracellular determinant of glycine receptor channel gating. J Neurosci 19: 869-877. [DOI] [PMC free article] [PubMed] [Google Scholar]
- Sharp LL, Zhou J, Blair DF (1995) Features of MotA proton channel structure revealed by tryptophan-scanning mutagenesis. Proc Natl Acad Sci USA 92: 7946-7950. [DOI] [PMC free article] [PubMed] [Google Scholar]
- Spelta V, Jiang LH, Bailey RJ, Surprenant A, North RA (2003) Interaction between cysteines introduced into each transmembrane domain of the rat P2X2 receptor. Br J Pharmacol 138: 131-136. [DOI] [PMC free article] [PubMed] [Google Scholar]
- Spencer RH, Rees DC (2002) The α-helix and the organization and gating of channels. Annu Rev Biophys Biomol Struct 31: 207-233. [DOI] [PubMed] [Google Scholar]
- Virginio C, MacKenzie A, Rassendren FA, North RA, Surprenant A (1999) Pore dilation of neuronal P2X receptor channels. Nat Neurosci 2: 315-321. [DOI] [PubMed] [Google Scholar]
- Williams RW, Chang A, Juretic D, Loughran S (1987) Secondary structure predictions and medium range interactions. Biochim Biophys Acta 916: 200-204. [DOI] [PubMed] [Google Scholar]
- Yarov-Yarovoy V, McPhee JC, Idsvoog D, Pate C, Scheuer T, Catterall WA (2002) Role of amino acid residues in transmembrane segments IS6 and IIS6 of the Na+ channel alpha subunit in voltage-dependent gating and drug block. J Biol Chem 277: 35393-35401. [DOI] [PubMed] [Google Scholar]
- Yifrach O, MacKinnon R (2002) Energetics of pore opening in a voltage-gated K+ channel. Cell 111: 231-239. [DOI] [PubMed] [Google Scholar]