

Abstract
We examined the potential relationship between aging and α-synuclein (α-Syn) metabolism, both of which are implicated in the pathogenesis of Parkinson's disease (PD) and otherα-synucleinopathies. During aging,α-Syn and β-Syn mRNA expression in brain decreases, but the protein levels are maintained at high levels. Significantly, the α-Syn protein level increases with aging in human substantia nigra. Pulse-chase analyses of α-Syn half-lives in neurons and neuronal cell lines indicate that, in mature neurons, the expression of α-Syn is regulated by the post-translational stabilization of α-Syn protein. Moreover, A53T mutant human α-Syn exhibits increased stability in neuronal cell lines, leading to higher levels of the mutant protein in cells and transgenic mice. Inhibitor studies suggest that the proteasomal and lysosomal systems may not be responsible for the differential stabilization or metabolism of α-Syn protein in neuronal cells. Because increased stabilization of α-Syn protein is associated with increased protein levels and accumulation of pathogenic protein modifications, such as oxidative damage, the stabilization of α-Syn with aging may be a significant factor in the pathogenesis of α-synucleinopathies.
Keywords: synuclein, Parkinson's disease, aging, metabolism, oxidative stress, synucleinopathy
Introduction
Parkinson's disease (PD) is a common late-onset, progressive neurodegenerative disease characterized by the selective loss of neuronal populations, including dopaminergic neurons of substantia nigra (SN) pars compacta, and the presence of fibrillar, cytoplasmic inclusions called Lewy bodies (LBs) and Lewy neurites (LNs) in multiple brain regions (Fahn and Przedborski, 2000; Dickson, 2001). Although the causes of PD are not known in most cases, mutations in α-Syn, Parkin, and DJ-1 genes are linked to PD in a number of familial PD (FPD) pedigrees (Polymeropoulos et al., 1997; Kitada et al., 1998; Kruger et al., 1998; Bonifati et al., 2003; Singleton et al., 2003). The role of α-synuclein (α-Syn) in various diseases, called α-synucleinopathies, is supported by the fact that α-Syn is the major fibrillar component of neuronal LBs-LNs and in the glial cytoplasmic inclusions of multiple systems atrophy (Goedert and Spillantini, 1998; Galvin et al., 1999, 2001; Dickson, 2001). A series of in vivo studies directly linked α-Syn abnormalities to neurodegeneration. Specifically, α-Syn-dependent neurodegeneration has been demonstrated in α-Syn transgenic (Tg) flies (Feany and Bender, 2000), in α-Syn Tg mice (Masliah et al., 2000; Rochet et al., 2000; Van der Putten et al., 2000; Giasson et al., 2002; Lee et al., 2002; Neumann et al., 2002), and in α-Syn virus-infected rats (Kirik et al., 2002; Lo Bianco et al., 2002) and primates (Kirik et al., 2003).
α-Syn is a highly conserved protein of 140 amino acids belonging to a multigene family that includes β-Syn, γ-Syn, and synoretin (George, 2002). Structurally, the Syns consist of a highly conserved N-terminal region containing imperfect repeats of KTKEGV, a variable central hydrophobic domain, and a negatively charged C-terminal region (George, 2002). Normally, α-Syn is expressed predominantly in neurons, is axonally transported with the slow axonal transport component (Li et al., 2004), and is particularly abundant in the presynaptic terminals (Maroteaux et al., 1988; Ueda et al., 1993; Goedert, 1997; George and Clayton, 1998; George, 2002). Although the normal function(s) of Syns is still being defined, studies suggest that α-Syn may modulate synaptic plasticity (Goedert, 1997; George and Clayton, 1998; Clayton and George, 1999) and dopaminergic neurotransmission (Abeliovich et al., 2000; Lee et al., 2001; Perez et al., 2002).
The abnormal accumulations and distributions of α-Syn associated with α-synucleinopathies have implicated abnormal cellular metabolism of α-Syn in the pathogenesis of α-synucleinopathies. The pathogenic importance of the α-Syn expression level is indicated by the linkage of α-Syn gene triplication with FPD (Singleton et al., 2003) and the increased risk of PD associated with the α-Syn promoter polymorphisms (Kruger et al., 1999; Farrer et al., 2001). Furthermore, analyses of mRNAs encoding of α-, β-, and γ-Syn show that the LB dementia is associated with increased expression of α-Syn mRNA expression (Rockenstein et al., 2001).
Despite the importance of α-Syn expression in the pathogenesis of α-synucleinopathy, not much is known about the regulation of α-Syn expression in mature neurons. For example, examination of α-Syn expression in aging rats indicates post-transcriptional regulation of α-Syn expression in mature brain (Petersen et al., 1999); however, it is not known whether α-Syn expression is regulated via a translational or post-translational mechanism(s). This is an important distinction. Specifically, age-related alterations in the protein degradation (post-translational) will directly affect both levels of α-Syn protein and the accumulations of potentially “pathogenic” modifications of α-Syn.
Herein, we show that the post-translational protein stabilization regulates α-Syn expression. Significantly, in neuronal cells, human α-Syn (Huα-Syn) harboring the FPD-linked A53T mutation shows increased stability in neuronal differentiated cells, leading to the higher levels of the mutant protein in cells and brain. Moreover, we show that the levels of α-Syn protein in human SN increase with aging, and aging is associated with increased levels of oxidatively modified α-Syn. Our results support the view that alterations in α-Syn metabolism have a significant impact on the pathogenesis of α-synucleinopathies in vivo.
Materials and Methods
Subjects. CD-1 mice (Charles River Laboratories, Wilmington, MA) were used to determine the mRNA and protein expression during development and aging. MoPrP-Huα-Syn Tg mice expressing high levels of wild-type (WT) and FPD-linked mutant α-Syn (A30P and A53T) have been described (Lee et al., 2002). All MoPrP-Huα-Syn Tg mouse lines, established as C3H/HeJ × C57BL6/J hybrids, were maintained by successively backcrossing into the C57BL6/J strain. The experimental protocols involving mice, including limitation of discomfort and pain, were in strict adherence to the NIH Animal Care Guidelines and were approved by the Animal Care and Use Committee at Johns Hopkins University School of Medicine.
Normal human tissues were obtained from the Brain Resource Center (Department of Pathology, Johns Hopkins University School of Medicine) or the Brain and Tissue Banks for Developmental Disorders (Department of Pediatrics, University of Maryland).
Antibodies. For detecting α-Syn, the mouse monoclonal antibody (mAb) Syn-1 (Transduction Laboratories, Lexington, KY) and the rabbit polyclonal antibody (pAb) HuSyn1 (Lee et al., 2002) were used. The following antibodies were also used: rabbit anti-β-Syn serum (Ab-1; Oncology, Cambridge, MA), rabbit anti-γ-Syn antiserum (ab6169; Abcam, Cambridge, UK), mouse anti-α-tubulin mAb (clone B-5-1-2; Sigma, St. Louis, MO), mouse anti-GAPDH mAb (clone 6C5; RDI, Flanders, NJ), mouse anti-synaptophysin mAb (SY38; Chemicon, Temecula, CA), and rabbit anti-synapsin I pAb and rabbit anti-synapsin II pAb (Stressgen, San Diego, CA).
Analysis of mRNA expression. Total RNA was isolated from selected tissues using Trizol reagent (Invitrogen, Bethesda, MD). Relative levels of mRNAs encoding the Syn variants and the selected synaptic proteins were assayed by semiquantitative PCR amplification of reverse-transcribed RNA (Slunt et al., 1994; Lee et al., 1996). Reverse-transcribed RNA samples were added to the PCR reaction mixture containing PCR-primer pairs specific for the genes of interest (0.5 μm each), standard PCR reaction buffer, Taq polymerase (0.25 U/50 μl), and a small amount of either [32P]-labeled sense primer (∼10 ρm) or [α32P]dCTP (2.5 μCi/50 μl). The resulting PCR products were separated using 2% Metaphore (FMC Bioproducts, Rockford, ME) agarose gels or 8% TBE-acrylamide gels and were visualized using both ethidium bromide staining and autoradiography. The radioactivity associated with each PCR product was determined by PhosphorImager analysis. To determine the linear range of amplification for each template, RT-PCR reactions for each mRNA of interest were terminated at 20, 22, 24, 26, 28, and 30 cycles. The linearity of amplification over the cycling range for the specific cDNAs was analyzed by semilog plots of the radioactivity versus the cycle number (Slunt et al., 1994; Lee et al., 1996). The efficiencies of amplification, determined from the slope of the regression lines, are comparable for all Syn isoforms within a sample.
The primers for PCR amplification of mRNAs were as follows: mouse (Mo) α-Syn (5′-gctgagaaaaccaagcagg-3′ and 5′-gaaggcatttcataagcctc-3′), Moβ-Syn (5′-gctgagaaaaccaagcagg-3′ and 5′-cacttcctctggcttcag-3′), Huα-Syn (5′-ttcatgaaaggactttcaaaggc-3′ and 5′-gaaggcatttcataagcctc-3′), Huβ-Syn (gtcgacgatggacgtkttcatgaag-3′ and 5′-cacttcctctggcttcag-3′), Huγ-Syn (5′-ttcaagaarggcttctcc-3′ and tggccacwgtgttgacgctg-3′), mouse synaptophysin (5′-cctaggtctccaccctc-3′ and 5′-ggaggaaccaaggctagagtt-3′), rat synapsin Ia/b (5′-caggatgtgccaccacccat-3′ and 5′-ttcacctcatcctggctaag-3′), rat synapsin II (5′-cccccccaaggttgtttacag-3′ and 5′-gcagcactgagaggacacag-3′), and GAPDH (5′-tgatgacatcaagaaggtggtgaag-3′ and 5′-tccttgaggccatgtaggccat-3′).
Immunoblot analysis of protein expression. Relative protein levels of Syn isoforms and other proteins were determined from the whole-tissue extracts by a quantitative immunoblot analysis (Lee et al., 1997, 2002). The concentrations of antibody and the amount of tissue extracts yielding linear quantitative results were determined empirically. The tissues were homogenized in TNE buffer (50 mm Tris-HCl, pH 7.4, 100 mm NaCl, 5 mm EDTA) supplemented with 0.5% NP-40, 0.5% Na-deoxycholate, 1% SDS, and protease inhibitor mixture (Roche, Indianapolis, IN) using a hand-held Polytron device. The concentrations of protein in the homogenates were determined using the BCA assay (Pierce, Rockford, IL). Proteins in the extracts were fractioned using SDS-PAGE and transferred to nitrocellulose membranes (Lee et al., 1997, 2002). To ensure the integrity of the resolved proteins and equal loading, all of the membranes were stained for total protein with the Ponceau S before the primary antibody incubation. To detect specific proteins, the membranes were probed with the appropriate primary antibody, and the immunoreactive proteins were visualized by autoradiography after incubation with a [125I]conjugated secondary antibody. The radioactivity associated with the immunoreactive bands was determined by the PhosphorImager analysis using Molecular Imager FX (Bio-Rad, Hercules, CA). Immunoreactive proteins were also visualized using chemiluminescence detection (Pierce) after incubations with the appropriate horseradish peroxidase-conjugated secondary antibodies. The intensities of the immunoreactive bands were determined by densitometric analysis.
Primary cultures of mouse cortical neurons. Timed pregnant mice (CD-1 strain; Charles River Laboratories) at 16-17 d of gestation were used for the long-term cultures of cortical neurons (Lesuisse and Martin, 2002). Briefly, the embryos were removed to ice-cold Hanks buffer (Invitrogen), and the cortices were dissected from the embryos. These cortices were sliced into small pieces, trypsinized, and gently triturated with a fire-polished Pasteur pipette. Dissociated cells from the cortices were then washed with cold Hanks buffer to remove tissue debris and plated onto poly-d-lysine (BD Biosciences, Mountain View, CA)-coated six-well plates, at 1 × 10⁶ cells per well. The cells were maintained in Neurobasal medium supplemented with B27, 2 mm l-glutamine (Invitrogen), 100 U/ml penicillin, and 100 μg/ml streptomycin in the incubator (37°C in 5% CO2/atmosphere with 100% humidity). For long-term culture, one-third of the old media was replaced with fresh media every 3 d.
SH-SY5Y neuroblastoma cell lines expressing α-Syn. cDNAs encoding human WT α-Syn, or PD-linked A53T and A30P mutants and Moα-Syn were cloned into the constant expression vector pcDNA3.1+ (pCD; Invitrogen). The resulting pCD-SnWT, pCD-SnAT, pCD-SnAP, pCDMoSn, and empty pCD vectors were used to establish stable cell lines. Polyclonal SH-SY5Y stable cell lines were established by selecting for G418 (800 μg/ml)-resistant cells. Polyclonal cell lines minimize the potential complications from the clonal variations often associated with monoclonal cell lines. Moreover, stable cell lines were used to minimize the complications associated with transient transfections, such as aberrant degradation of proteins from severe overexpression of the transgene within a cell. The polyclonal SH-SY5Y cells were maintained in RPMI 1640 medium containing 10% fetal bovine serum, 100 U/ml penicillin, 100 μg/ml streptomycin, and 400 μg/ml G418 at 37°C in 5% CO2/atmosphere with 100% humidity. For neuronal differentiation of the SH-SY5Y cells, the cells were plated at 1 × 10⁴/cm2, and 10 μm retinoic acid (RA; Sigma) was added into the medium for 7 d (Lopez-Carballo et al., 2002).
Pulse-chase analysis of α-Syn metabolism. The half-lives of α-Syn proteins were measured by pulse-chase analysis. Newly translated proteins were metabolically radiolabeled with [35S]methionine, and α-Syn was immunoprecipitated using the Syn-1 mAb (BD Biosciences). Immunoprecipitated α-Syn was resolved by SDS-PAGE, and the radioactivity associated with α-Syn was quantified by PhosphorImager analysis (Borchelt et al., 1994). For measuring the half-life of endogenous Moα-Syn in the cultured cortical neurons, neurons plated on six-well plates were labeled for 1 hr with 75 μCi of [35S]methionine. For measuring half-lives of transfected α-Syn in SH-SY5Y cell lines, the cells were labeled for 30 min with 75 μCi of [35S]methionine.
For immunoprecipitation, the cells were lysed in 500 μl of RIPA buffer (50 mm Tris-HCl, pH 7.4, 150 mm NaCl, 5 mm EDTA, 0.25% SDS, 0.5 NP-40, 0.5% deoxycholate, and the protease inhibitor mixture from Roche). The homogenates were clarified by centrifugation (12,000 × g for 5 min; 25°C), and α-Syn was immunoprecipitated using Syn-1 mouse monoclonal antibody (BD Biosciences) using an established procedure (Borchelt et al., 1994). The PhosphorImager analysis of gels was performed using Molecular Imager FX (Bio-Rad). To estimate the half-lives of α-Syn polypeptides, the percentages of radiolabeled α-Syn remaining at various chase times were plotted on a semilog10 scale. The decay of α-Syn was fitted to one or two phase exponential decay curves using Prism software (Graph Pad, San Diego, CA).
Inhibition of lysosomal and proteasomal proteases. The effects of protease inhibitors on α-Syn degradation were examined using inducible human embryonic kidney (HEK) 293T cells (i293T), expressing Huα-Syn under the control muristerone A-regulatable promoter, and the polyclonal SH-SY5Y cells. For i293T cells, α-Syn expression was induced for 24 hr by the addition of 5 μm muristerone-A. After induction, i293T cells were treated for an additional 48 hr with inhibitors in fresh media without muristerone-A. For the polyclonal SH-SY5Y cells, the cells were treated with inhibitors for 24 hr (naive) or 48 hr (RA differentiated) either with or without 0.5 μg/ml of cycloheximide. In all cases, the levels of total SDS-soluble α-Syn, tubulin, and GAPDH levels were determined by immunoblot analysis. The following protease inhibitors and concentrations were used: 10 μm lactacystin (Calbiochem, San Diego, CA), 1 μm carbobenzoxy-l-leucyl-l-leucyl-l-leucinal (MG132; Calbiochem), 25 mm ammonium chloride, and 200 nm bafilomycin A1 (BafA1; CalBiochem).
Results
Levels of α-Syn and β-Syn during aging do not correlate with levels of mRNA
A number of studies have shown that the expression of α-Syn mRNA and protein increases with brain development (Hsu et al., 1998; Petersen et al., 1999). Significantly, aging in rat brain is associated with a decrease in α-Syn mRNA, whereas the levels of α-Syn protein remain high (Petersen et al., 1999), indicating post-transcriptional regulation of α-Syn expression. We have extended the study in rats by characterizing the expression of α-Syn and other Syn isoforms in mouse and human brain as a function of aging. A semiquantitative RT-PCR analysis was used to document mRNA expression (Lee et al., 1996), and a semiquantitative immunoblot analysis was used to examine protein expression (Lee et al., 1997, 2002). The RT-PCR analyses of α-Syn and β-Syn mRNAs in mouse brain (γ-Syn expression was not detectable in the mouse cortex) (Fig. 1A,C) show that the expression of α-Syn and β-Syn mRNA decreases after the peak expression at ∼2-3 postnatal weeks (Fig. 1A,C). Comparison of the relative levels of Syn mRNAs reveals that the levels of α-Syn are higher during development (until ∼14 d of age), whereas the levels of β-Syn expression are higher during aging. Parallel analyses of the mRNAs encoding several other presynaptic proteins (synaptophysin, synapsin I, and synapsin II) show that the overall kinetics of mRNA expression for all of the synaptic proteins are very similar to that seen with β-Syn mRNA (Fig. 1A,D).
Figure 1.

Post-translational regulation of α-Syn expression in mouse brain with aging. A, Representative autoradiograms of RT-PCR-amplified mRNAs encoding α-Syn (α), β-Syn (β), synaptophysin (Sy38), synapsin I (SyIa, SyIb), synapsin II (SyIIb), and GAPDH (GD). The mRNAs were PCR amplified from cDNAs derived from brains of mouse embryos at embryonic days 14-18 (E14, E16, E18), cortices of postnatal mice at postnatal days 1-28 (P1, P7, P28), and cortices of mature mice at 3 and 8 months of age (p3m, p8m). B, Representative autoradiograms showing the immunoblot analysis of the total SDS-soluble mouse brain extracts for α-Syn, β-Syn, synaptophysin (Sy38), synapsin I (SyI), and synapsin II (SyII). Samples are as indicated in A. C, The levels of α- and β-Syn mRNAs (RNA) and protein (Pn) were quantified from autoradiograms represented in A and B by PhosphorImager analysis and normalized to the maximal level expression achieved. Each value is mean and SEM from three to five independent samples. Quantitative analyses of other presynaptic components are shown in D.
Although the decreased expression of α-Syn mRNA with aging is not consistent with the increased risk for α-synucleinopathy with aging, immunoblot analyses of Syn proteins during brain development and aging (Fig. 1B,C) show that the levels of Syn proteins remain at high levels with aging (Fig. 1B,C). These results indicate that the expression of synaptic proteins, including Syns, are regulated post-transcriptionally.
To examine whether the expressions of Syns in human brain are also regulated post-transcriptionally, we determined the expression of all three Syns (α, β, and γ) in frontal cortex (Fcx), caudate (Caud), and SN from human subjects of various ages (Fig. 2). Despite some regional variations, the levels of α-Syn mRNA in human brain decreases with aging (Fig. 2A,C). Consistent with the magnitude of age-associated decrease in α-Syn mRNA observed with mouse brain, the α-Syn mRNA levels in Fcx decreased by ∼60% with aging in the human subjects that were examined. As in the mice (Abeliovich et al., 2000), γ-Syn is expressed highly in human SN; however, γ-Syn is also highly expressed in other human brain regions (supplemental Fig. S1, available at www.jneurosci.org/cgi/content/full/24/33/9400/DC1). As with the mouse brain, the levels of α- and β-Syn protein in the human brain do not decrease with the decline in mRNA expression (Fig. 2B,D). In the cortex, although the α-Syn protein levels increase during maturation (supplemental Fig. S2, available at www.jneurosci.org/cgi/content/full/24/33/9400/DC1), the α-Syn protein levels reach plateau with aging (Fig. 2B,D) (supplemental Fig. S2, available at www.jneurosci.org/cgi/content/full/24/33/9400/DC1). Significantly, aging is also associated with a significant increase in the relative levels of α-Syn protein in the SN (Fig. 2B,D). The increase in α-Syn protein levels in SN with aging (∼100% increase in SN; comparison of subjects <60 vs >80 years of age) may contribute to the increased vulnerability of SN to α-synucleinopathy. The significance of this finding to the pathogenesis of α-synucleinopathy is also indicated by the fact that the magnitude of increase in α-Syn protein levels with aging is comparable with that observed with the triplication of the α-Syn gene in FPD cases (Farrer et al., 2004).
Figure 2.

α-Syn expression during human brain aging. A, Representative autoradiogram of RT-PCR-amplified mRNAs encodingα-Syn,β-Syn,γ-Syn, and GAPDH (GD). The cDNAs were derived from human Fcx, Caud, and SN. Representative results from three examples (19-, 53-, and 80-year-old neurologically normal human subjects) from six subjects are shown. Each sample was analyzed in triplicate and presented graphically in C. B, Immunoblot analysis of human Fcx, Caud, and SN extracts of Syn. Brain extracts from human subjects in their 50s and 80-90s were examined. The results from younger subjects are shown in supplemental Figure S2 (available at www.jneurosci.org/cgi/content/full/24/33/9400/DC1). C, The levels of mRNAs encoding α-Syn, β-Syn, and γ-Syn in Fcx, Caud, and SN were quantified from the RT-PCR analysis shown in A. The scatter plot and the calculated regression lines show that the levels of mRNAs encoding α-Syn decrease with aging in all brain regions, whereas the expression of mRNA encoding γ-Syn remains constant. The pattern of β-Syn expression is more variable. R2 and p values are as follows (asterisks indicate statistically significant p values): α-Syn [Fcx (0.628, 0.0021*), Caud (0.393, 0.0291*), SN (0.03026, 0.0639)]; β-Syn [Fcx (0.5506, 0.014*), Caud and SN (<0.1, >0.5)]; γ-Syn [all (<0.1, >0.3)]. D, The levels of Syn polypeptides in brain regions were quantified from the immunoblots shown in B. For each subject, the analysis was performed in duplicate, and the levels of Syn isotypes were normalized to GAPDH. The subjects were grouped as 50s (49-58 years old) and 80+ (83-95 years old) and are shown as mean and SEM. To facilitate presentation of all three Syn isotypes, values are plotted as the percents average of the subjects in their 50s. The average relative levels show that the levels of α-Syn in SN almost double during this 30 year span (**p < 0.01; t test). Although the α-Syn protein levels in Fcx do not change between 50s and 80+, an analysis of younger subjects shows an increase at younger ages (supplemental Fig. S2, available at www.jneurosci.org/cgi/content/full/24/33/9400/DC1). The decease in the cortical γ-level is significant (*p < 0.05) only when GAPDH is used as the reference protein.
Collectively, these results confirm that a post-transcriptional mechanism(s) regulates the expression of α-Syn and other presynaptic components in mature neurons. Given the important implications of protein stability regarding the accumulation of potentially pathogenic proteins and pathogenic modifications on protein, we decided to determine whether the expression of α-Syn is regulated by the age-dependent stability of the α-Syn protein.
α-Syn polypeptide is stabilized with the neuronal maturation
To determine whether the stability of α-Syn protein increases with neuronal maturation, pulse-chase analysis was used to determine α-Syn half-lives in mouse cortical neurons cultured for various days in vitro (DIV) (Fig. 3). The α-Syn expression pattern in the cultured neurons showed that the long-term cortical neurons in cultures can recapitulate the brain expression pattern of α-Syn mRNA and protein (Fig. 3A). Specifically, the α-Syn mRNA levels increase to a peak at ∼15 DIV, followed by decreased expression with further maturation (Fig. 3A,B). As in the brain, α-Syn protein levels do not decrease with neuronal maturation (Fig. 3A,B); however, the long-term neuronal cultures do not recapitulate the brain expression patterns of β-Syn (Fig. 3A,B) and other selected presynaptic proteins (Fig. 3A).
Figure 3.

Maturation of cortical neurons is associated with the stabilization of α-Syn polypeptide. A, B, Representative autoradiograms show the RT-PCR analysis of α-Syn and β-Syn mRNA (A) and immunoblot analysis of Syn isotypes (B) in cultured primary cortical neurons. Also shown is the expression of synaptophysin (Sy38), synapsin I (SyI), and synapsin II (SyII). C, The levels of mRNA (RNA) and protein (Pn) for α-Syn and β-Syn, determined from PhosphorImager analysis, are plotted. Each value represents the mean and SEM from four to six independent cultures. D, Representative autoradiograms showing [35S]methionine-labeled, immunoprecipitated α-Syn at various times (0, 6, 24, 48, 72, and 96 hr) after metabolic labeling of primary cortical neuron cultures at 7, 14, 35, and 42 DIV (5 weeks). Analyses were performed in pairs (7 and 35 DIV, 14 and 42 DIV). E, The stability of newly synthesized α-Syn increases with maturation in culture. The levels of [35S]methionine-labeled α-Syn was quantified, and the percentage changes, relative to the 0 hr point, are plotted (mean and SEM from 3 independent cultures).
Because the general pattern of α-Syn expression observed in mouse brain can be recapitulated by the cultured cortical neurons, we asked whether the α-Syn protein levels during neuronal maturation are regulated by differential stabilization of the protein. Pulse-chase analyses of the α-Syn half-lives in the primary cortical neuron cultures at 7, 14, 35, and 42 DIV (Fig. 3C,D) show that in younger cultures (7 and 14 DIV), the disappearance of newly synthesized α-Syn follows a biphasic exponential decay curve (Fig. 3D, Table 1). In more mature cultures (38 and 42 DIV), the decay follows a monophasic exponential curve (Fig. 3D, Table 1). Overall, these results show that neuronal maturation is associated with the increased stability of α-Syn protein (Fig. 3D, Table 1). Consistent with the lower α-Syn mRNA levels in more mature cultures, the levels of initial [35S]methionine labeling of α-Syn, relative to the total labeled proteins, seem much lower in mature cultures (Fig. 3C). Specifically, the relative amount of 53S-labeled α-Syn (53S-labeled α-Syn/total 53S-labeled protein ratio) at 42 DIV is ∼35% of the ratio at 14 DIV (data not shown), confirming that the synthetic rate of α-Syn is proportional to the levels of mRNA. These results indicate that the decreased turnover of α-Syn, rather than the increased translation of α-Syn, is responsible for maintaining high levels of α-Syn protein despite the decreases in α-Syn mRNA levels.
Table 1.
Half-life of α-Syn in primary mouse cortical neurons at different maturation stages
|
DIV |
t1/2 fast (%) |
t1/2 slow (%) |
t1/2 total |
R2 |
|---|---|---|---|---|
| 7 | 2.3 ± 0.4 (29.9) | 53.6 ± 4.2 (70.1) | 26.5 ± 2.6 | 0.996 |
| 14 | 5.4 ± 0.7 (19.3) | 72.5 ± 6.6 (80.6) | 50.5 ± 5.4 | 0.998 |
| 35 | NA | 115.5 ± 10.7 | 115.5 ± 10.7 | 0.956 |
| 42 |
NA |
160.1 ± 14.7 |
160.1 ± 14.7 |
0.927 |
The half-lives were extrapolated from the pulse-chase study by regression analyses assuming that the decay of α-Syn follows either biphasic exponential decay [y = f(e−k1x) + f2(e−k2x), where f1 (fast) + f2 (slow) = 1 (initial amount of the labled α-Syn) and k1 and k2 represent the rate of decay for each decay component] or monophasic exponential decay [y = f(e−kx)]. For the biphasic decay, the half-lives (expressed in hours) of the two individual phases were calculated from 0.69/k1 (fast) and 0.69/k2 (slow), where 0.69 = log 2/log e. The total half-life, directly extrapolated from the plot, corresponds to the time point at which the remaining 35S-labeled α-Syn equals 50% of the initial value. Also shown is the percentage of α-Syn in each decay phase (%) representing fx × 100. Correlation coefficients (R2) show the goodness-of-fit for the equations used. Values are from three independent cultures and are expressed as mean ± SEM. NA, Not applicable. All values are significantly different from each other (p <0.01; t test).
Neuronal differentiation and A53T mutation increase the stability of Huα-Syn
On observation that the stability of α-Syn protein increases with neuronal maturation and aging, we asked whether the differences in the primary amino acid sequences of α-Syn affect the stability of α-Syn in neural cells. Specifically, we asked whether the FPD-linked mutations alter the stability of Huα-Syn proteins in SH-SY5Y cell lines expressing various α-Syn variants (Fig. 4). In addition to Huα-Syn, we also examined the metabolism of Moα-Syn.
Figure 4.

Neuronal differentiation and A53T mutation lead to increased stability of α-Syn proteins. A, B, Characterization of polyclonal SH-SY5Y cells expressing Huα-Syn. A, Immunoblot analysis of extracts from vector-transfected control (V) and WT Hα-Syn (SnWT) cell lines shows that very little, if any, endogenousα-Syn can be documented in both naive and RA-treated cells. The α-Syn bands are near saturation because the protein loading (5 μg) was twice that used for quantitative analysis of α-Syn protein. GAPDH (GD) is shown as the reference protein. B, Immunofluorescence analysis of Huα-Syn expression in the SH-SY5Y cell lines. Greater than 95% of the Huα-Syn cell lines showα-Syn expression (green), whereas very few cells show Huα-Syn expression in the vector-transfected cell line. The cells were counterstained with DAPI (blue). C, Polyclonal SH-SY5Y cell lines, stably expressing Huα-Syn variants (WT, A53T, A30P) and Moα-Syn (MoSn), were differentiated by RA treatment. The immunoblot analysis of α-Syn expression in undifferentiated (-) and RA-differentiated (+) SH-SY5Y cells shows that differentiation is associated with increased accumulation of α-Syn polypeptide. Parallel immunoblot analysis for GAPDH (GD) confirms equal protein loading. D, The immunoblots shown in C were subject to quantitative analysis, and the percentage increase of totalα-Syn levels associated with RA differentiation was plotted. Although all Huα-Syn variants and Moα-Syn levels increase with differentiation (p < 0.01; t test), the increase in the level of A53T mutant Huα-Syn is significantly higher (*p < 0.05; t test) than other α-Syn variants. Each value represents mean and SEM from three independent cultures. E, F, Undifferentiated and RA-differentiated polyclonal SH-SY5Y cells expressing α-Syn were subjected to pulse-chase analysis to determine the stability of α-Syn variants. E, Representative autoradiograms showing [35S]methionine-labeled, immunoprecipitated α-Syn at various times (0, 6, 24, 48, and 72 hr) after metabolic labeling of SH-SY5Y cells. F, The stability of newly synthesizedα-Syn increases with neuronal differentiation. The levels of [35S]methionine-labeled α-Syn were quantified, and the percentage changes, relative to the 0 hr point, are plotted (n = 3; SEM). Note that differentiation is associated with increased stability of all α-Syn variants. Although the rates of decay for all three Huα-Syn variants are similar with the undifferentiated cells, A53T mutant Huα-Syn exhibits slower decay in differentiated cells. Consistent with the lower steady-state levels of accumulation, Moα-Syn is metabolized by the cells faster than Huα-Syn.
Quantitative immunoblot analyses of α-Syn protein in the naive and RA-differentiated SH-SY5Y cell lines show that the steady-state levels of all α-Syn variants increase with neuronal differentiation (Fig. 4C,D). Significantly, despite the comparable levels of Huα-Syn variants in the naive SH-SY5Y cells, the protein level of A53T Huα-Syn is higher than other α-Syn variants in the differentiated SH-SY5Y cells (Fig. 4C,D). The results suggest that both neuronal differentiation and A53T mutation alter α-Syn metabolism.
Pulse-chase analyses of the naive SH-SY5Y cells show that the decay of all Huα-Syn variants follows an identical biphasic kinetics (Fig. 4E,F; Table 2). With differentiation, the decay of α-Syn variants becomes monophasic, and the apparent half-lives lengthen. Significantly, in differentiated SH-SY5Y cells, the A53T Huα-Syn exhibits longer half-life than other α-Syn variants (∼74 hr for A53T Huα-Syn and ∼50 hr for other Huα-Syn variants) (Fig. 4E,F; Table 2). These results show that neuronal differentiation and maturation lead to the stabilization of α-Syn protein. Furthermore, the A53T mutation leads to increased stability and a subsequent increase in the accumulation of the mutant Huα-Syn in neuronally differentiated cells (Fig. 4).
Table 2.
Half-lives of Huα-Syn variants (WT, A53T, and A30P) and Moα-Syn (MoSn) in polyclonal SH-SY5Y cell lines
|
|
Undifferentiated |
Differentiated |
||||||||||
|---|---|---|---|---|---|---|---|---|---|---|---|---|
|
|
t1/2 fast (%) |
t1/2 slow (%) |
t1/2 total |
R2
|
t1/2 fast |
t1/2 slow |
R2
|
|||||
| WT | 3.8 ± 0.6 (30.8) | 27.7 ± 3.5 (69.2) | 13.0 ± 2.2 | 0.996 | NA | 52.3 ± 3.3 | 0.997 | |||||
| A53T | 3.4 ± 0.8 (31.6) | 29.7 ± 4.0 (68.4) | 13.5 ± 1.5 | 0.991 | NA | 73.6 ± 7.1a | 0.982 | |||||
| A30P | 3.0 ± 0.3 (34.3) | 28.9 ± 2.9 (65.7) | 13.2 ± 1.2 | 1.000 | NA | 50.0 ± 7.8 | 0.964 | |||||
| MoSn |
1.2 ± 0.2 (32.8) |
20.9 ± 3.1 (67.2) |
9.5 ± 1.5b
|
0.999 |
NA |
35.8 ± 2.4c
|
0.950 |
|||||
The values (t1/2, expressed as mean ± SEM in hours; average span, in percentage) are calculated using the same methods as described in Table 1. The best fits (R2) were achieved by assuming that the decays of the α-Syn species are biphasic in the undifferentiated SH-SY5Y cell lines and are monophasic in the neuronally differentiated cells. The differentiation-dependent increases in the half-lives of α-Syn variants were highly significant (p <0.01; t test). Additionally, the half-life of Moα-Syn is shorter than the half-life of WT Huα-Syn in both undifferentiatedb (p <0.05; t test) and differentiated c(p <0.01; t test) SH-SY5Y cells. Finally, the half-life of A53T Huα-Syn is longer than that of WT Huα-Syn in differentiated SH-SY5Y cells a(p <0.01; t test).
Moα-Syn protein, which normally encodes Thr at codon 53 but is also different from Huα-Syn at the C-terminal region (George, 2002), is metabolized more rapidly than Huα-Syn variants in both naive and neuronally differentiated SH-SY5Y cells (Fig. 4C,D; Table 2). Thus, the differences in the metabolism of Huα-Syn and Moα-Syn may contribute to the lower toxicity associated with the rodent α-Syn (Lo Bianco et al., 2002; Zhou et al., 2002).
A53T mutant Huα-Syn hyperaccumulates in Tg mice
The increased stability of A53T mutant Huα-Syn, which appears to be more pathogenic than other Huα-Syn variants in Tg mice (Lee et al., 2002), suggests that differential metabolism of A53T Huα-Syn could contribute to the pathogenesis of α-synucleinopathy in the A53T Huα-Syn Tg mice. To determine whether the metabolism of A53T mutant Huα-Syn in brain is different from the metabolism of other Huα-Syn variants, steady-state levels of Huα-Syn variants in the cortex and the brainstem of young and old Huα-Syn Tg mice were examined (Fig. 5).
Figure 5.
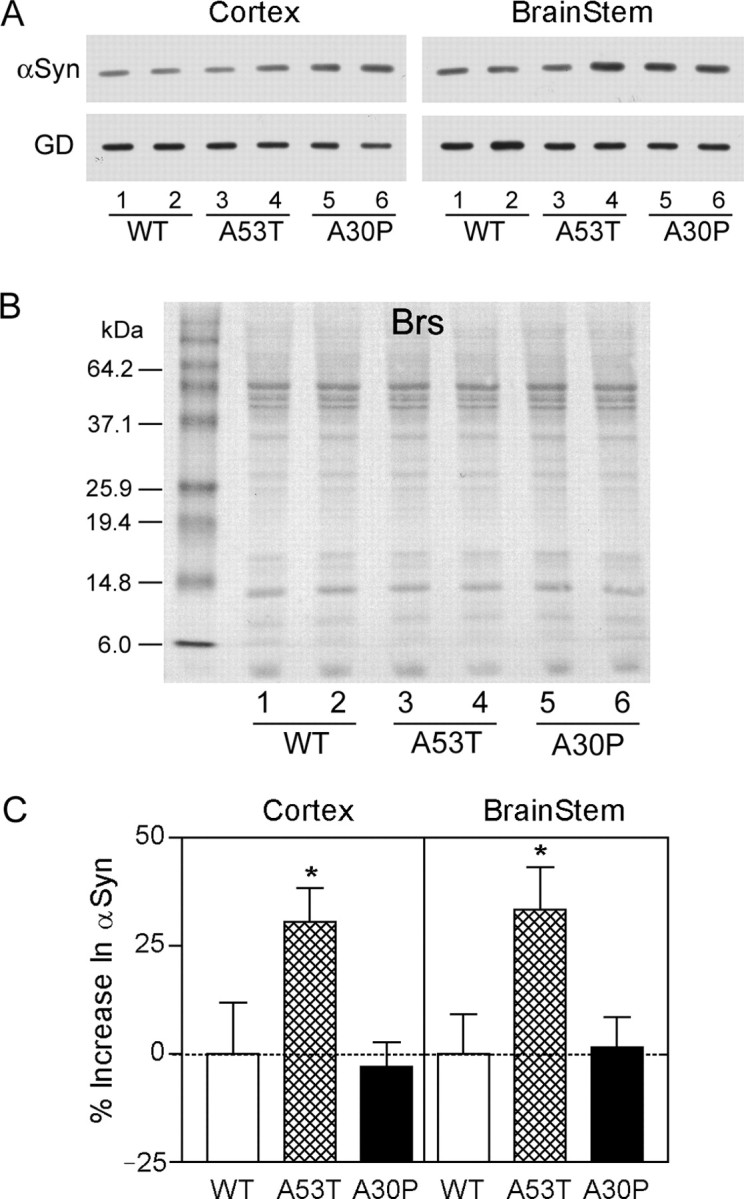
Hyperaccumulation of A53T mutant Huα-Syn in Tg mice. A, A representative immunoblot analysis of steady-state Huα-Syn levels of cortex and brainstem from Huα-Syn transgenic mice expressing WT, A53T, and A30P Huα-Syn. To selectively document the expression of Huα-Syn and not Moα-Syn, rabbit anti-Huα-Syn pAb was used. To account for the differences in the basal levels of transgene expression between different lines, the steady-state levels of Huα-Syn in the old Tg mice (12-14 months of age; lanes 2, 4, 6) were normalized to the levels in the younger Tg mice (∼4 months of age; lanes 1, 3, 5) from the same Tg line. Parallel analysis of GAPDH (GD) is also shown. B, A typical Ponceau S-stained blots confirms equal protein loading and the integrity of the resolved proteins. C, Bar graph showing the age-associated increase in the accumulation of A53T Huα-Syn in Tg mice. The values (mean and SEM) were determined from the immunoblot analysis of three independent Tg mice from each genotype and age (examples shown in A). Although the relative levels of WT and A30P Huα-Syn do not change with age, there is a significant increase in the levels of A53T Huα-Syn (*p < 0.05; t test).
To avoid the potential complications from aggressive ongoing pathology in the high-expressing A53T line [G2-3(A53T)], we used mice from A53T Tg lines with moderate levels of Huα-Syn expression [N2-5(A53T) and H5(A53T)] (Lee et al., 2002). The levels of A53T Huα-Syn in brain were compared with Huα-Syn levels in brains of Tg mice from the lines expressing WT and A30P Huα-Syn. Because the transgene copy numbers are not identical among the various Tg mouse lines, it was necessary to normalize for the potential variations in the transgene expression resulting from the differences in the transgene copy number. By analyzing the changes in the level of Huα-Syn with aging, we were able to account for the initial variations in the expression levels of the transgenes. Specifically, if A53T Huα-Syn becomes more stable than other Huα-Syn isoforms with neuronal aging, the level of Huα-Syn in older mice (normalized to the levels in the younger mice) should be higher in mice expressing A53T Huα-Syn than in mice expressing other Huα-Syn variants. Our results show that although the levels of WT and A30P Huα-Syn do not change with aging, there are significant age-dependent increases in the A35T Huα-Syn levels in both cortex and brainstem (Fig. 5).
In aggregate, our results show that the metabolism of A53T Huα-Syn is distinct from other Huα-Syn variants in vivo. It is also important to note that both in SH-SY5Y cells and in brains of Tg mice used in this study, very little α-Syn was found associated with the detergent-insoluble aggregates (data not shown), which are predicted to resist cellular metabolism. Thus, it is not likely that differential aggregation of A53T Huα-Syn is responsible for the increased accumulation of A53T Huα-Syn in neuronal cells (Fig. 4) and in brain (Fig. 5).
Huα-Syn accumulation in the neuronal cell line is not affected by lysosomal or proteasomal inhibition
Previous studies indicate that proteasomes (Bennett et al., 1999; Tofaris et al., 2001; Webb et al., 2003) and lysosomes (Paxinou et al., 2001) are responsible for the cellular metabolism of α-Syn. To determine whether these systems are responsible for the differential metabolism of α-Syn, we examined the effects of lysosomal (NH4Cl, BafA1) and proteasomal (lactacystein, MG132) inhibitors on the cellular accumulation of α-Syn.
As a positive control for the effects of proteasomal and lysosomal inhibition on α-Syn metabolism, we used HEK293T cells expressing Huα-Syn under the ecdysone-regulated promoter (i293T). Consistent with previous studies (Bennett et al., 1999; Paxinou et al., 2001; Tofaris et al., 2001; Webb et al., 2003), both lysosomal and proteasomal inhibitors caused significant increases in the levels of Huα-Syn in i293T cells (Fig. 6A); however, lysosomal and proteasomal inhibition did not significantly affect the steady-state levels of WT Huα-Syn in the SH-SY5Y cells (Fig. 6B,C). Parallel analysis of the A53T mutant Huα-Syn yielded identical results as with WT Huα-Syn (data not shown). Because the cells were treated with the inhibitors for a period of time (24 hr for naive and 48 hr for differentiated cells) sufficient to cover the protein half-lives, we should have observed significant increases in the levels of α-Syn if either the lysosomes or proteasomes were responsible for degradation of Huα-Syn in SH-SY5Y cells. Thus, our results indicate cell-type variations in the mechanism of Huα-Syn metabolism and raise the possibility that the lysosomal and proteasomal activities may not be responsible for the metabolism of α-Syn in neuronal cells. It also appears that recently reported transcriptional enhancement of the transfected genes by proteasomal inhibition (Biasini et al., 2004) is not an issue with our cell lines because the inhibitors did not affect the levels of α-Syn even in the absence of cycloheximide (Fig. 6C).
Figure 6.

Inhibition of lysosomal and proteasomal function differentially affects α-Syn accumulation in neuronal and non-neuronal cells. Accumulation of Huα-Syn, normalized to tubulin or GAPDH levels, after exposure to the inhibitors of autophage-lysosome (BafA1, NH4Cl) and proteasome (lactacystein, MG132) was determined in i293T (A) and SH-SY5Y (B, C) cell lines. The relative levels of α-Syn were determined by either densitometric analysis (A, C) or PhosphorImager (B) analysis. The values are percentage of the average relative α-Syn levels obtained with the untreated control cultures. A, i293T cell lines show a significant increase in α-Syn levels with the inhibitors used (*p < 0.05). The results are identical when GAPDH was used as the reference protein (data not shown). The p value for NH4Cl in i293T cells (p < 0.06) approached significance. B, C, The inhibitor studies on SH-SY5Y cells performed in the presence (B) and absence (C) of cycloheximide were performed three times (using three independent replicate cultures and with both wild-type and A53T-expressing cell lines) with similar results. There were no statistically significant effects of inhibitor using the SH-SY5Y cells (n = 3; p > 0.1). Parallel analysis of SH-SY5Y cells expressing A53T Huα-Syn yielded virtually identical results (data not shown).
Increased accumulation of oxidatively modified α-Syn with aging
We hypothesize that the stabilization of α-Syn with aging will affect the protein levels and lead to the accumulation of potentially pathogenic post-translational modifications on α-Syn protein. To directly test the latter hypothesis, we used the Oxyblot analysis to examine whether aging is associated with the increased level of α-Syn-associated protein carbonyls, a common oxidative modification of proteins resulting from oxidative stress (Levine et al., 1994). The Oxyblot analysis of α-Syn immunoprecipitated from the human SN and brainstem of Huα-Syn Tg mice clearly show that aging is associated with obvious increases in the levels of oxidatively modified α-Syn (Fig. 7A).
Figure 7.

Increase in oxidatively modified α-Syn with aging. A,α-Syn was immunoprecipitated from nonionic detergent soluble extracts from young (50s) and old (80s) human SN and young (4 months old) and old (14 months old) WT Huα-Syn Tg mouse brainstem. The levels of protein carbonyls associated with the immunoprecipitated α-Syn were determined by the Oxyblot analysis. Aging is associated with the increased levels of α-Syn-associated protein carbonyls. Also shown are input levels of α-Syn and a control lane showing the results obtained with normal mouse IgG. B, Total protein carbonyl associated with the SDS-soluble proteins from the samples used in A was determined using the Oxyblot analysis. There is a modest age-associated increase in the level of protein carbonyls in human SN. Very little age-associated changes occur with mice. The molecular mass standards are in kilodaltons.
Although the age-associated increase in oxidative stress could contribute to the levels of oxidatively modified α-Syn, the Oxyblot analysis of the total SDS-soluble proteins (Fig. 7B) shows that aging is associated with only a modest increase, if any, in the overall levels of oxidatively modified proteins. Thus, given that aging is associated with a rather selective increase in the level of oxidatively modified α-Syn, the decreased turnover of the α-Syn protein is likely to be a significant factor in the accumulation of oxidatively modified α-Syn in the aging brain.
Discussion
In summary, we demonstrate that the expression of α-Syn and other Syn variants during neural maturation and aging is associated with the stabilization of the protein. Moreover, primary sequence differences (mutations and species) in α-Syn have direct effects on the metabolism of α-Syn. The fact that aging is associated with an increase in α-Syn polypeptide levels and the selective accumulation of oxidatively modified α-Syn indicates that the stabilization of α-Syn with aging is of pathologic significance.
Although a number of studies have examined the expression of Syn isoforms in brain and cultured cells, most studies have focused on the increased expression of α-Syn with neuronal maturation and development. Thus, the post-transcriptional regulation of α-Syn expression has been underappreciated. We show that the expression of α-Syn in neuronal cells is regulated by post-translational protein stabilization. Stabilization of α-Syn with aging has mechanistic significance for α-synucleinopathies and other neurodegenerative diseases. In addition to maintaining high levels of protein expression, an increase in the half-life of α-Syn favors the accumulation of pathogenic modifications on α-Syn. The increases in oxidative stress (Martin et al., 1996) and the stability of α-Syn with aging are likely to act synergistically to increase the accumulation of oxidatively modified α-Syn. The increased stability of α-Syn may also promote other potentially pathogenic modifications such as α-Syn truncations (Lee et al., 2002) and phosphorylation (Fujiwara et al., 2002; Hasegawa et al., 2002). For example, our initial studies indicate that neuronal maturation and aging are also associated with the increased accumulation of potentially pathogenic, C-terminally truncated α-Syn variants in cultured cells and Tg mice (M. K. Lee, unpublished observations). It is also possible that some post-translational modifications, such as oxidative damage, may contribute to the slower turnover of α-Syn. Because accumulations of these post-translational modifications on α-Syn are associated with pathogenic accumulation and aggregation of α-Syn (Hashimoto et al., 1999; Souza et al., 2000; Paxinou et al., 2001; Fujiwara et al., 2002; Hasegawa et al., 2002), increased stability of α-Syn with aging would promote pathogenic aggregation and oligomerization of α-Syn and subsequent cellular toxicity.
The pathogenic relationship between α-Syn metabolism and α-synucleinopathies is also supported by the fact that the A53T mutant Huα-Syn exhibits longer half-life than either WT or A30P Huα-Syn. The differences in the stability of Huα-Syn variants show a striking parallel to the selective in vivo toxicity of the A53T mutant α-Syn in Tg mice (Lee et al., 2002). Increased stability of the A53T Huα-Syn would act synergistically with the enhanced aggregation properties of this mutant (Conway et al., 1998; Uversky and Fink, 2002) to promote α-synucleinopathy in vivo.
Recent molecular genetic studies have linked triplication of the α-Syn gene with a FPD pedigree (Singleton et al., 2003), prompting the hypothesis that the mutations in α-Syn may have significant quantitative rather than qualitative effects (Singleton et al., 2003, 2004). Although the contributions of the qualitative effects associated with FPD-linked mutations (e.g., enhanced aggregation) to the pathogenesis can be debated, our results provide cell biological basis for how aging and FPD-linked mutations can have quantitative effects on the level of α-Syn in brain. Even for the sporadic late-onset PD cases, polymorphisms in α-Syn promoter are identified as risk factors (Kruger et al., 1999; Farrer et al., 2001). Cell biological study of the α-Syn promoter polymorphic variants has linked PD-associated polymorphic variants with the increased transcriptional activity (Chiba-Falek and Nussbaum, 2001). Increased transcriptional activity, combined with age-associated stabilization of α-Syn protein, would lead to significantly higher steady-state levels of potentially pathogenic α-Syn variants in older brain. Even in the cases in which the triplication of the α-Syn gene causes PD, the stabilization of the α-Syn protein with aging would contribute to the onset of PD. It is also significant that human aging is associated with a significant increase in α-Syn protein levels in SN (Fig. 2). Given that the increase in α-Syn protein levels with aging can be comparable with that achieved with α-Syn gene triplication in humans (Farrer et al., 2004), the post-transcriptional stabilization of α-Syn in human brain has clear and direct relevance to the pathogenesis of PD.
The above hypothesis is particularly attractive because α-Syn, being a very long-lived protein, is more prone to accumulate pathogenic modifications. Even in the undifferentiated SH-SY5Y cells, the half-life of α-Syn (∼24 hr) is comparable with other long-lived proteins such as superoxide dismutase-1 (Borchelt et al., 1994). Although previous studies have shown significantly shorter half-lives (<3 hr) for the epitope-tagged Huα-Syn in the naive SH-SY5Y cells (Bennett et al., 1999), we are confident that the results of our study are accurate reflections of α-Syn metabolism in vivo. Previously, Bennett et al. (1999) reported that in undifferentiated SH-SY5Y cells, transiently expressed epitope-tagged A53T Huα-Syn had a 50% longer half-life than WT Huα-Syn (∼3 hr for A53T vs ∼2 hr for WT); however, we did not observe differential metabolism of the stably expressed Huα-Syn variants in the naive SH-SY5Y cells (Fig. 4) or in HEK293 cells (data not shown). The use of the epitope-tagged α-Syn and transient transfection may have contributed to the aberrant metabolism of α-Syn in the previous study (Bennett et al., 1999). Regardless, the previously reported half-life of <3 hr (Bennett et al., 1999) is unlikely to contribute significantly to the steady-state levels of α-Syn in vivo, in which normal half-life of α-Syn is clearly >24 hr. Other studies of stably expressed epitope-tagged α-Syn in PC12 cells (Webb et al., 2003) and stably expressed untagged α-Syn in 293T cells (Paxinou et al., 2001) showed that α-Syn is a long-lived protein but did not observe differential metabolism of α-Syn variants (Paxinou et al., 2001).
Currently, the actual protease system(s) responsible for the cellular metabolism of α-Syn is unknown; however, a number of proteolytic systems are implicated in the cellular metabolism of α-Syn, including proteasomes (Bennett et al., 1999; Tofaris et al., 2001; Webb et al., 2003), lysosomes-autophagy (Paxinou et al., 2001; Webb et al., 2003), calpains (Mishizen-Eberz et al., 2003), and kallikrins (Iwata et al., 2003). Because aging is associated with decreases in the activity of these proteases (Goto et al., 2001; Gozal et al., 2003; Li et al., 2004), it is tempting to hypothesize that increases in the stability of α-Syn with aging could result from the decline in lysosomal and proteasomal activity. Furthermore, because FPD-linked mutant α-Syn can inhibit proteasomal function in cells (Tanaka et al., 2001; Petrucelli et al., 2002), enhanced stability of familial PD-linked α-Syn protein could arise from mutant α-Syn-dependent proteasomal dysfunction; however, careful consideration of these studies and our inhibitor studies indicates that proteasome may not be responsible for the cellular metabolism of α-Syn in neuronal cells. Specifically, although both FPD-linked mutant α-Syns inhibit cellular proteasomal activity (Tanaka et al., 2001; Petrucelli et al., 2002), only the A53T mutation increases the stability of α-Syn polypeptide (Figs. 4, 5). Furthermore, these studies and our studies do not consistently observe increased accumulation of stably expressed or endogenous α-Syn after proteasomal inhibition in cells (Paxinou et al., 2001; Petrucelli et al., 2002; Biasini et al., 2004). Similarly, it appears that the lysosomal system is not a significant factor in the turnover of α-Syn in neuronal cell lines. Consistent with our data, it was shown recently that lysosomal inhibition does not affect the total α-Syn levels but slows the clearance of α-Syn oligomers in cells (Lee et al., 2004); however, proteasomal activity and autophagy have been implicated in the degradation of epitope-tagged α-Syn variants in a neural cell line (PC12 cells) (Webb et al., 2003). It is possible that the epitope-tagged α-Syn is metabolized differently from untagged α-Syn. Alternatively, in some studies, an increase in the α-Syn levels after protease inhibitor treatments may have resulted from the transcriptional effects of inhibitors on transgene expression (Biasini et al., 2004). Given the variations of α-Syn metabolism reported by various studies, caution is warranted in the approaches used to examine α-Syn metabolism in cultured cells. Even in our case, the differential effects of protease inhibitors on non-neural and neural cells will be an important point of future clarification.
Although our results do not implicate the lysosomal or proteasomal systems in α-Syn metabolism, it is possible that alternative cellular proteolytic enzymes, such as calpains (Mishizen-Eberz et al., 2003) and kallikreins (Iwata et al., 2003), are responsible for the differential metabolism of α-Syn in neural cells. In addition to the changes in proteolytic activity, we have shown that the axonal transport of α-Syn slows with aging in mice (Li et al., 2004). Because proteins are not normally metabolized while being transported down the axons, age-dependent slowing α-Syn may contribute to increased stability of the α-Syn protein with aging.
In conclusion, the results of our current study indicate that the alteration in α-Syn metabolism is a significant factor in the mechanistic understanding of α-synucleinopathies. Stabilization of the α-Syn protein with aging and with the FPD-linked mutation can account for an increased risk for α-synucleinopathy associated with aging, despite the decrease in levels of α-Syn mRNA with aging. Given the potential pathogenic importance of α-Syn metabolism for α-synucleinopathies, understanding the cellular processes that regulate α-Syn metabolism may allow us to manipulate the steady-state levels of α-Syn in vivo, leading to new therapies for α-synucleinopathies.
Footnotes
This work was supported by National Institutes of Health Grants NS38065 and NS38377 and a grant from the Dystonia Medical Research Foundation. We thank Dike Qiu for technical assistance in generating primary neuronal cultures and Rebecca Lurz for editorial assistance. We also thank Dr. Ronald Zielke (Brain and Tissue Banks for Developmental Disorders, Department of Pediatrics, University of Maryland) for providing human tissues.
Correspondence should be addressed to Dr. Michael K. Lee, Department of Pathology-Neuropathology, The Johns Hopkins University School of Medicine, 558 Ross Research Building, 720 Rutland Avenue, Baltimore, MD 21205-2196. E-mail: mklee@jhmi.edu.
Copyright © 2004 Society for Neuroscience 0270-6474/04/249400-11$15.00/0
References
- Abeliovich A, Schmitz Y, Farinas I, Choi-Lundberg D, Ho WH, Castillo PE,Shinsky N, Verdugo JM, Armanini M, Ryan A, Hynes M, Phillips H, Sulzer D, Rosenthal A (2000) Mice lacking alpha-synuclein display functional deficits in the nigrostriatal dopamine system. Neuron 25: 239-252. [DOI] [PubMed] [Google Scholar]
- Bennett MC, Bishop JF, Leng Y, Chock PB, Chase TN, Mouradian MM (1999) Degradation of alpha-synuclein by proteasome. J Biol Chem 274: 33855-33858. [DOI] [PubMed] [Google Scholar]
- Biasini E, Fioriti L, Ceglia I, Invernizzi R, Bertoli A, Chiesa R, Forloni G (2004) Proteasome inhibition and aggregation in Parkinson's disease: a comparative study in untransfected and transfected cells. J Neurochem 88: 545-553. [DOI] [PubMed] [Google Scholar]
- Bonifati V, Rizzu P, van Baren MJ, Schaap O, Breedveld GJ, Krieger E, Dekker MC, Squitieri F, Ibanez P, Joosse M, van Dongen JW, Vanacore N, van Swieten JC, Brice A, Meco G, van Duijn CM, Oostra BA, Heutink P (2003) Mutations in the DJ-1 gene associated with autosomal recessive early-onset parkinsonism. Science 299: 256-259. [DOI] [PubMed] [Google Scholar]
- Borchelt DR, Lee MK, Slunt HH, Guarnieri M, Xu Z-S, Wong PC, Brown Jr RH, Price DL, Sisodia SS, Cleveland DW (1994) Superoxide dismutase 1 with mutations linked to familial amyotrophic lateral sclerosis possesses significant activity. Proc Natl Acad Sci USA 91: 8292-8296. [DOI] [PMC free article] [PubMed] [Google Scholar]
- Chiba-Falek O, Nussbaum RL (2001) Effect of allelic variation at the NACP Rep1 repeat upstream of the alpha-synuclein gene (SNCA) on transcription in a cell culture luciferase reporter system. Hum Mol Genet 10: 3101-3109. [DOI] [PubMed] [Google Scholar]
- Clayton DF, George JM (1999) Synucleins in synaptic plasticity and neurodegenerative disorders. J Neurosci Res 58: 120-129. [PubMed] [Google Scholar]
- Conway KA, Harper JD, Lansbury PT (1998) Accelerated in vitro fibril formation by a mutant alpha-synuclein linked to early-onset Parkinson disease. Nat Med 4: 1318-1320. [DOI] [PubMed] [Google Scholar]
- Dickson DW (2001) alpha-Synuclein and the Lewy body disorders. Curr Opin Neurol 14: 423-432. [DOI] [PubMed] [Google Scholar]
- Fahn S, Przedborski S (2000) Parkinsonism. In: Merritt's neurology (Row-land LP, ed), pp 679-695. New York: Lippincott, Williams and Wilkins.
- Farrer M, Maraganore DM, Lockhart P, Singleton A, Lesnick TG, de Andrade M, West A, de Silva R, Hardy J, Hernandez D (2001) Alpha-synuclein gene haplotypes are associated with Parkinson's disease. Hum Mol Genet 10: 1847-1851. [DOI] [PubMed] [Google Scholar]
- Farrer M, Kachergus J, Forno L, Lincoln S, Wang DS, Hulihan M, Maraganore D, Gwinn-Hardy K, Wszolek Z, Dickson D, Langston JW (2004) Comparison of kindreds with parkinsonism and alpha-synuclein genomic multiplications. Ann Neurol 55: 174-179. [DOI] [PubMed] [Google Scholar]
- Feany MB, Bender WW (2000) A Drosophila model of Parkinson's disease. Nature 404: 394-398. [DOI] [PubMed] [Google Scholar]
- Fujiwara H, Hasegawa M, Dohmae N, Kawashima A, Masliah E, Goldberg MS, Shen J, Takio K, Iwatsubo T (2002) Alpha-synuclein is phosphorylated in synucleinopathy lesions. Nat Cell Biol 4: 160-164. [DOI] [PubMed] [Google Scholar]
- Galvin JE, Uryu K, Lee VM, Trojanowski JQ (1999) Axon pathology in Parkinson's disease and Lewy body dementia hippocampus contains alpha-, beta-, and gamma-synuclein. Proc Natl Acad Sci USA 96: 13450-13455. [DOI] [PMC free article] [PubMed] [Google Scholar]
- Galvin JE, Lee VMY, Trojanowski JQ (2001) Synucleinopathies. Arch Neurol 58: 186-190. [DOI] [PubMed] [Google Scholar]
- George JM (2002) The synucleins. Genome Biol 3: 3002.1-3002.6. [DOI] [PMC free article] [PubMed] [Google Scholar]
- George JM, Clayton DF (1998) Songbirds, synelfin, and neurodegenerative disease. Neurosci News 1: 12-17. [Google Scholar]
- Giasson BI, Duda JE, Quinn SM, Zhang B, Trojanowski JQ, Lee VM (2002) Neuronal alpha-synucleinopathy with severe movement disorder in mice expressing A53T human alpha-synuclein. Neuron 34: 521-533. [DOI] [PubMed] [Google Scholar]
- Goedert M (1997) The awakening of α-synuclein. Nature 388: 232-233. [DOI] [PubMed] [Google Scholar]
- Goedert M, Spillantini MG (1998) Lewy body diseases and multiple system atrophy as alpha-synucleinopathies. Mol Psychiatry 3: 462-465. [DOI] [PubMed] [Google Scholar]
- Goto S, Takahashi R, Kumiyama AA, Radak Z, Hayashi T, Takenouchi M, Abe R (2001) Implications of protein degradation in aging. Ann NY Acad Sci 928: 54-64. [DOI] [PubMed] [Google Scholar]
- Gozal D, Row BW, Kheirandish L, Liu R, Guo SZ, Qiang F, Brittian KR (2003) Increased susceptibility to intermittent hypoxia in aging rats: changes in proteasomal activity, neuronal apoptosis and spatial function. J Neurochem 86: 1545-1552. [DOI] [PubMed] [Google Scholar]
- Hasegawa M, Fujiwara H, Nonaka T, Wakabayashi K, Takahashi H, Lee VM, Trojanowski JQ, Mann D, Iwatsubo T (2002) Phosphorylated alpha-synuclein is ubiquitinated in alpha-synucleinopathy lesions. J Biol Chem 277: 49071-49076. [DOI] [PubMed] [Google Scholar]
- Hashimoto M, Hsu LJ, Xia Y, Takeda A, Sisk A, Sundsmo M, Masliah E (1999) Oxidative stress induces amyloid-like aggregate formation of NACP/alpha-synuclein in vitro. NeuroReport 10: 717-721. [DOI] [PubMed] [Google Scholar]
- Hsu LJ, Mallory M, Xia Y, Veinbergs I, Hashimoto M, Yoshimoto M, Thal LJ, Saitoh T, Masliah E (1998) Expression pattern of synucleins (non-Abeta component of Alzheimer's disease amyloid precursor protein/alphasynuclein) during murine brain development. J Neurochem 71: 338-344. [DOI] [PubMed] [Google Scholar]
- Iwata A, Maruyama M, Akagi T, Hashikawa T, Kanazawa I, Tsuji S, Nukina N (2003) Alpha-synuclein degradation by serine protease neurosin: implication for pathogenesis of synucleinopathies. Hum Mol Genet 12: 2625-2635. [DOI] [PubMed] [Google Scholar]
- Kirik D, Rosenblad C, Burger C, Lundberg C, Johansen TE, Muzyczka N, Mandel RJ, Bjorklund A (2002) Parkinson-like neurodegeneration induced by targeted overexpression of alpha-synuclein in the nigrostriatal system. J Neurosci 22: 2780-2791. [DOI] [PMC free article] [PubMed] [Google Scholar]
- Kirik D, Annett LE, Burger C, Muzyczka N, Mandel RJ, Bjorklund A (2003) Nigrostriatal alpha-synucleinopathy induced by viral vector-mediated overexpression of human alpha-synuclein: a new primate model of Parkinson's disease. Proc Natl Acad Sci USA 100: 2884-2889. [DOI] [PMC free article] [PubMed] [Google Scholar]
- Kitada T, Asakawa S, Hattori N, Matsumine H, Yamamura Y, Minoshima S, Yokochi M, Mizuno Y, Shimizu N (1998) Mutations in the parkin gene cause autosomal recessive juvenile parkinsonism. Nature 392: 605-608. [DOI] [PubMed] [Google Scholar]
- Kruger R, Kuhn W, Muller T, Woitalla D, Graeber M, Kosel S, Przunte H, Epplen JT, Schols L, Riess O (1998) Ala30Pro mutation in the gene encoding alpha-synuclein in Parkinson's disease. Nat Genet 18: 106-108. [DOI] [PubMed] [Google Scholar]
- Kruger R, Vieira-Saecker AM, Kuhn W, Berg D, Muller T, Kuhnl N, Fuchs GA, Storch A, Hungs M, Woitalla D, Przuntek H, Epplen JT, Schols L, Riess O (1999) Increased susceptibility to sporadic Parkinson's disease by a certain combined alpha-synuclein/apolipoprotein E genotype. Ann Neurol 45: 611-617. [DOI] [PubMed] [Google Scholar]
- Lee FJS, Liu F, Pristupa ZB, Niznik HB (2001) Direct binding and functional coupling of alpha-synuclein to the dopamine transporters accelerate dopamine induced apoptosis. FASEB J 15: 916-926. [DOI] [PubMed] [Google Scholar]
- Lee HJ, Khoshaghideh F, Patel S, Lee SJ (2004) Clearance of α-synuclein oligomeric intermediates via the lysosomal degradation pathway. J Neurosci 24: 1888-1896. [DOI] [PMC free article] [PubMed] [Google Scholar]
- Lee MK, Slunt HH, Martin LJ, Thinakaran G, Kim G, Gandy SE, Seeger M, Koo E, Price DL, Sisodia SS (1996) Expression of presenilin 1 and 2 (PS1 and PS2) in human and murine tissues. J Neurosci 16: 7513-7525. [DOI] [PMC free article] [PubMed] [Google Scholar]
- Lee MK, Borchelt DR, Kim G, Thinakaran G, Slunt HH, Ratovitski T, Martin LJ, Kittur A, Gandy S, Levey AI, Jenkins N, Copeland N, Price DL, Sisodia SS (1997) Hyperaccumulation of FAD-linked presenilin 1 variants in vivo. Nat Med 3: 756-760. [DOI] [PubMed] [Google Scholar]
- Lee MK, Stirling W, Xu Y, Xu X, Qui D, Mandir AS, Dawson TM, Copeland NG, Jenkins NA, Price DL (2002) Human alpha-synuclein-harboring familial Parkinson's disease-linked Ala-53->Thr mutation causes neurodegenerative disease with alpha-synuclein aggregation in transgenic mice. Proc Natl Acad Sci USA 99: 8968-8973. [DOI] [PMC free article] [PubMed] [Google Scholar]
- Lesuisse C, Martin LJ (2002) Long-term culture of mouse cortical neurons as a model for neuronal development, aging, and death. J Neurobiol 51: 9-23. [DOI] [PubMed] [Google Scholar]
- Levine RL, Williams JA, Stadtman ER, Shacter E (1994) Carbonyl assays for determination of oxidatively modified proteins. Methods Enzymol 233: 346-357. [DOI] [PubMed] [Google Scholar]
- Li W, Hoffman PN, Stirling W, Price DL, Lee MK (2004) Axonal transport of human alpha-synuclein slows with aging but is not affected by familial Parkinson's disease-linked mutations. J Neurochem 88: 401-410. [DOI] [PubMed] [Google Scholar]
- Lo Bianco C, Ridet JL, Schneider BL, Deglon N, Aebischer P (2002) alpha-Synucleinopathy and selective dopaminergic neuron loss in a rat lentiviral-based model of Parkinson's disease. Proc Natl Acad Sci USA 99: 10813-10818. [DOI] [PMC free article] [PubMed] [Google Scholar]
- Lopez-Carballo G, Moreno L, Masia S, Perez P, Barettino D (2002) Activation of the phosphatidylinositol 3-kinase/Akt signaling pathway by retinoic acid is required for neural differentiation of SH-SY5Y human neuroblastoma cells. J Biol Chem 277: 25297-25304. [DOI] [PubMed] [Google Scholar]
- Maroteaux L, Campanelli JT, Scheller RH (1988) Synuclein: a neuron-specific protein localized to the nucleus and presynaptic nerve terminal. J Neurosci 8: 2804-2815. [DOI] [PMC free article] [PubMed] [Google Scholar]
- Martin GM, Austad SN, Johnson TE (1996) Genetic analysis of aging: role of oxidative damage and environmental stresses. Nat Genet 13: 25-34. [DOI] [PubMed] [Google Scholar]
- Masliah E, Rockenstein E, Veinbergs I, Mallory M, Hashimoto M, Takeda A, Sagara Y, Sisk A, Mucke L (2000) Dopaminergic loss and inclusion body formation in alpha-synuclein mice: implications for neurodegenerative disorders. Science 287: 1265-1269. [DOI] [PubMed] [Google Scholar]
- Mishizen-Eberz AJ, Guttmann RP, Giasson BI, Day III GA, Hodara R, Ischiropoulos H, Lee VM, Trojanowski JQ, Lynch DR (2003) Distinct cleavage patterns of normal and pathologic forms of alpha-synuclein by calpain I in vitro. J Neurochem 86: 836-847. [DOI] [PubMed] [Google Scholar]
- Neumann M, Kahle PJ, Giasson BI, Ozmen L, Borroni E, Spooren W, Muller V, Odoy S, Fujiwara H, Hasegawa M, Iwatsubo T, Trojanowski JQ, Kretzschmar HA, Haass C (2002) Misfolded proteinase K-resistant hyperphosphorylated alpha-synuclein in aged transgenic mice with locomotor deterioration and in human alpha-synucleinopathies. J Clin Invest 110: 1429-1439. [DOI] [PMC free article] [PubMed] [Google Scholar]
- Paxinou E, Chen Q, Weisse M, Giasson BI, Norris EH, Rueter SM, Trojanowski JQ, Lee VM, Ischiropoulos H (2001) Induction of α-synuclein aggregation by intracellular nitrative insult. J Neurosci 21: 8053-8061. [DOI] [PMC free article] [PubMed] [Google Scholar]
- Perez RG, Waymire JC, Lin E, Liu JJ, Guo F, Zigmond MJ (2002) A role for alpha-synuclein in the regulation of dopamine biosynthesis. J Neurosci 22: 3090-3099. [DOI] [PMC free article] [PubMed] [Google Scholar]
- Petersen K, Olesen OF, Mikkelsen JD (1999) Developmental expression of alpha-synuclein in rat hippocampus and cerebral cortex. Neuroscience 91: 651-659. [DOI] [PubMed] [Google Scholar]
- Petrucelli L, O'Farrell C, Lockhart PJ, Baptista M, Kehoe K, Vink L, Choi P, Wolozin B, Farrer M, Hardy J, Cookson MR (2002) Parkin protects against the toxicity associated with mutant alpha-synuclein: proteasome dysfunction selectively affects catecholaminergic neurons. Neuron 36: 1007-1019. [DOI] [PubMed] [Google Scholar]
- Polymeropoulos MH, Lavedan C, Leroy E, Ide SE, Dehejia A, Dutra A, Pike B, Root H, Rubenstein J, Boyer R, Stenroos ES, Chandrasekharappa S, Athanassiadou A, Papapetropoulos T, Johnson WG, Lazzarini AM, Duvoisin RC, Di Iorio G, Golbe LI, Nussbaum RL (1997) Mutation in the alpha-synuclein gene identified in families with Parkinson's disease. Science 276: 2045-2047. [DOI] [PubMed] [Google Scholar]
- Rochet JC, Conway KA, Lansbury Jr PT (2000) Inhibition of fibrillization and accumulation of prefibrillar oligomers in mixtures of human and mouse alpha-synuclein. Biochemistry 39: 10619-10626. [DOI] [PubMed] [Google Scholar]
- Rockenstein E, Hansen LA, Mallory M, Trojanowski JQ, Galasko D, Masliah E (2001) Altered expression of the synuclein family mRNA in Lewy body and Alzheimer's disease. Brain Res 914: 48-56. [DOI] [PubMed] [Google Scholar]
- Singleton A, Myers A, Hardy J (2004) The law of mass action applied to neurodegenerative disease: a hypothesis concerning the etiology and pathogenesis of complex diseases. Hum Mol Genet 13[Suppl 1]: R123-R126. [DOI] [PubMed] [Google Scholar]
- Singleton AB, Farrer M, Johnson J, Singleton A, Hague S, Kachergus J, Hulihan M, Peuralinna T, Dutra A, Nussbaum R, Lincoln S, Crawley A, Hanson M, Maraganore D, Adler C, Cookson MR, Muenter M, Baptista M, Miller D, Blancato J, Hardy J, Gwinn-Hardy K (2003) alpha-Synuclein locus triplication causes Parkinson's disease. Science 302: 841. [DOI] [PubMed] [Google Scholar]
- Slunt HH, Thinakaran G, von Koch C, Lo ACY, Tanzi RE, Sisodia SS (1994) Expression of a ubiquitous, cross-reactive homologue of the mouse β-amyloid precursor protein (APP). J Biol Chem 269: 2637-2644. [PubMed] [Google Scholar]
- Souza JM, Giasson BI, Chen Q, Lee VM, Ischiropoulos H (2000) Dityrosine cross-linking promotes formation of stable alpha-synuclein polymers. Implication of nitrative and oxidative stress in the pathogenesis of neurodegenerative synucleinopathies. J Biol Chem 275: 18344-18349. [DOI] [PubMed] [Google Scholar]
- Tanaka Y, Engelender S, Igarashi S, Rao RK, Wanner T, Tanzi RE, Sawa AL, Dawson V, Dawson TM, Ross CA (2001) Inducible expression of mutant alpha-synuclein decreases proteasome and increases sensitivity to mitochondria-dependent apoptosis. Hum Mol Genet 10: 919-926. [DOI] [PubMed] [Google Scholar]
- Tofaris GK, Layfield R, Spillantini MG (2001) alpha-synuclein metabolism and aggregation is linked to ubiquitin-independent degradation by the proteasome. FEBS Lett 509: 22-26. [DOI] [PubMed] [Google Scholar]
- Ueda K, Fukushima H, Masliah E, Xia Y, Iwai A, Yoshimoto M, Otero DA, Kondo J, Ihara Y, Saitoh T (1993) Molecular cloning of cDNA encoding an unrecognized component of amyloid in Alzheimer disease. Proc Natl Acad Sci USA 90: 11282-11286. [DOI] [PMC free article] [PubMed] [Google Scholar]
- Uversky VN, Fink AL (2002) Amino acid determinants of alpha-synuclein aggregation: putting together pieces of the puzzle. FEBS Lett 522: 9-13. [DOI] [PubMed] [Google Scholar]
- Van der Putten H, Wiederhold KH, Probst A, Barbieri S, Mistl C, Danner S, Kauffmann S, Hofele K, Spooren WP, Ruegg MA, Lin S, Caroni P, Sommer B, Tolnay M, Bilbe G (2000) Neuropathology in mice expressing human α-synuclein. J Neurosci 20: 6021-6029. [DOI] [PMC free article] [PubMed] [Google Scholar]
- Webb JL, Ravikumar B, Atkins J, Skepper JN, Rubinsztein DC (2003) Alpha-Synuclein is degraded by both autophagy and the proteasome. J Biol Chem 278: 25009-25013. [DOI] [PubMed] [Google Scholar]
- Zhou W, Schaack J, Zawada WM, Freed CR (2002) Overexpression of human alpha-synuclein causes dopamine neuron death in primary human mesencephalic culture. Brain Res 926: 42-50. [DOI] [PubMed] [Google Scholar]