Abstract
High-frequency stimulation of the globus pallidus (GP) has emerged as a successful tool for treating Parkinson's disease and other motor disorders. However, the mechanism governing its therapeutic effect is still under debate. To shed light on the basic mechanism of deep brain stimulation (DBS), we performed microstimulation in the GP of a 1-methyl-4-phenyl-1,2,3,6-tetrahydropyridine-treated monkey while recording with other microelectrodes in the same nucleus. We used robust methods to reduce the stimulus artifact, and 600-3000 repetitions of a single stimulus and of high-frequency short trains (10-40 stimuli), enabling high temporal resolution analysis of neural responses. Low-frequency stimulation yielded a typical three-stage response: short-term (2-3 msec duration) activity, followed by mid-term (15-25 msec) inhibition, and occasionally longer-term (30-40 msec) excitation. Trains of high-frequency stimuli elicited complex locking of the response to the stimuli in most neurons. The locking displayed a stereotypic temporal structure consisting of three short-duration (1-2 msec) phases: an initial (mean latency = 2.9 msec) excitation followed by an inhibition (4.6 msec) and a second excitation (6.3 msec). The change in the mean firing rate was mixed; the majority of the neurons displayed partial inhibition during the stimulus train. Slow inhibitory and excitatory multiphase changes in the firing rate were observed after the stimulus trains. The activity of neurons recorded simultaneously displayed rate correlations but no spike-to-spike correlations. Our results suggest that the effect of DBS on the GP is not complete inhibition but rather a complex reshaping of the temporal structure of the neuronal activity within that nucleus.
Keywords: basal ganglia, high-frequency stimulation, Parkinson's disease, deep brain stimulation, stimulus artifact, extracellular recording, MPTP
Introduction
Stereotactic ablative surgeries targeting the globus pallidus internal segment (GPi), the ventral intermediate thalamic nucleus, and the subthalamic nucleus (STN) have been a major tool for treating the symptoms of Parkinson's disease (PD) and other movement disorders for over 50 years (Gildenberg, 2003). Since the early days of ablation surgeries, electrical stimulation of these nuclei has been used to localize the target, leading to the observation that stimulation reduces tremor in patients. This prompted the assumption that stimulation, and especially high-frequency stimulation (HFS), had the same effect as ablation, namely, complete inhibition of firing in the target nucleus. In turn, this has encouraged the use of chronically implanted stimulating electrodes for treating PD, a widely used treatment that is replacing ablation (Benabid, 2003).
Despite its proven therapeutic success, however, the physiological effects of deep brain stimulation (DBS) in the basal ganglia are still debated. Some electrophysiological recordings performed in humans (intraoperatively) (Dostrovsky et al., 2000; Wu et al., 2001; Filali et al., 2004), primates (Boraud et al., 1996), rodents (Benazzouz et al., 2000; Tai et al., 2003), and slices (Beurrier et al., 2001; Magarinos-Ascone et al., 2002) reflect full or partial inhibition of neuronal firing in the stimulated nucleus. On the other hand, results from human imaging (Ceballos-Baumann et al., 1999; Jech et al., 2001), microdialysis in rodents (Windels et al., 2000), and electrophysiological recordings in primates (Nambu et al., 2000; Anderson et al., 2003; Hashimoto et al., 2003), rodents (Maurice et al., 2003), and slices (Garcia et al., 2003) conflict with the inhibition hypothesis and demonstrate different activation patterns after stimulation. Most of the results demonstrating inhibitory effects arise from recordings in the stimulated nucleus, whereas most of the results reporting other (noninhibitory) effects were obtained from recordings from an area receiving input (either directly or indirectly) from the stimulated area. This fits the claim that the effects on the somas and the axons, and thus on cells in the stimulated nucleus and its targets, may be different (McIntyre et al., 2003).
The major methodological hurdle in studies of DBS mechanisms is the removal of the stimulus artifact (to enable fine temporal analysis of neuronal activity during the HFS period) while carrying out direct recording within the stimulated nucleus (to provide direct evidence of its activation or inhibition). Previous experiments in intact animals either have been recorded in a different nucleus from the stimulated nucleus, thus deducing the stimulus effect on the target nucleus indirectly, or have been limited by the artifact to observation of the activity after the HFS train or during a small portion of the time during the HFS, thus losing their ability to observe the temporal structure of the response. This research aims at overcoming the existing obstacles by minimizing the stimulus artifact at the hardware level and using an advanced stimulus artifact compensation algorithm and a large number of stimulus train repetitions. This enables the examination of the fine structure of neuronal firing patterns within the GP during its stimulation and provides insights into the mechanism underlying the therapeutic results of DBS.
Materials and Methods
A cynomolgus monkey (Macaca fascicularis; female; weight, 2.5 kg) was used in this study. The monkey was trained and engaged in a behavioral paradigm of a visual-motor delayed response task as part of a study of the normal GP before this study. After these experiments were completed, 1-methyl-4-phenyl-1,2,3,6-tetrahydropyridine (MPTP) injections were started (see below). The monkey's health was monitored by a veterinarian, and its fluid consumption, diet, and weight were followed daily. All procedures were in accordance with the National Institutes of Health Guide for the Care and Use of Laboratory Animals and The Hebrew University guidelines for the use and care of laboratory animals in research and were approved and supervised by the Institutional Animal Care and Use Committee.
Surgery and induction of parkinsonism. After training, a 27-mm-square plastic recording chamber was attached to the skull to allow access to the GP. The recording chamber was positioned vertically, with its center targeted at the stereotaxic coordinates A13, L02 (Martin and Bowden, 2000) of the right hemisphere. The chamber coordinates were adjusted according to magnetic resonance imaging (4.7 tesla animal system; fast-spin echo sequence; effective echo time, 80 msec; repetition time, 2.5 sec; 17 coronal slices 2 mm wide; Biospec; Bruker, Billerica, MA). All surgical procedures were performed under general anesthesia [induced by intramuscular ketamine hydrochloride (15 mg/kg) and Domitor (0.1 mg/kg) and maintained by isoflurane and N2O ventilation] and aseptic conditions. After a period of recording in the normal state, parkinsonism was induced by four intramuscular injections of 0.4 mg/kg MPTP neurotoxin (Sigma, Rehovot, Israel). The MPTP injections were given under light intramuscular ketamine hydrochloride (10 mg/kg) anesthesia and over a period of 4 d. The monkey developed severe parkinsonism 3 d after initiation of MPTP treatment, and recordings were resumed 5 d after the last injection. The monkey's parkinsonian state was assessed daily using the Kurlan scale (Kurlan et al., 1991) and was stable throughout the recording period.
Recording and stimulation. During recording sessions, the monkey's head was immobilized, and four glass-coated tungsten microelectrodes (impedance, 0.3-0.8 MΩ at 1 kHz) confined within a cylindrical guide (1.36/1.65 mm inner/outer diameter) were advanced separately [EPS (Electrode Positioning System) 1.31; Alpha-Omega Engineering, Nazareth, Israel] into the GP. The vertical location of each electrode was set independently to optimize the recording of single units, and the range of vertical distances was 0-2000 μm. The horizontal distance between the different electrodes was 500-1000 μm, defined by the spatial arrangement of the electrodes within the guide. In addition, the electrodes may not follow a straight trajectory during their extension from the guide to the deep brain structure; this can lead to a maximal horizontal dispersion of the tips of up to 1500 μm and to smaller changes in the vertical distance (tested in agar). The electrode signal was amplified with a gain of 5000 and bandpass filtered with a 1-6000 Hz four-pole Butterworth filter [MCP (Multi Channel Processor)-Plus 2.0, Alpha-Omega Engineering]. The signal was continuously sampled at 24 kHz with 12-bit resolution (Alphamap 5.5, Alpha-Omega Engineering). Thus, the analog-to-digital (A/D) range of ±5 V enables an ∼0.5 μV recording amplitude resolution.
Stimulation was performed through the microelectrodes using an optically coupled isolator and linear current-source stimulator (Alpha-Omega Engineering) connected through a separate head-stage amplifier (to reduce stimulus artifacts). The stimulation was monopolar, and the reference was the general ground (established by connecting all cranial metal connections), which was common to all electrodes. The current amplitude and waveform were verified by the voltage drop over 1 kΩ resistance in series with the electrode. Stimulation current amplitude was 40 μA, and it consisted of either monophasic (a 200 μsec negative pulse) or biphasic (a 200 μsec positive pulse followed immediately by a 200 μsec negative pulse) stimuli. HFS was performed with 7 msec intervals between the end of one stimulus and the initiation of the next one, leading to a stimulation frequency of either 138.9 Hz (7.2 msec interval) for monophasic stimulation or 135.1 Hz (7.4 msec interval) for biphasic stimulation. All electrodes used in our study were of the same type and could be used for either stimulation or recording. During each session, a single electrode was used for stimulation, whereas the others (one to three electrodes) were used for recording. The electrode used for stimulation within a certain session was not used for recording during the same session. However, the same electrode could serve for stimulation during one session and for recording during the next session. Stimulation and recordings were performed only through electrodes that were identified to be in the GP according to the characteristic profile of the extracellular action potential and the firing rate and pattern of neurons recorded by the electrode before stimulus initiation. No distinction was made between neurons of the external and internal segments of the GP, mainly because of the vertical trajectory, which did not allow reliable differentiation (Schiff et al., 2002).
In this study we used microstimulation using a 40 μA stimulus, which leads to an activation range of ∼400 μm (Ranck, 1975). This yields a maximal activated volume of 0.27 mm3, which is <1% of the volume of the primate globus pallidus external segment (GPe; 132 mm3) and the GPi (63 mm3) (J. Yelnik, personal communication). On the other hand, DBS is typically applied through a macroelectrode for which the typical resistance is ∼1 kΩ [Medtronic (Minneapolis, MN) specifications for DBS leads 3387 and 3389]. Therefore, a typical voltage of 3 V leads to a current of ∼3 mA and an activation range of ∼3 mm (Ranck, 1975; Ashby et al., 1998). This leads to a maximal activated volume of 113 mm3, which makes up >10% of the human GPe (808 mm3) and GPi (478 mm3) (Yelnik, 2002).
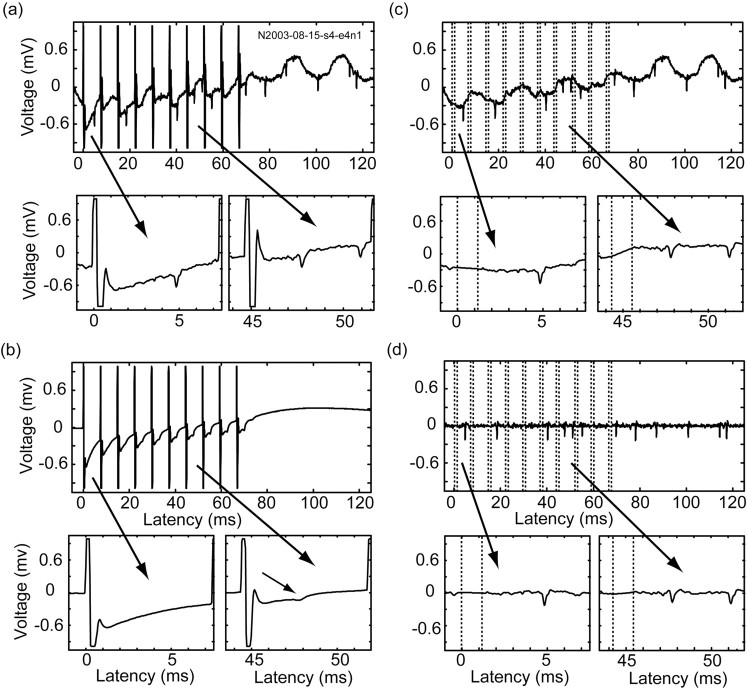
Stimulus artifact removal and spike sorting. The stimulus produced prominent artifacts in the recordings, including short-term saturations of the recording electrodes. Thus, special care was required to enable extraction of the spikes of single units from the recorded signal [for examples of other artifact removal methods, see Wichmann (2000) and Hashimoto et al. (2002)]. First, at the hardware level, we used broad-pass (1-6000 Hz) filters and high-speed (24 kHz) A/D conversion. This type of recording enables a minimization of the stimulus artifact and a reduction in the digital sampling error, leading to more precise spike identification. The software-based retrieval of the spikes involved a multistage analysis process. Initially, the train repetitions (600-3000) are aligned so that different stimuli are grouped according to their place within the trains; i.e., 1 through 10 or 40 depending on the train length (Fig. 1a). Subsequently, the stimulus artifact pattern is calculated for each group, yielding a total of 10 or 40 patterns (Fig. 1b). This approach was chosen because in many cases the shape of the stimulus artifact was dependent on the train history. At this stage, the patterns are examined to check for effects of locked neuronal responses, which might change the pattern derived from the stimulus artifact (Fig. 1b, short arrow). If such an effect is found, it is removed from the artifact pattern by extrapolating its borders. The artifact pattern is then removed from the original signal using the procedure detailed below (Fig. 1c). It is crucial to remove the artifact before additional filtering is performed, because any filtering without removal of the artifact increases the duration of the artifact. Finally, the signal is high-pass filtered at 300 Hz (Fig. 1d).
Figure 1.
Stimulus artifact removal process. A sample recording is shown during a train of HFS. The traces are shown throughout the removal process and a magnified view is provided for the times after the first (left) and seventh (right) stimuli. a, Original recorded signal. The 50 Hz artifacts are clearly seen because of the broadband (1-6000 Hz) filter setting. The sequence indicates the number of the neuron with spikes that formed the basis of the figure. b, Mean shapes of the stimulus artifacts were averaged over 600 trains. The short arrow points to the part of the pattern that derives from the locking of the neural response to the stimulus. c, d, The same signal is shown after the artifact pattern removal, before (c) and after (d) digital high-pass (300 Hz) filtering. The dotted lines identify the recording dead time (stimulation parameters: biphasic stimulation; each phase, 0.2 msec/40 μA; 600 trains of 140 Hz; 10 stimuli per train; 500 msec between trains).
Removal of the artifact pattern is not merely a subtraction of the pattern from the signal. Rather, the artifact pattern is first broken down along the borders of the recording “dead time.” The dead time is the period in which identification of spiking activity is impossible because of saturation of the amplifier or the A/D system. Delineation of the dead time period was obtained by identification of altered levels of the signal recording variation (Fig. 2a). The recording variation (or in this case, the SD) is 0 during the saturation periods, then rises to high values during periods in which the derivative of the signal is very high (usually because of A/D sampling jitter), and finally retains an almost constant value until the next stimulus artifact (Fig. 2b). In cases of highly precise locking of the spiking activity to the stimulus, the variance may deviate to higher or lower values depending on the firing probability (Fig. 2a,b, arrow). In the areas surrounding the dead time, the artifact pattern was subtracted from the signal. Then the dead time was removed and replaced by a linear fit connecting the signal before and after the period, while correcting the DC levels to achieve a smooth transition (by adding or removing a scalar). The dead time varies even between stimuli in the same train; however, the differences are typically negligible. In our data, the dead time calculated for a stimulus in the middle of the train (stimulus 5 was chosen for simplicity in trains of both 10 and 40 stimuli) was 1.09 ± 0.09 msec (mean ± SEM) (Fig. 2c). Spikes could be identified immediately after the dead time period. The processed signal was then sorted using an off-line spike-sorting procedure (Alphasort 4.0.23; Alpha-Omega Engineering) based on principal component analysis of the spike patterns (Abeles and Goldstein, 1977). The sorting was verified by the existence of a refractory period in the inter-spike interval histogram and by the stability of the firing rate of the cells for at least 120 sec before and after the stimulation period. All calculations of firing rates after the stimulation were normalized to compensate for the dead time. This was done by multiplication of the calculated firing rate by the ratio of the original time window to the functional time window (original time window minus the dead time).
Figure 2.
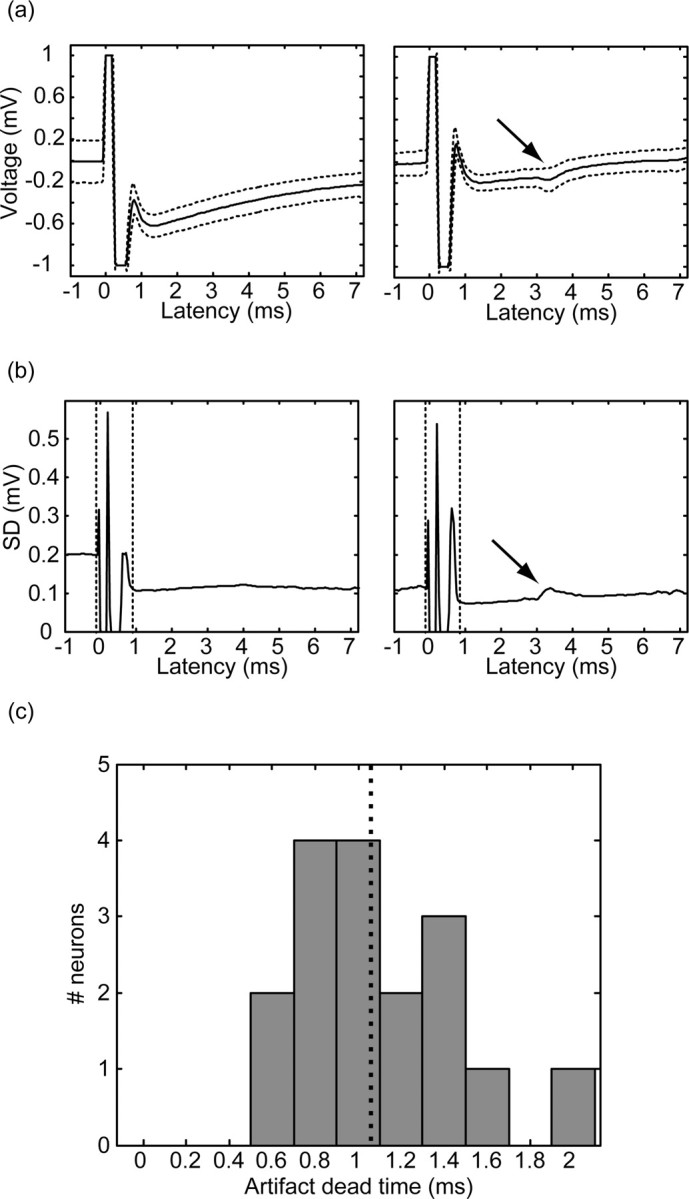
Stimulation artifact dead time. a, The mean shape of the stimulus artifact (same neuron as in Fig. 1; solid line) surrounded by a single SD offset (dotted line) for the time after the first (left) and seventh (right) stimuli. The arrow points to the part of the pattern that is derived from the locking of the neuronal response to the stimulus. b, The SD is shown for the same neuron and time (solid line). The dead time boundaries are marked by dotted lines. c, The distribution of the dead times of 17 pallidal neurons after a central (fifth) stimulus within trains of HFS; the mean length of the dead time is marked as a dotted line.
Results
Neural activity during low-frequency stimulus
Low-frequency (2 and 10 Hz) stimulation was applied to the GP for 5 min, yielding a total of 600-3000 repetitions. A total of 30 neurons were recorded (13 neurons during 2 Hz stimulation and 17 neurons during 10 Hz stimulation) in the GP. Most of the neurons that we recorded responded to the microstimulation despite the small stimulated volume and despite being outside the volume of direct excitation (electrode distance >500 μm). Response to the low-frequency stimulation consisted of three typical phases (Fig. 3a-c): (1) an initial short-term response, beginning 3-5 msec after the stimulation and lasting 2-3 msec, (2) a mid-term inhibitory response, beginning 5-10 msec after the stimulus and lasting 15-25 msec, and (3) a long-term excitatory response, beginning 20-30 msec after the stimulus and lasting 30-40 msec. Most of the neurons responded to the stimulus with at least one of the phases (17 of 30; 57%). Of the responding cells, most of the responses consisted of either all three phases (5 of 17; 29%) or just the first two phases (10 of 17; 59%). Responses consisting of only a short-term response or only mid-term inhibition were observed only once each (Fig. 3d). The initial short-term response appeared to arise after a short delay from the stimulation and not immediately after the dead time. Thus, the initial firing marks a distinct part of the response and does not seem to be merely a residual of the firing before the stimulus. The firing rate at the peak of the short-term response was in most cases around the baseline level of discharge rate (10 of 16; 62.5%), but in some cases was significantly above (4 of 16; 25%) or below (2 of 16; 12.5%) baseline value. Responses to 2 and 10 Hz were not different in the fraction of neurons with no response, short-term response, or mid-term inhibition. However, long-term excitation appeared in only 14% (1 of 7 responding neurons) of the neurons during 2 Hz stimulation but was found in 40% (4 of 10 responding neurons) of the neurons during 10 Hz stimulation.
Figure 3.
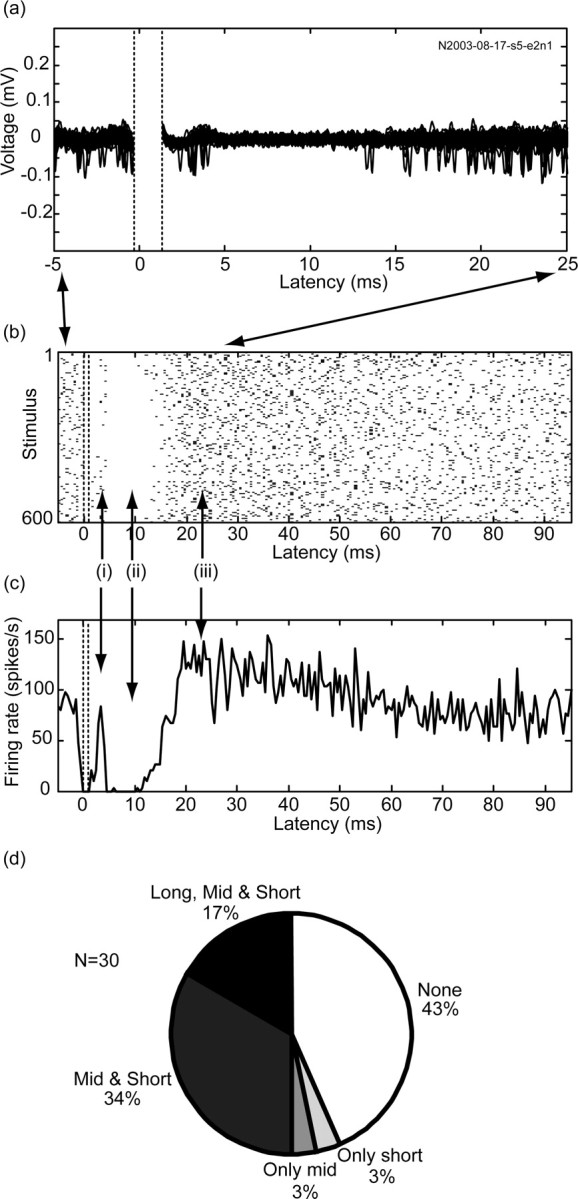
Activity during low-frequency stimulation. Response of a single pallidal neuron is shown as the following. a, An overlay of 50 signal traces (stimulus 400→449) after stimulus artifact removal and filtering. The dead time boundaries are marked by dotted lines. The sequence indicates the number of the neuron with spikes that formed the basis of the figure. b,A raster plot of all repetitions (n = 600). c, A PSTH showing a response consisting of three phases: i, short-term response, ii, mid-term inhibition, and iii, long-term excitation (stimulation parameters: biphasic stimulation; each phase, 0.2 msec/40 μ A; 600 repetitions; 10 Hz). Both the raster and PSTH are in 0.5 msec resolution and aligned to the stimulus. d, Distribution of pallidal responses to low-frequency stimulation.
Neural activity during trains of high-frequency stimuli
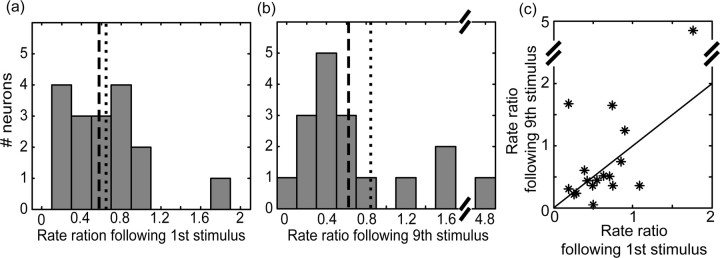
HFS was applied to the GP using sequences of 600-1000 trains separated by 500 msec; each train contained 10 (n = 7 neurons) or 40 (n = 10 neurons) stimuli. The response of pallidal neurons to the stimuli varied in terms of both the response to the first stimuli within the train and the changes in the response to the subsequent stimuli within the same train (Fig. 4). The neuronal responses in the early and late trains within the sequence were not significantly different. Thus, all train repetitions could be summed. In addition, no qualitative differences were observed between short (10 stimuli per train) and long (40 stimuli per train) trains; hence, their results were pooled. The response of the neurons varied over the train, with increasing (Fig. 4a,c,e) and decreasing (Fig. 4b,d,f) responses. The firing rate before the stimuli was 52.9 ± 21.8 (mean ± SD) and decreased immediately after the first stimulus in the train to 31.9 ± 20.1 (mean ± SD). The ratio of the firing rate after the first stimulus to the firing rate before the stimulation onset was 63% (or 56% after removal of a single neuron that was excited) (Fig. 5a). After the ninth stimulus, the firing rate was 43.8 ± 54.1 (mean ± SD). However, this consisted of two very different populations: 11 of 17 (76%) of the neurons were inhibited, with a firing rate of 20.8 ± 14.1 (mean ± SD), and 4 of 17 (24%) of the neurons were excited, with a firing rate of 118.5 ± 71.3 (mean ± SD). The ratio of the firing rate after the ninth stimulus to the firing rate before stimulus onset was 85% (or 60% after removal of a single outlier) (Fig. 5b). Most neurons decreased their firing rate during the stimulus train (Fig. 5c). However, all of the neurons that were excited by the end of the train were not initially excited. The firing rate after the stimuli was calculated to compensate for the dead time period. Thus, the mean rate was calculated for the duration excluding the dead time. Moreover, in many cases, the mean firing rate after the stimulus was lower than the mean rate before the stimulus, although the stimulus led to a response with a peak rate that was significantly higher than the mean rate.
Figure 4.
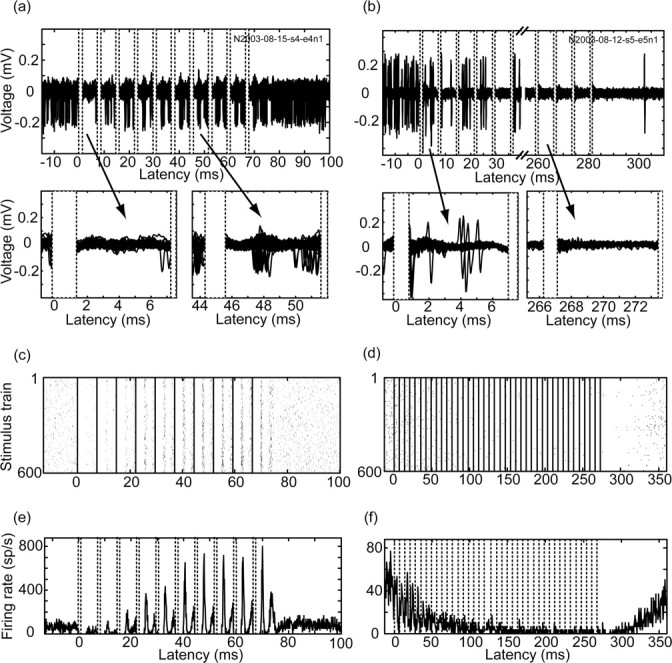
Activity during high-frequency stimulus train. The intratrain responses of two pallidal neurons to HFS: a time-locked excitatory response (a, c, e) within the train (same neuron as in Fig. 1) and an inhibited response (b, d, f) within the train (monophasic stimulation; 0.2 msec/40 μA; 600 trains of 140 Hz; 40 stimuli per train; 500 msec intertrain interval). a, b, Raw trace of a single stimulus train. The sequence indicates the number of the neuron with spikes that formed the basis of the figure. c, d, Raster display of the firing of multiple train repetitions.e, f, PSTH of the response. All figures are aligned to the first stimulus within the train.
Figure 5.
Changes in firing rate during high-frequency stimulus train. Distribution of the normalized firing rate after the first (a) and ninth (b) stimulus within the train (normalized rate = mean firing rate within the period after the dead time/mean rate before the trains). The mean rate is shown as a dotted line, and the mean rate after removal of the outlier is shown as a dashedline. c, The ratio of the normalized rates after the first and ninth stimuli; the diagonal marks a ratio of 1.
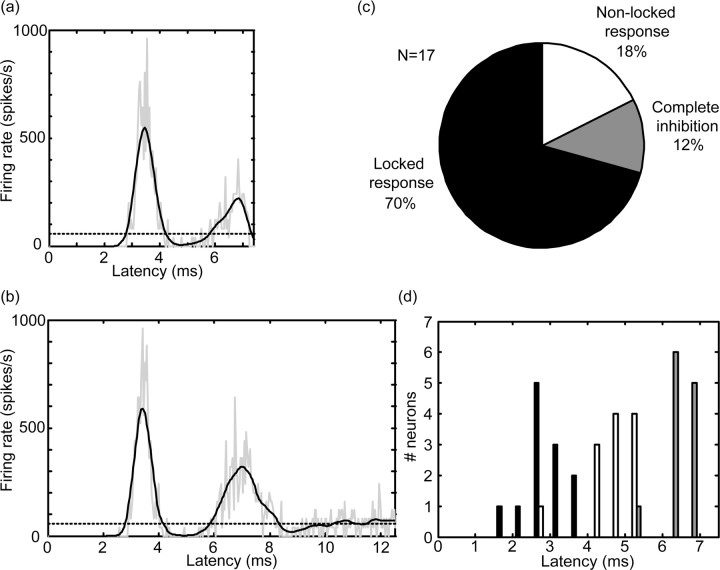
The typical response of a pallidal neuron after the stimulus displayed locked activity. Accumulating the response over the large number of train repetitions showed a multiphase change in the firing rate (Fig. 6a), which was truncated by the next stimulus in the train. The complete response could be obtained by averaging the repetitions of the last stimulus within the trains (Fig. 6b). Overall, the majority (12 of 17) of the neurons displayed locked activity, whereas the rest either did not display locked activity (3 of 17) or were almost completely inhibited (2 of 12), precluding analysis of the locking (Fig. 6c). All of the neurons that displayed locked activity followed a stereotypic response structure consisting of three phases: initial excitation (mean latency of maximal peak ± SD = 2.93 ± 0.60 msec) followed by an inhibition (mean latency of minimal trough ± SD = 4.65 ± 0.69 msec) and a final excitation (mean latency of maximal peak ± SD = 6.33 ± 0.47 msec) (Fig. 6d). The locking was partial, in that the neurons did not always respond with locked spikes during the time of the first and second excitation periods; rather, there were many trials in which a spike occurred during only one of the excitation periods and other trials in which no spikes occurred at all. Although most of the locked-response neurons (10 of 12) displayed little or no activity after the dead time and before the initial excitation, a few (2 of 12) neurons displayed an additional short excitation immediately after the dead time (∼1 msec after the stimulus).
Figure 6.
Locking of firing to the stimulus during high-frequency train. A single example (same neuron as in Fig. 1) of responses to different stimuli within the train (the gray line shows the response in ∼0.04 msec bins; the black line shows the smoothed response using least squares quadratic polynomial fitting of 24 ∼1 msec bins; the horizontal dotted line marks the mean firing rate before the stimuli). a, Response to the ninth stimulus; the second excitation is truncated by the next stimulus. b, Response to the last (10th) stimulus, showing the complete time course of the second excitation. c, Distribution of the responses of all pallidal neurons recorded during high-frequency trains. d, Distribution of the latencies of the first excitation (black bars), inhibition (white bars), and second excitation (gray bars).
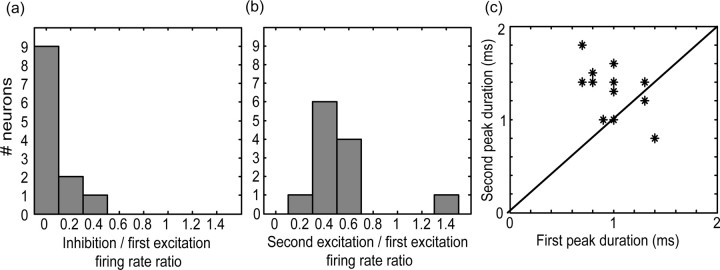
The inhibition separating the peaks was almost complete relative to the two peaks of the locked excitation. The ratio of the firing rate during the inhibition was 0.08 ± 0.13 to the maximal firing rate during the first peak (Fig. 7a) and 0.13 ± 0.19 to the maximal firing rate during the second peak. The second peak was smaller in its maximal amplitude than the first peak in all cases except one. The ratio of the maximal firing rate during the second peak to the maximal firing rate during the first peak was 0.54 ± 0.33 (or 0.46 ± 0.15 after removal of one outlier) (Fig. 7b). On the other hand, the second peak was typically wider (1.32 ± 0.28 msec) than the first peak (0.99 ± 0.24 msec) (Fig. 7c), although the second peak was truncated because of the next stimulus and therefore underestimated.
Figure 7.
Partial locking during the high-frequency train. a, Histogram of the ratio of the firing rate during the inhibition separating the peaks to the maximal firing rate during the first excitation. b, Histogram of the ratio of the maximal firing rates during the first and second excitations. c, Scatter plot of the width of the first peak at half height versus the width of the second peak at half height.
Neural activity after trains of high-frequency stimuli
In addition to the drastic change in firing rates and patterns during the stimulus trains, a second major effect was observed during the interval between stimulus trains (t = 500 msec). Most of the recorded neurons (15 of 17; 88%) responded with changes in the firing rate lasting 100-300 msec, whereas only two neurons (12%) did not modulate their firing rate significantly. The response was made up of slow phases of inhibition and excitation (Fig. 8). The modulation included a phase of complete inhibition in some of the recorded neurons (3 of 17; 18%). Typically (seven of eight), neuron pairs recorded simultaneously displayed a similar response pattern after the stimulus train even when their response during the stimulus train differed (Fig. 8e,f). The firing of cells recorded simultaneously was similar after the train in both the polarity of modulation (inhibitory and/or excitatory changes in firing) and its temporal structure (the length of each modulation). However, the exact timing of the pattern seemed to be slightly different within the pairs. The magnitude of modulation also differed, with some cells exhibiting substantial modulation and others showing less modulation (Fig. 8a,c,e).
Figure 8.
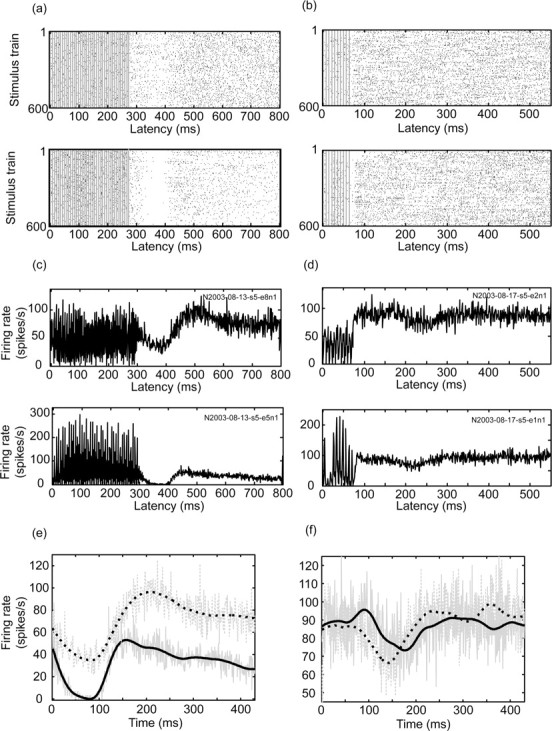
Long-term changes in activity after high-frequency stimulus trains. The long-term responses of two pairs of neurons; each pair was recorded simultaneously during the same stimulus. a, c, e, Biphasic stimulation (each phase, 0.2 msec/40 μA; 600 trains of 140 Hz; 40 stimuli per train; 500 msec intertrain interval). b, d, f, Biphasic stimulation (each phase, 0.2 msec/40 μ A; 600 trains of 140 Hz; 10 stimuli per train; 500 msec intertrain interval). a, b, Raster display of the firing of all train repetitions; the gray lines denote the stimuli. c, d, PSTH of the response to the stimulation trains. Both the raster display and the PSTH are aligned to the first stimulus within the train and are in 1 msec bins. The sequence indicates the number of the neuron with spikes that formed the basis of the figure. e, f, PSTH of the period after the train: the original PSTH of the two neurons in 1 msec bins (gray solid and dotted line) and after smoothing using least squares quadratic polynomial fitting of 100 msec (black solid and dotted line); the PSTH is aligned to 10 msec after the last stimulus in the train.
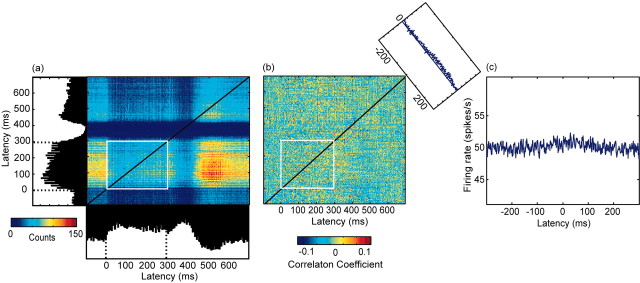
The dynamic changes in the correlations caused by the stimulus were examined using the joint peristimulus time histogram (JPSTH) (Aertsen et al., 1989). The raw JPSTH, displaying the spike count of the two neurons at different latencies, showed strong correlations that resulted from the rate changes of both neurons that were linked to the stimulation onset (Fig. 9a). The peaks and troughs in the JPSTH are not on the diagonal, which depicts equal latency of both neurons, thus demonstrating a nonzero latency between the activities of the two neurons (Fig. 8e). However, examination of the functional correlation requires the removal of the effect of the changes in the rate on the correlation. This can be done by a “shift prediction” process that consists of shuffling all the trials. The “shift predictor” that describes the mean response across trials can also be described by the multiplication of the two PSTH functions (Aertsen et al., 1989). This shifted, or expected, correlation can then be subtracted from the raw JPSTH. The result of the subtraction is divided by the product of the SDs of the PSTHs. This process generates the normalized JPSTH containing correlation coefficients with values between -1 and 1 in each bin. The normalization process revealed an uncorrelated spike-to-spike activity (Fig. 9b). Thus, within each trial, there were no correlations that were different from the one expected by the rates of the neurons. This uncorrelated activity was seen in almost all of the pairs (seven of eight) and was equal to their uncorrelated activity before the initiation of the stimulation, which was recorded for a period of at least 2 min before the initiation of the stimulation (Fig. 9c). Moreover, the only neurons that did not display uncorrelated activity were a pair that displayed oscillatory (∼10 Hz) correlations before the stimulation. In this pair, after the normalization process, the correlation remained oscillatory in the period after the stimulus train. However, during the stimulus train itself, the oscillatory correlations disappeared and were replaced by uncorrelated activity. Thus, although rate correlations are dominant both during and after the stimulation, spike-to-spike correlations are either unchanged (after the stimulation) or reduced (within the stimulation).
Figure 9.
Stimulation effect on correlations between simultaneously recorded neurons. The dynamic, stimulus-dependent nature of the correlation between a pair of neurons (same neurons as in Fig. 8a,c,e). a, JPSTH of the activity of the neurons aligned to the first stimulus in the train. The PSTHs of the two neurons are shown on the sides of the JPSTH. The stimulation train boundaries are marked by the white square in the JPSTH and by dotted lines in the PSTH. The figure is cyclic, because the interval between trains is 500 msec; thus, 100 msec before the first stimulus in the train follows 400 msec after the last stimulus in the train. b, Normalized JPSTH after subtraction of the PSTH product. The sum of the central diagonals (the averaged cross-correlation function during the stimulation period) is shown at the right tip of the normalized JPSTH. The bin size in a and b is 5 msec. c, Cross-correlation between the neurons before the initiation of the stimulation (period of 2 min). The cross-correlation is shown in 1 msec bins after a 5 msec moving average smoothing.
Discussion
Our simultaneous microstimulations and recordings in the GP of the MPTP-treated primate produced four major results. (1) Low-frequency stimulation leads to a stereotypic triphasic response in more than half of the recorded neurons. (2) High-frequency stimulation leads to double-peaked locking of the neuronal firing to the stimulus in most of the recorded neurons. (3) High-frequency stimulation has mixed effects on the firing rate. Most of the neurons decrease their mean firing rate, whereas others increase their rate. Moreover, the response of a neuron may evolve during the stimulus train from inhibition to excitation and vice versa. (4) High-frequency short trains were followed by prolonged changes in the firing of GP neurons. Rate modulations with the same phases and timescales were viewed in simultaneously recorded neurons without significant spike-to-spike correlations.
Our low-frequency stimulation results depict a three-phase response that paints a very different picture from the inhibitory response in low-frequency intra-operative microstimulation studies of the GPi (Dostrovsky et al., 2000; Wu et al., 2001) and the STN (Filali et al., 2004) of human PD patients and in rodent substantia nigra pars reticulata recording during STN stimulation (Maurice et al., 2003). However, the short-term activity could have been masked by the stimulus artifact and was reported in a few cells in one of these studies and interpreted as reflecting the ongoing activity of the neurons (Dostrovsky et al., 2000). Our short- and mid-term responses resemble the GP responses seen after low-frequency microstimulation (Nambu et al., 2000) and macrostimulation (Hashimoto et al., 2003) in the STN of primates. The long-term excitation is probably visible in our study but not in previous studies because of the large number of repetitions, which is not possible with human patients. Therefore, the three-phase response may be a more elaborate description of the inhibitory phenomenon seen in human patients (Dostrovsky et al., 2000).
Our HFS results seem to be in line with the recordings made in the primate GP during STN macrostimulation (Hashimoto et al., 2003), which presented a double excitation response with similar latencies. However, the STN stimulation study shows an increased mean firing rate in the vast majority of GP neurons, whereas our studies show a majority of neurons that reduce their firing rate. This difference in the response rate between STN and GP stimulation may also arise from the different ratios of excitatory and inhibitory afferents to the two nuclei and the differences in lateral connectivity within the nuclei (Filali et al., 2004). Time-locked responses to high-frequency but not to low-frequency STN stimulation have also been shown in STN slices (Garcia et al., 2003).
Long-term effects of HFS are crucial for enabling better stimulation patterns, which might improve the constant HFS used today. Long-term effects of HFS were seen in the STN after stimulation in the same nucleus (Filali et al., 2004) and were made up of alternating inhibition and excitation over a period of hundreds of milliseconds. Decaying oscillatory responses on approximately the same timescale were also seen in response to striatal stimulation in the MPTP primate (Tremblay et al., 1989). However, other experiments performed on humans (Dostrovsky and Lozano, 2002), rodents (Benazzouz et al., 2000), and slices (Beurrier et al., 2001) have shown prolonged inhibition after a long train of high-frequency stimuli. Previous experiments have not dealt with repetitive trains, making it more difficult to detect changes in the firing patterns that were not as drastic as complete inhibition.
Sources of inconsistency in DBS studies
The GP is composed of two segments: the GPi and the GPe. In our study, no distinction was made between GPi and GPe neurons, mainly because of the vertical trajectory, which did not allow for reliable differentiation of the two segments. The fact that our stimulating electrode and recording electrodes could be in either the GPe or GPi may have led to results that are different from the human GPi results (Dostrovsky et al., 2000; Wu et al., 2001). Indeed, HFS has yielded different clinical results depending on the location of the stimulating contact within the GP (Bejjani et al., 1997; Yelnik et al., 2000). In addition, HFS in the STN of rodents shows inverted effects on firing in the rodent equivalents of the primate GPe and GPi (Benazzouz et al., 1995). Thus, we cannot rule out the possibility that the mixture of excitatory and inhibitory responses observed in this and other studies may be linked to the exact location of the stimulating and recording electrodes.
DBS studies that use recording within the stimulated nucleus make it possible to study the stimulation effect on local neurons. On the other hand, recording outside the stimulated nucleus provides data on the activation of the efferent axons, which may differ from the activity of their parent neurons (McIntyre et al., 2003). Previous results (Anderson et al., 2003; Hashimoto et al., 2003; Filali et al., 2004) were believed to reflect such differential effects, suggesting that although HFS excites the efferent axons (and thereby their targets), it actually inhibits the neurons in the stimulated nucleus. In contrast, our results, which demonstrate that HFS can activate the neurons, hint that the effect on the stimulated nucleus and its targets may not be different.
In addition, the different volumes of stimulation may explain some of the differences in the results reported in microstimulation and macrostimulation studies, leading to a higher percentage of locked responses and yielding higher average rates (Hashimoto et al., 2003). However, other studies have shown that stimulation using microelectrodes and macroelectrodes produces the same results (Filali et al., 2004).
DBS mechanism
Our results are not consistent with the notion that HFS in the globus pallidus acts via the same mechanism as pallidotomy, i.e., complete cessation of pallidal firing. The discharge rate after our stimulation did not follow a single route: some neurons elevated their rates, others did not change significantly, and still others were completely or partially inhibited. However, all of them lost their basic firing pattern and switched to a predicted, orderly discharge that was locked to the stimulus and did not resemble their inherent, prestimulation firing pattern. This change in firing pattern leads to jamming of the abnormal firing typical to PD (Miller and DeLong, 1987; Filion and Tremblay, 1991; Raz et al., 2000) and thus to the elimination of the “wrong” information encoded by the basal ganglia during PD (Bar-Gad et al., 2003; Benabid, 2003).
Our results strongly suggest that stimulation leads to a perturbation in the basal ganglia-cortical loop on multiple timescales. During the stimulation, the perturbation is on a short (milliseconds) timescale, probably because of internal basal ganglia connectivity such as the excitatory STN-GP connectivity (Plenz and Kitai, 1999; Nambu et al., 2000), the inhibitory striatal inputs (Tremblay and Filion, 1989), and internal GP connections (Yelnik et al., 1997; Sato et al., 2000). The short (a few milliseconds) delay and jitter of this response indicate that it is caused by a (probably monosynaptic) synaptic response. The synaptic rather than direct response assumption is also consistent with the distance of the stimulating and recording electrodes in our setup, which is larger than the effective current spread (Ranck, 1975). Thus, the excitation may be facilitated by the activation of the afferent STN axons (Nambu et al., 2000) and the inhibition by the afferent striatal and GPe axons and GP collaterals. Alternatively, the response could be part of a simpler mechanism, because the activation of the inhibitory input to the GP neurons may lead to their resetting and the creation of a multiphasic synchronized response (Kita, 2001). An additional direct response to the stimulation cannot be ruled out because it may be hidden by the dead time of our recording. This direct response may lead to a resetting of the activity because of the imposed refractory period and the synchronization of the initial (short term) response to both the low- and high-frequency stimulation.
After the stimulation train, the system enters a state of network-level changes in the firing rate, which are evident from the rate correlation of neurons recorded simultaneously. These changes follow long (tens to hundreds of milliseconds) timescales and therefore probably stem from the perturbation of the corticobasal ganglia loop rather than simple synaptic activation. This trend toward oscillation on a longer time frame may be a unique characteristic of the dopamine-depleted state. Previous studies have revealed that long-term changes in the GP were much larger and more frequent after striatal stimulation in MPTP-treated monkeys than in the control animals and were abolished or decreased by apomorphine (Tremblay and Filion, 1989; Tremblay et al., 1989).
Today, despite its overwhelming therapeutic success, DBS for treating PD has remained an enigma. Successful treatment and the choice of stimulation parameters such as frequency, amplitude, and the exact location are still a matter of trial and error, and even the optimal target remains a matter of debate (Vitek, 2002). Only in-depth understanding, which is based on solid theoretical and functional foundations, of the mechanism underlying the effect of DBS would enable us to provide better DBS methods and improve treatment efficacy.
Footnotes
This study was supported in part by a Center of Excellence grant administered by the Israel Science Foundation, the German-Israel Binational Foundation, and the German-Israeli cooperation in the neurosciences administrated by the Israel Ministry of Science and Technology and the Federal Ministry of Education and Research. We thank Drs. J. Vitek, R. Turner, and A. Engel for their useful comments and Dr. Y. Ritov for his helpful suggestions regarding analysis methods.
Correspondence should be addressed to Izhar Bar-Gad, Department of Physiology, Hadassah Medical School, The Hebrew University, P.O. Box 12272, Jerusalem 91120, Israel. E-mail: izharb@alice.nc.huji.ac.il.
Copyright © 2004 Society for Neuroscience 0270-6474/04/249410-10$15.00/0
References
- Abeles M, Goldstein MHJ (1977) Multispike train analysis. IEEE Trans Biomed Eng 65: 762-773. [Google Scholar]
- Aertsen AM, Gerstein GL, Habib MK, Palm G (1989) Dynamics of neuronal firing correlation: modulation of “effective connectivity.” J Neurophysiol 61: 900-917. [DOI] [PubMed] [Google Scholar]
- Anderson ME, Postupna N, Ruffo M (2003) Effects of high-frequency stimulation in the internal globus pallidus on the activity of thalamic neurons in the awake monkey. J Neurophysiol 89: 1150-1160. [DOI] [PubMed] [Google Scholar]
- Ashby P, Strafella A, Dostrovsky JO, Lozano A, Lang AE (1998) Immediate motor effects of stimulation through electrodes implanted in the human globus pallidus. Stereotact Funct Neurosurg 70: 1-18. [DOI] [PubMed] [Google Scholar]
- Bar-Gad I, Morris G, Bergman H (2003) Information processing, dimensionality reduction and reinforcement learning in the basal ganglia. Prog Neurobiol 71: 439-473. [DOI] [PubMed] [Google Scholar]
- Bejjani B, Damier P, Arnulf I, Bonnet AM, Vidailhet M, Dormont D, Pidoux B, Cornu P, Marsault C, Agid Y (1997) Pallidal stimulation for Parkinson's disease. Two targets? Neurology 49: 1564-1569. [DOI] [PubMed] [Google Scholar]
- Benabid AL (2003) Deep brain stimulation for Parkinson's disease. Curr Opin Neurobiol 13: 696-706. [DOI] [PubMed] [Google Scholar]
- Benazzouz A, Piallat B, Pollak P, Benabid AL (1995) Responses of substantia nigra pars reticulata and globus pallidus complex to high frequency stimulation of the subthalamic nucleus in rats: electrophysiological data. Neurosci Lett 189: 77-80. [DOI] [PubMed] [Google Scholar]
- Benazzouz A, Gao DM, Ni ZG, Piallat B, Bouali-Benazzouz R, Benabid AL (2000) Effect of high-frequency stimulation of the subthalamic nucleus on the neuronal activities of the substantia nigra pars reticulata and ventrolateral nucleus of the thalamus in the rat. Neuroscience 99: 289-295. [DOI] [PubMed] [Google Scholar]
- Beurrier C, Bioulac B, Audin J, Hammond C (2001) High-frequency stimulation produces a transient blockade of voltage-gated currents in subthalamic neurons. J Neurophysiol 85: 1351-1356. [DOI] [PubMed] [Google Scholar]
- Boraud T, Bezard E, Bioulac B, Gross C (1996) High frequency stimulation of the internal globus pallidus (GPi) simultaneously improves parkinsonian symptoms and reduces the firing frequency of GPi neurons in the MPTP-treated monkey. Neurosci Lett 215: 17-20. [DOI] [PubMed] [Google Scholar]
- Ceballos-Baumann AO, Boecker H, Bartenstein P, von Falkenhayn I, Riescher H, Conrad B, Moringlane JR, Alesch F (1999) A positron emission tomographic study of subthalamic nucleus stimulation in Parkinson disease: enhanced movement-related activity of motor-association cortex and decreased motor cortex resting activity. Arch Neurol 56: 997-1003. [DOI] [PubMed] [Google Scholar]
- Dostrovsky JO, Lozano AM (2002) Mechanisms of deep brain stimulation. Mov Disord [Suppl 17] 3: S63-S68. [DOI] [PubMed] [Google Scholar]
- Dostrovsky JO, Levy R, Wu JP, Hutchison WD, Tasker RR, Lozano AM (2000) Microstimulation-induced inhibition of neuronal firing in human globus pallidus. J Neurophysiol 84: 570-574. [DOI] [PubMed] [Google Scholar]
- Filali M, Hutchison WD, Palter VN, Lozano AM, Dostrovsky JO (2004) Stimulation-induced inhibition of neuronal firing in human subthalamic nucleus. Exp Brain Res 156: 274-281. [DOI] [PubMed] [Google Scholar]
- Filion M, Tremblay L (1991) Abnormal spontaneous activity of globus pallidus neurons in monkeys with MPTP-induced parkinsonism. Brain Res 547: 142-151. [PubMed] [Google Scholar]
- Garcia L, Audin J, D'Alessandro G, Bioulac B, Hammond C (2003) Dual effect of high-frequency stimulation on subthalamic neuron activity. J Neurosci 23: 8743-8751. [DOI] [PMC free article] [PubMed] [Google Scholar]
- Gildenberg PL (2003) History repeats itself. Stereotact Funct Neurosurg 80: 61-75. [DOI] [PubMed] [Google Scholar]
- Hashimoto T, Elder CM, Vitek JL (2002) A template subtraction method for stimulus artifact removal in high-frequency deep brain stimulation. J Neurosci Methods 113: 181-186. [DOI] [PubMed] [Google Scholar]
- Hashimoto T, Elder CM, Okun MS, Patrick SK, Vitek JL (2003) Stimulation of the subthalamic nucleus changes the firing pattern of pallidal neurons. J Neurosci 23: 1916-1923. [DOI] [PMC free article] [PubMed] [Google Scholar]
- Jech R, Urgosik D, Tintera J, Nebuzelsky A, Krasensky J, Liscak R, Roth J, Ruzicka E (2001) Functional magnetic resonance imaging during deep brain stimulation: a pilot study in four patients with Parkinson's disease. Mov Disord 16: 1126-1132. [DOI] [PubMed] [Google Scholar]
- Kita H (2001) Neostriatal and globus pallidus stimulation induced inhibitory postsynaptic potentials in entopeduncular neurons in rat brain slice preparations. Neuroscience 105: 871-879. [DOI] [PubMed] [Google Scholar]
- Kurlan R, Kim MH, Gash DM (1991) Oral levodopa dose-response study in MPTP-induced hemiparkinsonian monkeys: assessment with a new rating scale for monkey parkinsonism. Mov Disord 6: 111-118. [DOI] [PubMed] [Google Scholar]
- Magarinos-Ascone C, Pazo JH, Macadar O, Buno W (2002) High-frequency stimulation of the subthalamic nucleus silences subthalamic neurons: a possible cellular mechanism in Parkinson's disease. Neuroscience 115: 1109-1117. [DOI] [PubMed] [Google Scholar]
- Martin RF, Bowden DM (2000) Primate brain maps: structure of the macaque brain. Amsterdam: Elsevier Science.
- Maurice N, Thierry AM, Glowinski J, Deniau JM (2003) Spontaneous and evoked activity of substantia nigra pars reticulata neurons during high-frequency stimulation of the subthalamic nucleus. J Neurosci 23: 9929-9936. [DOI] [PMC free article] [PubMed] [Google Scholar]
- McIntyre CC, Grill WM, Sherman DL, Thakor NV (2003) Cellular effects of deep brain stimulation: model-based analysis of activation and inhibition. J Neurophysiol 91: 1457-1469. [DOI] [PubMed] [Google Scholar]
- Miller WC, DeLong MR (1987) Altered tonic activity of neurons in the globus pallidus and subthalamic nucleus in the primate MPTP model of parkinsonism. In: The basal ganglia II (Carpenter MB, Jayaraman A, eds), pp 415-427. New York: Plenum.
- Nambu A, Tokuno H, Hamada I, Kita H, Imanishi M, Akazawa T, Ikeuchi Y, Hasegawa N (2000) Excitatory cortical inputs to pallidal neurons via the subthalamic nucleus in the monkey. J Neurophysiol 84: 289-300. [DOI] [PubMed] [Google Scholar]
- Plenz D, Kitai ST (1999) A basal ganglia pacemaker formed by the subthalamic nucleus and external globus pallidus. Nature 400: 677-682. [DOI] [PubMed] [Google Scholar]
- Ranck Jr JB (1975) Which elements are excited in electrical stimulation of mammalian central nervous system: a review. Brain Res 98: 417-440. [DOI] [PubMed] [Google Scholar]
- Raz A, Vaadia E, Bergman H (2000) Firing patterns and correlations of spontaneous discharge of pallidal neurons in the normal and the tremulous 1-methyl-4-phenyl-1,2,3,6-tetrahydropyridine vervet model of parkinsonism. J Neurosci 20: 8559-8571. [DOI] [PMC free article] [PubMed] [Google Scholar]
- Sato F, Lavallee P, Levesque M, Parent A (2000) Single-axon tracing study of neurons of the external segment of the globus pallidus in primate. J Comp Neurol 417: 17-31. [PubMed] [Google Scholar]
- Schiff SJ, Dunagan BK, Worth RM (2002) Failure of single-unit neuronal activity to differentiate globus pallidus internus and externus in Parkinson disease. J Neurosurg 97: 119-128. [DOI] [PubMed] [Google Scholar]
- Tai CH, Boraud T, Bezard E, Bioulac B, Gross C, Benazzouz A (2003) Electrophysiological and metabolic evidence that high-frequency stimulation of the subthalamic nucleus bridles neuronal activity in the subthalamic nucleus and the substantia nigra reticulata. FASEB J 17: 1820-1830. [DOI] [PubMed] [Google Scholar]
- Tremblay L, Filion M (1989) Responses of pallidal neurons to striatal stimulation in intact waking monkeys. Brain Res 498: 1-16. [DOI] [PubMed] [Google Scholar]
- Tremblay L, Filion M, Bedard PJ (1989) Responses of pallidal neurons to striatal stimulation in monkeys with MPTP-induced parkinsonism. Brain Res 498: 17-33. [DOI] [PubMed] [Google Scholar]
- Vitek JL (2002) Deep brain stimulation for Parkinson's disease. A critical re-evaluation of STN versus GPi DBS. Stereotact Funct Neurosurg 78: 119-131. [DOI] [PubMed] [Google Scholar]
- Wichmann T (2000) A digital averaging method for removal of stimulus artifacts in neurophysiologic experiments. J Neurosci Methods 98: 57-62. [DOI] [PubMed] [Google Scholar]
- Windels F, Bruet N, Poupard A, Urbain N, Chouvet G, Feuerstein C, Savasta M (2000) Effects of high frequency stimulation of subthalamic nucleus on extracellular glutamate and GABA in substantia nigra and globus pallidus in the normal rat. Eur J Neurosci 12: 4141-4146. [DOI] [PubMed] [Google Scholar]
- Wu YR, Levy R, Ashby P, Tasker RR, Dostrovsky JO (2001) Does stimulation of the GPi control dyskinesia by activating inhibitory axons? Mov Disord 16: 208-216. [DOI] [PubMed] [Google Scholar]
- Yelnik J (2002) Functional anatomy of the basal ganglia. Mov Disord [Suppl 17] 3: S15-S21. [DOI] [PubMed] [Google Scholar]
- Yelnik J, Francois C, Tand D (1997) Etude tridimensionnelle des collaterales initiales des neurones du pallidum interne chez le macaque. Abstract presented at Third Congress of European Neuroscience Society, Bordeaux, France.
- Yelnik J, Damier P, Bejjani BP, Francois C, Gervais D, Dormont D, Arnulf I, Bonnet M, Cornu P, Pidoux B, Agid Y (2000) Functional mapping of the human globus pallidus: contrasting effect of stimulation in the internal and external pallidum in Parkinson's disease. Neuroscience 101: 77-87. [DOI] [PubMed] [Google Scholar]


