

Abstract
Synaptic interactions between the dendrites of mitral/tufted (MT) and granule cells (GCs) in the olfactory bulb are important for the determination of spatiotemporal firing patterns of MTs, which form an odor representation passed to higher brain centers. These synapses are subject to modulation from several sources originating both within and outside the bulb. We show that dopamine, presumably released by TH-positive local interneurons, reduces synaptic transmission from MTs to GCs. MT neurons express D2-like receptors (D2Rs), and both dopamine and the D2 agonist quinpirole decrease EPSC amplitude at the MT→ GC synapse. D2R activation also increases paired pulse facilitation and decreases the frequency of action potential-independent spontaneous miniature EPSCs in GCs, consistent with an effect on MT glutamate release downstream from Ca2+ influx. Analysis of spike-evoked Ca2+ transients in MT lateral dendrites additionally shows that quinpirole reduces Ca2+ influx preferentially at distal locations, possibly by reducing dendritic excitability via increased transient K+ channel availability. When the OB is activated physiologically by using odor stimuli, blocking D2Rs increases the power of GABAA-dependent oscillations in the local field potential. This demonstrates a functional role for the dopaminergic circuit during normal odor-evoked responses and for the modulation of dendritic release and excitability in neuronal circuit function. Regulation of spike invasion of lateral dendrites by transient K+ currents also may provide a mechanism for local outputs of MTs to be controlled dynamically via other neuromodulators or by postsynaptic potentials.
Keywords: reciprocal synapse, mitral cell, lateral dendrite, feedback inhibition, D2, Rana pipiens
Introduction
The olfactory bulb (OB) is responsible for the initial representation of odor information in the CNS. It receives inputs from populations of olfactory receptor neurons (ORNs), which are translated into distributed output patterns encoded in the firing of mitral/tufted cells (MTs). Although MT sensory inputs initially are determined by the topography of axonal projections of different receptor subtypes onto the glomerular layer (Buck, 2000), olfactory processing also relies on local inhibitory circuits. Mammalian periglomerular neurons, which release GABA and dopamine, attenuate inputs from ORN terminals (Wachowiak and Cohen, 1999; Aroniadou-Anderjaska et al., 2000; Palouzier-Paulignan et al., 2002). GABAA-dependent inhibition from granule cells (GCs) onto MTs also may play an important role in determining MT outputs. IPSPs and suppression of spiking are prominent features of MT responses to electrical and odor stimulation (Nowycky et al., 1981; Hamilton and Kauer, 1989), and localized GABAA blockade decreases MT tuning specificity (Yokoi et al., 1995). Lateral inhibition is proposed to enhance contrast within odor-evoked global activity patterns (Sachse and Galizia, 2002), and electrophysiology and imaging studies suggest that activated glomeruli produce an inhibitory surround (Luo and Katz, 2001; Aungst et al., 2003). Behaviorally, blocking GABAA-dependent feedback in the honeybee antennal lobe produces deficits in odor discrimination (Stopfer et al., 1997). Changes in GC feedback also are linked to plasticity and learning. Noradrenaline released from locus coeruleus projections decreases feedback inhibition onto MTs (Jahr and Nicoll, 1982; Trombley, 1992; Czesnik et al., 2003), an effect believed to be important for long-term changes in both the main and accessory OB (Wilson and Sullivan, 1991; Kaba et al., 1994; Sullivan et al., 2000; Rumsey et al., 2001).
Determining how GC feedback inhibition affects the flow of information through the OB is important for understanding olfactory processing. An unusual feature of GCs is that they receive the majority of their synaptic input from dendritic rather than axonal release sites. Although dendritic glutamate release from MTs normally is supported by robust action potential invasion of their lateral dendrites, backpropagation can be modulated or eliminated by factors such as local inhibition (Lowe, 2002; Xiong and Chen, 2002). Christie and Westbrook (2003) found that A-type K+ channels attenuate action potential amplitude in MT lateral dendrites as in other neuronal types (Hoffman et al., 1997). This may allow spike amplitude to be regulated dynamically by changes in membrane potential (Migliore et al., 1999; Watanabe et al., 2002) or by neuromodulators (Tsubokawa and Ross, 1997; Hoffman and Johnston, 1999). Here we find that dopamine (DA), presumably released by tyrosine hydroxylase-positive local interneurons that project within the mitral and plexiform layers in the frog (Boyd and Delaney, 2002), reduces GABAA-dependent inhibition in the OB. DA decreases excitation of GCs via presynaptic effects on MTs, including direct inhibition of the release apparatus and reduced Ca2+ influx at distal sites on lateral dendrites that may result from decreased spike backpropagation. Pharmacological manipulation of dopamine D2 receptor activity also alters odor-evoked population responses, suggesting that local dopaminergic modulation normally contributes to ongoing odor processing.
Materials and Methods
Animals. Experiments were performed on olfactory bulbs from adult male Rana pipiens between 2 and 3.5 inches in length, obtained from Charles D. Sullivan (Nashville, TN). Frogs were maintained in a cooled environment on a 12 hr light/dark cycle and fed with flies or crickets. Frogs were kept at room temperature for 1 week before experiments. Animals were maintained and killed in accordance with standards set by the Canadian Council on Animal Care and the Simon Fraser University Animal Care Committee.
Histology and immunohistochemistry. Frogs were anesthetized by immersion in 0.2% MS222 and perfused with saline, followed by 4% paraformaldehyde in PBS. Brains were immersion-fixed in the same fixative overnight; then they were embedded in 10% agarose and sectioned horizontally at 100 μm with a vibrating microtome. Sections were incubated for ∼48 hr in primary antibody solution containing 100 mm PBS, 1% w/v Triton X-100, 1% normal goat serum (Vector Laboratories, Burlingame, CA), and rabbit anti-α-D2 receptor primary antibody (Ab; Chemicon, Temecula, CA) at dilutions of 1:250, 1:500, or 1:1000 at 4°C. Sections then were rinsed three times in PBS and incubated for 2 hr in biotinylated goat anti-rabbit Ab (1:200; room temperature). Slices again were rinsed three times in PBS, incubated overnight in standard ABC solution (Vector Laboratories), rinsed three times in TBS, and developed by using a standard DAB reaction procedure (reaction solution, 17 ml of TBS, 0.91 ml of 1 m imidazole, 5 mg of diaminobenzidine, 0.18 gm of nickel ammonium sulfate, and 70 μl of 0.1% H2O2) (Tago et al., 1986).
For some slices, a double-labeling procedure was used in which MT axons were backfilled with biocytin through localized injections to the lateral olfactory tract. These cells were developed with standard ABC methods as above, resulting in a brown reaction product. In these experiments, gold-conjugated 2° antibodies (1:200; Jackson ImmunoResearch, West Grove, PA) were used in place of a biotinylated label for separation of the receptor and backlabeling signals. The gold-conjugated Abs were developed by using a silver intensification procedure (IntenSe LE; Amersham Biosciences, Piscataway, NJ). Bright-field images of immunostained sections were taken on a Nikon Optiphot microscope with a Nikon Coolpix 995 digital camera or on an Olympus BX40 microscope with a Roper Scientific, Photometrics CoolSnap digital camera (Tucson, AZ). To measure optical density, we compared raw images with no saturated pixels with images of a series of neutral density filters of known transmittance captured with the same camera settings. A custom procedure in IgorPro (WaveMetrics; Lake Oswego, OR) was used to calculate average optical density in regions of interest drawn around the cell bodies of every backfilled cell (306 in total) in images collected at 40× magnification.
Electrophysiological recording. Local field potential and whole-cell patch recordings were made from a frog OB preparation (Delaney and Hall, 1996). Frogs were cryoanesthetized to full torpor by slow cooling to ice-bath temperature and were decapitated. The nose, olfactory epithelium, and OBs were dissected away, attached by the olfactory nerves. The two OB hemispheres were separated longitudinally with a razor blade, giving more ready access of patch pipettes to neuronal somata. Tissue was maintained at 19-22°C by perfusion with ACSF containing (in mm) 72 NaCl, 2 KCl, 26 NaHCO3, 1.6 NaH2PO4, 1.5 MgSO4, 2 CaCl2, and 10 glucose, continuously bubbled with 95% O2/5% CO2. For experiments with odor stimulation, the nose was maintained in a separate, dry chamber, isolated from the OB by a layer of petroleum jelly around the olfactory nerves. For other experiments, the olfactory nerves were cut at their point of entry through the cribriform plate.
Odor-evoked responses were elicited by injection of a small puff of saturated vapor from one of three different odorants (n-butanol, limonene, or methyl salicylate; Sigma, St. Louis, MO) into a steady stream of filtered, moisturized air directed onto the olfactory epithelium through the internal nares. Final dilutions at the sensory epithelium were brief pulses (30-150 msec) estimated to be 0.5-3% of saturated vapor, adjusted so that sensory-evoked responses were 25-40% of maximal size. Electrical stimulation was accomplished by using a twisted pair of 0.125 μm enamel-coated silver wires placed on the olfactory nerve and lateral olfactory tract. Local field potentials were recorded by using low-resistance (2-4 MΩ) glass micropipettes containing artificial CSF (ACSF) solution inserted to a depth of 250-500 μm into the OB and bandpass-filtered between 0.3 Hz and 1 kHz. Because the frog OB is not highly laminated, the local field potential (LFP) is relatively stereotyped over this depth. Odor-evoked LFP oscillations used to calculate power spectra additionally were filtered digitally between 1 and 40 Hz. Whole-cell recordings were made with either an Axopatch 200B (Axon Instruments, Union City, CA) or a PC-505 amplifier (Warner Instruments, Hamden, CT), using pipettes with resistances of 4-12 MΩ. Internal solutions for current clamp contained (in mm) 85 K-gluconate, 4 KCl, 4 NaCl, 5 d-glucose, 5 HEPES, 2 MgCl2, 0.5 glutathione, 1 Na-ATP, 0.3 Na-GTP, and 1 EGTA. Voltage-clamp solutions contained (in mm) 78 CsMeSO4, 2.5 QX-314, 7 TEA, 5 d-glucose, 5 HEPES, 2 MgCl2, 2 Na-ATP, 1 EGTA, 0.5 glutathione, and 0.3 Na-GTP. Most internal solutions contained 0.2% biocytin for cell identification after recording. Voltage-clamp data were low-pass-filtered at 5 or 2 kHz, and traces were digitized at 10 or 3.3 kHz on a PC, using pClamp 7.0 (Axon Instruments), or on a Macintosh, using Superscope II software (GW Instruments, Somerville, MA).
Imaging. For recording dendritic Ca2+ transients, we recorded MT cells in current-clamp mode, filled with 250 μm fluo-4 included in the patch pipette. Action potentials were evoked by short current injections (8-30 msec, 0.4-3.0 nA), and transients were measured in lateral dendrites at different distances from the soma via line scans. Two-photon scanning was performed by using a modified confocal scan head equipped with a non-descanned detector (Bio-Rad MRC600, Coherent Verdi 5W Ar pump laser, and Mira 900 Ti-Sapphire pulsed laser) and a custom-built system (Coherent Verdi 10 W and Mira 900, IGOR-based drivers and acquisition, and Cambridge Technologies galvanometers). Four to eight scans were averaged for each distance and drug treatment for comparison. Cellular morphology was reconstructed from a z-series of images obtained after completion of electrophysiological recordings to determine the distance of the optical recording site from the soma.
To test for D2-mediated effects on olfactory nerve inputs, we labeled receptor terminals via the olfactory nerve, using suction electrodes filled with either calcium green-1 dextran (3000 MW) or fluo-4 dextran (10,000 MW) at 5-10% w/v in a 0.1% Triton X-100 solution in dH2O. Ca2+ transients evoked by nerve stimulation were recorded with a photomultiplier tube (PMT; H5873, Hamamatsu, Bridgewater, NJ) attached to a custom-built wide-field epifluorescence microscope, with the excitation illumination aperture limited to illuminate ∼5-20 filled glomeruli.
Results
MT neurons express D2-like receptors
Autoradiography has shown that D2-like receptors (D2Rs) in frog are localized mainly in the MT layer and, unlike in mammals, generally are absent from the glomerular layer (Duchamp-Viret et al., 1997). We found that a polyclonal antibody against D2Rs labeled many neurons in the frog OB, with staining concentrated in the MT layer (Fig. 1A, low-power view of a horizontal OB section). Figure 1B shows a higher-magnification view confirming that labeled cells possess an MT-like morphology, with arrows indicating cells with clearly stained dendrites as well as somata within the plane of section. None of the stained processes was seen to possess spines, arguing that D2Rs are not expressed in the processes of granule cells. To confirm that the labeled neurons were in fact MTs, we made biocytin injections into the lateral olfactory tract, resulting in the backfilling of a large number of these cells. In regions of the bulb in which MT labeling was most complete, all D2-positive cells were backfilled, confirming that the cells that express D2 receptors are MTs (Fig. 1C). Only approximately two-thirds of the backfilled cells were D2-positive, however, suggesting heterogeneity in D2R expression (Fig. 1D, arrows and arrowheads indicate D2-positive and D2-negative cells, respectively). No obvious pattern was apparent with regard to the location of D2-positive or D2-negative MTs; the two classes of cells intermingled both tangentially and radially. Although D2-positive and D2-negative cells easily could be distinguished visually, densitometric analysis of backfilled MTs in the double-labeled tissue was used to look for subclasses of MTs with different levels of D2 staining. A histogram of optical density (Fig. 1E) was well fit by a sum of two Gaussians, consistent with the presence of only two classes of MTs, D2-negative and D2-positive. Integration of the area under each of the two Gaussians contributing to the curve gave a proportion of 1:1.9 D2-negative to D2-positive MTs, in agreement with the value obtained by visual inspection.
Figure 1.
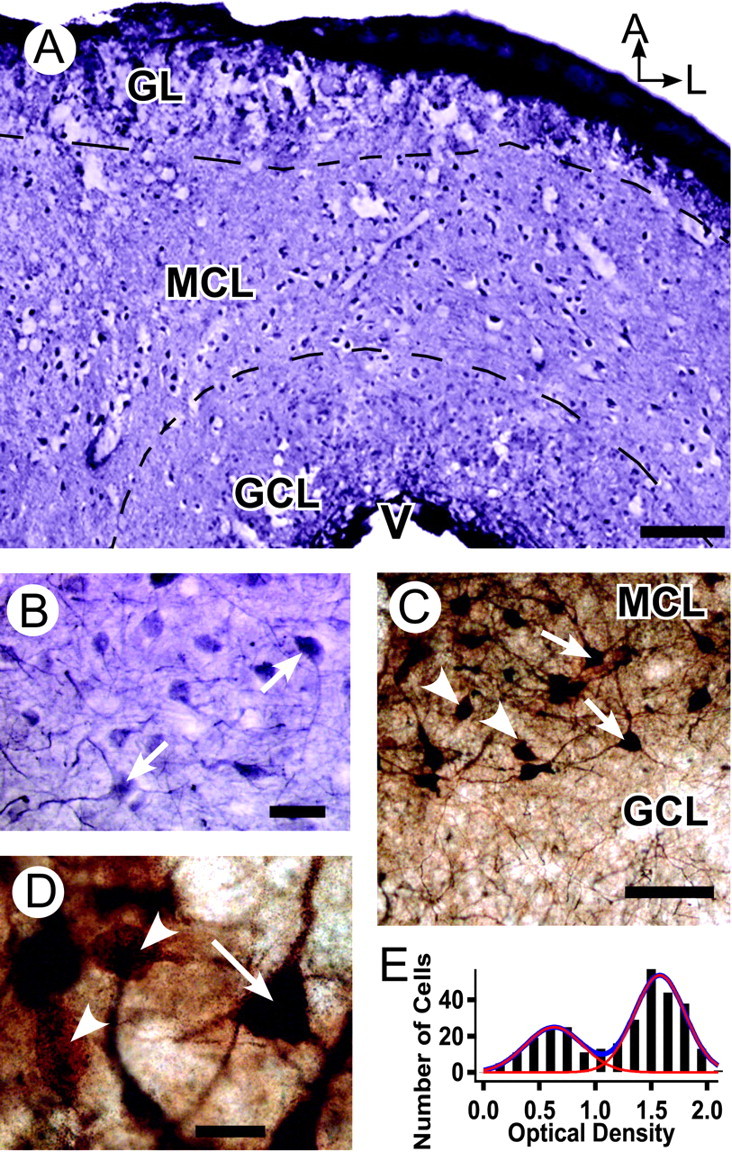
D2Rs are expressed on frog mitral neurons. A, Low-power view of a horizontal olfactory bulb section stained with an anti-D2R antibody and visualized with a nickel-enhanced peroxidase reaction. Labeled cells are visible primarily in the mitral cell layer, the borders of which are indicated by dashed lines. B, Higher-power view of mitral cell layer showing labeled cells and processes. Arrows mark cells showing well labeled dendrites in the plane of section. C, Double-labeling experiment. Backfilling of the lateral olfactory tract with biocytin resulted in labeling of the majority of MTs, which were visualized with immunoperoxidase, resulting in a brown reaction product. D2R immunoreactivity was visualized with a gold-conjugated secondary antibody and a silver intensification procedure, producing black staining. Although not all back filled cells stained for D2R (arrowheads), all D2R-positive cells were backfilled (arrows). The granule cell layer contains mitral cell dendrites stained by D2R immunostaining and/or backfilling, but no D2R-positive cell bodies. D, High-power view of backfilled mitral cells that are either D2R-positive (arrow) or D2R-negative (arrowheads). The black silver precipitate of D2R staining is very dense in the soma of D2R-positive cells, masking the brown immunoperoxidase reaction product of backfilled biocytin, but is less dense in the dendrites, allowing the brown reaction product to show and identify these cells as double-labeled. E, Histogram of calibrated optical density measurements from the somata of backlabeled cells, with two peaks corresponding to D2R-negative (left) and D2R-positive (right) neurons. Approximately 65% of neurons are D2R-positive, calculated by integration of the area under Gaussian fits to each distribution (red; blue line shows the sum of the two fits). A, Anterior; L, lateral; GL, glomerular layer; MCL, mitral cell layer; GCL, granule cell layer; V, ventricle. Scale bars: A, 100 μm; B, 25 μm; C, 50 μm; D (for D, E), 10 μm.
Dopamine and quinpirole inhibit lateral olfactory tract-evoked GC field EPSCs
The presence of D2Rs on frog MTs indicates that DA release is likely to have effects on the membrane properties or synaptic output of these cells. To explore this possibility, we used stimulation of the lateral olfactory tract (LOT) to activate the MT→ GC synapse monosynaptically, and we used LFPs measured from the plexiform/GC layers of the OB to monitor GC population activity. Action potentials in MTs, stimulated antidromically, produce glutamate release onto GCs and subsequent GABAA feedback onto MTs (Nowycky et al., 1981). This was reflected in field potential recordings from the OB, which exhibit an initial short-latency positive phase (P1) corresponding to antidromic spike generation in MTs (Fig. 2A), blocked by TTX, but not by ionotropic glutamate and GABA receptor antagonists. This is followed by a negative phase (N1) corresponding to the GC EPSC (blocked by a combination of DNQX, APV, and 7-Cl-kynurenate). The third, positive, component (P2) reflects GABAA feedback onto MTs and is sensitive to bicuculline. Pharmacological evaluation of the LFP components also was confirmed by cell-attached and whole-cell recordings from MTs and GCs, which showed the correspondence between spikes in each cell type with the evoked LFP components (data not shown).
Figure 2.

Dopamine and the D2 agonist quinpirole decrease GC population EPSCs in OB local field potentials. A, Pharmacological characterization of the field signal evoked by LOT stimulation (arrow). Feedback inhibition, generating the late positive component (P2), is blocked by bicuculline (gray). The negative GC EPSC component (N1) is blocked by CNQX, APV, and 7-Cl-kynurenate, leaving only a TTX-sensitive MT population spike (P1, dotted). B, Both dopamine and quinpirole produce a dose-dependent reduction in the GC EPSC, whereas the D1 agonist SKF38393 has no effect (black solid line, control; gray dashed line, increasing agonist concentration). C, Stable reduction in EPSC by dopamine (triangles) and quinpirole (circles) occurs quickly on agonist wash in and is reversed by the D2 antagonist sulpiride. Na-ascorbate (10 μm), added to prevent the oxidation of DA, has no effect. D, Concentration dependence of EPSC reduction; EC50 values are 10 μm for dopamine and 0.3 μm for quinpirole. E, Dopamine (50 μm) reduces the GC EPSC to 62 ± 20% of control (p < 0.02; n = 5), whereas 5 μm quinpirole produces a similar decrease to 59 ± 8% (p < 0.001; n = 6) that is reversed by sulpiride. SKF38393 (50 μm) has no significant effect (93 ± 15%; p > 0.2; n = 6). Bars in D and E show mean ± SE; *p < 0.05; **p < 0.005.
Bath application of DA to the OB caused a dose-dependent reduction in the amplitude of the LOT-evoked GC EPSC, with an EC50 value of 10 μm (Fig. 2B-E). Results from several preparations were equivalent whether measurements of EPSC peak amplitude or slope were used. Extracellular perfusion with 50 μm DA resulted in a decrease in the GC (N1) component to 62 ± 20% of control (p < 0.02; n = 5) that was reversible on washout or with additional application of the D2-like antagonist sulpiride (10 μm) (Fig. 2E). The D1-like agonist SKF38393 had no effect at concentrations up to 50 μm (Fig. 2B) (p > 0.2; n = 6). The D2-like agonist quinpirole mimicked the effect of DA on the GC EPSC, with an EC50 value of 0.3 μm (Fig. 2B-D) and at a concentration of 5 μm decreased the GC component to 59 ± 8% of control (Fig. 2E) (p < 0.001; n = 6), similar to the reduction seen with DA. This effect again was antagonized by sulpiride. Thus activation of D2Rs on MTs appears to have a strong effect on the strength of the MT→ GC synapse.
Quinpirole reduces whole-cell EPSCs in GCs
Whole-cell recordings were made from GCs to confirm this idea and test it in more detail. A combination of electrophysiological and anatomical criteria was used to distinguish between MT and GCs in blind recordings (Hall and Delaney, 2002). Initial electrode placement was guided by visualization of the laminar structure of the OB. Electrical stimulation of the LOT evoked distinct synaptic responses in both cell types. GC EPSCs reversed at ∼0 mV and were blocked by a combination of 10 μm DNQX and 100 μm APV/10 μm 7-Cl-kynurenate. MTs responded to LOT stimulation with a barrage of inhibitory postsynaptic currents that were bicuculline-sensitive, reversed at approximately -50 mV (predicted Cl- reversal, -47 mV), and lasted for several hundred milliseconds. IPSCs sometimes were preceded by short-latency (∼5-10 msec) antidromic spike currents. In current-clamp mode the GCs responded to prolonged current injection with accommodating spike trains, with membrane voltage eventually reaching a stable plateau, whereas MTs fired a continuous train of action potentials (APs), as previously described (Hall and Delaney, 2001). Cells were filled frequently with biocytin and processed for visualization to confirm previous electrophysiological identification. In Ca2+ imaging experiments the recordings were made under visual control, and morphology could be seen with fluorescence; thus cell type could be confirmed directly.
Voltage-clamp recordings from individual GCs confirmed that the decrease in GC field EPSC after quinpirole application is attributable to reduced synaptic excitation. Consistent with LFP measurements, the application of 5 μm quinpirole caused a significant reduction in the amplitude of evoked synaptic currents in GCs (to 65 ± 14% of control; n = 6; p < 0.01), which was antagonized by 10 μm sulpiride (Fig. 3A). The intracellularly recorded GC EPSC, like the field EPSC, was unaffected by the D1 agonist SKF38393 (data not shown).
Figure 3.

Whole-cell GC EPSCs also are reduced by D2 receptor activation. A, Quinpirole (5 μm) decreases LOT-evoked EPSCs in GCs, voltage-clamped at -70 mV, to 65 ± 14% of control (n = 6; p < 0.01; solid black line, control; gray dashed line, quinpirole; gray dotted line, sulpiride). B, Paired pulse facilitation (EPSC2/EPSC1) also is increased from 0.79 ± 0.15 to 1.27 ± 0.27 (p < 0.05; n = 5; top, control; middle, quinpirole; bottom, quinpirole plus sulpiride). C, Activity-independent spontaneous mEPSC frequency is lowered by quinpirole. Left (black), control; middle (gray), quinpirole; right (black), quinpirole plus sulpiride. A histogram of mEPSC size distribution (gray, control) shows that most events are excitatory, with few inhibitory events remaining after ionotropic glutamate receptor block (white). Minimum event size was set at 5 pA; bins on the left indicate current noise distribution after blockade of all synaptic events (inward events only). D, E, Cumulative frequency plots for mEPSC inter-event interval and amplitude in an individual GC show an effect on frequency (D), but not on size (E). Pooled average mEPSC frequency and amplitude across all cells (bars) show that the primary effect is on frequency (56 ± 6% of control; p < 0.05) rather than on amplitude (90 ± 10%; p > 0.05). Bars show mean ± SE; *p < 0.05.
Changes in paired pulse facilitation suggest that decreased EPSCs result from changes in MT glutamate release rather than decreased sensitivity of GCs. LOT shocks delivered at intervals of 125-200 msec, approximating the ∼8-12 Hz odor-evoked oscillation frequency in the frog OB, typically produced a slight decrease in the size of the second response. As well as reducing the amplitude of the first response, quinpirole increased the paired pulse ratio (EPSC2/EPSC1) from 0.79 ± 15 to 1.27 ± 0.27% (p < 0.05; n = 5) (Fig. 3B), consistent with decreased initial transmitter release but augmented facilitation in the presence of D2 activation.
The frequency of miniature EPSCs (mEPSCs) recorded from GCs in the presence of TTX (1 μm) also suggests that D2 activation results in a reduction of MT glutamate release. GCs, which in the intact OB receive inputs from a large number of MTs, still displayed frequent spontaneous excitatory synaptic inputs (∼3-30 Hz) (Fig. 3C) in TTX. Quinpirole (5 μm) consistently shifted the mEPSC frequency distribution toward longer interevent intervals (Fig. 3D) (p < 0.00005 in 5 of 5 cells; Kolmogorov-Smirnov test). Quinpirole also produced smaller and inconsistent effects on the mEPSC size distribution (p < 0.05 for 4 of 5 cells), suggesting that there also may be some change in postsynaptic sensitivity. However, this effect was much less pronounced and was not significant when average amplitudes for each cell were pooled (Fig. 2E) (amplitude 90 ± 10% of control; p > 0.05). Pooled mEPSC frequency, on the other hand, was reduced to 56 ± 6% of control (Fig. 2D) (p < 0.05), consistent with a primarily presynaptic action of DA on MTs.
Quinpirole reduces feedback IPSCs in MT cells
Because GCs make reciprocal synapses with MTs, any mechanism that reduces synaptic excitation of GCs also will be expected to reduce the IPSCs that subsequently are produced in MTs. MTs were depolarized to -10 mV to isolate IPSCs as outward currents, and LOT stimulation was used to activate circuit-wide feedback inhibition by generating spikes in a large population of MTs. IPSCs recorded from voltage-clamped MTs were particularly long lasting, as has been noted for GABAA-dependent inhibition in previous studies (Fig. 4A) (Isaacson and Strowbridge, 1998; Schoppa et al., 1998), and reversed at approximately -50 mV (Fig. 4B). Bicuculline-sensitive feedback/feedforward IPSCs generated in MTs via LOT stimulation were reduced to 59 ± 12% of control by 5 μm quinpirole, and this reduction was reversed by sulpiride (Fig. 4C,D) (p < 0.05; n = 4).
Figure 4.

Quinpirole decreases feedback inhibition in MTs. A, LOT stimulation, activating a population of MTs and consequently producing network GC feedback, generates inhibitory synaptic currents measured in a MT neuron held at membrane potentials between -80 and +40 mV. B, MT IPSCs (quantified by charge integral) reverse at approximately -50 mV. C, Quinpirole reduces LOT-evoked IPSCs recorded from a MT neuron (black, control; gray, quinpirole). D, Bar graph showing pooled data. Quinpirole decreases integrated IPSC charge in MTs to 59 ± 12% of control (p < 0.05; n = 4). Bars show mean ± SE; *p < 0.05.
D2 activation reduces action potential propagation in MT lateral dendrites
Although the reduction in mEPSC frequency in GCs suggests a direct effect on transmitter release itself, D2 activation also could affect evoked release in other ways. Transmitter release from MT lateral dendrites is believed to be attributable to AP propagation throughout these structures, generating Ca2+ influx via high-voltage-activated Ca2+ channels (Isaacson and Strowbridge, 1998). Any reduction in either global Ca2+ influx or in the degree of spike invasion then will cause a decrease in glutamate release (Lowe, 2002; Xiong and Chen, 2002). To evaluate these possibilities, we recorded spike-dependent Ca2+ transients from lateral dendrites of MTs, which have been used as a measure of dendritic spike invasion both in vitro and in vivo (Spruston et al., 1995; Svoboda et al., 1997; Xiong and Chen, 2002). Short current pulses (15-60 msec, 0.4-3.0 nA), individually or in trains of three to four at 10 Hz, were used to drive APs in somatic current-clamp recordings of individual MTs filled with 200-300 μm fluo-4. MT lateral dendrites project extensively, and fluorescence transients could be recorded at distances >700 μm from the soma with a two-photon laser microscope in line-scan mode (Fig. 5A). APs driven by somatic current injection produced fast Ca2+ transients at all locations in the lateral dendrite, suggesting that spikes invaded their full extent. Transients had amplitudes of ∼60-120% ΔF/F and were sensitive to TTX and Cd2+; their amplitude was not activity-dependent (third spike in the train, 102 ± 4% of first; p > 0.5; n = 10) (data not shown). Accurate measurement of ΔF/F was difficult because of the low resting fluorescence of the dye, and absolute changes in fluorescence (ΔF) were used for additional quantification.
Figure 5.

Changes in MT membrane potential result in reduced dendritic Ca2+transients. A, In cases in which quinpirole hyperpolarized MT membrane potential, dendritic Ca2+ transients were decreased in amplitude (gray dashed line). Top, Reconstruction of neuron and recording location. Right, Action potentials generated by short current injections. Left, Resulting dendritic Ca2+ transients (average of 3 or more trials). Injection of depolarizing current, returning the cell to its original membrane potential, restores the transients (dotted lines, +QUIN, +Vm). B, Hyperpolarizing MTs by direct current injection, in control ACSF, also reduces transient amplitude (dashed line). C, The degree of reduction in transient size depends both on hyperpolarization and on distance or recording location from the soma. In cases in which membrane potential remained constant, there was no significant decrease in transient amplitude (black filled squares). For neurons that were hyperpolarized by quinpirole (gray filled squares) or by somatic current injection (gray open squares), transients farther from the soma were reduced to a greater degree (quinpirole: 9.7% reduction in amplitude/100 μm dendrite, slope significantly different from zero, p < 0.0005; hyperpolarizing current: slope -12.1%/100 μm dendrite, p < 0.01).
Some MTs (6 of 13) responded to bath application of 5 μm quinpirole with a membrane hyperpolarization of 4-7 mV, whereas others were unaffected, consistent with the presence of a subpopulation of D2-immunopositive MTs. AP-dependent Ca2+ transients were unchanged in cells displaying no shift in membrane potential (Fig. 5C) (96 ± 6%; p > 0.05; n = 9), whereas transients often were reduced in cells demonstrating a hyperpolarizing response, and this reduction could be reversed by depolarizing current (Fig. 5A,C). The amount of reduction was correlated with the distance from the soma at which the measurement was made (Fig. 5C) (9.7% reduction in amplitude/100 μm dendrite, slope significantly different from zero; p < 0.0005), indicating that APs were less effective in invading distal portions of the dendrites in the presence of quinpirole. This effect could be duplicated by hyperpolarizing the cells artificially with somatic current injection before spike generation (Fig. 5B,C) (slope, -12.1%/100 μm dendrite; p < 0.01). Current injection hyperpolarized MTs by 20-30 mV, to compensate for electrotonic decay in extended MT lateral dendrites and to produce more robust and quantifiable changes in transient amplitude, and generated a larger change in Ca2+ influx than D2R activation. These observations are consistent with reduced spike invasion into MT lateral dendrites produced by D2R activation in a hyperpolarization-dependent manner.
A-type K+ channels are expressed by MTs
Transient K+ channels are known to reduce AP backpropagation in the dendrites of hippocampal pyramidal cells, where their fast activation kinetics allow them to counteract depolarization because of voltage-gated Na+ and Ca2+ channels and to dampen AP peaks (Johnston et al., 2000). Whole-cell voltage-clamp recordings from MTs, with Na+ and Ca2+ currents eliminated by TTX/QX314 and Ca2+-free solution, respectively, revealed a fast-inactivating outward current sensitive to millimolar concentrations of 4-aminopyridine (4-AP) (Fig. 6A, left). This current activates and inactivates at relatively hyperpolarized potentials (Fig. 6A, center, right panels) (V1/2 for inactivation, -60 mV). The steepest portion of its inactivation curve coincides with typical MT resting membrane potentials (RMPs), suggesting that changes in polarization around rest could affect the availability of this current and, consequently, neuronal excitability. Consistent with this, somatic action potential waveforms recorded in current-clamp mode are sensitive to changes in MT membrane potential. Hyperpolarizing steps immediately preceding spike generation resulted in action potentials that were reduced in amplitude and repolarized more rapidly (Fig. 6B, left) (p < 0.001; n = 6 for both amplitude and repolarization). Perfusion with 3-5mm 4-AP increased MT spike height and width and reduced repolarization slope but did not affect depolarization (Fig. 6B, center). 4-AP also eliminated the ability of hyperpolarizing presteps to alter AP shape (Fig. 6B, right; pooled results are summarized in C). This indicates that fast, transient K+ currents are expressed by these cells and are capable of influencing their electrophysiological properties.
Figure 6.

MTs express A-type K+ currents that can modulate action potential waveform. A, Left, Voltage steps to +30 mV evoke a fast-activating, fast-inactivating outward current that is inactivated by a prestep to 40 mV and that is blocked by 3-5 mm 4-AP (gray). Center, Family of inactivating currents generated by varying prestep potential, generated by digital subtraction of slow, noninactivating current. Right, Resulting inactivation curve for this current family; 50% inactivation is at -60.5 mV. Inset, Fractional current available at membrane potentials close to MT resting Vm. B, Left, Hyperpolarizing presteps produce shorter and narrower APs recorded at the soma (solid black line, control; gray dashed line, hyperpolarized). Inset shows dV/dt, revealing that changes are the result of increased repolarization. Center, Blocking fast K+ currents with 4-AP increases AP height and width by decreasing repolarization (inset, dV/dt). Right, After 4-AP application the hyperpolarizing presteps no longer affect AP shape. C, Summary of AP waveform results. In ACSF the hyperpolarization significantly reduces spike height and increases repolarization slope (left and right graphs, p<0.001; n=18 for both) but does not affect depolarization slope (middlegraph, p>0.2; n=18). The 3-5mm 4-APincreases spike height and repolarization at RMP (p<0.002 and 0.005, respectively;n = 8) but does not affect the rate of depolarization (p > 0.05; n = 6). 4-AP also prevents the hyperpolarization-induced changes in AP height and repolarization (p > 0.05 and 0.5, respectively; n = 6). Bars show mean ± SE; *p < 0.05.
4-AP prevents hyperpolarization-induced changes in dendritic Ca2+ transients
If A-type K+ currents mediate the reduction in dendritic Ca2+ transient amplitude, then blockade of these channels should eliminate the effects produced by hyperpolarization. Extracellular perfusion with 3-5 mm 4-AP increased the size of Ca2+ transients at all locations within lateral dendrites (Fig. 7A,B) (201 ± 58% of control; p < 0.01; n = 6), an effect that likely is caused by an increase in action potential width as well as an increase in effectiveness of invasion. While maintained in standard ACSF, the hyperpolarization of MTs reduced Ca2+ transient amplitude to 78 ± 10% of control (p < 0.001; n = 7). After treatment with 4-AP, hyperpolarization no longer produced any change in transient amplitude (Fig. 7C) (98 ± 6% of control; p > 0.3; n = 6). There was no significant trend in the increase produced by 4-AP at different dendritic locations, suggesting that under our recording conditions the available IA does not cause significant spike attenuation in the lateral dendrites (Fig. 7B) (slope not significantly different from 0; p > 0.05). These observations suggest that 4-AP-sensitive K+ currents are responsible for hyperpolarization-dependent changes in dendritic Ca2+ influx.
Figure 7.

Block of fast K+ currents eliminates changes in dendritic Ca2+ transient caused by hyperpolarization. A, Top, Control transients (solid black line) are reduced by a negative prestep (gray dashed line). Bottom, 4-AP increases transient size as compared with control (solid line vs dotted line) and prevents the ability of presteps to decrease transient amplitude. B, Increase in dendritic Ca2+ transient amplitude produced by 4-AP, plotted versus dendritic location; trend is not significant (p > 0.05). C, In ACSF the presteps reduce transients to 78 ± 10% of control (p < 0.001; n = 6) but have no effect in 4-AP (98 ± 6%; p > 0.3; n = 6). Bars show mean ± SE; *p < 0.05.
Dopamine modulates odor-evoked OB responses
A DA-induced change in odor-evoked OB responses potentially could reflect a change in ORN input to the OB as well as a change in the MT→ GC reciprocal synapse. In mammalian systems DA has been shown to reduce synaptic transmission at the ORN→ MT synapse (Hsia et al., 1999). This effect is mediated by a reduction of Ca2+ influx in ORN terminals, as is another form of presynaptic inhibition at this synapse that is dependent on GABAB receptors (Wachowiak and Cohen, 1999). In frog ORN terminals filled with the fluorescent Ca2+ indicator calcium green-1 dextran, 5 μm quinpirole produced neither a significant change in Ca2+ influx resulting from electrical stimulation of the olfactory nerve (ΔF/F = 12.5 ± 2.5 vs 12.3 ± 2.5%; p > 0.5; n = 7) nor any change in paired pulse depression of influx (transient 2/transient 1 = 0.56 ± 0.16 for both; p > 0.5; n = 6) (Fig. 8A). This observation, coupled with the lack of clear D2R labeling in the glomerular layer of the frog (Duchamp-Viret et al., 1997) and the robust effect of quinpirole on LOT-evoked field potentials and EPSCs at the same concentration, suggests that the majority of D2R-mediated effects on odor-evoked responses under these conditions can be attributed to the MT→ GC synapse.
Figure 8.

D2 receptor activation produces inhibition-dependent changes in olfactory bulb population activity. A, Quinpirole has no effect on either peak or paired pulse reduction in Ca2+ influx into olfactory receptor terminals in the glomerular layer (ΔF/F, 12 ± 2.5 vs 12.3 ± 2.5%; PPD, 0.56 ± 0.16; p > 0.4 for both cases; traces are overlaid). B, Odor-evoked, inhibition-dependent LFP oscillations are increased by block of D2 receptors (left) and decreased by D2R activation (right). Raw traces show three trials from each condition, with dotted lines showing drug trials. Bottom, Left, Power spectra averaged across all trials (solid black line, control; gray horizontal lines, drug treatment; gray fill, control). Right, Integrated power from 2 to 20 Hz pooled across several preparations. Sulpiride increases power 229 ± 45% (p < 0.05; n = 6), an effect that is mimicked by 4-AP (194 ± 25%; p < 0.05; n = 4). Quinpirole decreases power to 47 ± 11% (p < 0.0001; n = 5) as does 1-3 μm bicuculline (73 ± 5%; p < 0.01; n = 5). C, Resting activity also is increased by sulpiride (561 ± 207% of control; p < 0.03; n = 6) and decreased by quinpirole (32 ± 3% of control; p < 0.0001; n = 5; displayed as in B).
Although dopaminergic cells are present in the OB (Boyd and Delaney, 2002) and our data indicate that DA can modulate transmitter release within the bulb, it is not clear what role dopaminergic neurons play during an odor response. With the use of an in vitro preparation with the sensory epithelium maintained intact (Delaney and Hall, 1996), brief pulses of odorants (40-300 msec; n-butanol, limonene, or methyl salicylate) applied to the sensory epithelium produced an evoked oscillation in the LFP that lasted ∼2-3 sec (Fig. 8B). This oscillation was correlated with periodic spiking in MTs alternating with synaptic GABAA feedback inhibition presumed to be received from GCs, because both GABAergic feedback and LFP oscillations are eliminated by 10 μm bicuculline (Lagier et al., 2004) (data not shown).
Extracellular perfusion with 5 μm sulpiride to block D2R activation caused an increase in the amplitude of the odor-evoked oscillation, indicating that the endogenous dopaminergic system is activated within individual odor responses and influences the functioning of the olfactory circuit (Fig. 8B). This was analyzed further by calculating power spectra for each odor-evoked epoch of LFP oscillation. The power of the oscillations was centered at ∼6-9 Hz, and the strength of the response in each condition (control or with drug application) was quantified as the area under the averaged power spectrum (average of 3-6 trials, digitally bandpass-filtered from 1.5 to 40 Hz; areas calculated from the 2-20 Hz band containing >90% of total power). Sulpiride produced a 229 ± 45% increase in average integrated LFP power (p < 0.05; n = 6). Because the LFP is a population average, this could result from an increase in the overall extracellular current flow generating the LFP (i.e., an increase in inhibitory feedback), an increase in the degree of synchronization of these currents, or both. This effect was present regardless of whether higher cortical structures were intact, demonstrating that dopaminergic modulation results from systems intrinsic to the bulb.
Additional experiments suggest that the changes in LFP power produced by D2R agonists and antagonists result from altered GABAA feedback. Transient K+ currents act in the OB to reduce activation of the GC feedback circuit by counteracting fast excitation of GCs through non-NMDA glutamate receptors (Schoppa and Westbrook, 1999). Perfusion of the OB with 2.5 mm 4-AP, increasing GC excitation and the degree of GABAergic feedback inhibition, mimicked the effect of sulpiride and produced an increase of 194 ± 25% in the power of the LFP oscillation (Fig. 8B) (p < 0.05; n = 4). On the other hand, 5 μm quinpirole, activating D2 receptors and decreasing synaptic inputs to GCs, gave a 47 ± 1% decrease in LFP power (p < 0.0001; n = 5). Again, this was mimicked by reducing the amount of feedback inhibition by partially blocking GABAA receptors with 3 μm bicuculline (73 ± 5% decrease; p < 0.01; n = 5). Thus changing the levels of D2R activation and directly altering the level of feedback inhibition produce parallel changes in oscillatory odor-evoked LFPs in the OB.
Finally, activation of D2Rs also appears to regulate resting levels of OB activity. Besides reducing the power of odor-evoked oscillations, quinpirole also reduced LFP power under resting, unstimulated conditions (Fig. 8C) (32 ± 3%; p < 0.0001; n = 5). Notably, blocking D2R activation with sulpiride greatly increased resting baseline LFP activity (561 ± 207% of control power; p < 0.03; n = 6), suggesting that significant amounts of basal DA release occur on an ongoing basis in the OB, where they reduce overall neuronal activity.
Discussion
Both experiments (Yokoi et al., 1995; Stopfer et al., 1997; MacLeod et al., 1998; Nusser et al., 2001; Sachse et al., 2002) and theory (Bazhenov et al., 2001) highlight the importance of inhibitory neuronal networks in olfactory circuit function. GABAergic inhibition in the vertebrate OB depends mainly on synaptic interactions between the dendrites of MTs and GCs and will be affected by changes in transmitter release and excitability within these neural populations. Using a combination of field potential measurements, whole-cell recording, and Ca2+ imaging, we demonstrate that activation of D2Rs on MTs in the frog OB reduces the strength of the MT→ GC synapse and decreases feedback and feedforward inhibition received by MTs. Changes in mEPSC frequency in TTX suggest that this effect is mediated partly by reduced MT glutamate release independent of spike-evoked Ca2+ influx. D2R activation also decreases Ca2+ influx in MT distal lateral dendrites, the site of synapses onto GC spines, an effect that may result from decreased dendritic excitability produced by a transient K+ current. During odor-evoked responses the blockade of D2 receptors increases inhibition-dependent field potential oscillations, suggesting that the dopaminergic system regulates the amount of inhibition generated as the OB processes physiologically relevant stimuli.
Cellular effects of DA
GABAergic inhibition has been suggested to augment the response properties of MTs (Yokoi et al., 1995) such that MT firing within a strongly activated glomerulus causes widespread GC activation and generates feedforward inhibition of MTs in more weakly activated glomeruli. Because MT lateral dendrites project extensively (Mori et al., 1983), they may be capable of generating widely distributed inhibition. The dual inhibitory effects on MT function described here have differing implications for GC network activity. Decreased MT glutamate release downstream of Ca2+ influx (Fig. 3C) should produce a uniform, global reduction of GC excitation and resulting inhibition. Decreased distal Ca2+ influx (Fig. 5C), alternatively, will decrease selectively the excitation of distant GCs and potentially change the spatial profile of inhibition generated by an active OB region (Xiong and Chen, 2002).
The relative contributions of these two mechanisms are not clear in these experiments. Reduced release probability independent of Ca2+ influx (Momiyama and Sim, 1996; Wu and Saggau, 1997) potentially could account for the entire decrease in evoked transmission (41 ± 8 and 35 ± 14% reduction in population and whole-cell EPSCs, respectively, vs 44 ± 6% reduction in mEPSC frequency). However, although reduced mEPSC frequency often correlates directly with a reduction in evoked release (Wu and Saggau, 1997), this is not always the case. At cerebellar synapses, although GABAB activation produces a marked Ca2+-independent decrease in mEPSC frequency, this accounts for only 10-30% of the total reduction of evoked transmission, with the remainder caused by additional downregulation of Ca2+ influx (Dittman and Regehr, 1996). In the OB the glutamate release likely is reduced both by Ca2+-independent mechanisms and by decreased dendritic spike invasion.
Reduced Ca2+ influx in dendrites
MT lateral dendrites are an important source of excitatory synaptic inputs to GCs, and reduced Ca2+ influx is predicted to decrease glutamate release from these compartments. Receptor-mediated presynaptic inhibition often acts via voltage-gated calcium channels (VGCCs) (Wu and Saggau, 1997; Wachowiak and Cohen, 1999), and the reduction seen here could be explained by preferential modulation of distal VGCCs. However, D2R activation reduced Ca2+ transients only in hyperpolarized MTs, and this decrease was reproduced by hyperpolarizing with current injection, which is not expected to inhibit VGCCs directly (Fig. 5B,C). Although D2R activation and direct hyperpolarization could act via different mechanisms, the reduction produced by D2Rs was reversed by depolarization (Fig. 5A). These data are consistent with indirect effects resulting from D2R-mediated hyperpolarization of MTs, perhaps generated by coupling to K+ channels (Lacey et al., 1987; Kim et al., 1995; Kloppenburg et al., 1999).
One way of translating hyperpolarization into decreased Ca2+ influx is through transient K+ currents, which affect dendritic excitability in several cell types (Hoffman et al., 1997; Christie and Westbrook, 2003; Goldberg et al., 2003). Although the difficulty in accurately controlling voltage in extended MT dendritic compartments likely introduces some inaccuracy in our measurements of kinetics and voltage dependence (Spruston et al., 1993), MTs clearly express a 4-AP-sensitive, fast-activating K+ current with properties consistent with those previously described for IA (Huguenard et al., 1991; Hoffman et al., 1997; Christie and Westbrook, 2003). In MTs the A-current blockade increases spike-evoked Ca2+ transients preferentially in distal lateral dendrites, indicating that it can influence dendritic AP invasion (Christie and Westbrook, 2003). In pyramidal neurons the dendritic IA produces strongly decremental AP backpropagation (Hoffman et al., 1997), and depolarizing inputs that inactivate this current potentiate spike invasion (Migliore et al., 1999; Watanabe et al., 2002). In MTs, however, spike backpropagation in lateral dendrites is relatively effective (Lowe, 2002; Xiong and Chen, 2002; Christie and Westbrook, 2003; Debarbieux et al., 2003) (but see Margrie et al., 2001). Hyperpolarization then may reduce dendritic spike invasion via removal of tonic inactivation of IA, which is affected strongly by voltage charges around MT resting potential (Fig. 6A). Indeed, block of IA eliminates the ability of hyperpolarization to reduce dendritic Ca2+ influx (Fig. 7). Although this was not measured directly, an additional possibility is that D2Rs potentially could alter activation or inactivation properties of this current via second messenger systems (Hoffman and Johnston, 1999; Kloppenburg et al., 1999).
A primarily hyperpolarization-dependent modulation of IA fits well with the fact that synaptic inputs received by MT lateral dendrites are primarily inhibitory and can generate large IPSPs (Mori et al., 1981; Nowycky et al., 1981). Focally evoked GABAergic inputs strongly affect spikes in lateral dendrites (Lowe, 2002; Xiong and Chen, 2002), although this effect could be attributable to hyperpolarization, shunting, or both. In CA1 pyramidal cells distally evoked IPSPs also reduce action potential backpropagation (Tsubokawa and Ross, 1997). Although inactivation of IA occurs quickly, which may allow it to be affected by synaptic events, its availability also will be altered by slower changes in membrane potential caused by neuromodulators such as seen here.
D2 receptor localization in frog and mammal
In mammalian systems D2 receptors and DA-immunoreactive interneurons are located primarily in the glomerular layer (Halasz et al., 1981; Kosaka et al., 1985; Coronas et al., 1997; Koster et al., 1999) where they reduce Ca2+ influx and transmitter release at ORN terminals (Hsia et al., 1999; Wachowiak and Cohen, 1999; Berkowicz and Trombley, 2000; Ennis et al., 2001). D2R labeling in the frog occurs in the MT and plexiform layers, with little signal in the glomerular layer (Duchamp-Viret et al., 1997). Consistent with this receptor localization, dopaminergic interneurons in amphibians, fish, and reptiles also are located in deeper OB layers (Halasz et al., 1983; Alonso et al., 1989; Gonzalez and Smeets, 1991). Although some dopaminergic neurons in frogs extend processes into the glomerular layer, many arborize exclusively in the MT layer (Boyd and Delaney, 2002) where they could affect MT and GC dendrites. Consistent with this, we find that, in the frog, DA reduces transmission at the MT→ GC synapse. DA also modulates glutamate release from MTs onto interneurons in cultured mammalian OB neurons, although this was attributed to VGCC downregulation (Davila et al., 2003).
Modulation and odor-evoked responses
Odor-evoked LFP oscillations in the antennal lobe and vertebrate OB are eliminated by pharmacological block of GABAergic feedback, suggesting that they are dependent on inhibition (MacLeod and Laurent, 1996; Lagier et al., 2004). The strength of the odor-evoked LFP oscillation reflects of a number of factors, including spiking of MTs, GABAergic synaptic currents, and population synchrony resulting from this inhibition. Regardless, oscillation power in the OB provides a functional measure of inhibition during odor responses, and pharmacologically altering the amount of inhibition mimics changes in oscillation power produced by D2Rs (Fig. 8B). Spontaneous as well as evoked LFP power is increased by D2R block (Fig. 8C), suggesting that a basal level of DA release is present in the OB, constitutively reducing inhibition and directly affecting the net synaptic inputs received by MTs.
Modulation of inhibition in the OB potentially could alter MT tuning or intensity response characteristics. Duchamp-Viret et al. (1997) found that D2R activation reduced resting activity of MT units, also increased their threshold and latency for odor stimulation, and reduced spiking responses to weak stimuli. One possible role of the dopaminergic system may be to regulate olfactory sensitivity by altering MT excitability. Hyperpolarized cells will require greater sensory input to reach threshold, whereas reduced inhibition could compensate for reduced excitability, so responses of less excitable cells are not damped excessively. Several in vivo and behavioral experiments link DA to olfactory sensitivity. Naris occlusion decreases OB DA content (Baker et al., 1983; Brunjes et al., 1985) and increases the responsiveness of MT units, an effect that is mimicked by D2R block (Wilson and Sullivan, 1995). Odor detection also is impaired by systemic activation of D2Rs (Doty and Risser, 1989). A role in sensitivity is also consistent with the constitutive level of DA release seen here, which may set an intermediate level of OB excitability that then could be increased or decreased, depending on the needs of the system.
Footnotes
This work was supported by Canadian Institutes of Health Research MOP14455 (K.R.D., I.G.D.), Natural Sciences and Engineering Research Council (NSERC) Canada RGPIN121698 (K.R.D.), Michael Smith Foundation for Health Research Career Investigator award (K.R.D.), and NSERC postgraduate scholarship (I.G.D.). We thank Dr. Tim Murphy for his generous sharing of equipment, facilities, and advice; Drs. Joanne Matsubara and Diane Finegood for the kind use of their microscopes and cameras; and Dr. Alan Gelperin for comments on this manuscript.
Correspondence should be addressed to Ian Davison, Department of Neurobiology, Box 3209, Duke University Medical Center, Durham, NC 27710. E-mail: idavison@neuro.duke.edu.
Copyright © 2004 Society for Neuroscience 0270-6474/04/248057-11$15.00/0
References
- Alonso JR, Covenas R, Lara J, Arevalo R, De Leon M, Aijon J (1989) Tyrosine hydroxylase immunoreactivity in a subpopulation of granule cells in the olfactory bulb of teleost fish. Brain Behav Evol 34: 318-324. [DOI] [PubMed] [Google Scholar]
- Aroniadou-Anderjaska V, Zhou F-M, Priest CA, Ennis M, Shipley MT (2000) Tonic and synaptically evoked presynaptic inhibition of sensory input to the rat olfactory bulb via GABAB heteroreceptors. J Neurophysiol 84: 1194-1203. [DOI] [PubMed] [Google Scholar]
- Aungst JL, Heyward PM, Puche AC, Karnup SV, Hayar A, Szabo G, Shipley MT (2003) Centre-surround inhibition among olfactory bulb glomeruli. Nature 426: 623-629. [DOI] [PubMed] [Google Scholar]
- Baker H, Kawano T, Margolis FL, Joh TH (1983) Transneuronal regulation of tyrosine hydroxylase expression in olfactory bulb of mouse and rat. J Neurosci 3: 69-78. [DOI] [PMC free article] [PubMed] [Google Scholar]
- Bazhenov M, Stopfer M, Rabinovich M, Abarbanel HD, Sejnowski TJ, Laurent G (2001) Model of cellular and network mechanisms for odor-evoked temporal patterning in the locust antennal lobe. Neuron 30: 569-581. [DOI] [PMC free article] [PubMed] [Google Scholar]
- Berkowicz DA, Trombley PQ (2000) Dopaminergic modulation at the olfactory nerve synapse. Brain Res 855: 90-99. [DOI] [PubMed] [Google Scholar]
- Boyd JB, Delaney KR (2002) Tyrosine-hydroxylase-reactive interneurons in the olfactory bulb of the frogs Rana pipiens and Xenopus laevis. J Comp Neurol 454: 42-57. [DOI] [PubMed] [Google Scholar]
- Brunjes PC, Smith-Crafts LK, McCarty R (1985) Unilateral odor deprivation: effects on the development of olfactory bulb catecholamines and behavior. Brain Res 354: 1-6. [DOI] [PubMed] [Google Scholar]
- Buck LB (2000) The molecular architecture of odor and pheromone sensing in mammals. Cell 100: 611-618. [DOI] [PubMed] [Google Scholar]
- Christie JM, Westbrook GL (2003) Regulation of backpropagating action potentials in mitral cell lateral dendrites by A-type potassium currents. J Neurophysiol 89: 2466-2472. [DOI] [PubMed] [Google Scholar]
- Coronas V, Srivistava LK, Liang JJ, Jourdan F, Moyse E (1997) Identification and localization of dopamine receptor subtypes in rat olfactory mucosa and bulb: a combined in situ hybridization and ligand binding autoradiographic approach. J Chem Neuroanat 12: 243-257. [DOI] [PubMed] [Google Scholar]
- Czesnik D, Rossler W, Kirchner F, Gennerich A, Schild D (2003) Neuronal representation of odourants in the olfactory bulb of Xenopus laevis tadpoles. Eur J Neurosci 17: 113-118. [DOI] [PubMed] [Google Scholar]
- Davila NG, Blakemore LJ, Trombley PQ (2003) Dopamine modulates synaptic transmission between olfactory bulb neurons in culture. J Neurophysiol 90: 395-404. [DOI] [PubMed] [Google Scholar]
- Debarbieux F, Audinat E, Charpak S (2003) Action potential propagation in dendrites of rat mitral cells in vivo. J Neurosci 23: 5553-5560. [DOI] [PMC free article] [PubMed] [Google Scholar]
- Delaney KR, Hall BJ (1996) An in vitro preparation of frog nose and brain for the study of odour-evoked oscillatory activity. J Neurosci Methods 68: 193-202. [DOI] [PubMed] [Google Scholar]
- Dittman JS, Regehr WG (1996) Contributions of calcium-dependent and calcium-independent mechanisms to presynaptic inhibition at a cerebellar synapse. J Neurosci 16: 1623-1633. [DOI] [PMC free article] [PubMed] [Google Scholar]
- Doty RL, Risser JM (1989) Influence of the D-2 dopamine receptor agonist quinpirole on the odor detection performance of rats before and after spiperone administration. Psychopharmacology 98: 310-315. [DOI] [PubMed] [Google Scholar]
- Duchamp-Viret P, Coronas V, Delaleu JC, Moyse E, Duchamp A (1997) Dopaminergic modulation of mitral cell activity in the frog olfactory bulb: a combined radioligand-electrophysiological study. Neuroscience 79: 203-216. [DOI] [PubMed] [Google Scholar]
- Ennis M, Zhou FM, Ciombor KJ, Aroniadou-Anderjaska V, Hayar A, Borrelli E, Zimmer LA, Margolis F, Shipley MT (2001) Dopamine D2 receptor-mediated presynaptic inhibition of olfactory nerve terminals. J Neurophysiol 86: 2986-2997. [DOI] [PubMed] [Google Scholar]
- Goldberg JH, Tamas G, Yuste R (2003) Ca2+ imaging of mouse neocortical interneurone dendrites: Ia-type K+ channels control action potential backpropagation. J Physiol (Lond) 551: 40-65. [DOI] [PMC free article] [PubMed] [Google Scholar]
- Gonzalez A, Smeets WJ (1991) Comparative analysis of dopamine and tyrosine hydroxylase immunoreactivities in the brain of two amphibians, the anuran Rana ridibunda and the urodele Pleurodeles waltlii. J Comp Neurol 303: 457-477. [DOI] [PubMed] [Google Scholar]
- Halasz N, Johansson O, Hokfelt T, Ljungdahl A, Goldstein M (1981) Immunohistochemical identification of two types of dopamine neuron in the rat olfactory bulb as seen by serial sectioning. J Neurocytol 10: 251-259. [DOI] [PubMed] [Google Scholar]
- Halasz N, Nowycky MC, Shepherd GM (1983) Autoradiographic analysis of [3H] dopamine and [3H]dopa uptake in the turtle olfactory bulb. Neuroscience 8: 705-715. [DOI] [PubMed] [Google Scholar]
- Hall BJ, Delaney KR (2002) Contribution of a calcium-activated non-specific conductance to NMDA receptor-mediated synaptic potentials in granule cells of the frog olfactory bulb. J Physiol (Lond) 543: P819-P834. [DOI] [PMC free article] [PubMed] [Google Scholar]
- Hamilton KA, Kauer JS (1989) Patterns of intracellular potentials in salamander mitral/tufted cells in response to odor stimulation. J Neurophysiol 62: 609-625. [DOI] [PubMed] [Google Scholar]
- Hoffman DA, Johnston D (1999) Neuromodulation of dendritic action potentials. J Neurophysiol 81: 408-411. [DOI] [PubMed] [Google Scholar]
- Hoffman DA, Magee JC, Colbert CM, Johnston DJ (1997) K+ channel regulation of signal propagation in dendrites of hippocampal pyramidal neurons. Nature 387: 869-875. [DOI] [PubMed] [Google Scholar]
- Hsia AY, Vincent JD, Lledo PM (1999) Dopamine depresses synaptic inputs to the olfactory bulb. J Neurophysiol 82: 1082-1085. [DOI] [PubMed] [Google Scholar]
- Huguenard JR, Coulter DA, Prince JR (1991) A fast transient potassium current in thalamic relay neurons: kinetics of activation and inactivation. J Neurophysiol 66: 1304-1315. [DOI] [PubMed] [Google Scholar]
- Isaacson JS, Strowbridge BW (1998) Olfactory reciprocal synapses: dendritic signaling in the CNS. Neuron 20: 749-761. [DOI] [PubMed] [Google Scholar]
- Jahr CE, Nicoll RA (1982) Noradrenergic modulation of dendrodendritic inhibition in the olfactory bulb. Nature 297: 227-229. [DOI] [PubMed] [Google Scholar]
- Johnston D, Hoffman DA, Magee JC, Poolos NP, Watanabe S, Colbert CM, Migliore M (2000) Dendritic potassium channels in hippocampal pyramidal neurons. J Physiol (Lond) 525: 75-81. [DOI] [PMC free article] [PubMed] [Google Scholar]
- Kaba H, Hayashi Y, Higuchi T, Nakanishi S (1994) Induction of an olfactory memory by the activation of a metabotropic glutamate receptor. Science 265: 262-264. [DOI] [PubMed] [Google Scholar]
- Kim K-M, Nakajima Y, Nakajima S (1995) G-protein-coupled inward rectifier modulated by dopamine agonists in cultured substantia nigra neurons. Neuroscience 69: 1145-1158. [DOI] [PubMed] [Google Scholar]
- Kloppenburg P, Levini RM, Harris-Warrick RM (1999) Dopamine modulates two potassium currents and inhibits the intrinsic firing properties of an identified motor neuron in a central pattern generator network. J Neurophysiol 81: 29-38. [DOI] [PubMed] [Google Scholar]
- Kosaka T, Hataguchi Y, Hama K, Nagatsu I, Wu YJ (1985) Coexistence of immunoreactivities for glutamate decarboxylase and tyrosine hydroxylase in some neurons in the periglomerular region of the rat main olfactory bulb: possible coexistence of gamma-aminobutyric acid (GABA) and dopamine. Brain Res 343: 166-171. [DOI] [PubMed] [Google Scholar]
- Koster NL, Norman AB, Richtand NM, Nickell WT, Puche AC, Pixley SK, Shipley MT (1999) Olfactory receptor neurons express D2 dopamine receptors. J Comp Neurol 411: 666-673. [DOI] [PubMed] [Google Scholar]
- Lacey MG, Mercuri NB, North RA (1987) Dopamine acts on D2 receptors to increase potassium conductance in neurones of the rat substantia nigra zona compacta. J Physiol (Lond) 392: 397-416. [DOI] [PMC free article] [PubMed] [Google Scholar]
- Lagier S, Carleton A, Lledo P-M (2004) Interplay between local GABAergic interneurons and relay neurons generates γ oscillations in the rat olfactory bulb. J Neurosci 24: 4382-4392. [DOI] [PMC free article] [PubMed] [Google Scholar]
- Lowe G (2002) Inhibition of backpropagating action potentials in mitral cell secondary dendrites. J Neurophysiol 88: 64-85. [DOI] [PubMed] [Google Scholar]
- Luo M, Katz LC (2001) Response correlation maps of neurons in the mammalian olfactory bulb. Neuron 32: 1165-1179. [DOI] [PubMed] [Google Scholar]
- MacLeod K, Backer A, Laurent G (1998) Who reads temporal information contained across synchronized and oscillatory spike trains? Nature 395: 693-698. [DOI] [PubMed] [Google Scholar]
- Margrie TW, Sakmann B, Urban NN (2001) Action potential propagation in mitral cell lateral dendrites is decremental and controls recurrent and lateral inhibition in the mammalian olfactory bulb. Proc Natl Acad Sci USA 98: 319-324. [DOI] [PMC free article] [PubMed] [Google Scholar]
- McLeod K, Laurent G (1996) Distinct mechanisms for synchronization and temporal patterning of odor-encoding neural assemblies. Science 274: 976-979. [DOI] [PubMed] [Google Scholar]
- Migliore M, Hoffman DA, Magee JC, Johnston D (1999) Role of an A-type K+ conductance in the back-propagation of action potentials in the dendrites of hippocampal pyramidal neurons. J Comput Neurosci 7: 5-15. [DOI] [PubMed] [Google Scholar]
- Momiyama T, Sim JA (1996) Modulation of inhibitory transmission by dopamine in rat basal forebrain nuclei: activation of presynaptic D1-like dopaminergic receptors. J Neurosci 16: 7505-7512. [DOI] [PMC free article] [PubMed] [Google Scholar]
- Mori K, Nowycky MC, Shepherd GM (1981) Analysis of synaptic potentials in mitral cells in the isolated turtle olfactory bulb. J Physiol (Lond) 314: 295-309. [DOI] [PMC free article] [PubMed] [Google Scholar]
- Mori K, Kishi K, Ojima H (1983) Distribution of dendrites of mitral, displaced mitral, tufted, and granule cells in the rabbit olfactory bulb. J Comp Neurol 219: 339-355. [DOI] [PubMed] [Google Scholar]
- Nowycky MC, Mori K, Shepherd GM (1981) GABAergic mechanisms of dendrodendritic synapses in isolated turtle olfactory bulb. J Neurophysiol 46: 639-648. [DOI] [PubMed] [Google Scholar]
- Nusser Z, Kay LM, Laurent G, Homanics GE, Mody I (2001) Disruption of GABAA receptors on GABAergic interneurons leads to increased oscillatory power in the olfactory bulb network. J Neurophysiol 86: 2823-2833. [DOI] [PubMed] [Google Scholar]
- Palouzier-Paulignan B, Duchamp-Viret P, Hardy AB, Duchamp A (2002) GABAB receptor-mediated inhibition of mitral/tufted cell activity in the rat olfactory bulb: a whole-cell patch-clamp study in vitro. Neuroscience 111: 241-250. [DOI] [PubMed] [Google Scholar]
- Rumsey JD, Darby-King A, Harley CW, McLean JH (2001) Infusion of the metabotropic receptor agonist, DCG-IV, into the main olfactory bulb induces olfactory preference learning in rat pups. Brain Res Dev Brain Res 128: 177-179. [DOI] [PubMed] [Google Scholar]
- Sachse S, Galizia CG (2002) Role of inhibition for temporal and spatial odor representation in olfactory output neurons: a calcium imaging study. J Neurophysiol 87: 1106-1117. [DOI] [PubMed] [Google Scholar]
- Schoppa NE, Westbrook GL (1999) Regulation of synaptic timing in the olfactory bulb by an A-type potassium current. Nat Neurosci 2: 1041-1043. [DOI] [PubMed] [Google Scholar]
- Schoppa NE, Kinzie JM, Sahara Y, Segerson TP, Westbrook GL (1998) Dendrodendritic inhibition in the olfactory bulb is driven by NMDA receptors. J Neurosci 18: 6790-6802. [DOI] [PMC free article] [PubMed] [Google Scholar]
- Spruston N, Jaffe DB, Williams SH, Johnston D (1993) Voltage- and space-clamp errors associated with the measurement of electrotonically remote synaptic events. J Neurophysiol 70: 781-801. [DOI] [PubMed] [Google Scholar]
- Spruston N, Schiller Y, Stuart G, Sakmann B (1995) Activity-dependent action potential invasion and calcium influx into hippocampal CA1 dendrites. Science 268: 297-300. [DOI] [PubMed] [Google Scholar]
- Stopfer M, Bhagavan S, Smith BH, Laurent G (1997) Impaired odour discrimination on desynchronization of odour-encoding neural assemblies. Nature 390: 70-74. [DOI] [PubMed] [Google Scholar]
- Sullivan RM, Stackenwalt G, Nasr F, Lemon C, Wilson DA (2000) Association of an odor with activation of olfactory bulb noradrenergic β-receptors or locus coeruleus stimulation is sufficient to produce learned approach responses to that odor in neonatal rats. Behav Neurosci 114: 957-962. [DOI] [PMC free article] [PubMed] [Google Scholar]
- Svoboda K, Denk W, Kleinfeld D, Tank DW (1997) In vivo dendritic calcium dynamics in neocortical pyramidal neurons. Nature 385: 161-165. [DOI] [PubMed] [Google Scholar]
- Tago H, Kimura H, Maeda T (1986) Visualization of detailed acetylcholinesterase fiber and neuron staining in rat brain by a sensitive histochemical procedure. J Histochem Cytochem 34: 1431-1438. [DOI] [PubMed] [Google Scholar]
- Trombley PQ (1992) Norepinephrine inhibits calcium currents and EPSPs via a G-protein-coupled mechanism in olfactory bulb neurons. J Neurosci 12: 3992-3998. [DOI] [PMC free article] [PubMed] [Google Scholar]
- Tsubokawa H, Ross WN (1997) Muscarinic modulation of spike backpropagation in the apical dendrites of hippocampal CA1 pyramidal neurons. J Neurosci 17: 5782-5791. [DOI] [PMC free article] [PubMed] [Google Scholar]
- Wachowiak M, Cohen LB (1999) Presynaptic inhibition of primary olfactory afferents mediated by different mechanisms in lobster and turtle. J Neurosci 19: 8808-8817. [DOI] [PMC free article] [PubMed] [Google Scholar]
- Watanabe S, Hoffman DA, Migliore M, Johnston D (2002) Dendritic K+ channels contribute to spike-timing dependent long-term potentiation in hippocampal pyramidal neurons. Proc Natl Acad Sci USA 99: 8366-8371. [DOI] [PMC free article] [PubMed] [Google Scholar]
- Wilson DA, Sullivan RM (1991) Olfactory associative conditioning in infant rats with brain stimulation as reward: II. Norepinephrine mediates a specific component of the bulb response to reward. Behav Neurosci 105: 843-849. [DOI] [PMC free article] [PubMed] [Google Scholar]
- Wilson DA, Sullivan RM (1995) The D2 antagonist spiperone mimics the effects of olfactory deprivation on mitral/tufted cell odor response patterns. J Neurosci 15: 5574-5581. [DOI] [PMC free article] [PubMed] [Google Scholar]
- Wu L-G, Saggau P (1997) Presynaptic inhibition of elicited transmitter release. Trends Neurosci 20: 204-212. [DOI] [PubMed] [Google Scholar]
- Xiong W, Chen WR (2002) Dynamic gating of spike propagation in the mitral cell lateral dendrites. Neuron 34: 115-126. [DOI] [PubMed] [Google Scholar]
- Yokoi M, Mori K, Nakanishi S (1995) Refinement of odor molecule tuning by dendrodendritic synaptic inhibition in the olfactory bulb. Proc Natl Acad Sci USA 92: 3371-3375. [DOI] [PMC free article] [PubMed] [Google Scholar]