

Abstract
P2X receptors are ATP-gated channels permeable to cations including Ca2+. In acute slices containing the nucleus of the solitary tract, in which neuronal ATP release and ATP-elicited physiological responses are demonstrated in vivo, we recorded spontaneous action potential-independent EPSCs [miniature EPSCs (mEPSCs)]. Activation of presynaptic P2X receptors with α,β-methylene ATP (αβmATP) triggered Ca2+-dependent glutamate release that was resistant to blockade of voltage-dependent calcium channels but abolished by P2X receptor antagonists. mEPSCs elicited with αβmATP were of larger amplitude than basal mEPSCs and resulted in postsynaptic firing caused by temporal summation of miniature events. The large-amplitude mEPSCs provoked by αβmATP were likely to result from highly synchronized multivesicular release of glutamate at single release sites. Neither αβmATP nor ATP facilitated GABA release. We conclude that this facilitated release and consequent postsynaptic firing underlie the profound autonomic responses to activation of P2X receptors observed in vivo.
Keywords: ATP, purinergic receptors, P2X receptors, presynaptic ligand-gated channels, EPSCs, miniature EPSCs, glutamate release, patch-clamp technique, brainstem slice preparation, nucleus of the solitary tract
Introduction
The brain controls the internal environment of the body by generating autonomic outputs from the CNS, which is optimized according to the information coming from visceral receptors that monitor the unceasingly varying internal environment of the organism. Such information is converged to the caudal part of the nucleus of the solitary tract (cNTS), where the primary afferent fibers from these receptors form the first synapse in the brain (Andresen and Kunze, 1994). The cNTS is extremely rich in receptor proteins for many endogenous bioactive substances, activation of which strongly modifies the signal processing in the cNTS and subsequently affects various regulatory control systems and behaviors (Jean, 1991; Van Giersbergen et al., 1992; Lawrence and Jarrot, 1996).
Accumulating evidence indicates that extracellular ATP functions as a neurotransmitter and a neuromodulator in the CNS by activating ionotropic P2X receptors (Khakh, 2001; Robertson et al., 2001; North, 2002) and metabotropic P2Y receptors (von Kügelgen and Wetter, 2000). As yet, however, there are few brain regions in which the function of ATP-mediated signaling has been analyzed from the molecular to the whole animal levels. P2X receptors are abundantly located in the cNTS (Collo et al., 1996; Vulchanova et al., 1997; Kanjhan et al., 1999; Yao et al., 2001) and are functional when dissociated (Nabekura et al., 1995). Activation of P2X receptors increases spontaneous EPSC frequency in cNTS slices (Kato and Shigetomi, 2001). Enzymes breaking down extracellular ATP to adenosine are operational in the cNTS (Kato and Shigetomi, 2001; Dale et al., 2002). The cNTS presents the highest expression of adenosine transporters in the whole brain (Bisserbe et al., 1985), through which broken-down ATP is taken up into the cells (Zimmermann, 2000). In the cNTS of anesthetized rats, ATP is released in response to hypothalamic stimulation (St. Lambert et al., 1997; Dale et al., 2002), and the extracellular concentration of purines increases in response to hypoxia (Barraco et al., 1991). Most importantly, a microinjection of P2X receptor agonists into the cNTS in vivo has profound cardiorespiratory effects (Scislo et al., 2001). Taken together, these data suggest that extracellular ATP released in the cNTS strongly modulates the excitability of the cNTS network, primarily via activation of P2X receptors.
How activation of P2X receptors excites the cNTS network, however, remains unknown. This is an important issue for understanding the functional significance of these Ca2+-permeable P2X receptors, which are widely expressed in the brain but remain poorly understood (North, 2002; Khakh et al., 2003). Here we show that the major mechanism of the cNTS network excitation by ATP is by way of triggering Ca2+-dependent exocytosis of glutamate, but not that of GABA, by Ca2+ entry through presynaptic P2X receptors. Surprisingly, this glutamate release produced larger postsynaptic depolarizing potentials than those occurring spontaneously, leading to de novo generation of action potentials in postsynaptic cells, in a similar manner to but through distinct mechanisms from the recently reported case with presynaptic nicotinic receptors in the hippocampus (Sharma and Vijayaraghavan, 2003).
Materials and Methods
Slice preparation. Transverse brainstem slices from Wistar rats (2–5 weeks old) were prepared according to a method described previously (Kato and Shigetomi, 2001). The manipulation of the animals conformed to the Guiding Principles for the Care and Use of Animals in the Field of Physiological Sciences of the Physiological Society of Japan (1988) and the regulation of the local animal committee. Briefly, the lower brainstem was dissected out under deep ketamine anesthesia (100–150 mg/kg, i.p.), and two to three transverse slices of 400 μm thickness containing the cNTS were cut in the ice-cold “cutting” artificial CSF (ACSF) composed of (in mm): 125 NaCl, 3 KCl, 0.1 CaCl2, 5 MgCl2, 1.25 NaH2PO4, 12.5 d-glucose, 0.4 l-ascorbic acid, and 25 NaHCO3 25 (pH 7.4; bubbled with 95% O2/5% CO2; osmolarity, ∼330 mOsm/kg). The slices were first incubated in a holding chamber with “standard” ACSF, of which the concentrations of CaCl2 and MgCl2 were 2 and 1.3 mm, respectively, at 37°C for 30–45 min. The slices were then kept at room temperature (∼25°C) in the same chamber for 0.5–10 hr until the recording. A slice was transferred to a recording chamber (∼0.4 ml volume) and submerged in and continuously superfused at a rate of 1–2 ml/min with the standard ACSF, which additionally contained 100 μm picrotoxin and 1 μm 8-cyclopentyl-1,3-dipropylxanthine (DPCPX) to block GABAA/C and adenosine A1 receptors, respectively. Strychnine (1 μm) was also added to the ACSF to block glycine receptor currents in some experiments. Tetrodotoxin citrate (TTX; 1 μm) was also added to the ACSF after verification of the monosynaptically activated postsynaptic currents on the solitary tract stimulation (see below), except for the experiments in which stimulation-evoked responses were analyzed. In these cases, the concentration of MgCl2 was 3 mm to avoid re-excitatory processing of the cNTS network (Fortin and Champagnat, 1993). The “ACSF containing no added Ca2+” contained 0 mm CaCl2 and 3 mm MgCl2. EGTA was not included. We applied ATP or α,β-methylene ATP (αβmATP) (100 or 300 μm) to 333 healthy-looking cNTS neurons recorded in 159 slices from 85 rats. Of these neurons, 220 cells (66.1%) responded to ATP (100 or 300 μm) or αβmATP (100 μm), or both, with an increase in spontaneous synaptic inputs under voltage-clamp or current-clamp recording conditions.
Patch-clamp recordings. The whole-cell transmembrane current was recorded from small (soma diameter <15 μm) second-order cNTS neurons visually identified with an upright microscope (BX-50, Olympus) with infrared differential interference contrast optics. The patch-clamp electrodes were made from borosilicate glass pipettes (1B120F-4; World Precision Instruments). The composition of the intracellular solution was (in mm): 120 gluconic acid potassium, 6 NaCl, 5 CaCl2, 2 MgCl2, 2 ATP Mg, 0.3 GTP Na, 10 EGTA, 10 HEPES hemisodium (pH 7.2 as adjusted with KOH; osmolarity, ∼310 mOsm/kg). With this intracellular solution, [Ca2+]i is moderately buffered at an estimated concentration of ∼170 nm at 25°C. The series resistance (23.0 ± 0.8 MΩ; range, 11–50 MΩ; n = 93) and whole-cell capacitance were compensated. The input resistance (Rinput) and the whole-membrane capacitance (Cm) measured immediately after the cell membrane rupture of 93 neurons randomly selected from the cNTS neurons responding to αβmATP were 725.4 ± 41.4 MΩ (range, 183–2580 MΩ) and 10.0 ± 0.3 pF (range, 5.0–18.5 pF), respectively. The break-in resting membrane potential of these neurons was –68.0 ± 0.85 mV (n = 92). In a part of the study in which IPSCs were recorded, the internal solution contained (in mm): 140 CsCl, 1 CaCl2, 2 ATP Mg, 0.3 GTP Na, 10 EGTA, 10 HEPES hemisodium (pH 7.2 as adjusted with CsOH; osmolarity, ∼310 mOsm/kg). The tip resistance of the electrode was 3–8MΩ. The membrane potential was held at –70 mV during the recordings.
The membrane current was recorded with an Axopatch 200B amplifier (Axon Instruments) or CEZ-2400 (Nihon-Kohden, Tokyo), low-pass filtered at 2 kHz, and sampled at 4 or 10 kHz (for the analysis of event kinetics) with a PowerLab interface (AD Instruments) together with the holding potential, the stimulation timing pulse, and the timing signal from the electromagnetic valve controller used for the drug application (VC-6, Warner Instruments; see below).
A tip of a bipolar concentric electrode was placed on the solitary tract (TS). In all neurons recorded, the TS was stimulated every 5 sec at a submaximum intensity (0.01–3 mA; 100 μsec) to verify monosynaptically evoked EPSCs before adding TTX or CdCl2 to the ACSF. The neurons showing evoked EPSCs with a latency that was not within the range for the monosynaptic input from the TS afferents (Kato and Shigetomi, 2001) or those without TS stimulation-activated evoked EPSCs were discarded at this moment. The effect of TTX or Cd2+ was confirmed by the complete absence of evoked response in all neurons to which these blockers were applied. All recordings were made at room temperature (20–25°C).
Drugs and their application. TTX, picrotoxin, strychnine hydrochloride, DPCPX, and pyridoxal-phosphate-6-azophenyl-2′,4′-disulfonic acid tetrasodium (PPADS), ATP, αβmATP, and 2′,3′-(benzoyl-4-benzoyl)-ATP (BzATP) were purchased from Sigma (St. Louis, MO). 2′,3′-O-(2,4,6-trinitrophenyl)-ATP (TNP-ATP) was from Molecular Probes (Eugene, OR). Other compounds were purchased from Nacalai Tesque (Kyoto, Japan). The agonists (ATP and αβmATP) were applied locally to the slice for 30 sec with a glass pipette (inner diameter, 0.7 mm), the tip of which was placed ∼2–5 mm upstream of the recording electrode, ensuring a faster rise of the agonist concentration and faster exchange of the solution around the cells recorded than that achieved by bath application. The bath perfusion was withheld during the application from this pipette so that the plateau concentration of the agonists in the chamber was identical to the solution concentration. The flow rate of the solution from this pipette was regulated to be almost within the range of that of the bath perfusion. When ATP or αβmATP was applied in the presence of antagonists and blockers, the application solution also contained the same concentration of the antagonists and blockers as that in the bath perfusate to avoid recovery, if any, from the blocking effects during a 30 sec application period. The plateau concentration was attained within 10–20 sec after the opening of the electromagnetic valve. In all traces, the on–off timing of the electromagnetic valve is indicated; the actual rise of the concentration in the chamber was therefore delayed by 10–20 sec. TNP-ATP, PPADS, TTX, kynurenic acid, and CdCl2 were bath-applied. The antagonists and blockers were perfused for >10 min before testing the effect of agonists. Micropressure-applied AMPA solution contained (in mm): 135 NaCl, 3 KCl, 1.25 NaH2PO4, 10 glucose, 10 HEPES hemisodium, 0.4 l-ascorbic acid, 2 CaCl2, 1.3 MgCl2, and 0.1 AMPA (pH 7.4, adjusted with NaOH). The AMPA solution filled a patch pipette connected to a Pneumatic Picopump (PV830; World Precision Instruments) and was applied to neurons with a pressure pulse (4–10 psi, 10–15 msec).
Data analysis. The recorded membrane current was analyzed off-line with an Igor Pro 4 (WaveMetrics) with the macros written by F.K. The spontaneous EPSCs were first semi-automatically detected by template matching-based detection with a rather low threshold to detect as many “likely” events as possible, but whole trace was visualized to check for overdetection or underdetection of the events. This macro program allowed us to add or delete events according to the visual inspection of the waveforms. The “unlikely” events (judged by visual inspection by the experimenter) were carefully discarded, which might have resulted in a slight underestimation of the EPSC frequency. It should also be noted that events occurring with short (less than ∼2 msec) intervals cannot be isolated with this method, suggesting that a few doublets and triplets were counted as single events, especially when the increase in frequency was large, as in the cases with a high (>300 μm) concentration of agonists, also leading to an underestimation of the frequency. Most of the events showed a fast rise (see Fig. 4C), however, even when the frequency was increased with 100 μm αβmATP, suggesting that the contamination by doublets and triplets did not significantly affect the amplitude analysis. The timing of an EPSC event was defined as the timing of the EPSC peak. The EPSC amplitude was calculated by subtracting the mean membrane current over a 5 msec period immediately before the rising phase of each EPSC from the current at the EPSC peak. The instantaneous frequency of EPSC in events per second was calculated and plotted as the total number of events within a moving 5 sec window divided by five.
Figure 4.
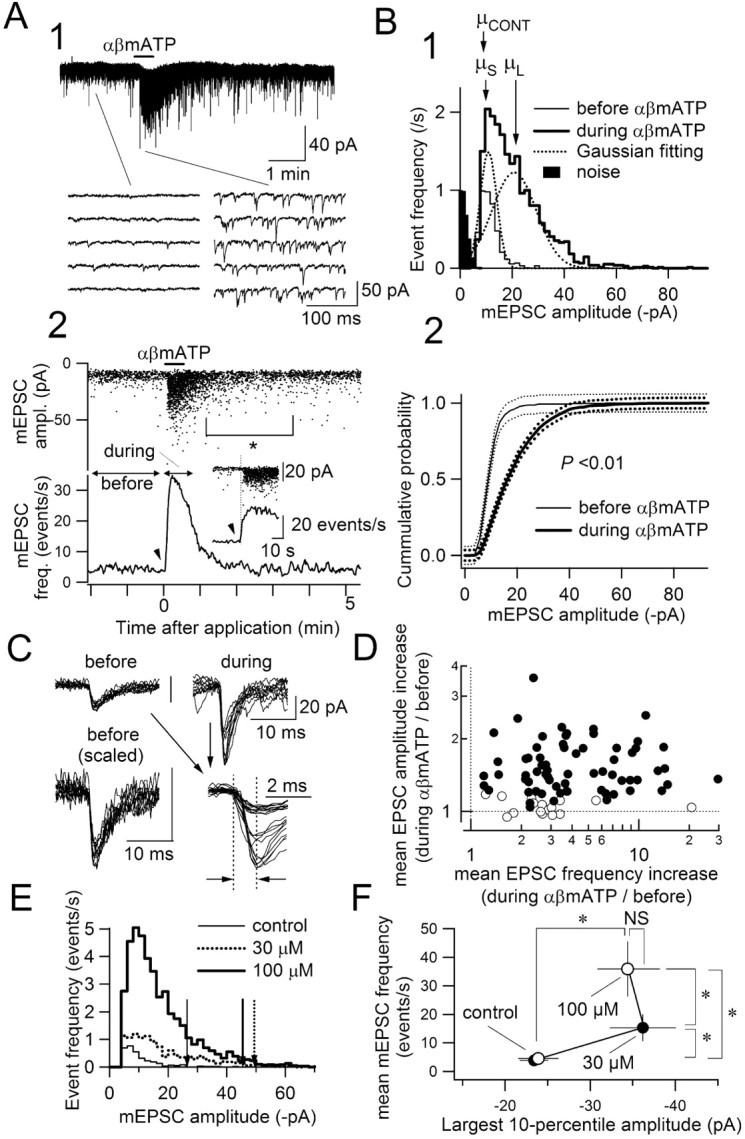
An example of a neuron showing an increase in the frequency and amplitude of mEPSCs in response to αβmATP. A1, Original traces of the whole-cell membrane current. The multi-raw traces below are the time-extended versions of the traces above. A2, Amplitude of each mEPSC plotted against its time of occurrence (top) and the instantaneous frequency on mEPSC (bottom) for the neuron shown in A1. αβMATP was applied from time 0 for 30 sec. The data obtained during the periods indicated as “before” and “during” are used for the analyses in B. The plots in the inset are the time-expanded versions showing that the onsets of large minis (top) and the frequency increase (bottom) are highly concurrent. B1, Distribution of mEPSC amplitude before and during (thin-lined and bold-lined histograms, respectively) the αβmATP effect. Abscissa indicates mEPSC amplitude; ordinates indicate number of events per second. The bin width for the amplitude class was 1.9 pA. B2, Cumulative probability plots of the mEPSC amplitude distribution before and during (thin and thick curves, respectively) the αβmATP effect. Broken curves above and below the bold curves indicate the significance limit (p = 0.05) for the Kolmogorov–Smirnov statistics. Note that each curve is out of this limit, indicating that the amplitude distribution is significantly different before and after αβmATP. C, Superimposed traces (n = 10) of mEPSCs appearing before and during αβmATP application. Traces are from the same neuron analyzed in A and B. Note that the event waveforms, especially the rise time (interval between vertical broken lines), are not different between basal (before) and large (during) minis. D, The relationship between the ratio of increase in mEPSC amplitude (ordinate) and that in mEPSC frequency (abscissa) with αβmATP. Values from 83 neurons are plotted. Open circles represent neurons without large minis (n = 16); filled circles represent neurons with large minis (n = 67). E, mEPSC amplitude histogram of a neuron to which 30 and 100 μm of αβmATP were applied. Note that even at 30 μm, and also 100 μm of αβmATP, large-amplitude events, which did not occur before drug application, occurred. Three vertical arrows indicate the largest 10th percentile amplitude at control, in the presence of 30 and 100 μm αβmATP. F, Summary of the effect of 30 and 100 μm αβmATP on the mEPSC frequency and the largest 10th percentile of the mEPSC amplitude distribution (mean ± SEM; n = 7 neurons). *p < 0.05; Wilcoxon's sign test.
Statistical analysis. The values are expressed as mean values ± SEM. Differences in the values were compared with ANOVA, Mann–Whitney U test, or Wilcoxon's sign test (for normalized values). Differences with p < 0.05 were considered significant.
Results
Calcium entry through P2X receptors directly provokes glutamate release
We have previously demonstrated that ATP and αβmATP increase the frequency of spontaneous EPSCs recorded in both the absence and presence of TTX in ∼80% of second-order small-diameter cNTS neurons (Kato and Shigetomi, 2001). First, we analyzed more in detail the response of miniature EPSCs (mEPSCs) to a nonhydrolyzable P2X receptor agonist, αβmATP, in the presence of TTX (in this paper, we use the term mEPSCs to designate spontaneously occurring EPSCs recorded in the presence of either TTX or Cd2+, simply because they do not depend on presynaptic action potentials). The increase in mEPSC frequency was dependent on the concentration of αβmATP. A detectable increase in mEPSCs was observed at a concentration of 30 μm and showed maximum response at 300–1000 μm (Fig. 1A). The estimated EC50 of αβmATP for the increase in mEPSCs was 80 μm (Fig. 1B, right, filled circles). In contrast, inward currents activated by αβmATP were negligibly small at this concentration (Fig. 1B, right, open circles), suggesting that P2X receptors sensitive to αβmATP are expressed predominantly at the presynaptic membranes.
Figure 1.
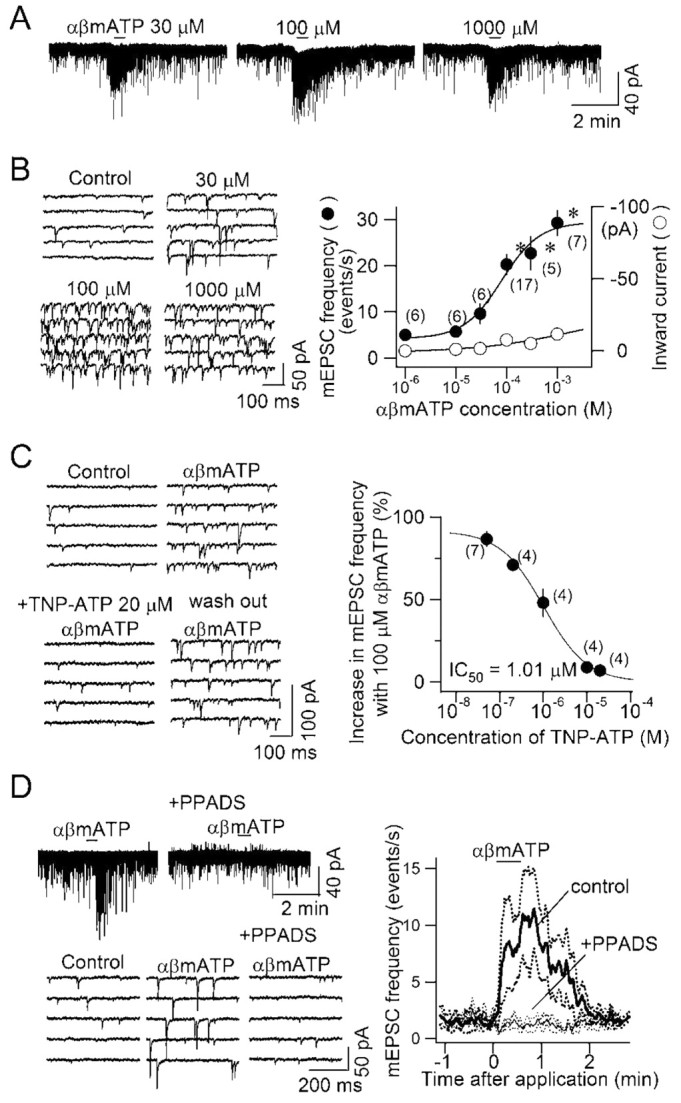
Activation of P2X receptor by αβmATP increased mEPSC frequency. A, Original traces of a cNTS neuron showing the effect of αβmATP at concentrations of 30, 100, and 1000 μm. The horizontal bars indicate the period of application. B, Left, Time-expanded traces at different concentrations of αβmATP; right, concentration–response curves of the mEPSC frequency (left vertical axis) and the amplitude of the inward current (right vertical axis) in response to the αβmATP at concentrations shown on the abscissa. Mean and SEM. Numbers in parentheses indicate the number of neurons (the same for mEPSC frequency and inward current amplitude). *p < 0.05, significantly different from control. C, TNP-ATP abolished the increase in mEPSC frequency evoked by αβmATP in a concentration-dependent manner. Left, Original consecutive traces of the whole-cell membrane current before and at the maximal effect of αβmATP in the absence of (top), in the presence of (bottom left) and after 10 min washout of (bottom right) TNP-ATP (20 μm).αβMATP was applied after 10 min of perfusion with the ACSF containing TNP-ATP of each concentration in an increasing order from 50 nm to 20 μm. Right, Concentration–inhibition curve for the inhibitory effect of TNP-ATP on the mEPSC frequency increase with αβmATP. Estimated IC50 was 1.01 μm. D, Effect of PPADS on the increase in mEPSC frequency by αβmATP. Left, Original traces showing the effect of αβmATP in the absence and presence of PPADS. Right, Change in mEPSC frequency by αβmATP in the absence (control, bold line) and presence (+PPADS, thin line) of PPADS (40 μm). Mean of responses of four cNTS neurons to αβmATP (100 μm). The broken curves above and below solid curves denote mean ± SEM.
We confirmed that the increase in mEPSC frequency by αβmATP is mediated by activation of P2X receptors in a series of pharmacological experiments. TNP-ATP is a subtype-specific P2X receptor antagonist without any reported antagonism against P2Y and adenosine receptors. TNP-ATP reversibly abolished the increase in mEPSC frequency by αβmATP (Fig. 1C) in a concentration-dependent manner with an IC50 of 1.0 μm (Fig. 1C, right). In addition, another P2X receptor antagonist, PPADS, was also effective in suppressing the increase in mEPSC frequency induced by αβmATP (Fig. 1D) (before perfusion of 40 μm PPADS: from 2.0 ± 0.5 to 15.3 ± 1.9 events per second, p < 0.0001; in the presence of PPADS: from 1.6 ± 0.4 to 2.8 ± 0.7 events per second; not significantly changed by αβmATP; n = 5). No increase in mEPSC frequency was observed after αβmATP when applied in the presence of PPADS (Fig. 1D, right). These results indicate that the facilitating effect of ATP and αβmATP on glutamate release is mediated by P2X receptors.
The P2X receptors are highly permeable to Ca2+ (North, 2002). If the increase in mEPSC frequency by αβmATP results mostly from release facilitation by Ca2+ entry into axon terminals through presynaptic P2X receptors, the increase in mEPSC frequency should remain even in the absence of Ca2+ entry through presynaptic voltage-dependent calcium channels (VDCCs). To address this issue, we examined whether this increase in mEPSC frequency occurs in the absence of the Ca2+ influx through presynaptic VDCCs using Cd2+, a nonselective blocker of VDCCs. It has been shown that Cd2+ can also attenuate P2X receptor currents at larger concentrations (Capiod, 1998), which might complicate the interpretation of the results. To avoid this complication, we applied 50 μm Cd2+ while directly ensuring complete blockade of VDCC-dependent release by monitoring of the EPSCs evoked by stimulation of TS afferent fibers in TTX-free ACSF. Perfusion of ACSF with 50 μm Cd2+ gradually reduced the amplitude of the evoked EPSC and almost completely abolished it within 4–5 min (Fig. 2A–D), indicating that action potential-dependent release is suppressed. Even when evoked EPSCs were completely suppressed by Cd2+, αβmATP still significantly increased spontaneous mEPSC frequency (Fig. 2E,F). The increase in mEPSC frequency by αβmATP in the presence of Cd2+ was almost identical to that observed in the presence of TTX (Fig. 2G). These results strongly suggest that the facilitation of glutamate release by αβmATP does not involve the activation of VDCCs.
Figure 2.

The increase of mEPSC frequency evoked by αβmATP does not involve Ca2+ entry through VDCCs. A, Transmembrane whole-cell current (Im) of a cNTS neuron recorded in the presence of picrotoxin, strychnine, and DPCPX. During the recording, the TS was stimulated every 5 sec. ACSF containing 50 μm Cd2+ was perfused for the period indicated by the horizontal bar on the top. αβMATP (100 μm) was applied at the short horizontal bar. B, The amplitude of each EPSC evoked by TS stimulation. The abscissas for traces in A and B are common. C, Traces 1–5 show the stimulus-triggered averages of evoked EPSCs by eight consecutive stimuli at horizontal bars 1–5 below the plots in B. Note that the evoked EPSCs were abolished with Cd2+ (traces 4 and 5). D, Comparison of the amplitude of evoked EPSCs in the absence (left column) and presence (right column) of Cd2+ in the ACSF; n = 4 neurons. *p < 0.05. E, Time-expanded consecutive traces of Im. a and b show the Im at a and b in A, before and after αβmATP application, respectively. F, Effect of αβmATP (100 μm) on the frequency of the spontaneously occurring EPSCs in the presence of Cd2+; n = 4 neurons. *p < 0.02. G, Effect of αβmATP (100 μm) on the frequency of the spontaneously occurring EPSC in the presence of TTX; n = 10 neurons. *p < 0.0001.
Next we examined whether this increase in mEPSC frequency is dependent on extracellular Ca2+. Perfusion with ACSF containing no added Ca2+ for >10 min almost completely suppressed the increase in mEPSC frequency induced by αβmATP in a reversible manner (Fig. 3A–C), indicating that extracellular Ca2+ is required for this facilitation. Interestingly, when mEPSC frequency was increased in response to αβmATP, EPSCs were of larger amplitude than those observed before drug application (Fig. 3B2,D, asterisks). The small-amplitude events with amplitude almost identical to those observed before drug application remained during αβmATP application (Fig. 3D, arrowheads), suggesting that the larger-amplitude events appeared de novo after αβmATP application without affecting small-amplitude events. The amplitude distribution histogram indicates that these large-amplitude events observed during αβmATP application form a distinct peak from the smaller-amplitude events observed before application of αβmATP (Fig. 3E). The peak for lower-amplitude events in the amplitude distribution before αβmATP application was not affected by αβmATP (Fig. 3E, top, bold-line histogram) and was still clearly distinguishable from the peak for the baseline noise, indicating that the increase in frequency during αβmATP application does not result from the summation of events that were previously below detection level. In the absence of added Ca2+, the whole distribution was not significantly affected by αβmATP (Fig. 3E). The αβmATP-induced increase in mEPSC amplitude was observed in 67 of 83 neurons and is analyzed more in detail later. Another interesting observation is that the mEPSCs persisted even in the absence of added Ca2+ in the ACSF. The frequency of basal mEPSC was slightly decreased but not significantly affected by lowering [Ca2+]o:2.4 ± 0.5, 1.7 ± 0.3, and 2.3 ± 0.3 events per second in ACSF containing 2, 0, and 2 mm (recovery) Ca2+, respectively (n = 6; p = 0.51; ANOVA) (Fig. 3C, open columns), suggesting that basal mEPSC events do not depend crucially on extracellular Ca2+.
Figure 3.
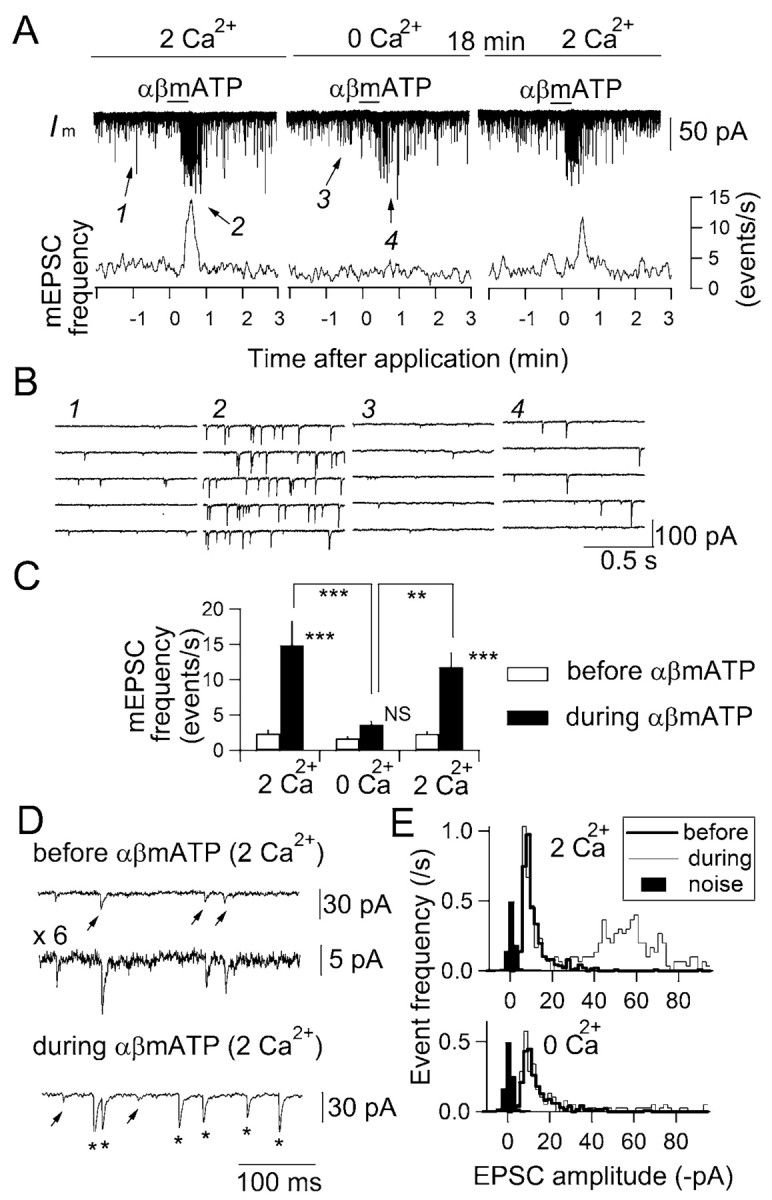
Increase in mEPSC frequency of cNTS neurons by activation of P2X receptors requires extracellular Ca2+. A, αβMATP (100 μm) increased the mEPSC frequency in the solution with 2 mm Ca2+ (left) but not in the ACSF with no added Ca2+ (middle). The effect of αβmATP recovered to a level similar to that before reducing extracellular Ca2+ concentration after ∼18 min of re-perfusion with 2 mm Ca2+ solution (right). B, Time-extended versions showing the increase in the mEPSC frequency with αβmATP (100 μm) (2) compared with the pre-application level (1) but not in the absence of extracellular Ca2+ (3, 4). Traces 1–4 are from the periods with the same numbers shown with arrows in A. C, Summary of the effect of extracellular Ca2+ on the increase in the peak mEPSC frequency by αβmATP; n = 6 neurons. **p < 0.001; ***p < 0.0001. NS, Not significantly different. The signs above filled histograms show a comparison of the results of the effects before and during αβmATP application. D, Time- and amplitude-extended drawings of the membrane current before (top and middle) and during (bottom) αβmATP application. The top and middle traces are the same but presented with different scales (see calibration). Arrowheads indicate small-amplitude events (<15 pA); asterisks indicate large-amplitude events (>30 pA). E, Amplitude histogram of mEPSCs before and during αβmATP application (bold and thin lines, respectively) in the presence (top) and absence (bottom) of added Ca2+ in ACSF.
Increase in mEPSC frequency by P2X receptor activation was accompanied by larger-amplitude mEPSCs in a majority of cNTS neurons
As briefly described above (Fig. 3), when P2X receptor agonists increased mEPSC frequency, there was also an increase in the amplitude of mEPSCs (Figs. 1A–D, 2A,E,3A,D). We named these larger-amplitude mEPSCs that appeared in response to αβmATP “large minis.” This is an unconventional phenomenon because, in the strict sense, the amplitude of mEPSCs, which reflects the quantal release of single vesicles, should not change, except in the cases during which the drug exerts postsynaptic effects, modifies release mechanisms, or affects quantal vesicle contents. To address this issue, we analyzed the changes in the amplitude distribution and postsynaptic properties after αβmATP application and the effect of perturbing Ca2+ release from intracellular Ca2+ stores on these synaptic events.
Changes in amplitude distribution of mEPSC by αβmATP
In 83 neurons in which αβmATP significantly increased the mEPSC frequency, we constructed an amplitude histogram. Figure 4 shows a typical result of a neuron exhibiting a large increase in mEPSC frequency and large minis after αβmATP application (Fig. 4A). Despite the change in the form of distribution, the modal peak of the distribution at ∼10 pA was not affected by αβmATP (Fig. 4B1, compare the peaks of the light- and bold-lined histograms). If there were a change in the postsynaptic non-NMDA receptor current amplitude, all of the event amplitude would be increased equally and the modal peak would shift to the right, which is not the case here (a conclusion also supported by the analyses described below) (Fig. 5). Rather, during αβmATP application, it seemed as if a new population of events with larger mean amplitude was added to the control distribution (Figs. 3E,4B1, bold-lined histogram). The significant change in the amplitude distribution by αβmATP was confirmed by analyzing cumulative probability (Fig. 4B2). In 67 of 83 (80.7%) neurons examined, the amplitude distribution was significantly different with αβmATP (p < 0.01; Kolmogorov–Smirnov test). These neurons are classified as “neurons showing large minis with αβmATP.” In the other 16 neurons (19.3%; “neurons without large minis”), αβmATP did not significantly alter the amplitude distribution, despite a significant increase in mEPSC frequency. The basal mEPSC frequency before αβmATP application was not significantly different between neurons with and without large minis (neurons showing large minis, 4.2 ± 0.4 events per second; without large minis, 4.0 ± 0.6 events per second; p = 0.864; ANOVA). The increase in mEPSC frequency by αβmATP was not significantly different between these groups (neurons showing large minis, 534 ± 57%; without large minis, 380 ± 115%; p = 0.06; Mann–Whitney U test) (Fig. 4D) (also see text below). The mean amplitude of mEPSCs before αβmATP application, however, was significantly different between these neuronal groups (neurons showing large minis, –11.8 ± 0.5 pA; those without large minis, –16.3 ± 1.0 pA; p < 0.001; Mann–Whitney U test). These data suggest that the increase in mEPSC amplitude after the activation of P2X receptors occurs mostly in neurons in which the basal spontaneous mEPSCs were smaller.
Figure 5.

Occurrence of large minis does not accompany postsynaptic changes. A, Effect of αβmATP on the membrane current (top), mEPSC frequency (middle), mEPSC amplitude (dots in the bottom plot), and AMPA-evoked current amplitude (open circles in the bottom plot). αβMATP (100 μm) was applied during the period indicated by horizontal bar on the top. Note that the amplitude of the AMPA-evoked current remained unchanged even when the large-amplitude mEPSCs were observed. B, Time-extended versions of the effect of micropressure-applied AMPA on the membrane current. AMPA (100 μm) was applied where indicated by filled circles for 15 msec. The multi-raw traces below are the time-expanded membrane currents showing the mEPSCs: left (1), before αβmATP application; middle (2), during αβmATP application; right (3), during αβmATP application in the presence of CNQX (40 μm). The traces at the bottom (1–3 and merge) are the passive membrane current responses to a pulse command protocol shown on the bottom left (a 100 msec pulse to –90 mV). Numbers 1–3 are from numbers 1–3 in the traces above. Merge is a superimposition of traces 1–3. C, Summary in the changes in AMPA-induced transient current (filled columns) and the input resistance of the membrane (open columns). Mean and SEM of five neurons examined. **p < 0.01; *p < 0.05.
As stated above, αβmATP application gave rise to a new peak with larger event amplitudes in the histogram of neurons with large minis (Figs. 3E,4B1). To evaluate the mean amplitude values of two peaks appearing during αβmATP application and to compare them with the value before drug application, we fitted a model of a sum of two Gaussian distributions with mean values of μS and μL (Fig. 4B1) onto the amplitude histogram obtained during αβmATP application. The mean amplitude before application (μCONT) (Fig. 4B1) was estimated by fitting a single Gaussian model onto the histogram before drug application. This analysis was made in 14 typical neurons showing large minis and reasonable fitting. The μS (average, –9.2 ± 0.8 pA; range, –6.3 to –14.1 pA; n = 14) appearing during αβmATP application was not significantly different from the μCONT (–9.4 ± 0.5 pA; range, –6.7 to –15.9 pA) of the peak observed before application, whereas μL (average, –18.2 ± 2.2 pA; range, –9.2 to –43.9 pA) of the peak with larger event amplitude during αβmATP was significantly larger (p < 0.01) than any of μS and μCONT. The ratio of μL to μCONT was 192 ± 18% (range, 122–396%).
Increase in mEPSC frequency and occurrence of large minis were not correlated
This ratio of large minis to the basal minis (approximately one to fourfold larger mean amplitude) may suggest that the large minis are attributable to random superimposition of the more frequent mEPSCs during αβmATP. Indeed, the onset of the rise in frequency coincided well with the occurrence of large minis (Fig. 4A2, inset); however, four lines of evidence argue against this possibility. First, if large minis are caused by random superimposition of mEPSCs, more frequent mEPSCs should give rise to a larger probability of occurrence of larger minis, which might result in a positive correlation between changes in mEPSC frequency and mEPSC amplitude. There was no significant correlation between the increase in mEPSC frequency and that in mEPSC amplitude (Fig. 4D) (Spearman's rank correlation, 0.166; not significantly correlated; n = 83), however, indicating that the increase in amplitude is not likely to be a simple consequence of increased frequency. As stated above, there was no significant difference between the ratio of increase of mEPSC frequency by αβmATP between neurons with large minis (Fig. 4D, filled circles) and those without (open circles). Second, even after the increased frequency decayed to the baseline level after washout, large amplitude events, albeit less frequent, remained because of unknown mechanisms (Fig. 4A2, asterisk). These data indicate that the increase in mEPSC amplitude is not simply caused by random superimposition of the more frequent mEPSCs. Third, in the neurons to which different concentrations of αβmATP were applied (Fig. 1A,B), the larger increase in mEPSC frequency was observed with a larger agonist concentration, which was not the case for the amplitude, however. Figure 4F indicates that despite large and significant differences in the mEPSC frequency between control, after 30 and 100 μm αβmATP applications (Fig. 1B), there was no significant difference in the largest 10th percentile amplitude of the mEPSCs (Fig. 4E), further confirming that the occurrence of large minis is not a simple consequence of the increase in mEPSC frequency by αβmATP. In addition, large minis were observed, albeit infrequently, even when the increase in mEPSC frequency was small (Figs. 1B, 3B4). Fourth, if the large amplitude is caused by spatial summation of independently occurring events at distinct sites, the time from the event onset to the peak (i.e., rise time) should be longer than non-large events, because of weaker synchronization of release timing (Kombian et al., 2000; Sharma and Vijayaraghavan, 2003); however, this was not the case with the large minis (Fig. 4C, interval between vertical broken lines). The average amplitude and rise time of all detected events before αβmATP application, recorded in three neurons at a sampling frequency of 10 kHz for a better time resolution, were –11.8 ± 0.3 pA (n = 755) and 0.96 ± 0.01 msec (n = 755), respectively. Despite a marked increase in the amplitude (average amplitude of the large minis within the largest 10th percentile during αβmATP application, –45.9 ± 1.0 pA; n = 263), the rise time of these largest events was not significantly different from that of the basal minis (0.92 ± 0.03 msec; p = 0.21; ANOVA; n = 263). These results indicate that large minis do not result from spatial summation of randomly occurring or weakly synchronized unitary events; rather, a highly synchronized coactivation of processes each with kinetics similar to those underlying the basal minis are likely to generate the fast- and larger-amplitude events.
Large minis are not caused by the postsynaptic effect of αβmATP
Another possibility that might explain the increase in the amplitude of mEPSCs is that αβmATP could affect the sensitivity of postsynaptic receptors underlying mEPSCs or membrane properties of the postsynaptic cells. This is not the case, however, as demonstrated by the following observations. First, as described above, the appearance of large minis was not accompanied by a global increase in the amplitude of all detected events (Figs. 3E, 4B1), suggesting that a general increase in the postsynaptic non-NMDA receptor current is unlikely. Second, even when αβmATP increased mEPSC frequency and gave rise to large minis (Fig. 5A), the amplitude of the current evoked by puffer application of AMPA (100 μm) was not affected (Fig. 5A, open circles, B,C) (not significantly increased). The postsynaptic receptors mediating mEPSCs (both basal and large minis) and AMPA-evoked currents are the same because both currents were completely and significantly abolished by CNQX (40 μm) (Fig. 5B, right panel, C). There was no detectable change in the passive membrane properties before and during αβmATP application (Fig. 5B1–B3,C). These results strongly indicate that the increase in mEPSC amplitude was not caused by a postsynaptic effect of αβmATP. Third, αβmATP did not activate detectable transient currents in the postsynaptic cell even when it increased mEPSC frequency (Figs. 1A,B). Even at higher nonphysiological concentrations, inward currents evoked by αβmATP remained small (<20 pA at 1 mm and estimated EC50 by extrapolation was >4 mm), making it unlikely that the postsynaptic inward current lies upstream of the mEPSC amplitude increase.
Intracellular Ca2+ mobilization plays minimal role in the occurrence of large minis
It has been reported recently that activation of presynaptic nicotinic ACh receptors gives rise to large-amplitude mEPSCs through activating intracellular Ca2+ release in hippocampal CA3 pyramidal neurons (Sharma and Vijayaraghavan, 2003). We examined whether this is also the case for αβmATP-induced large minis in the cNTS. After preincubation for >10–20 min with, and in the presence of ryanodine (100 μm), a ryanodine receptor blocker, cyclopiazonic acid (CPA; 20 μm), a reversible inhibitor of sarcoplasmic reticulum Ca2+-ATPase, or 2-aminoethoxydiphenylborane (2APB; 100 μm), a membranepermeable inhibitor of inositol 1,4,5-triphosphate (IP3) receptors, αβmATP gave rise to increased mEPSC frequency and large minis, which were not significantly different from those observed in the absence of these inhibitors. The mEPSC frequency was increased by αβmATP from 4.4 ± 0.6 to 18.6 ± 3.0 events per second, from 5.4 ± 2.2 to 21.6 ± 4.7 events per second, and from 5.7 ± 1.1 to 20.4 ± 2.7 events per second in the presence of ryanodine, CPA, and 2APB, respectively, which were not significantly different from the values in the absence of these inhibitors. The average mEPSC amplitude of the events belonging to the largest 10th percentile also increased significantly with αβmATP from –21.8 ± 2.5 to –37.9 ± 5.7 pA, from –26.6 ± 3.6 to –44.2 ± 6.5 pA, and from –25.4 ± 2.5 to –46.2 ± 2.0 pA, respectively, in the presence of ryanodine, CPA, and 2APB, respectively, which were not significantly different from the increments in the absence of these inhibitors. These results indicate that Ca2+ release from the intracellular stores is not the primary mechanism responsible for the occurrence of large minis.
αβmATP-evoked mEPSPs can elicit postsynaptic firing
It is generally believed that “miniature” action potential-independent transmitter release is a sort of “noise” in the synaptic transmission with only minor functional roles (Zucker, 2003). One might expect, however, that the large increases in frequency and amplitude of mEPSCs observed during αβmATP application demonstrated above may lead the postsynaptic cell to generate action potentials in the complete absence of action potential- and VDCC-dependent release through temporal summation of these high-frequency large-amplitude mEPSPs. A recent report shows that activation of presynaptic nicotinic receptors leads to postsynaptic firing in the hippocampus (Sharma and Vijayaraghavan, 2003). In their study, however, the demonstration of postsynaptic firing was made in the absence of any blockers of action potential-dependent release and VDCCs, leaving a possibility that action potential-dependent release occurred after the activation of nicotinic receptors. In cNTS synapses, as shown above, activation of presynaptic P2X receptors triggered glutamate release even when VDCCs were completely blocked by Cd2+ in the absence of TTX (Fig. 2). This allowed us to directly examine whether postsynaptic firing occurs after activation of presynaptic P2X receptors in the presence of Cd2+ (a condition allowing one to suppress action potential-dependent exocytosis), but in the absence of TTX (a condition allowing one to detect postsynaptic firing). In these experiments, the membrane potential of the neurons was recorded under current-clamp conditions (Fig. 6). The membrane potential before αβmATP application was kept at the same subthreshold level of approximately –65 mV by DC current injection (Iinj, <15 pA) (Fig. 6, each panel) in all experiments of this series so that the cell did not spontaneously generate action potentials before each drug application. Application of αβmATP initiated action-potential generation, which was attributable to the summation of EPSPs (Fig. 6A, right). In all three neurons tested under current clamp, no sustained depolarization of the postsynaptic neuron was detected during and after application of αβmATP (Fig. 6A,C), consistent with the absence of a detectable shift of holding current under voltage-clamp with αβmATP (Figs. 1A,D, 2A, 3A, 4A, 5A) (Kato and Shigetomi, 2001). In the presence of Cd2+, which completely abolished the TS-evoked EPSCs in all neurons tested (Fig. 6B,D), αβmATP still promoted action-potential generation (Fig. 6C, left) attributable to the summation of large EPSPs (Fig. 6C, right). Cd2+ did not significantly affect this marked and significant increase in the action-potential frequency induced by αβmATP (Fig. 6E).
Figure 6.
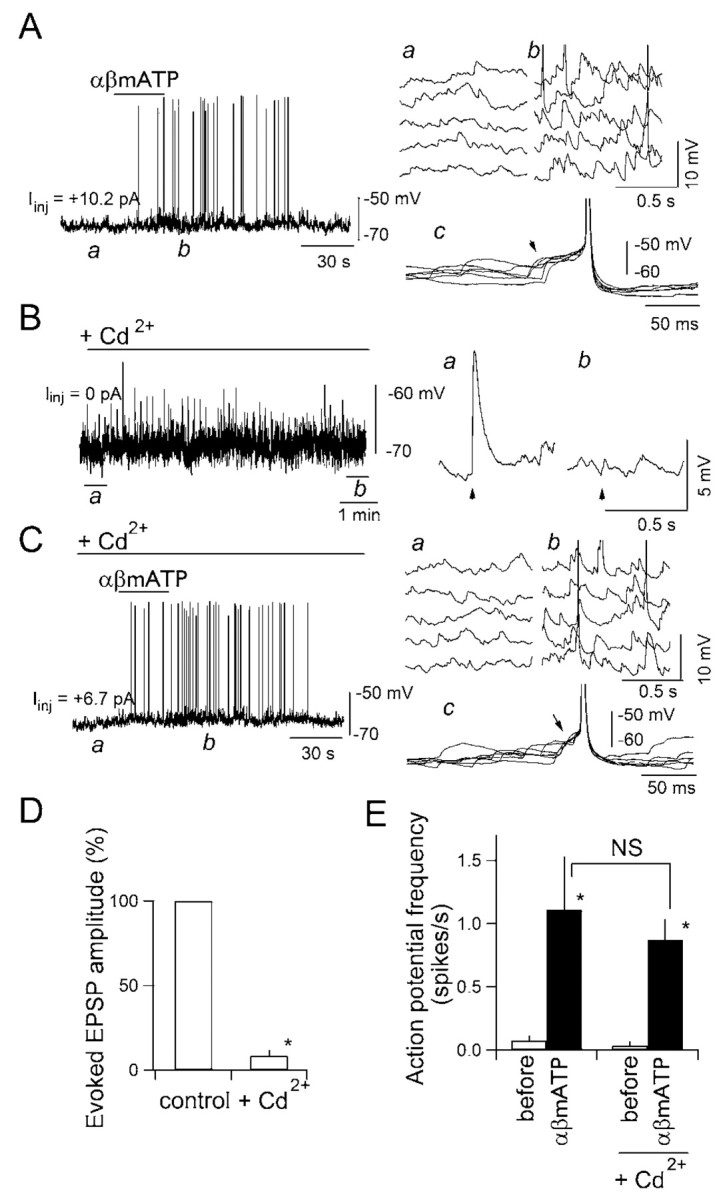
EPSPs elicited by αβmATP generate action potentials in the postsynaptic neuron. A, Effect of αβmATP on the membrane potential of a cNTS neuron in the presence of picrotoxin, strychnine, and DPCPX. Left, Original trace of the membrane potential. A depolarizing current of 10.2 pA was injected to keep the resting membrane potential around –65 mV.αβMATP (100 μm) was applied where indicated by the horizontal bar for 30 sec. Top right, Time-extended version of the consecutive membrane potential recording at a and b in the left panel. Note an increase in the frequency of spontaneous EPSPs in b compared with a. c, Superimposed membrane potential trajectory around action potentials (n = 6) activated by αβmATP application. Note that temporarily summated EPSPs brought the postsynaptic neuron to fire (arrowhead). B, Effect of cadmium on the EPSPs evoked by TS stimulation. TS was stimulated every 5 sec. ACSF containing Cd2+ (50 μm) was perfused during period indicated by the horizontal bar and abolished the evoked EPSP (a and b in the right panels). C, Effect of αβmATP on the membrane potential in the presence of Cd2+. Left, Original trace (a depolarizing current of 6.7 pA was injected to keep the resting membrane potential at almost the same level as that before Cd2+ perfusion).αβMATP (100 μm) again increased the frequency of spontaneous EPSPs (a and b), a temporary summation of which again made this neuron to fire (c). D, Summary of the effect of Cd2+ on the amplitude of EPSPs evoked by TS stimulation. Mean and SEM of three neurons. *, Significantly different (p < 0.05; Mann–Whitney U test). E, Effect of Cd2+ on the firing frequency of the action potentials activated by αβmATP. Mean and SEM of three neurons. *p < 0.05; NS, not significantly different.
IPSC frequency was not affected by αβmATP
As stated in Introduction, activation of P2X receptors in cNTS neurons in anesthetized rats exerts profound autonomic effects that are abolished after blockade of ionotropic glutamate receptors (Scislo and O'Leary, 2000). In the cNTS, GABAergic and glycinergic interneurons, which receive excitatory inputs from the primary afferents and excitatory interneurons, inhibit activities of large projecting neurons (Champagnat et al., 1986; Kawai and Senba, 1996). We confirmed that the release facilitation by P2X receptor agonists occurs only at excitatory synapses and not with inhibitory ones by recording IPSCs from large cNTS neurons that predominantly receive inhibitory inputs (Champagnat et al., 1986; Kawai and Senba, 1996). IPSCs were recorded with patch electrodes mainly containing CsCl in the presence of kynurenic acid (3 mm) to block ionotropic glutamate receptors and in the absence of picrotoxin. With these recording conditions, IPSCs could be detected as large inward events (Fig. 7). In both the absence and presence of TTX, IPSC frequency was affected neither by αβmATP nor by ATP at 100 μm in all 11 neurons examined (Fig. 7). There was no significant difference in miniature IPSC frequency before and during application of ATP and αβmATP, indicating that the increase in transmitter release by activation of presynaptic P2X receptors is specific to excitatory synapses.
Figure 7.

Release facilitation by P2X receptor activation does not occur at inhibitory synapses. Top, Original trace of the membrane current recorded with CsCl-based internal solution at a holding potential of –70 mV in the presence of TTX, DPCPX, and kynurenic acid. The bottom traces are time-extended versions showing before (left) and during (right) αβmATP application. ATP and αβmATP also caused no change in IPSC frequency and amplitude in the other 10 neurons recorded under the same condition.
Discussion
Here we have shown that, in the cNTS, P2X receptor agonists trigger the release of glutamate, but not that of GABA, by direct Ca2+ entry through presynaptic P2X receptors in the complete absence of Ca2+ influx through VDCCs, which brings the postsynaptic cell to fire. We conclude that excitation of the cNTS network through these mechanisms is the cellular basis underlying the profound cardiorespiratory effects of P2X receptor agonists in the cNTS.
Release facilitation by presynaptic P2X receptor activation has been demonstrated in cultured spinal cord and sensory cells (Gu and MacDermott, 1997; Hugel and Schlichter, 2000; Rhee et al., 2000) and in acute CNS slices (Khakh and Henderson, 1998; Kato and Shigetomi, 2001; Nakatsuka and Gu, 2001; Khakh et al., 2003). When limited to brain synapses, this study is the second example of release facilitation by direct Ca2+ entry through presynaptic P2X receptors, which was demonstrated recently in the hippocampal interneurons (Khakh et al., 2003). Unlike other cases of release facilitation with P2X receptor agonists, however, this is the first study demonstrating that this release facilitation was so potent that it made postsynaptic cells fire. Therefore, it is not simply a “more frequent noise” (Zucker, 2003) induced by ATP but rather an “ATP-triggered synaptic transmission.” In addition, this increased spontaneous release occurs only in excitatory synapses in the cNTS, which is highly consistent with the recent finding that the marked autonomic effect of αβmATP microinjected into cNTS is abolished by blockade of ionotropic glutamate receptors in anesthetized rats (Scislo and O'Leary, 2000). As such, in the cNTS, a simple rise in [ATP]o can initiate the excitatory synaptic transmission to the second-order neurons in the absence of presynaptic excitation and evoke downstream autonomic events. It would be interesting to determine whether endogenous ATP released in the cNTS after a stimulation of the hypothalamus, which has been recently demonstrated in vivo (Dale et al., 2002), or changes in the extracellular purine levels in the cerebrospinal fluid at the level of the fourth ventricle in response to hypoxia (Barraco et al., 1991) can trigger autonomic responses in the whole animal preparation through the enhanced glutamate release demonstrated in this study.
Possible mechanisms and neurophysiological significance of large minis
The most unusual result is that the increase in mEPSC frequency by P2X receptor activation was accompanied by a significant change in the amplitude distribution in ∼80% of neurons examined (neurons with large minis). This type of change in the miniature event amplitude has never been reported in any other preparation showing a robust increase in event frequency after P2X receptor activation.
How could the large minis occur in response to presynaptic P2X receptor activation? The properties of the large minis after P2X receptor activation compared with the basal minis revealed in this study are summarized as follows. First, large minis were dependent on extracellular Ca2+, whereas the spontaneous basal minis were not affected in the low [Ca2+]o solution (Fig. 3E). Second, the rise time of the large mini events was not significantly different from that of the basal minis (Fig. 4C). Third, large minis as well as basal minis did not require Ca2+ influx through VDCCs (Fig. 2E). Fourth, neither large minis nor basal minis depended on Ca2+ release from intracellular Ca2+ stores.
There have been only a few studies describing such an increase in miniature event amplitude after specific manipulations (Kang et al., 1998; Kombian et al., 2000; Sharma and Vijayaraghavan, 2003). It is not likely that the change in mEPSC amplitude resulted from a postsynaptic effect of αβmATP (Fig. 5). An involvement of AMPA-insensitive kainite receptors is also unlikely because the decay kinetics of the large minis were not slower but rather faster than the basal minis (Fig. 4C) (Cossart et al., 2002). As described in Results, it is not likely that the large minis resulted from spatial summation of independent events occurring at distant multiple postsynaptic sites, unlike the large minis after nicotine application in the CA3 (Sharma and Vijayaraghavan, 2003) and high-frequency afferent stimulation in the supraoptic nucleus (Kombian et al., 2000). A selective activation of synapses located more proximally to the soma that undergo less dendritic filtering, as in the case of large-amplitude mIPSCs in CA1 after astrocytes stimulation (Kang et al., 1998), is also unlikely because lesser dendritic filtering should result in a shorter rise time (Magee, 2000). In addition, the fast rise of large minis rules out the possibility that diffused glutamate activated a larger number of receptors at nearby postsynaptic sites; this should result in a longer rise time because of slower diffusion. It is also less likely that αβmATP activated specific terminals at which large monoquantal release occurs such as in mossy fiber to CA3 synapses (Henze et al., 2002), because in most of neurons, spontaneous events with large amplitude comparable with large minis did not appear even during a long (5 to >10 min) observation period before αβmATP application (Figs. 1A,3A,E,4A,5A).
A most likely interpretation compatible with all of these results is that the Ca2+ entry through presynaptic P2X receptors resulted in a localized rise in [Ca2+]i in close proximity to the active zone, which triggered highly synchronized exocytosis of multiple readily releasable vesicles docked at single release sites. This synchronized multivesicular release generated larger-amplitude mEPSCs than the basal minis; most of the latter occurs through mechanisms independent of Ca2+, leading to nonsynchronized monovesicular releases and smaller monoquantal mEPSCs (Vautrin and Barker, 2003). It has been demonstrated that multivesicular release at single release sites does occur in response to a single action potential (Tong and Jahr, 1994; Oertner et al., 2002). In this sense, presynaptic P2X receptors in the cNTS have potential roles as “exocytosis-linked Ca2+ channels” activated by extracellular ATP, which triggers highly synchronized Ca2+-dependent release of multiple vesicles. Therefore, this study provides a novel presynaptic mechanism for changes in the action potential-independent event amplitude after specific manipulation in the central synapses. Issues that remain to be addressed in future studies to support this interpretation include (1) ultrastructural and proteomic demonstration of the spatial and molecular relationship between presynaptic P2X receptors and release machinery, which allows such a highly synchronized exocytosis, and (2) demonstration of the origin of endogenous ATP that can activate these presynaptic P2X receptors underlying large minis.
P2X receptor subtypes
As with many other native systems in situ, the pharmacological data obtained in the present study are not entirely consistent with any of the recombinant P2X receptors documented to date (Patel et al., 2001; North, 2002). The homomeric P2X1, P2X2, and P2X3 receptors and heteromeric P2X2/3 and P2X1/5 receptors are not likely to be involved because the IC50 of TNP-ATP in blocking the release facilitation was ∼1 μm, a value 300–1000-fold larger than that for the recombinant P2X1, P2X3, and P2X2/3 receptors (North, 2002) (however, the degree at which TNP-ATP is degraded in the acute slice is unknown). αβMATP is inactive to homomeric P2X2, P2X4, and P2X5 receptors and heteromeric P2X2/6 receptors (North, 2002). BzATP (100 μm) did not exert an effect similar to that by αβmATP and ATP (our unpublished observation), excluding an involvement of homomeric P2X7 receptors (Deuchars et al., 2001). Our unpublished observation that αβmATP was much more potent than ATP in increasing mEPSC frequency rules out an involvement of heteromeric P2X4/6 receptors (Lê et al., 1998) (however, ATP is more prone to extracellular breakdown than αβmATP). We therefore suggest the possibility that P2X receptors of unidentified subunit composition, or under postexpressional modification, underlie the release facilitation with P2X agonists in this study (Patel et al., 2001). Involvement of presynaptic P2Y receptors, activation of which might increase [Ca2+]i through stimulation of IP3 production, is little, if any, because (1) αβmATP is a very weak or inactive agonist to most of cloned P2Y receptors (Ralevic and Burnstock, 1998), (2) TNP-ATP is suggested to be a selective antagonist to P2X receptors (Wildman et al., 2003), and (3) blockade of intracellular Ca2+ mobilization did not significantly affect the effects of αβmATP.
Conclusion
The functional significance of the widespread expression of P2X receptors in the brain remains unclear. The fast synaptic transmission mediated by ATP and P2X receptors is found in a limited number of structures, and its influence on postsynaptic excitability is much weaker than the predominant glutamatergic transmission (North, 2002; Khakh et al., 2003). P2X receptor proteins are found also in many presynaptic structures in the CNS (Collo et al., 1996; Vulchanova et al., 1997; Llewellyn-Smith and Burnstock, 1998; Atkinson et al., 2000; Khakh and Henderson, 2000). It is highly possible that, because of their high Ca2+ permeability, P2X receptors are directly coupled to exocytosis in many other CNS structures, where a rise in [ATP]o can play a role similar to the presynaptic excitation in triggering the synaptic transmission, as shown here in the cNTS. This mechanism might be of particular importance especially in the cases in which ATP is released from astrocytes that surround presynaptic and postsynaptic structures (Newman, 2003), providing a novel form of glia–neuron interaction in CNS synapses.
Footnotes
This work was supported by Grants-in-Aid 13680902 and 15650071 from the Ministry of Education, Culture, Sports, Science and Technology, Japan and Grants for the Research on Health Sciences Focusing on Drug Innovation from The Japan Health Sciences Foundation (KH21014) to F.K. Scientific and linguistic comments on this manuscript by H. A. McLean (Centre National de la Recherche Scientifique, Gif-sur-Yvette, France) and comments on a previous version of this manuscript by Y. Yanagawa (National Institute for Physiological Sciences, Okazaki, Japan) are acknowledged. We thank T. Matsuo for expert assistance with the experiments and during preparation of this manuscript.
Correspondence should be addressed to Fusao Kato, Laboratory of Neurophysiology, Department of Neuroscience, Jikei University School of Medicine, 3-25-8 Nishi-shimbashi, Minato, Tokyo 105-8461, Japan. E-mail: fusao@jikei.ac.jp.
DOI:10.1523/JNEUROSCI.0090-04.2004
Copyright © 2004 Society for Neuroscience 0270-6474/04/243125-11$15.00/0
References
- Andresen MC, Kunze DL (1994) Nucleus tractus solitarius: gateway to neural circulatory control. Annu Rev Physiol 56: 93–116. [DOI] [PubMed] [Google Scholar]
- Atkinson L, Batten TFC, Deuchars J (2000) P2X2 receptor immunoreactivity in the dorsal vagal complex and area postrema of the rat. Neuroscience 99: 683–696. [DOI] [PubMed] [Google Scholar]
- Barraco RA, Walter GA, Polasek PM, Phillis JW (1991) Purine concentrations in the cerebrospinal fluid of unanesthetized rats during and after hypoxia. Neurochem Int 18: 243–248. [DOI] [PubMed] [Google Scholar]
- Bisserbe JC, Patel J, Marangos PJ (1985) Autoradiographic localization of adenosine uptake sites in rat brain using [3H]nitrobenzylthioinosine. J Neurosci 5: 544–550. [DOI] [PMC free article] [PubMed] [Google Scholar]
- Capiod T (1998) ATP-activated cation currents in single guinea-pig hepatocytes. J Physiol (Lond) 507: 795–805. [DOI] [PMC free article] [PubMed] [Google Scholar]
- Champagnat J, Denavit-Saubié M, Grant K, Shen KF (1986) Organization of synaptic transmission in the mammalian solitary complex, studied in vitro. J Physiol (Lond) 381: 551–573. [DOI] [PMC free article] [PubMed] [Google Scholar]
- Collo G, North RA, Kawashima E, Merlo-Pich E, Neidhart S, Surprenant A, Buell G (1996) Cloning of P2X5 and P2X6 receptors and the distribution and properties of an extended family of ATP-gated ion channels. J Neurosci 16: 2495–2507. [DOI] [PMC free article] [PubMed] [Google Scholar]
- Cossart R, Epsztein J, Tyzio R, Becq H, Hirsch J, Ben-Ari Y, Crepel V (2002) Quantal release of glutamate generates pure kainate and mixed AMPA/kainate EPSCs in hippocampal neurons. Neuron 35: 147–159. [DOI] [PubMed] [Google Scholar]
- Dale N, Gourine AV, Llaudet E, Bulmer D, Thomas T, Spyer KM (2002) Rapid adenosine release in the nucleus tractus solitarii during defence response in rats: real-time measurement in vivo. J Physiol (Lond) 544: 149–160. [DOI] [PMC free article] [PubMed] [Google Scholar]
- Deuchars SA, Atkinson L, Brooke RE, Musa H, Milligan CJ, Batten TFC, Buckley NJ, Parson SH, Deuchars J (2001) Neuronal P2X7 receptors are targeted to presynaptic terminals in the central and peripheral nervous systems. J Neurosci 21: 7143–7152. [DOI] [PMC free article] [PubMed] [Google Scholar]
- Fortin G, Champagnat J (1993) Spontaneous synaptic activities in rat nucleus tractus solitarius neurons in vitro: evidence for re-excitatory processing. Brain Res 630: 125–135. [DOI] [PubMed] [Google Scholar]
- Gu JG, MacDermott AB (1997) Activation of ATP P2X receptors elicits glutamate release from sensory neuron synapses. Nature 389: 749–753. [DOI] [PubMed] [Google Scholar]
- Henze DA, McMahon DB, Harris KM, Barrionuevo G (2002) Giant miniature EPSCs at the hippocampal mossy fiber to CA3 pyramidal cell synapse are monoquantal. J Neurophysiol 87: 15–29. [DOI] [PubMed] [Google Scholar]
- Hugel S, Schlichter R (2000) Presynaptic P2X receptors facilitate inhibitory GABAergic transmission between cultured rat spinal cord dorsal horn neurons. J Neurosci 20: 2121–2130. [DOI] [PMC free article] [PubMed] [Google Scholar]
- Jean A (1991) Le noyau du faisceau solitaire: aspects neuroanatomiques, neurochimiques et fonctionnels. Arch Int Physiol Biochem Biophys 99: A3–A52. [DOI] [PubMed] [Google Scholar]
- Kang J, Jiang L, Goldman SA, Nedergaard M (1998) Astrocyte-mediated potentiation of inhibitory synaptic transmission. Nat Neurosci 1: 683–692. [DOI] [PubMed] [Google Scholar]
- Kanjhan R, Housley GD, Burton LD, Christie DL, Kippenberger A, Thorne PR, Luo L, Ryan AF (1999) Distribution of the P2X2 receptor subunit of the ATP-gated ion channels in the rat central nervous system. J Comp Neurol 407: 11–32. [PubMed] [Google Scholar]
- Kato F, Shigetomi E (2001) Distinct modulation of evoked and spontaneous EPSCs by purinoceptors in the nucleus tractus solitarii of the rat. J Physiol (Lond) 530: 469–486. [DOI] [PMC free article] [PubMed] [Google Scholar]
- Kawai Y, Senba E (1996) Organization of excitatory and inhibitory local networks in the caudal nucleus of tractus solitarius of rats revealed in in vitro slice preparation. J Comp Neurol 373: 309–321. [DOI] [PubMed] [Google Scholar]
- Khakh BS (2001) Molecular physiology of P2X receptors and ATP signalling at synapses. Nat Rev Neurosci 2: 165–174. [DOI] [PubMed] [Google Scholar]
- Khakh BS, Henderson G (1998) ATP receptor-mediated enhancement of fast excitatory neurotransmitter release in the brain. Mol Pharmacol 54: 372–378. [DOI] [PubMed] [Google Scholar]
- Khakh BS, Henderson G (2000) Modulation of fast synaptic transmission by presynaptic ligand-gated cation channels. J Auton Nerv Syst 81: 110–121. [DOI] [PubMed] [Google Scholar]
- Khakh BS, Gittermann D, Cockayne DA, Jones A (2003) ATP modulation of excitatory synapses onto interneurons. J Neurosci 23: 7426–7437. [DOI] [PMC free article] [PubMed] [Google Scholar]
- Kombian SB, Hirasawa M, Mouginot D, Chen X, Pittman QJ (2000) Short-term potentiation of miniature excitatory synaptic currents causes excitation of supraoptic neurons. J Neurophysiol 83: 2542–2553. [DOI] [PubMed] [Google Scholar]
- Lawrence AJ, Jarrott B (1996) Neurochemical modulation of cardiovascular control in the nucleus tractus solitarius. Prog Neurobiol 48: 21–53. [DOI] [PubMed] [Google Scholar]
- Lê K-T, Babinski K, Séguéla P (1998) Central P2X4 and P2X6 channel subunits coassemble into a novel heteromeric ATP receptor. J Neurosci 18: 7152–7159. [DOI] [PMC free article] [PubMed] [Google Scholar]
- Llewellyn-Smith IJ, Burnstock G (1998) Ultrastructural localization of P2X3 receptors in rat sensory neurons. NeuroReport 9: 2545–2550. [DOI] [PubMed] [Google Scholar]
- Magee JC (2000) Dendritic integration of excitatory synaptic input. Nat Rev Neurosci 1: 181–190. [DOI] [PubMed] [Google Scholar]
- Nabekura J, Ueno S, Ogawa T, Akaike N (1995) Colocalization of ATP and nicotinic ACh receptors in the identified vagal preganglionic neurone of rat. J Physiol (Lond) 489: 519–527. [DOI] [PMC free article] [PubMed] [Google Scholar]
- Nakatsuka T, Gu JG (2001) ATP P2X receptor-mediated enhancement of glutamate release and evoked EPSCs in dorsal horn neurons of the rat spinal cord. J Neurosci 21: 6522–6531. [DOI] [PMC free article] [PubMed] [Google Scholar]
- Newman EA (2003) New roles for astrocytes: regulation of synaptic transmission. Trends Neurosci 26: 536–542. [DOI] [PubMed] [Google Scholar]
- North RA (2002) Molecular physiology of P2X receptors. Physiol Rev 82: 1013–1067. [DOI] [PubMed] [Google Scholar]
- Oertner TG, Sabatini BL, Nimchinsky EA, Svoboda K (2002) Facilitation at single synapses probed with optical quantal analysis. Nat Neurosci 5: 657–664. [DOI] [PubMed] [Google Scholar]
- Patel MK, Khakh BS, Henderson G (2001) Properties of native P2X receptors in rat trigeminal mesencephalic nucleus neurones: lack of correlation with known, heterologously expressed P2X receptors. Neuropharmacology 40: 96–105. [DOI] [PubMed] [Google Scholar]
- Ralevic V, Burnstock G (1998) Receptors for purines and pyrimidines. Pharmacol Rev 50: 413–492. [PubMed] [Google Scholar]
- Rhee JS, Wang ZM, Nabekura J, Inoue K, Akaike N (2000) ATP facilitates spontaneous glycinergic IPSC frequency at dissociated rat dorsal horn interneuron synapses. J Physiol (Lond) 524: 471–483. [DOI] [PMC free article] [PubMed] [Google Scholar]
- Robertson SJ, Ennion SJ, Evans RJ, Edwards FA (2001) Synaptic P2X receptors. Curr Opin Neurobiol 11: 378–386. [DOI] [PubMed] [Google Scholar]
- St. Lambert JH, Thomas T, Burnstock G, Spyer KM (1997) A source of adenosine involved in cardiovascular responses to defense area stimulation. Am J Physiol 272: R195–R200. [DOI] [PubMed] [Google Scholar]
- Scislo TJ, O'Leary DS (2000) Differential role of ionotropic glutamatergic mechanisms in responses to NTS P2X and A2a receptor stimulation. Am J Physiol 278: H2057–H2068. [DOI] [PubMed] [Google Scholar]
- Scislo TJ, Kitchen AM, Augustyniak RA, O'Leary DS (2001) Differential patterns of sympathetic responses to selective stimulation of nucleus tractus solitarius purinergic receptor subtypes. Clin Exp Pharmacol Physiol 28: 120–124. [DOI] [PubMed] [Google Scholar]
- Sharma G, Viijayaraghavan S (2003) Modulation of presynaptic store calcium induces release of glutamate and postsynaptic firing. Neuron 38: 929–939. [DOI] [PubMed] [Google Scholar]
- Tong G, Jahr CE (1994) Multivesicular release from excitatory synapses of cultured hippocampal neurons. Neuron 12: 51–59. [DOI] [PubMed] [Google Scholar]
- Van Giersbergen PLM, Palkovits M, De Jong W (1992) Involvement of neurotransmitters in the nucleus tractus solitarii in cardiovascular regulation. Physiol Rev 72: 789–824. [DOI] [PubMed] [Google Scholar]
- Vautrin J, Barker JL (2003) Presynaptic quantal plasticity: Katz's original hypothesis revisited. Synapse 47: 184–199. [DOI] [PubMed] [Google Scholar]
- von Kügelgen I, Wetter A (2000) Molecular pharmacology of P2Y-receptors. Naunyn Schmiedebergs Arch Pharmacol 362: 310–323. [DOI] [PubMed] [Google Scholar]
- Vulchanova L, Riedl MS, Shuster SJ, Buell G, Surprenant A, North RA, Elde R (1997) Immunohistochemical study of the P2x2 and P2x3 receptor subunits in rat and monkey sensory neurons and their central terminals. Neuropharmacology 36: 1229–1242. [DOI] [PubMed] [Google Scholar]
- Wildman SS, Unwin RJ, King BF (2003) Extended pharmacological profiles of rat P2Y2 and rat P2Y4 receptors and their sensitivity to extracellular H+ and Zn2+ ions. Br J Pharmacol 140: 1177–1186. [DOI] [PMC free article] [PubMed] [Google Scholar]
- Yao ST, Barden JA, Lawrence AJ (2001) On the immunohistochemical distribution of ionotropic P2X receptors in the nucleus tractus solitarius of the rat. Neuroscience 108: 673–685. [DOI] [PubMed] [Google Scholar]
- Zimmermann H (2000) Extracellular metabolism of ATP and other nucleotides. Naunyn Schmiedebergs Arch Pharmacol 362: 299–309. [DOI] [PubMed] [Google Scholar]
- Zucker RS (2003) Can a synaptic signal arise from noise? Neuron 38: 845–846. [DOI] [PubMed] [Google Scholar]