

Abstract
Identifying the cells and circuits that underlie perception, behavior, and learning is a central goal of contemporary neuroscience. Although techniques such as lesion analysis, functional magnetic resonance imaging, 2-deoxyglucose studies, and induction of gene expression have been helpful in determining the brain areas responsible for particular functions, these methods are technically limited. Currently, there is no method that allows for the identification and electrophysiological characterization of individual neurons that are associated with a particular function in living tissue. We developed a strain of transgenic mice in which the expression of the green fluorescent protein (GFP) is controlled by the promoter of the activity-dependent gene c-fos. These mice enable an in vivo or ex vivo characterization of the cells and synapses that are activated by particular pharmacological and behavioral manipulations. Cortical and subcortical fosGFP expression could be induced in a regionally restricted manner after specific activation of neuronal ensembles. Using the fosGFP mice to identify discrete cortical areas, we found that neurons in sensory-spared areas rapidly regulate action potential threshold and spike frequency to decrease excitability. This method will enhance our ability to study the way neuronal networks are activated and changed by both experience and pharmacological manipulations. In addition, because activated neurons can be functionally characterized, this tool may enable the development of better pharmaceuticals that directly affect the neurons involved in disease states.
Keywords: hypothalamus, schizophrenia, transcription, c-fos, GFP, transgenic, activity-dependent, in vivo, barrel cortex, drug discovery
Introduction
Neurons respond to increased activity by changing levels of gene expression, and this feature has been used to functionally map the CNS. Monitoring expression of immediate-early genes such as c-fos, zif268, and junB has been extraordinarily useful in identifying brain areas involved in behavioral, emotional, physiological, and pharmacological states. Of these genes, c-fos has been used most widely for several reasons, including low levels of basal expression, broad dynamic range of mRNA and protein levels, and short half-life of both mRNA and protein (for review, see Gall et al., 1998). The utility of c-fos as a marker for neural activity is underscored by its induction by a wide array of stimuli, including seizure (Morgan et al., 1987), cortical injury (Sharp et al., 1990), pain (Naranjo et al., 1991), odor exposure (Guthrie et al., 1993), somatosensory stimulation (Mack and Mack, 1992), dehydration (Sagar et al., 1988), and long-term potentiation (Cole et al., 1989; French et al., 2001). c-fos has also been used to map developmental changes in neural circuitry (Rinaman et al., 1997), as well as to compare mechanisms of drug efficacy (Nguyen et al., 1992).
Fos is a member of the AP-1 (activator protein-1) family of transcription factors and binds to DNA with a Jun family member as a heterodimer (Curran and Franza, 1988). Protein abundance and AP-1 activity are regulated by extracellular signals (Curran, 1988), and a large number of signal transduction pathways, including cAMP (Kruijer et al., 1985), Ca2+ (Morgan and Curran, 1986), MAPK (mitogen-activated protein kinase) (Bernstein et al., 1994), and CAMKIV (calmodulin kinase IV) (Ho et al., 1996; Krebs and Honegger, 1996), can modulate Fos and thus AP-1 activity. The AP-1 transcription factor can activate downstream gene expression, and its binding site is found in a large number of promoters. Because c-fos expression is correlated with learning (Rosen et al., 1992; Mower, 1994; Guzowski et al., 2000, 2001; Fleischmann et al., 2003), the downstream targets of c-fos are of considerable interest (Lanahan and Worley, 1998). How expression of these downstream genes can be translated into changes in neuronal excitability and synaptic efficacy is not fully understood.
c-fos in situ hybridization, immunohistochemistry, or c-fos promoter-mediated reporter gene expression (Schilling et al., 1991; Smeyne et al., 1992; Wilson et al., 2002) provide both regional and cellular resolution for neural subsets that are activated by behavioral or pharmacological stimuli and have complemented other imaging techniques, such as 2-deoxyglucose labeling, lesion studies, and functional magnetic resonance imaging. However, it has been difficult to identify functional changes, in particular neurons in which c-fos expression has been activated, because alterations in gene expression are monitored after tissue fixation. Thus, the dynamic membrane properties of activated cells, as well as their pharmacological sensitivities, are lost. Especially where gene expression might be altered to consolidate learning and alter neuronal function, it would be advantageous to examine the electrophysiological properties of activated cells. Towards this end, we created mice that are transgenic for a fosGFP fusion protein that is driven by the c-fos promoter.
fosGFP transgene expression was examined using three different protocols, encompassing behavioral, physiological, and pharmacological stimuli. Specific fosGFP expression was observed in living brain slices after single-whisker rearing and was not induced by conditions of tissue preparation. The time course of fosGFP induction and degradation was similar to endogenous c-fos expression both in vivo and in brain slices. We used these transgenic mice to investigate changes in the dynamic membrane properties of cortical neurons after alteration of sensory input, finding that excitability is homeostatically regulated to decrease the likelihood and rate of firing in sensory-stimulated cortical areas compared with adjacent sensory-deprived regions. These experiments demonstrate the utility of the fosGFP transgenic mice for a wide variety of applications.
Materials and Methods
Construction of the fosGFP transgene. The fosGFP mice were generated by fusing the c-fos promoter and the c-fos coding region, including exons and introns, to the coding region for enhanced green fluorescent protein (EGFP), creating a fosGFP C-terminus fusion protein. The 5′ end of the construct is derived from mouse genomic c-fos DNA (gift from T. Curran, St. Jude Children's Research Hospital, Memphis, TN), beginning from a HindIII site that is located 218 nucleotides from the first cAMP response element (CRE) binding site in the c-fos promoter (∼709 nucleotides from the start ATG codon) and including all exon and intron sequences. The gene for EGFP has been fused in frame to the last exon, and the poly(A) tail is derived from the IRES (phosphorylated-internal ribosomal entry site)-EGFP Clontech (Cambridge, UK) vector (Fig. 1). Thus, EGFP expression should follow c-fos activation. GFP expression was verified by CaPO4 transient transfection of the construct into 293 fibroblasts (data not shown).
Figure 1.

Structure of the fosGFP fusion transgene. The promoter and coding region from the murine c-fos gene was fused in frame to EGFP to create a C-terminal fosGFP fusion protein.
Generation of transgenic mice. The linearized construct was excised from the vector and gel purified using the Qiaex II fragment purification system, in which DNA was eluted into microinjection buffer containing 10 mm Tris-Cl and 0.1 mm EDTA, pH 7.4. The DNA solution was filtered using a 0.45 μm spin filter (Millipore, Bedford, MA) and injected at a concentration of 90 ng/μl into fertilized oocytes that were derived from an F1 DBA×C57BL/6 strain (Stanford Microinjection Facility, Stanford University, Palo Alto, CA). Nine founder lines were recovered.
Genotyping and animal care. Germ-line transmission of the gene in each line was verified using PCR to detect the EGFP transgene. PCR primers were directed against regions of the EGFP transgene and were as follows: EGFP-1, ACTGTACTCGAGTATGGTGAGCAAGGGCGAG; EGFP-2, ACTGTAGAATTCACCACAACTAGAATGCACTCG. Of the nine lines, one did not transmit the transgene to offspring. Transgenic lines were maintained as heterozygotes and were crossed multiple generations (two to five) into C57BL/6. Animals were used at 2-12 weeks of age and were maintained in single-sex cages with littermates (up to five per cage). Animal housing was in accordance with National Institutes of Health guidelines. For analysis of fosGFP expression under basal conditions, animals were not subject to any experimental protocol and were killed within 10 min of removal from their home cage with isoflurane anesthesia, followed by decapitation.
Induction of fosGFP expression: sensory stimulation. To verify accurate expression of the transgene, animals were subjected to a single-whisker rearing protocol that is known to induce c-fos expression in the spared whisker barrel in the cortex (Staiger et al., 2002). Briefly, animals were anesthetized with isoflurane, and all but the D1 whisker from the large mystacial whisker pad were unilaterally removed. Animals were then allowed to recover in their home cage for 24 hr. Animals were then killed, and tissue was prepared for slice electrophysiology (see below) or fixed directly in 4% paraformaldehyde (PFA) in 0.1 m phosphate buffer (PB) for ∼12 hr before cryoprotection in 30% sucrose in 0.1 m phosphate buffer and tissue sectioning.
Induction of fosGFP expression: clozapine injection. The atypical antipsychotic clozapine was injected into 4- to 8-week-old fosGFP transgenics (30 mg/kg body weight, i.p.). Animals were killed 2 hr after the injection, and brains were fixed in PFA as described above.
Induction of fosGFP expression: osmotic stimulation. To induce fosGFP expression in subcortical areas, a hypertonic saline stimulus was used to evoke transgene expression in the paraventricular nucleus (PVN) of the hypothalamus. Hypertonic saline (2 m NaCl; 10 μl/gm body weight) was injected intraperinoneally into transgenic mice, followed by water deprivation for a period of 2 hr. Animals were then killed or supplied with water ad libitum for a period of 2-6 hr before being killed to evaluate the persistence of fosGFP fluorescence after cessation of dehydration. Tissue was prepared for slice electrophysiology or fixed as indicated above. The number of fosGFP+ cells within a fixed area of the PVN, from a single 50-μm-thick tissue section for each animal, was assessed by two independent observers who were both blind to experimental condition.
Preparation of brain slices for electrophysiology and imaging. Animals were anesthetized with isoflurane, and slices (100-400 μm) were prepared in ice-cold, bicarbonate-buffered solution [artificial CSF (ACSF)] saturated with 95% O2-5% CO2 (in mm: 119 NaCl, 2.5 KCl, 1.0 NaH2PO4, 1.3 MgCl2, 2.5 CaCl2, 26.2 NaHCO3, and 11 glucose). After preparation of slices, tissue was maintained at room temperature in the same ACSF solution for the duration of the experiment. To avoid GFP bleaching or fluorescence-induced toxicity in experiments in which the same area of brain was imaged repeatedly over a period of hours, the tissue was illuminated for a short period of time, typically ∼10 sec, to focus and record the image.
Immunohistochemistry. Tissue was fixed for 2-12 hr at 4°C and then sunk in a 30% sucrose, 0.1 m PB solution over a period of days. Floating sections (50 μm) were prepared, and tissue was rinsed in 0.1 m PB before immunostaining. Sections were then washed in 0.1 m PB with 0.1% Triton X-100 (PBT) for 30 min and blocked in PBT with 5% normal donkey serum (Jackson ImmunoResearch, West Grove, PA) for 1 hr. Primary antibody (Ab5 anti-Fos; Oncogene Sciences, Uniondale, NY) was diluted 1:10,000 in blocking solution, and sections were incubated overnight at room temperature in this solution. Sections were washed in three changes of PBT and then incubated in a Cy3-conjugated secondary antibody (Cy3 anti-rabbit; Jackson ImmunoResearch) at a 1:500 dilution in blocking solution. Sections were then washed three times in PBT before being mounted in gelvatol on slides.
Imaging and quantitation of double-labeled cells. Photographs of living or immunostained tissue were taken with a Retiga 1300 CCD-cooled camera (Q Imaging; Southern Micro Instruments, Marietta, GA) that was mounted on an Olympus Opitcal (Melville, NY) BX51W1. Low-magnification pictures were taken using an Olympus Optical XLFluor4X/340 objective with a 0.28 numerical aperture. However, green fluorescent cells were sometimes bright enough to be visible at low magnification (4×) through the eyepiece of the microscope, without signal integration through the camera. For fluorescence quantitation, images from D1-only or control cortex were obtained using an Olympus Optical 1X50 inverted microscope that was equipped with a Solamere Technology Group (Salt Lake City, UT) spinning disk confocal system with QED (Vancouver, British Columbia, Canada) software for image acquisition and processing, and pixel intensity was calculated using ImageJ software (NIH Image).
Electrophysiology. Layer II-III neurons in the barrel cortex were targeted for whole-cell recording. Experiments were performed at room temperature (22-24°C) in ACSF, using an internal solution composed of the following: 125 mm potassium gluconate, 10 mm HEPES, 2 mm KCl, 4 mm Mg-ATP, 0.25 mm Na-GTP, 50 μm Alexa-568, and 5 mg/ml biocytin. Resting potential was determined within several minutes after break-in. Threshold for action potential was calculated from a single action potential at rheobase current. This was determined by a 400 msec pulse of increasing current amplitude at 5 pA increments until a single spike was elicited. Subsequently, current pulses at larger amplitudes were administered to examine spike accommodation. Input resistance was calculated by delivering a 20 pA hyperpolarizing pulse that preceeded the 400 msec depolarizing current pulse. In general, the experimenter alternated between targeting fosGFP+ and fosGFP- neurons during the course of an experiment, such that data sets for fosGFP+ and fosGFP- neurons were matched.
Results
Characterization of fosGFP transgenic mice
Nine founder lines were obtained from two sets of DNA micro-injections. One line did not produce transgenic offspring, and two other lines did not show appreciable levels of fosGFP expression in the brain. Six lines showed more than ∼30% transmission of the transgene after multiple backcrosses to C57BL/6 and were further evaluated (Table 1). The transgene was maintained in heterozygotes, and transgenic animals were viable and showed a normal lifespan (≤1 year). Of the six lines subjected to additional characterization, expression under basal conditions in multiple brain areas, including hippocampus, cerebellum, olfactory bulb, and neocortex, was examined (data not shown). Transgenic lines differed with respect to basal levels of gene expression in different brain areas. Under basal conditions, little or no fosGFP expression was observed in the cerebellum. Expression in the olfactory bulb was also variable between lines. Hippocampal and neocortical expression was observed in all transgenic lines. Four transgenic lines (1-3, 4-1, 5-1, and 6-1) with slightly different levels of basal expression or transgene inducibility in the CNS were selected for additional analysis.
Table 1.
Summary of initial evaluation of fosGFP transgenic lines
|
Line |
Percent transgenica |
Percentage of transgenics with GFP fluorescenceb |
|---|---|---|
| 1-1 | 59.5 (n = 74) | 50.0 (n = 6) |
| 1-2 | 49.2 (n = 193) | 46.2 (n = 13) |
| 1-3 | 51.2 (n = 363) | 91.7 (n = 48) |
| 4-1 | 50.0 (n = 346) | 100 (n = 34) |
| 4-2 | 46.2 (n = 117) | 46.2 (n = 13) |
| 4-4 | N/Ac | N/Ac |
| 4-5 | 36.4 (n = 99) | 55.6 (n = 9) |
| 5-1 | 57.3 (n = 349) | 76.5 (n = 17) |
| 6-1 |
34.5 (n = 229) |
90.9 (n = 11) |
Animals were bred as heterozygotes and were crossed to wild-type C57BL/6 mice for one to five generations. Percentages reflect the number of transgenics per wild-type plus transgenics for all backcrosses in a given line. The number of transgenic animals in a litter was expected to be 50% if transgene inheritance was Mendelian. The total number of animals that were genotyped, both transgenic and wild type, is listed in parentheses.
Not all transgenic animals exhibited fosGFP-fluorescent cells in the brain under stimulated or basal conditions. The penetrance of transgene expression was assessed by the presence of fosGFP fluorescence in the CNS by inspection. The total number of transgenic animals examined for this criterion is listed in parentheses.
Line 4-4 showed no transgenic offspring in the first backcross and was not subject to further analysis. N/A, Not applicable.
fosGFP induction in PVN after dehydration
A robust stimulus for c-fos expression is physiological dehydration (Rinaman et al., 1997; Wilson et al., 2002). Transgenic animals were injected with a concentrated saline solution (to induce serum hypertonicity) and also deprived of water, a protocol that activates c-fos expression in the magnocellular and parvocellular neurons of the PVN (Giovannelli et al., 1990). Hypertonic saline injection into fosGFP animals also induced strong GFP fluorescence in neurons of the PVN (Fig. 2). Control animals injected with isotonic PBS showed few, if any, GFP-expressing neurons within these brain areas. Significant dehydration-induced activation of fosGFP expression in the PVN was observed in two transgenic lines, 4-1 and 6-1.
Figure 2.
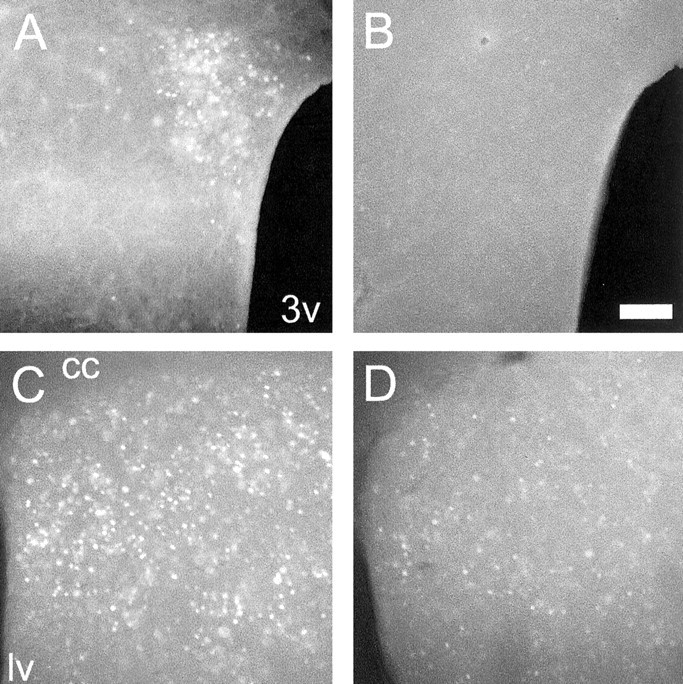
fosGFP induction after physiological and pharmacological stimuli. A, B, fosGFP expression is induced in the PVN after dehydration (A) but not in control, PBS-injected animals (B; line 6-1 shown). 3v, Third ventricle. C, D, Clozapine stimulates increased fosGFP expression in the striatum (C) compared with control, PBS-injected animals (D). cc, Corpus callosum; lv, lateral ventricle. Scale bar, 100 μm.
Pharmacological induction of fosGFP
The atypical antipsychotic clozapine has been a successful agent for the treatment of schizophrenia and dementia. Because of its therapeutic relevance, we selected clozapine as a pharmacological agent with which to monitor transgene induction in the fosGFP transgenic mice. Although its mechanism of action in different brain areas is unclear (it has an affinity for dopamine, serotonin, adrenergic, and cholinergic receptors), administration of this drug induces a characteristic pattern of c-fos expression throughout the CNS (Wan et al., 1995). Indeed, a better understanding of how this compound alters neural activity and induces c-fos expression in distinct populations of neurons might improve efforts at developing new therapeutically relevant compounds.
Clozapine administration induced fosGFP-fluorescent neurons in a variety of brain areas that have been shown to express c-fos under these conditions, whereas PBS-injected animals showed little or no signal in the comparable brain areas. In particular, we monitored fosGFP+ neurons in prefrontal-cingulate cortex, the lateral septal nucleus, regions of the nucleus accumbens, and the striatum. Two fosGFP transgenic lines, 1-3 and 5-1, showed strong fosGFP induction compared with control PBS-injected animals (Fig. 2C,D, line 5-1).
fosGFP induction in barrel cortex
Single-whisker rearing has been shown to induce gene expression in the barrel cortex within a few hours (Rocamora et al., 1996; Barth et al., 2000; Staiger et al., 2000, 2002). This gene expression may proceed by a cAMP response element-binding protein-dependent pathway and may be related to the induction of plasticity in the neocortex (Barth et al., 2000). Preliminary evidence suggested that CRE-mediated gene transcription and c-fos expression occurred in the same subset of cells (A. L. Barth and K. D. Fox, unpublished data), which is not surprising given that the c-fos promoter contains a CRE site. We investigated fosGFP transgene induction after plucking all but one of the large mystacial vibrissae, whisker D1.
To verify that expression was restricted to the spared whisker barrel, some brains were flattened after fixation so that individual barrels could be identified in a tangential plane of section. In these cases, cells in layer IV of the spared barrel were clearly labeled with GFP, whereas cells in adjacent, deprived barrels showed little expression (Fig. 3A,B). The spared barrel was also identifiable in coronal sections of living brain tissue, and, because this preparation enabled us to observe layer-specific patterns of gene activation, it was used for subsequent analysis (Fig. 3C). The greatest number of labeled cells was in layer IV (Fig. 3D). A sub-population of cells in supragranular layers expressed high levels of GFP, brighter than that observed in layer IV (Figs. 3E, 4), and GFP-expressing neurons were also observed in infragranular layers. For both supragranular and infragranular layers, GFP-expressing cells were not precisely restricted to the barrel column, as has also been observed with Fos immunohistochemistry. In general, all four transgenic lines selected for additional analysis showed fosGFP induction in the barrel cortex after single-whisker rearing.
Figure 3.
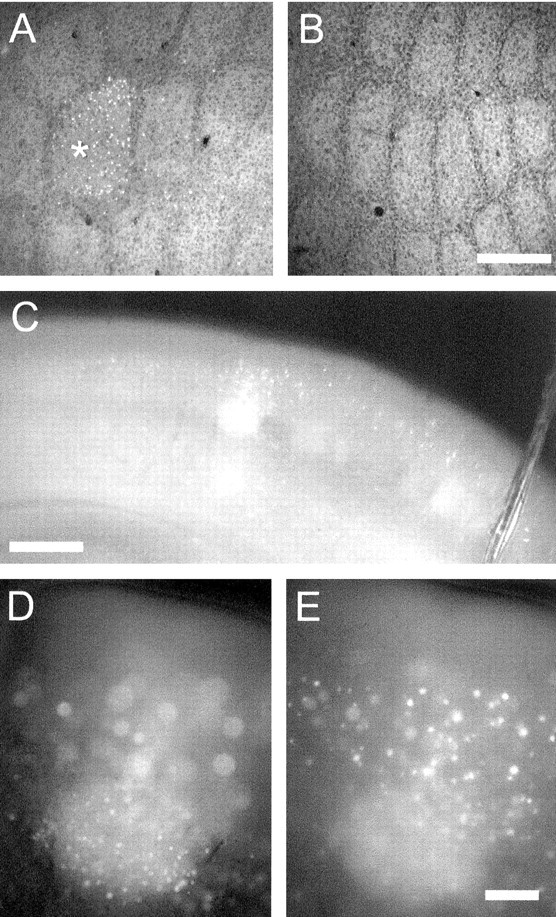
Sensory-induced expression of fosGFP in living brain tissue. All but a single large facial vibrissa, whisker D1, were removed by plucking from a fosGFP transgenic mouse (line 1-3, line 4-1, or line 5-1), aged ∼4 weeks. The animal was returned to its home cage for 24 hr before brain slices were prepared. A, Fixed and flattened section of cortex from the deprived hemisphere, showing fosGFP fluorescence in cells from layer IV of the spared whisker barrel, D1 (indicated by asterisk). B, Fixed and flattened cortex from the contralateral, unplucked hemisphere showing no fosGFP signal in the barrels. Scale bar, 100 μm. C, Low-magnification view of a coronal section of cortex, showing a single medial barrel that corresponds to the D1 whisker showing strong GFP fluorescence in living tissue. Scale bar, 200 μm. D, High-magnification view of C, with layer IV of the spared barrel in focus. Note the sharp edges delineated by fosGFP expression, corresponding to the margins of the spared barrel. E, High-magnification view of C, with layer II-III of the spared barrel in focus. Scale bar: B, C, 100 μm.
Figure 4.

Sensory stimulation increases both the number and intensity of fosGFP+ cells in barrel cortex. A, Quantitation of the number of fosGFP+ cells in control versus the spared whisker barrel in layer IV and layer II-III. B, Average pixel intensity of labeled cells increases after single-whisker stimulation. Error bars in A and B represent SE. C, Example of labeled nuclei (arrow) and unlabeled cells (chevron) from layer II-III of D1-only cortex. D, The same as C but in contralateral unplucked cortex from the same animal. Scale bar, 20 μm.
Although fosGFP+ cells were observed in both the spared whisker barrel and control cortical tissue, fosGFP+ cells after induction were not only more numerous (Fig. 4A) but also brighter than in control, as assessed by determining mean pixel intensity after confocal imaging of fosGFP+ and fosGFP- cells from both conditions (Fig. 4B). FosGFP+ cells were easily distinguished from fosGFP- cells in fixed tissue by a dark nucleus, surrounded by brighter neuropil. As indicated by the average pixel intensity values shown for the two populations of cells in both the spared barrel and control cortex shown in Figure 4, these cell populations were nonoverlapping.
In some cases, animals were subjected to single-whisker rearing, and whole brains were dissected and maintained in oxygenated ACSF during a brief period of inspection, using a conventional fluorescence microscope. Even under these somewhat rudimentary conditions, a small cluster of fosGFP-expressing cells in the area of S1 could be detected (data not shown), suggesting that these cells may be targeted for in vivo electrophysiological recording.
Immunohistochemistry
To compare expression of the fosGFP transgene with expression of the endogenous Fos protein, we performed Fos immunohistochemistry using a Fos-specific antibody that does not cross-react with other Fos-related antigens (FRAs) on tissue sections from the PVN of dehydrated wild-type littermates. Antibody titer was adjusted to show comparable signal from immunoreactive (IR) and fosGFP-fluorescent nuclei to provide a more accurate basis for comparison between these two signals, because high antibody titer is likely to provide an overestimate of Fos-IR nuclei attributable to signal amplification.
In this case, the number of Fos-IR nuclei in the PVN of wild-type littermates immediately after 2 hr of dehydration was 60.7 ± 3.3 (n = 3) versus 7.5 ± 1.3 (n = 2) for control, PBS-injected animals. In fosGFP transgenics (line 4-1), the number of fos-GFP+ cells in the PVN after dehydration was 43 ± 2.7 (n = 3) versus 4.3 ± 1.4 (n = 3) for control, PBS-injected animals. Thus, although the number of Fos-IR cells in wild-type animals was higher than the number of fosGFP+ cells in fosGFP transgenics, we found that these numbers were approximately comparable. In this way, the fosGFP mice may be useful as a surrogate for Fos immunohistochemistry, providing a high-throughput platform for in vivo pharmacology.
One important feature of this comparison was developing a protocol for Fos immunohistochemistry that used an appropriate antibody titer, such that antibody amplification of signal did not conflate cells expressing low levels of Fos protein with those expressing high levels of protein. Under these conditions, the number of Fos-IR and fosGFP+ neurons was similar. Thus, it is likely that fosGFP fluorescent neurons represent those cells that express the highest levels of c-fos and that cells expressing lower levels of the fusion protein do not produce visible levels of fluorescence.
One possible explanation for the lower number of fosGFP+ compared with Fos-IR cells may be delayed GFP fluorescence after translation. It is well known that maturation of the GFP protein is necessary to achieve its fluorescent properties (Tsien, 1998) and that this process can take several hours to occur after translation. Thus, there may be a lag between peak GFP fluorescence and Fos immunoreactivity, depending on the amount of fosGFP expression after stimulus. Indeed, in experiments in which we used a primary anti-GFP antibody and a Cy3-labeled secondary, we observed GFP-immunoreactive (Cy3) cells that were not green, supporting the notion that intrinsic GFP fluorescence may be delayed with respect to translation of the fosGFP protein (data not shown). In these cases, immunoreactivity was distributed throughout the cell body, as would be expected for an unfolded protein before nuclear import. However, regulated degradation of the fosGFP transgene may not require correct folding and may proceed in the absence of intrinsic fosGFP fluorescence.
In vivo time course of fosGFP fluorescence
To determine the duration of fosGFP fluorescence in single cells in vivo, we examined the persistence of fosGFP fluorescence in the PVN, induced by dehydration, for a period of hours after reintroduction of water. In previous experiments, in immunohistochemistry using an antibody specific for the Fos protein and not other FRAs, the number of Fos-IR nuclei using a Fos-specific monoclonal antibody is maximal 1-2 hr after saline injection and declines to baseline levels by 4-8 hr after injection (Sharp et al., 1991). In other examples of Fos protein longevity, the half-life of the protein after induction has been found to be at least 2 hr (Muller et al., 1984; Curran and Morgan, 1986), although it can be as short as 30 min in some cell lines (Curran et al., 1984).
The number of fosGFP-fluorescent cells within the PVN was calculated from animals killed at 0-6 hr after reintroduction of water ad libitum (Fig. 5). The rate of decline to baseline values in the number of fosGFP-fluorescent nuclei in the PVN, as assessed by calculation of the number of fluorescent nuclei at 0, 2, 4, and 6 hr after resolution of the dehydration stimulus (n = 3-6 transgenic animals per time point), was similar to that observed previously in the PVN (Sharp et al., 1991), in which there were no detectable Fos-IR cells in the PVN after 6-8 hr after dehydration.
Figure 5.

Duration of fosGFP fluorescence after in vivo stimulation. A-C, fosGFP transgenic animals were injected with hypertonic saline as a dehydration stimulus and simultaneously deprived of water for 2 hr, and fosGFP expression (A) was examined in the PVN at this time. Water was reintroduced ad libitum, and fosGFP signal is shown at 2 (B) and 6 (C) hr after water reintroduction. D, The number of fosGFP+ cells at each time point was calculated to determine the duration of fosGFP+ cells in the PVN after stimulus resolution. Error bars represent SE. 3v, Third ventricle. Scale bar, 100 μm.
fosGFP fluorescence ex vivo
Patterns of gene expression in living tissue were identical to what we observed in fixed tissue. However, we were concerned that ischemic and mechanical trauma during brain dissection and slice preparation might activate fosGFP expression over time. This might impede efforts to electrophysiologically identify neurons specifically activated by in vivo stimuli. To examine this possibility, brain slices from fosGFP mice were prepared and examined for several hours after slice preparation (Fig. 6). Areas of analysis included the barrel cortex, the hippocampus, and the olfactory cortex. In general, the field of view included ∼50-250 cells. During a period of 2-3 hr in the slice recording chamber, the number and intensity of GFP-fluorescent cells decreased. In no case did we observe unambiguous detection of new GFP-fluorescent cells during this time period. GFP-expressing cells, however, could be quite long-lived within a brain slice and, on some occasions, could be observed up to 9 hr after slicing (data not shown).
Figure 6.
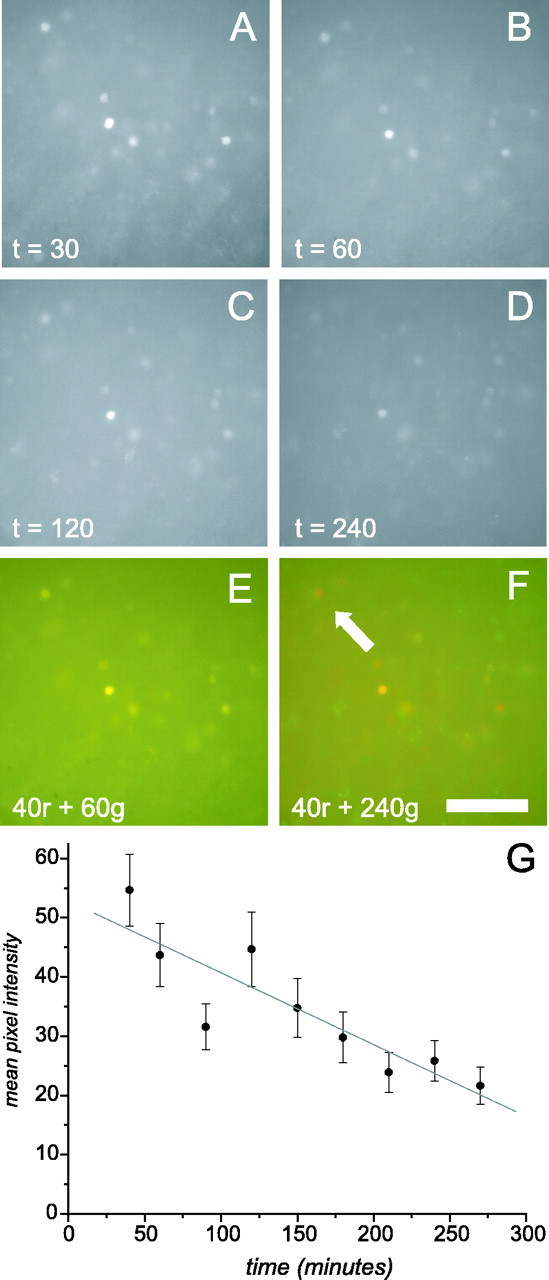
Preparation of brain slices does not induce fosGFP expression. Brain slices from a control fosGFP transgenic animal were made and examined shortly after tissue preparation. In all panels, t = 0 is time of decapitation, and brains were in ice-cold saline for the first 20-30 min during dissection and slice preparation. A-D, A region of cortex was imaged at multiple time points. E, F, Images from early time points were color-coded red and overlaid on images from later time points that were color-coded green. In this case, cells whose fluorescence disappears would appear red, and cells in which new fosGFP expression was induced would appear green. No new fosGFP-expressing (green) cells arose in the field examined. E, Image from t = 40 min (red) was merged with an image from t = 60 min (green). The snapshot from t = 40 was used for the merged picture because of slight differences in the distance between labeled cells resulting from spreading of the tissue after being positioned in the observation chamber. F, Image from t = 40 min (red) was merged with an image from t = 240 min (green). Note the absence of any (new) green cells in this comparison. Arrow denotes a red cell (i.e., a cell whose GFP fluorescence decreased over this time period). r, Red; g, green. Scale bar, 50 μm. G, fosGFP+ cells show decreased fluorescence over time in perfused brain slices. Average pixel intensity for 10 labeled cells at t = 30 through t = 240 was calculated and plotted versus time. Gray line is a regression for these points (r2 = 0.78) showing a high correlation between incubation time and decrease in fluorescence intensity. Error bars represent SE.
As an additional control, we vibratome-sectioned living brains from fosGFP transgenics and their wild-type littermates and fixed slices 0-3 hr after cutting. Fos immunoreactivity was determined (in the case of wild-type samples) or fosGFP fluorescence was examined at each time point. We observed no additional fosGFP expression and only scattered Fos-IR cells at all time points within this period (data not shown). On the basis of these results, we are confident that tissue preparation does not induce significant fosGFP fluorescence in the transgenic lines we examined.
Of particular interest was the longevity of GFP fluorescence in a brain area in which c-fos expression had been induced in vivo. To address this issue, brain slices from single-whisker reared animals were prepared, and the spared whisker barrel was identified and imaged repeatedly over a period of several hours. Initially, the highest concentration of GFP-fluorescent cells was in layer IV of the spared barrel, with a scattering of bright cells in supragranular and infragranular layers. The number of identifiable GFP-fluorescent cells decreased over time, such that, after several hours, the number of fosGFP-fluorescent cells had nearly disappeared in layer IV, although many cells were still visible in deep and superficial layers of the spared barrel. Because of this, we restricted the period of whole-cell recording to 3-4 hr after the animals were killed.
Experience-dependent changes in neuronal firing properties
The above data indicate that the fosGFP mice may be particularly useful for identifying brain areas with a history of recent activity. We used these transgenic mice to investigate activity-dependent changes in the dynamic membrane properties of layer II-III neurons in primary somatosensory cortex after alteration of sensory input. FosGFP transgenic mice were subjected to unilateral removal of all but a single large facial vibrissae, whisker D1, for a period of 20-24 hr. Brain slices from these animals were prepared, and the spared D1 barrel was identified on the basis of activation of fosGFP expression.
Neurons from three regions, the “spared” D1 barrel, adjacent “deprived” barrels corresponding to areas in which whisker input had been removed, and “control” barrels from the unplucked, sensory-spared hemisphere, were then targeted for whole-cell current-clamp recording. FosGFP+ and fosGFP- cells were identified before recording, and intracellular recording solution contained the red fluorescent dye Alexa 568 to verify whether cells were fosGFP+ or fosGFP- after the recording period. FosGFP-expressing cells were viable and displayed normal action potentials and glutamatergic synaptic inputs. Response properties of neurons to sub-threshold, threshold, and suprathreshold current steps were assessed to determine the minimum current necessary to elicit an action potential. Averaged across all conditions (spared, deprived, and control), no consistent differences in input resistance, resting potential, threshold, or rheobase current between fosGFP+ and fosGFP- cells were observed (Table 2). Thus, it seems unlikely that the expression of fosGFP necessarily confers or indicates significant alterations in these membrane properties.
Table 2.
Properties of fosGFP+ and fosGFP− neurons averaged across all conditions are similar
|
Mean ± SD |
Vrest (mV) |
Vthresh (mV) |
Rheobase (pA) |
Rinput (MΩ) |
Age (PND) |
|---|---|---|---|---|---|
| fosGFP+ | −66.2 ± 7.6 | −36.2 ± 6.7 | 95.4 ± 46.8 | 277 ± 102 | 16.2 ± 3.3 |
| n = 29 | n = 26 | n = 26 | n = 22 | n = 23 | |
| fosGFP− | −65.1 ± 7.9 | −33.6 ± 7.9 | 86.7 ± 39.6 | 317 ± 132 | 16.7 ± 2.8 |
| n = 39 | n = 37 | n = 36 | n = 26 | n = 33 | |
|
p value |
p = 0.54 |
p = 0.19 |
p = 0.43 |
p = 0.25 |
p = 0.55 |
PND, Postnatal day, for which PO is the day of birth.
However, comparison of these properties between neurons from spared, deprived, and control barrels showed that neurons in spared versus deprived barrels showed a significant alteration in the threshold for action potential generation (Fig. 7), although resting potential was not changed. These differences were observed in both fosGFP+ and fosGFP- cells in spared versus deprived samples, but the significance was greater when fosGFP+ and fosGFP- cells from each condition were pooled (p < 0.05). Input resistance and rheobase current were not significantly different between neurons in spared and deprived cortical areas (Table 3).
Figure 7.
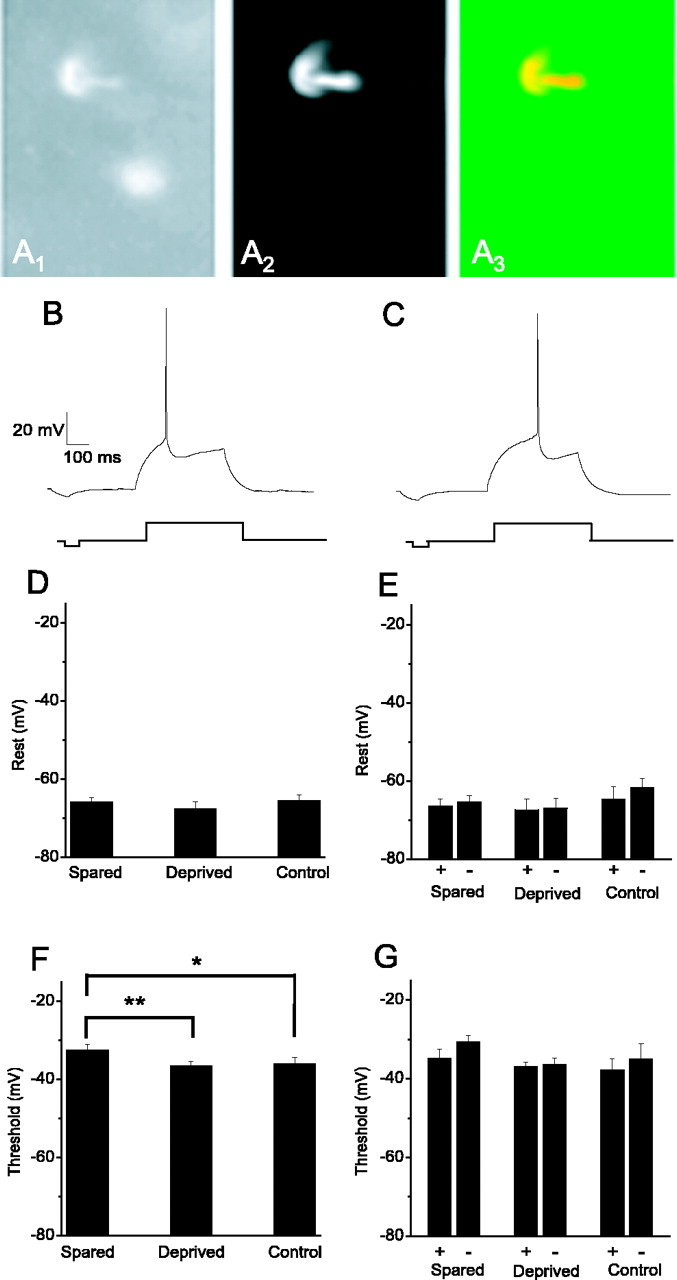
Threshold for action potential generation is raised in the spared barrel. A, Example of fosGFP+ cell from layer II-III of barrel cortex that was targeted for whole-cell voltage-clamp recording. A1, fosGFP+ nuclei. A2, Patch solution contained the red fluorescent dye Alexa-568 (10 μm) to fill the targeted cell during recording. A3, Merged picture of A and B shows that the Alexa-filled cell has a fosGFP+ nucleus. Scale bar, 30 μm. B, C, The minimal current to elicit an action potential in fosGFP+ (B) or fosGFP- (C) neurons under control conditions was determined, and the spike threshold was determined by averaging the inflection point from at least two rheobase traces. D, Resting potential from neurons in spared (n = 30), deprived (n = 22), or control (n = 28) tissue was unaltered. E, Data for Vrest of fosGFP+ and fosGFP- neurons for each experimental condition (spared, n = 13+, 17-; deprived, n = 8+, 13-; control, n = 8+, 9-). F, The average threshold for neurons in the spared barrel (n = 28) was altered compared with neurons from whisker-deprived barrels (**p < 0.05; n = 20) or control, unplucked animals (*p < 0.1; n = 15). G, Data for Vthreshold of fosGFP+ and fosGFP- neurons for each experimental condition (spared, n = 12+, 16-; deprived, n = 7+, 13-; control, n = 7+, 8-).
Table 3.
Summary of neuronal properties from spared, deprived, and control whisker barrels
|
Mean ± SD |
Vrest (mV) |
Vthresh (mV) |
Rheobase (pA) |
Rinput (MΩ) |
Age (PND) |
|---|---|---|---|---|---|
| Spared | −65.87 ± 6.60 | −32.50 ± 7.45 | 89.7 ± 39.8 | 316 ± 126 | 17.2 ± 2.0 |
| n = 30 | n = 28 | n = 29 | n = 18 | n = 18 | |
| Deprived | −67.58 ± 8.71 | −36.58 ± 4.89 | 76 ± 25 | 322 ± 122 | 17.2 ± 2.0 |
| n = 22 | n = 21 | n = 21 | n = 14 | n = 21 | |
| Control | −65.58 ± 8.44 | −36.14 ± 8.54 | 107.7 ± 55.3 | 259 ± 106 | 14.9 ± 3.2 |
| n = 28 | n = 26 | n = 24 | n = 16 | n = 17 | |
|
p value (spared vs deprived) |
0.42 |
0.034 |
0.17 |
0.89 |
0.94 |
PND, Postnatal day, for which PO is the day of birth.
Modulation of global activity levels in cultured hippocampal neurons can regulate the firing frequency of neurons, such that, during activity blockade, neurons become more excitable, and, when activity is enhanced, neurons become less excitable (Desai et al., 1999). It is unknown whether these changes also occur in the course of use-dependent changes in sensory input during in vivo experience because pharmacological modulation of activity is a much stronger and highly unnatural stimulus.
To address this issue, we took advantage of the disparity in activity between neurons in sensory-stimulated or sensory-deprived cortical areas. The amount of spike accommodation during a depolarizing current pulse was determined from neurons in spared and deprived barrels. Calculation of the first and third interspike interval (ISI) (for trains with a total of 8-10 spikes in a single pulse) showed that the ratio of the third to first ISI was greater in spared barrels, indicating that these neurons showed increased spike accommodation than neurons in deprived barrels (Fig. 8). Thus, these data show that an imbalance in sensory input is sufficient to drive homeostatic changes in cortical neuron firing rates, reflected by an increase in threshold for action potential and a decreased firing frequency in spared sensory areas. These experiments use the fosGFP mice to identify precisely regions of spared and deprived sensory cortex and to show that in vivo experience can regulate rapidly the dynamic membrane properties of cortical neurons.
Figure 8.
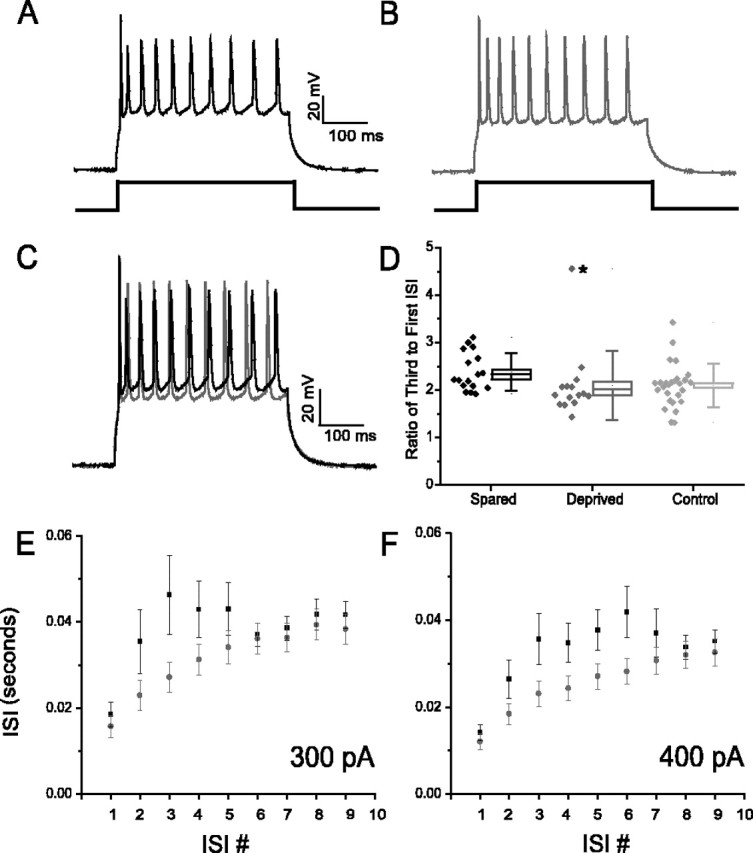
More active neurons show increased spike accommodation compared with sensory-deprived or control cells. A, A spike train (10 spikes) elicited by delivering a 400 msec current pulse from a sensory-spared barrel (fosGFP+). B, The same as A but from a neuron (fosGFP+) in an adjacent deprived cortical area. C, Overlay of traces from A and B show that spared barrel neurons show a shorter ISI between the first and second spike and a longer ISI for later spikes in the train. D, Calculation of the ratio of third ISI to first ISI for cells in each condition. Box edges represent SE, and error bars are SD (spared, n = 17; deprived, n = 15; control, n = 27). For spared versus control neurons, p < 0.17; without the outlier point for deprived neurons (asterisk), p < 0.00078. E, ISI for spared (black squares) or deprived (red circles) barrel neurons at a single current pulse amplitude. Increased accommodation is seen for the first few spikes in the train in spared versus deprived barrel neurons. Increased accommodation is seen for the first few spikes in the train in spared versus deprived barrel neurons. F, The same as in E but for a larger current pulse amplitude. With larger current pulse amplitudes, note that the difference in ISI is greater at each specific ISI. p values for spared and deprived ≥0.1 at ISIs 3, 4, and 5 for 300 pA and ISIs 3, 4, 5, and 6 for 400 pA graph.
Discussion
The fosGFP mouse is the first example of a noninvasive technique to monitor in vivo gene expression at the level of a single cell, throughout any region of the CNS. Individual cells and pathways that have been activated during a particular behavioral, physiological, or pharmacological stimulus can be identified and characterized electrophysiologically with a precision that was previously extremely difficult, if not impossible.
On the basis of our data, we conclude that fosGFP expression reproduces results from Fos immunohistochemistry in physiological, pharmacological, and sensory-stimulation assays. Fos-GFP expression induced in vivo could be monitored in brain slices from experimental animals. Finally, fosGFP expression allowed the identification of cortical areas with a history of recent activity, and cells within sensory-spared cortical areas displayed alterations in excitability that were consistent with homeostatic regulation of dynamic membrane currents. Together, these data demonstrate the validity of the fosGFP transgenic mouse for future investigations of the cellular and molecular basis of in vivo brain function.
Transgenic mouse development
Production of visually detectable fluorescence in living cells, without antibody amplification, was an important goal of this project. Because these transgenic animals carry multiple copies of the fosGFP transgene, the fluorescence signal is boosted well within the range of detection. Indeed, in several transgenic lines that we examined, fosGFP+ cells were bright enough to be visualized even at low magnification.
What are the consequences of introducing multiple copies of a fosGFP fusion gene into the genome? If the protein product is nonfunctional, it might act as a dominant negative, especially if it can dimerize with other proteins to form a nonfunctional AP-1 complex. In this case, transgenic mice might display a phenotype that is similar to the fos knock-out (Johnson et al., 1992; Wang et al., 1992), with male infertility, bone defects, and increased mortality at weaning. These phenotypes were not observed in the fosGFP mice.
If, however, the fosGFP fusion protein is functional, transgenic mice might show increased induction of downstream genes. Although this is not a simple issue to resolve, we think that it is unlikely to be the case for the following reasons: (1) brain structures were morphologically normal; (2) by simple measurements, fosGFP+ pyramidal cells were electrophysiologically indistinguishable from pyramidal cells from wild-type animals; (3) despite the presence of ≥10 copies of the transgene in various lines of the fosGFP+ mice, protein levels of fosGFP in the hippocampus after seizure induction were nearly identical to that of Fos in both transgenic and wild-type animals, indicating at most a twofold upregulation of total Fos plus fosGFP protein expression (D. Beil and A. L. Barth, unpublished data); (4) performance in hippocampal-dependent c-fos-activating learning tasks were behaviorally indistinguishable between fosGFP and wild-type littermates (A. Rising and A. L. Barth, unpublished data); and (5) within the spared whisker barrel, this altered firing phenotype was observed in both fosGFP+ and fosGFP- cells, indicating that transgene expression did not predict firing phenotype.
Although transgene silencing, a problem common in other transgenic mouse strains (Barth et al., 2000), was observed in some of the fosGFP lines, the lines that we characterized showed both typical Mendelian inheritance over multiple generations, as well as reproducible expression in the CNS. Thus, transgene expression is not lethal and can be maintained stably over many generations of backcrossing. In addition, fosGFP expression is observed in a wide variety of brain areas, from cortex and hippocampus to the hypothalamus and striatum. Levels of transgene activation varied among lines; for example, two lines that showed excellent fosGFP induction after clozapine injection (1-3 and 5-1) showed poor induction in the PVN after dehydration. The reverse was observed in lines 4-1 and 6-1. In general, however, expression in the neocortex was good in all lines examined.
Inducibility of fosGFP transgene
The three assays we used for fosGFP induction demonstrated precise and reproducible patterns of fosGFP expression. In individual transgenic lines under particular stimulation conditions, induced fosGFP expression showed good correspondence with results from Fos immunohistochemistry.
The longevity of fosGFP-fluorescent signal from expressing cells was similar to that which has been observed in wild-type animals, in which signal in the PVN after dehydration declined to baseline values after 6-8 hr. This is in accordance with the what has been shown for the Fos protein as determined by Fos immunoreactivity in this area (Sharp et al., 1990), although it is slightly longer than what has been described for Fos, using other methods (Curran and Morgan, 1986).
When the persistence of fosGFP-fluorescent nuclei was examined in ex vivo brain slices, we found that the signal from activated cells was greatly reduced within the first 2-3 hr. Because slices were maintained at ambient temperatures that may be likely to decrease Fos protein turnover, this provides additional evidence that the dynamics of fosGFP protein levels are within the same range as that of the endogenous Fos.
Slice recording from neurons activated by in vivo manipulation
In at least three different assays, fosGFP expression could be induced in vivo and fluorescent cells could be detected in the predicted brain area in living brain slices. Transgene expression did not appear to compromise cell viability. Our data show that regionally specific fosGFP fluorescence in a single whisker barrel after sensory stimulation, as well as in the PVN after dehydration, could easily be detected in brain slices and was not confounded by nonspecific transgene expression throughout the tissue, induced by tissue trauma during slice preparation.
Indeed, in control experiments in which we looked at induction of fosGFP fluorescence in transgenic animals or Fos immunoreactivity in wild-type littermates after vibratome preparation of tissue, we saw little, if any, Fos immunoreactivity or fosGFP fluorescence (Fig. 5 and data not shown). Other investigators have shown that c-fos mRNA is induced after slice preparation (Taubenfeld et al., 2002) but that this is uncoupled from translation. Thus, the amount of protein produced is low, and protein levels are not sufficient to overcome tissue autofluorescence and remain undetectable. Together, these data indicate the utility of the fosGFP transgenic mice for identification and characterization of neuronal subsets activated in vivo, using whole-cell recording in brain slices.
Activity-dependent changes in neuronal firing properties
We used the fosGFP transgenic mice to follow experience-dependent changes in the dynamic membrane properties of cortical neurons after inducing an imbalance in sensory input via whisker plucking. Our results show, by two separate measures, that neurons rapidly adjust their firing properties to alterations in sensory input, such that neuron in sensory-deprived areas become more excitable and neurons in adjacent sensory-spared areas become less excitable. Even small increases in threshold can have a profound influence on the excitability of a cell, because the decrease in driving force at higher thresholds will nonlinearly affect the ability of individual synaptic inputs to fire a cell. Because these changes were observed after subtle imbalances in sensory input, it is likely that the activity-dependent changes that we observed are a general feature of cortical neurons and take place during normal experience. These data demonstrate that the often observed heterogeneity of cortical neuron firing patterns may be an indicator of the recent history of activity of that neuron.
Both the increase in threshold and spike accommodation in spared versus deprived barrel neurons reflect homeostatic changes in membrane conductances that may act to reset neuronal firing range to an optimum level for sensory transmission and discrimination and may each have a distinct or related molecular basis. This rapid regulation of firing frequency has not been observed after in vivo experience and raises intriguing questions about the impact of synapse-specific strengthening in the face of homeostatic regulation of firing frequency and synaptic scaling (Desai et al., 2002; Takahashi et al., 2003).
Applications of fosGFP transgenic mice
The fosGFP mice represent a technological and conceptual advance in the relationship between the systems of neuroscience and cellular electrophysiology. We anticipate that this tool, and others like it, that use intrinsic fluorescent proteins under the control of activity-dependent promoters will rapidly become required for the cellular analysis of brain function. Characterization of fosGFP-expressing neurons can be used to understand the cellular networks that underlie learning and memory for discrete tasks (Giovannelli et al., 1992; Sakata et al., 2002; Staiger et al., 2002). Because specific synapses onto activated cells can be examined for evidence of learning-induced modifications, it is now possible to rigorously test how mechanisms such as long-term potentiation, depression, and homeostasis occur during in vivo experience. Additionally, anatomical modifications in the sub-population of activated cells after in vivo experience can be characterized. Finally, it may be possible to target fosGFP-expressing neurons in vivo, using two-photon imaging to visualize activated cells.
The fosGFP transgenic mice have important applications in pharmacology because they enable the precise characterization of neurons whose activity has been modulated by drug exposure. Using the fosGFP mice, it will now be possible to better understand the direct or indirect mechanism of action for a variety of drugs on dynamic membrane properties and potentially to design better agents to affect important subsets of cells in the brain and other areas of the body, such as the immune system.
Although our understanding of how different brain areas contribute to CNS function has improved vastly over the past few decades, the resolution of these studies has been rather coarse in that individual subtypes of neurons have been implicated only rarely. Given the wide diversity of neurons within individual brain areas, such as the neocortex, it is likely that the anatomical and molecular diversity of neurons underlies functional divisions that are used for sensory perception, learning, and memory (Barth, 2002). The ability to characterize the cellular and synaptic properties of neurons that are activated during in vivo experience is an important step forward in understanding how the brain works.
Footnotes
This work was supported by funds from Carnegie Mellon University (A.L.B.). K.L.D. was a participant in the Biological Sciences Summer Undergraduate Research Program supported by National Science Foundation Research Experience for Undergraduates Grant DBI-9912260. We thank Robert C. Malenka for his generous support for this project in its initial phases. We also thank David Beil, Alexis Long, and Linda Rinaman for technical assistance and to Roger Clem for discussion and critical comments on this manuscript.
Correspondence should be addressed to Alison L. Barth, Carnegie Mellon University, Department of Biological Sciences, Mellon Institute, 4400 Fifth Avenue, Pittsburgh, PA 15213. E-mail: barth@cmu.edu.
Copyright © 2004 Society for Neuroscience 0270-6474/04/246466-10$15.00/0
References
- Barth AL (2002) Differential plasticity in neocortical networks. Physiol Behav 77: 545-550. [DOI] [PubMed] [Google Scholar]
- Barth AL, McKenna M, Glazewski S, Hill P, Impey S, Storm D, Fox K (2000) Upregulation of cAMP response element-mediated gene expression during experience-dependent plasticity in adult neocortex. J Neurosci 20: 4206-4216. [DOI] [PMC free article] [PubMed] [Google Scholar]
- Bernstein LR, Ferris DK, Colburn NH, Sobel ME (1994) A family of mitogen-activated protein kinase-related proteins interacts in vivo with activator protein-1 transcription factor. J Biol Chem 269: 9401-9404. [PubMed] [Google Scholar]
- Cole AJ, Saffen DW, Baraban JM, Worley PF (1989) Rapid increase of an immediate early gene messenger RNA in hippocampal neurons by synaptic NMDA receptor activation. Nature 340: 474-476. [DOI] [PubMed] [Google Scholar]
- Curran T (1988) The fos oncogene. In: The oncogene handbook (Reddy EP, Skalka AM, Curran T, eds), pp 307-325. Amsterdam: Elsevier Science.
- Curran T, Franza Jr BR (1988) Fos and Jun: the AP-1 connection. Cell 55: 395-397. [DOI] [PubMed] [Google Scholar]
- Curran T, Morgan JI (1986) Barium modulates c-fos expression and post-translational modification. Proc Natl Acad Sci USA 83: 8521-8524. [DOI] [PMC free article] [PubMed] [Google Scholar]
- Curran T, Miller AD, Zokas L, Verma IM (1984) Viral and cellular fos proteins: a comparative analysis. Cell 36: 259-268. [DOI] [PubMed] [Google Scholar]
- Desai NS, Rutherford LC, Turrigiano GG (1999) Plasticity in the intrinsic excitability of cortical pyramidal neurons. Nat Neurosci 2: 515-520. [DOI] [PubMed] [Google Scholar]
- Desai NS, Cudmore RH, Nelson SB, Turrigiano GG (2002) Critical periods for experience-dependent synaptic scaling in visual cortex. Nat Neurosci 5: 783-789. [DOI] [PubMed] [Google Scholar]
- Fleischmann A, Hvalby O, Jensen V, Strekalova T, Zacher C, Layer LE, Kvello A, Reschke M, Spanagel R, Sprengel R, Wagner EF, Gass P (2003) Impaired long-term memory and NR2A-type NMDA receptor-dependent synaptic plasticity in mice lacking c-Fos in the CNS. J Neurosci 23: 9116-9122. [DOI] [PMC free article] [PubMed] [Google Scholar]
- French PJ, O'Connor V, Jones MW, Davis S, Errington ML, Voss K, Truchet B, Wotjak C, Stean T, Doyere V, Maroun M, Laroche S, Bliss TV (2001) Subfield-specific immediate early gene expression associated with hippocampal long-term potentiation in vivo. Eur J Neurosci 13: 968-976. [DOI] [PubMed] [Google Scholar]
- Gall CM, Hess US, Lynch G (1998) Mapping brain networks engaged by, and changed by, learning. Neurobiol Learn Mem 70: 14-36. [DOI] [PubMed] [Google Scholar]
- Giovannelli L, Shiromani PJ, Jirikowski GF, Bloom FE (1990) Oxytocin neurons in the rat hypothalamus exhibit c-fos immunoreactivity upon osmotic stress. Brain Res 531: 299-303. [DOI] [PubMed] [Google Scholar]
- Giovannelli L, Shiromani PJ, Jirikowski GF, Bloom FE (1992) Expression of c-fos protein by immunohistochemically identified oxytocin neurons in the rat hypothalamus upon osmotic stimulation. Brain Res 588: 41-48. [DOI] [PubMed] [Google Scholar]
- Guthrie KM, Anderson AJ, Leon M, Gall C (1993) Odor-induced increases in c-fos mRNA expression reveal an anatomical “unit” for odor processing in olfactory bulb. Proc Natl Acad Sci USA 90: 3329-3333. [DOI] [PMC free article] [PubMed] [Google Scholar]
- Guzowski JF, Lyford GL, Stevenson GD, Houston FP, McGaugh JL, Worley PF, Barnes CA (2000) Inhibition of activity-dependent arc protein expression in the rat hippocampus impairs the maintenance of long-term potentiation and the consolidation of long-term memory. J Neurosci 20: 3993-4001. [DOI] [PMC free article] [PubMed] [Google Scholar]
- Guzowski JF, Setlow B, Wagner EK, McGaugh JL (2001) Experience-dependent gene expression in the rat hippocampus after spatial learning: a comparison of the immediate-early genes Arc, c-fos, and zif268 J Neurosci 21: 5089-5098. [DOI] [PMC free article] [PubMed] [Google Scholar]
- Ho N, Gullberg M, Chatila T (1996) Activation protein 1-dependent transcriptional activation of interleukin 2 gene by Ca2+/calmodulin kinase type IV/Gr. J Exp Med 184: 101-112. [DOI] [PMC free article] [PubMed] [Google Scholar]
- Johnson RS, Spiegelman BM, Papaioannou V (1992) Pleiotropic effects of a null mutation in the c-fos proto-oncogene. Cell 71: 577-586. [DOI] [PubMed] [Google Scholar]
- Krebs J, Honegger P (1996) Calmodulin kinase IV: expression and function during rat brain development. Biochim Biophys Acta 1313: 217-222. [DOI] [PubMed] [Google Scholar]
- Kruijer W, Schubert D, Verma IM (1985) Induction of the proto-oncogene fos by nerve growth factor. Proc Natl Acad Sci USA 82: 7330-7334. [DOI] [PMC free article] [PubMed] [Google Scholar]
- Lanahan A, Worley P (1998) Immediate-early genes and synaptic function. Neurobiol Learn Mem 70: 37-43. [DOI] [PubMed] [Google Scholar]
- Mack KJ, Mack PA (1992) Induction of transcription factors in somatosensory cortex after tactile stimulation. Brain Res Mol Brain Res 12: 141-147. [DOI] [PubMed] [Google Scholar]
- Morgan JI, Curran T (1986) Role of ion flux in the control of c-fos expression. Nature 322: 552-555. [DOI] [PubMed] [Google Scholar]
- Morgan JI, Cohen DR, Hempstead JL, Curran T (1987) Mapping patterns of c-fos expression in the central nervous system after seizure. Science 237: 192-197. [DOI] [PubMed] [Google Scholar]
- Mower GD (1994) Differences in the induction of Fos protein in cat visual cortex during and after the critical period. Brain Res Mol Brain Res 21: 47-54. [DOI] [PubMed] [Google Scholar]
- Muller R, Bravo R, Burckhardt J, Curran T (1984) Induction of c-fos gene and protein by growth factors precedes activation of c-myc. Nature 312: 716-720. [DOI] [PubMed] [Google Scholar]
- Naranjo JR, Mellstrom B, Achaval M, Lucas JJ, Del Rio J, Sassone-Corsi P (1991) Co-induction of jun B and c-fos in a subset of neurons in the spinal cord. Oncogene 6: 223-227. [PubMed] [Google Scholar]
- Nguyen TV, Kosofsky BE, Birnbaum R, Cohen BM, Hyman SE (1992) Differential expression of c-fos and zif268 in rat striatum after haloperidol, clozapine, and amphetamine. Proc Natl Acad Sci USA 89: 4270-4274. [DOI] [PMC free article] [PubMed] [Google Scholar]
- Rinaman L, Stricker EM, Hoffman GE, Verbalis JG (1997) Central c-Fos expression in neonatal and adult rats after subcutaneous injection of hypertonic saline. Neuroscience 79: 1165-1175. [DOI] [PubMed] [Google Scholar]
- Rocamora N, Welker E, Pascual M, Soriano E (1996) Upregulation of BDNF mRNA expression in the barrel cortex of adult mice after sensory stimulation. J Neurosci 16: 4411-4419. [DOI] [PMC free article] [PubMed] [Google Scholar]
- Rosen KM, McCormack MA, Villa-Komaroff L, Mower GD (1992) Brief visual experience induces immediate early gene expression in the cat visual cortex. Proc Natl Acad Sci USA 89: 5437-5441. [DOI] [PMC free article] [PubMed] [Google Scholar]
- Sagar SM, Sharp FR, Curran T (1988) Expression of c-fos protein in brain: metabolic mapping at the cellular level. Science 240: 1328-1331. [DOI] [PubMed] [Google Scholar]
- Sakata S, Kitsukawa T, Kaneko T, Yamamori T, Sakurai Y (2002) Task-dependent and cell-type-specific Fos enhancement in rat sensory cortices during audio-visual discrimination. Eur J Neurosci 15: 735-743. [DOI] [PubMed] [Google Scholar]
- Schilling K, Luk D, Morgan JI, Curran T (1991) Regulation of a fos-lacZ fusion gene: a paradigm for quantitative analysis of stimulus-transcription coupling. Proc Natl Acad Sci USA 88: 5665-5669. [DOI] [PMC free article] [PubMed] [Google Scholar]
- Sharp FR, Sagar SM, Hicks K, Lowenstein D, Hisanaga K (1991) c-fos mRNA, Fos, and Fos-related antigen induction by hypertonic saline and stress. J Neurosci 11: 2321-2331. [DOI] [PMC free article] [PubMed] [Google Scholar]
- Sharp JW, Sagar SM, Hisanaga K, Jasper P, Sharp FR (1990) The NMDA receptor mediates cortical induction of fos and fos-related antigens following cortical injury. Exp Neurol 109: 323-332. [DOI] [PubMed] [Google Scholar]
- Smeyne RJ, Schilling K, Robertson L, Luk D, Oberdick J, Curran T, Morgan JI (1992) fos-lacZ transgenic mice: mapping sites of gene induction in the central nervous system. Neuron 8: 13-23. [DOI] [PubMed] [Google Scholar]
- Staiger JF, Bisler S, Schleicher A, Gass P, Stehle JH, Zilles K (2000) Exploration of a novel environment leads to the expression of inducible transcription factors in barrel-related columns. Neuroscience 99: 7-16. [DOI] [PubMed] [Google Scholar]
- Staiger JF, Masanneck C, Bisler S, Schleicher A, Zuschratter W, Zilles K (2002) Excitatory and inhibitory neurons express c-Fos in barrel-related columns after exploration of a novel environment. Neuroscience 109: 687-699. [DOI] [PubMed] [Google Scholar]
- Takahashi T, Svoboda K, Malinow R (2003) Experience strengthening transmission by driving AMPA receptors into synapses. Science 299: 1585-1588. [DOI] [PubMed] [Google Scholar]
- Taubenfeld SM, Stevens KA, Pollonini G, Ruggiero J, Alberini CM (2002) Profound molecular changes following hippocampal slice preparation: loss of AMPA receptor subunits and uncoupled mRNA/protein expression. J Neurochem 81: 1348-1360. [DOI] [PubMed] [Google Scholar]
- Tsien RY (1998) The green fluorescent protein. Annu Rev Biochem 67: 509-544. [DOI] [PubMed] [Google Scholar]
- Wan W, Ennulat DJ, Cohen BM (1995) Acute administration of typical and atypical antipsychotic drugs induces distinctive patterns of Fos expression in the rat forebrain. Brain Res 688: 95-104. [DOI] [PubMed] [Google Scholar]
- Wang ZQ, Ovitt C, Grigoriadis AE, Mohle-Steinlein U, Ruther U, Wagner EF (1992) Bone and haematopoietic defects in mice lacking c-fos. Nature 360: 741-745. [DOI] [PubMed] [Google Scholar]
- Wilson Y, Nag N, Davern P, Oldfield BJ, McKinley MJ, Greferath U, Murphy M (2002) Visualization of functionally activated circuitry in the brain. Proc Natl Acad Sci USA 99: 3252-3257. [DOI] [PMC free article] [PubMed] [Google Scholar]