

Abstract
The role of a neuron in neural processing is ultimately determined by whether or not it fires an action potential in a given context. Studies on synaptic plasticity have focused primarily on changes in EPSPs, and not on whether plasticity translates into changes in firing. However, this issue has been addressed by examining EPSP-spike (E-S) potentiation, which enhances the ability of an EPSP of a fixed slope to elicit spikes after long-term potentiation (LTP). Although LTP is thought to underlie learning and memory, E-S potentiation could play an equally important role by potentiating the neuronal input-output function. Here, we used a combined experimental and theoretical approach to examine both the mechanisms underlying E-S potentiation as well as the role of inhibition in shaping the input-output function of neurons. Whereas previous studies examined tetanus-LTP, in which inhibitory synapses may have undergone plasticity, here we examined pairing-induced associative LTP. We determined that although intact inhibition was necessary for pairing-induced E-S potentiation, inhibitory plasticity was not. We further established using computer simulations that a primary mechanism of E-S potentiation was a change in the relative recruitment and latency of inhibitory neurons. Although these studies do not exclude the presence of additional mechanisms of E-S potentiation that may be engaged depending on the induction protocol, they do establish that under intact pharmacology, LTP of the Schaffer collateral to CA1 pyramidal neuron synapses will produce E-S potentiation as a result of changes in the balance and timing of excitation and inhibition.
Keywords: hippocampus, CA1, inhibition, EPSP-spike potentiation, long-term potentiation, network, input-output
Introduction
Long-term forms of plasticity, which are thought to contribute to learning and memory (Bliss and Collingridge, 1993; Martin et al., 2000), are traditionally studied by examining changes in the slope of intracellularly or extracellularly recorded EPSPs onto pyramidal neurons. Changes in EPSP strength, however, are only functionally significant when they result in changes in the firing patterns of neurons. Thus, to understand the computational effects of long-term plasticity, it is necessary to examine the neuronal input-output (I/O) function as a whole. One manner in which the I/O function has been studied is by examining EPSP-spike (E-S) curves in CA1, by plotting the extracellular population spike amplitude as a function of field EPSP (fEPSP) slope (Andersen et al., 1980), or by plotting intracellular spike probability versus EPSP slope (Daoudal et al., 2002; Marder and Buonomano, 2003; Staff and Spruston, 2003). In these studies, the EPSP slope provides a measure of the excitatory component of the synaptic input (Wigstrom and Gustafsson, 1985; McCormick et al., 1993; Pouille and Scanziani, 2001), whereas cell firing provides a measure of the interaction between both excitation and inhibition, which are activated in parallel (Buzsáki, 1984; Pouille and Scanziani, 2001). Thus, the E-S curve provides a measure of the net ability of EPSPs to elicit action potentials in the presence of inhibition. Previous studies of long-term potentiation (LTP) reported that a fixed fEPSP slope elicited more firing after tetanus-LTP (Bliss and Gardner-Medwin, 1973; Bliss and Lomo, 1973; Andersen et al., 1980). This was shown as a left shift of the E-S curve referred to as E-S potentiation (Andersen et al., 1980).
There has been considerable debate as to the mechanisms underlying E-S potentiation, with studies focusing on increased neuronal excitability (Abraham et al., 1985; Taube and Schwartzkroin, 1988; Wathey et al., 1992; Jester et al., 1995; Daoudal et al., 2002) and decreased efficacy of inhibition (Wilson et al., 1981; Abraham et al., 1987; Chavez-Noriega et al., 1989; Tomasulo et al., 1991; McMahon and Kauer, 1997; Lu et al., 2000; Chevaleyre and Castillo, 2003; Staff and Spruston, 2003). There is substantial evidence that a major component of E-S potentiation relies on GABAergic inhibition, because E-S potentiation is mimicked and occluded (Abraham et al., 1987; Chavez-Noriega et al., 1989; Tomasulo et al., 1991; Lu et al., 2000) or reduced (Daoudal et al., 2002; Staff and Spruston, 2003) by GABAA receptor (GABAAR) antagonists (but see Jester et al., 1995; Evans and Viola-McCabe, 1996). Several possible explanations exist for the dependence of E-S potentiation on intact inhibition. E-S potentiation could be caused by inhibitory plasticity, specifically long-term depression (LTD) of the input-to-inhibitory (Input→Inh) (McMahon and Kauer, 1997) or inhibitory-to-excitatory (Inh→Ex) synapses (Lu et al., 2000; Chevaleyre and Castillo, 2003). Alternatively, it was hypothesized (Wilson et al., 1981; Abraham et al., 1987) that LTP of the input-to-excitatory (Input→Ex) synapses alone could cause E-S potentiation by increasing the excitatory/inhibitory ratio. The GABAAR antagonist data cannot distinguish between these possibilities, but the latter explanation predicts that E-S potentiation should occur with pairing-induced associative LTP.
Here, we test the hypothesis that LTP of EPSPs onto a CA1 pyramidal neuron is sufficient for E-S potentiation. We demonstrate that associative LTP produces GABAAR-dependent E-S potentiation and that the associative pairing protocol does not produce changes in fast inhibitory synaptic strength or intrinsic neuronal excitability. Additionally, we show with computer simulations that LTP of pyramidal neuron EPSPs causes E-S potentiation by changing the excitatory-inhibitory balance.
Materials and Methods
Electrophysiology
Slice preparation. Hippocampal slice experiments were performed on 400-μm-thick transverse hippocampal slices from 17- to 21-d-old Sprague Dawley rats. The hippocampus was dissected out after halothane anesthesia and decapitation and submerged in 1°C oxygenated solution composed of (in mm) 206 sucrose, 2.8 KCl, 2 MgSO4, 1 MgCl2, 1.25 NaH2PO4, 26 NaHCO3, 1 CaCl2, 10 glucose, and 0.4 ascorbic acid. The hippocampus was next placed on an agar block, and slices were cut from the dorsal portion using a Vibratome (Leica, Nussloch, Germany). After slices were cut, they were immediately placed in a room temperature incubation chamber filled with artificial CSF (ACSF) composed of (in mm) 119 NaCl, 2.5 KCl, 1.3 MgSO4, 1.0 NaH2PO4, 26.2 NaHCO3, 2.5 CaCl2, and 10 glucose. After an equilibration period of at least 1.5 hr, slices were transferred individually to a submerged recording chamber perfused at a rate of 3 ml/min with ACSF maintained at a temperature of 32 ± 1°C.
Stimulating and recording. Two platinum-iridium bipolar stimulating electrodes (Frederick Haer, Bowdoinham, ME) were placed in the stratum radiatum at opposite ends of CA1, 250-450 μm away from an intracellular recording electrode centered in CA1. Biphasic, constant current, 100 μsec stimuli were delivered at 10 sec intervals alternately to the two pathways. Intracellular recordings were made from micropipettes pulled from borosilicate glass (1.2 mm outer diameter; 0.68 mm inner diameter) using a Flaming/Brown electrode puller (Sutter Instruments, Novato, CA). Their resistance when filled with 3 m potassium acetate varied from 50 to 90 MΩ. Cell penetrations were considered acceptable if they met the following criteria: resting potential below -60 mV, input resistance of ≥30 MΩ, and overshooting action potentials. Sharp recordings, as opposed to whole-cell recordings, were used here for two reasons. First, we hypothesized that excitation-inhibition balance was important in E-S coupling, and whole-cell recordings alter the IPSP reversal potential and thus the excitatory-inhibitory balance. Second, because it was necessary to obtain baseline E-S curves before LTP induction, LTP was induced 10-30 min into the experiment. This would be difficult to accomplish using whole-cell recordings because of “wash-out.”
Single-cell E-S curves. After stable baseline recordings were established for at least 5 min, the data for an intracellular E-S curve were obtained by stimulating the experimental pathway every 10 sec. First, an intensity (100-300 μA) producing a robust suprathreshold response in the intracellular record was found. Then, a descending series of four to eight stimulation intensities was applied, eliciting responses that ranged from 100 to 0% spike probability. All stimulation intensities of the I/O curve were applied for 10 consecutive sweeps. EPSP slopes were calculated as the maximal slope of the ascending phase, measured as the maximum slope between 5 and 95% of the EPSP. Spikes were detected as peak amplitudes exceeding a threshold value. E-S curves were constructed by plotting the spike probability, calculated as the percentage of trials eliciting spikes at a given intensity versus the mean EPSP slope at that intensity.
Associative LTP induction. After completion of the pre-pairing E-S curves, baseline recordings were reestablished for at least 5 min. Cells were discarded if the EPSPs evoked at baseline intensity differed significantly before and after the I/O curve. LTP was induced in the experimental pathway using an associative pairing protocol. Specifically, 60 pairings of four pulses (40 Hz) were paired with a 100 msec depolarizing pulse (2-4 nA); pairings were presented every 5 sec. E-S potentiation was assessed in the paired pathway between 10 and 20 min after completion of pairing. Note that because we did not use tetanus, there was little or no post-tetanic potentiation or short-term plasticity, and because our previous work (Marder and Buonomano, 2003) indicated no difference between E-S curves acquired 13 and 30 min after LTP, we did not acquire additional E-S curves at later time points. Quantification of E-S shift is described below. The magnitude of LTP was calculated as the mean EPSP slope over a 3 min window 20-30 min after the end of pairing, normalized to the mean EPSP slope over a 3 min window before pairing (LTP = EPSPpost/EPSPpre). Only those cells exhibiting significant LTP (>115% of baseline) at the end of an experiment were included in our analysis.
Control experiments. To establish that any changes in the E-S function were attributable to the plasticity protocol itself (paring-LTP), as opposed to nonspecific effects produced by any number of other factors, such as time since the cell penetration or cell health, we performed “yoked” control experiments. In separate cells/slices, we performed the same experiments (making multiple E-S plots), except that the LTP induction protocol was not used. In some experiments, a single cell provided control data as well as LTP data: E-S curves were first obtained at two time points as in the control experiments and then at a third time point after LTP induction. In other experiments, LTP and control cells were interleaved.
Picrotoxin experiments. To characterize the role of inhibition in pairing-induced E-S potentiation, intracellular recordings were made in the continuous presence of 50 μm picrotoxin (PTX), which was prepared by dilution from a stock solution into ACSF containing 4 mm CaCl2 and 2.6 mm MgSO4. Single-cell E-S curves and associative LTP induction were as described above. In addition, the effect of the pairing protocol on intrinsic excitability was tested explicitly in these experiments. Input resistance and threshold were measured before and 10 min after the pairing protocol by injecting cells with a series of hyperpolarizing and depolarizing current steps (100 msec duration; 10 sec intertrial interval) (see Fig. 3A). Two trials at each of the following intensities (nanoamperes) were used: -0.1, 0.1, 0.2, 0.3, 0.4, and 0.5. Input resistance was determined from the voltage change produced by the hyperpolarizing current steps. Threshold was determined from the numbers of spikes produced by each of the depolarizing current steps. Statistical analyses were done using a two-tailed, paired Student's t test for input resistance and using two-way ANOVA with repeated measures over one factor (intensity) for threshold.
Figure 3.
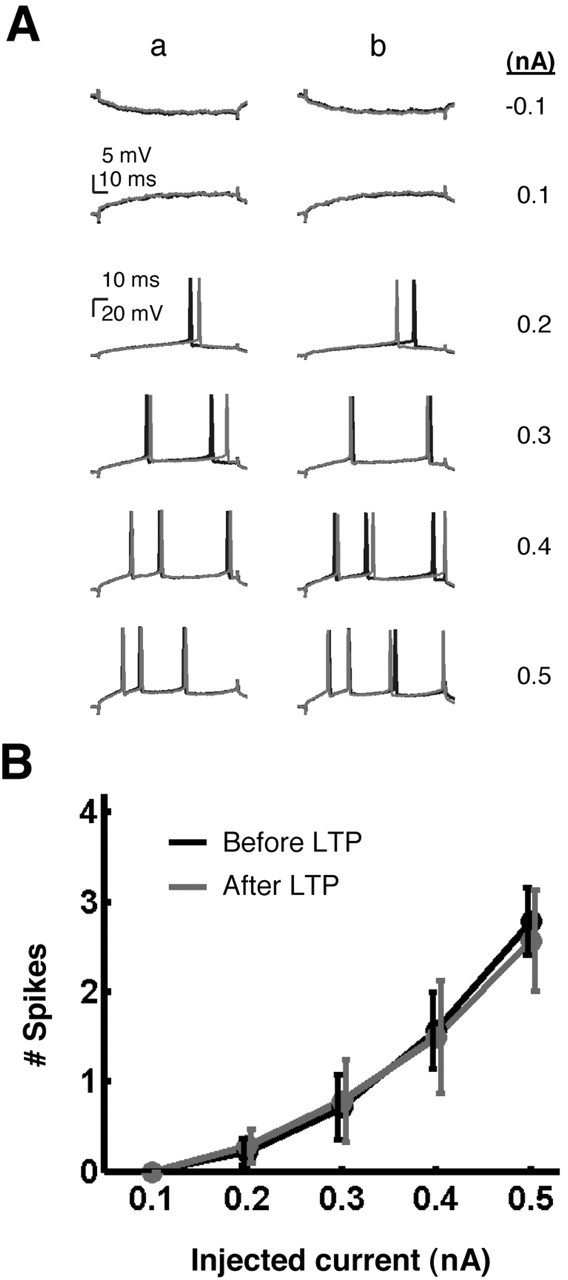
Pairing does not produce plasticity of intrinsic neuronal excitability. A, Excitability tests in a representative experiment. Input resistance and threshold were measured before (a) and 10 min after (b) the pairing protocol (in the presence of 50 μm PTX) by injecting cells with hyperpolarizing (top row) and depolarizing current steps. Black and gray lines indicate two trials at all intensities. Threshold was measured by counting the number of spikes produced by the depolarizing current steps. B, Pooled threshold data from seven experiments showing the mean number of spikes produced for all depolarizing current intensities, both before (black) and after (gray) LTP. Error bars represent ±SEM. No significant difference in threshold was detected before and after pairing-LTP (p = 0.95).
Inhibitory postsynaptic potentials. To determine whether the pairing protocol produced plasticity of IPSPs, the AMPA receptor (AMPAR) antagonist CNQX (20 μm) was included in the ACSF and bath applied for 60 min before establishing intracellular recordings. To directly stimulate inhibitory axons, the stimulating electrodes (concentric bipolar electrodes; Frederick Haer) were positioned in the stratum radiatum at 50-100 μm on each side of the recorded neuron (Davies and Collingridge, 1989; Davies et al., 1990; Pouille and Scanziani, 2001). To isolate the GABAAR component of the evoked responses from the NMDA receptor (NMDAR) component, recordings were made at a membrane potential of -80 mV. After a 10 min period of stable baseline recording at -80 mV, pairings were presented to one pathway, as described above, for associative LTP experiments. IPSPs were evoked at -60 mV during the pairings, as well as for two sweeps before and after the pairings (see Fig. 4C). IPSPs were then evoked at -80 mV for an additional 30 min after completion of the pairings. Changes in IPSPs were quantified by averaging the slope/amplitude over two 5 min windows: one immediately before the pairings and one 23-28 min after completion of the pairings. Statistical analyses were done using two-tailed, one-sample Student's t tests to compare the average normalized post-pairing IPSP slope/amplitude to one, and using two-tailed, two-sample (unpaired) Student's t tests to compare the paired pathway to the unpaired pathway. Similar analyses were done for the GABAB component by examining the amplitude of the responses at 150 msec (Fig. 1 D).
Figure 4.
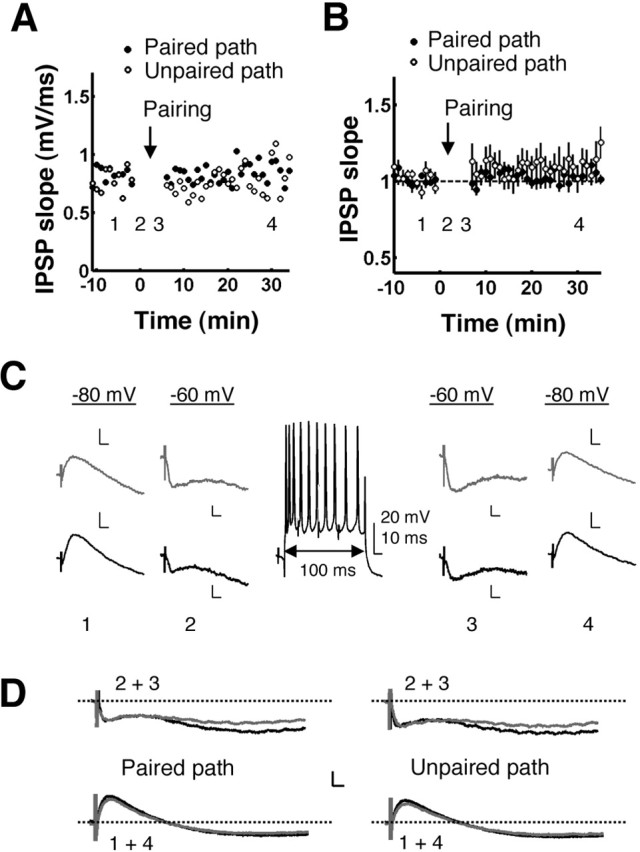
Pairing does not produce plasticity of IPSPs. A, Time course of IPSP slopes recorded from a representative CA1 pyramidal neuron at -80 mV in the presence of 20 μm CNQX. IPSPs were paired with postsynaptic depolarization in one pathway in the same manner as in Figure 1. IPSP slope is plotted versus time for the paired (filled circles) and unpaired (open circles) pathways for 10 min before and 30 min after the pairings. Each point is the average of three sweeps. The gap corresponds to the duration of the pairings (5 min) plus an additional minute before and after the pairings, in which IPSPs were evoked at -60 mV. Numbers 1-4 indicate times of the averaged responses shown in C. B, Pooled normalized data from nine experiments like the one shown in A. There was no significant change in mean IPSP slope in the paired pathway measured at the end of the experiment (p > 0.1) and no significant difference between the paired and unpaired pathways (p > 0.5). Error bars show ±SEM. C, Sample recordings from the same experiment shown in A. Top row (gray), Unpaired pathway; bottom row (black), paired pathway. Numbers 1-4 indicate times shown in A: 1 and 4, recorded at -80 mV, traces averaged over 5 min; 2 and 3, recorded at -60 mV, traces averaged over two sweeps. The center shows one of the pairings. Calibration: 2 mV, 10 msec; unless labeled otherwise. D, Average traces for all experiments for time points 1-4. Left, Paired pathway; right, unpaired pathway; black traces, before pairing, at time points 1 and 2; gray traces, after pairing, at time points 3 and 4. Immediately after pairing (top row), there was a significant decrease (p < 0.05) in the amplitude of the late component of the IPSP measured at 150 msec. However, this change was not significantly different between the paired and unpaired pathways (p = 0.5), and no changes were detected at 25 min after pairing in either the early or the late components of the IPSP (bottom row). Calibration: 2 mV, 10 msec.
Figure 1.

Pairing presynaptic and postsynaptic activity produces E-S potentiation. A, Normalized EPSP slopes before and after pairing-induced LTP in a representative CA1 pyramidal neuron. LTP was induced in the paired pathway only (open circles) and not in the unpaired pathway (filled circles). Data points from I/O curves (I/O #1, #2, and #3) and the pairings are not shown. B, Traces a and b correspond to responses in the unpaired path (top row) and paired path (bottom row) averaged over 3 min before and after the pairing protocol, at times a and b in A. The middle trace shows a sample recording of one of the pairings (4 pulses paired with a 100 msec depolarizing current pulse of 2-4 nA). Calibration: 5 mV, 20 msec; unless labeled otherwise. C, E-S curves from the paired pathway at three time points (I/O #1, #2, and #3) in the experiment shown in A. The E-S curve was similar after a 20 min control period (light gray to dark gray) but shifted leftward after the induction of LTP (black). D, Light and dark gray traces correspond to control conditions during I/O #1 and #2. Numbers 1-6 refer to the labeled points in C. After LTP (black traces, from I/O #3), threshold potential did not change but was reached by EPSPs of a smaller slope and hence longer latency (left). When matched for EPSP slope (right), the post-LTP EPSPs evoked more spikes.
Quantification of E-S shifts. Curve fitting was done using a custom written MATLAB program. The program provided the best fit using a sigmoid with two free parameters: S(x) = 1/(1 + exp[(E50 - x)/K]), where E50 was the EPSP slope at 50% firing probability, k inversely reflected the slope of the sigmoid, and the upper asymptote was equal to 1 (100% firing probability, or 10 spikes/10 trials). To compare two intracellular E-S curves, we analyzed the percentage of shift in E50:[E50(2) - E50(1)]/E50(1). Statistical analyses of the E50 shifts were done using two-tailed, one-sample Student's t tests to determine significant differences from zero and using two-tailed, two-sample (unpaired) Student's t tests to determine significant differences from control.
Pharmacology. All drugs (PTX, CNQX) were obtained from Sigma (St. Louis, MO). In experiments in which PTX was used, the CA3 region was removed with a knife cut at the time slices were made.
Model
All simulations were performed with NEURON (Hines and Moore, 1997). Each unit was simulated as an integrate-and-fire unit. The excitatory (Ex) unit had two compartments, representing the soma and an apical dendrite; inhibitory (Inh) units had a single compartment. The circuit incorporated 20 inputs (Input), allowing a possible range of intensities from 1 to 20. Each Input synapsed onto the Ex unit (Input→Ex) and 10 Inh units (Input→Inh); the 10 Inh units synapsed onto the Ex unit (Inh→Ex) (see Fig. 5A). The total synaptic weight onto each Inh neuron was varied so that increases in intensity corresponded to increases in the number of Inh neurons recruited. The synaptic delays and cellular parameters (see below) were chosen to reflect published electrophysiological data on excitatory and inhibitory cells in the hippocampus (Brown et al., 1981; Lacaille et al., 1987; Spruston and Johnston, 1992; Karnup and Stelzer, 1999). Inh units exhibited a lower threshold and faster time constant than Ex units, so that Inh units were easier to drive than Ex units, consistent with evidence that single-action potentials in pyramidal neurons can trigger spikes in inhibitory neurons (Miles, 1990; Marshall et al., 2002).
Figure 5.
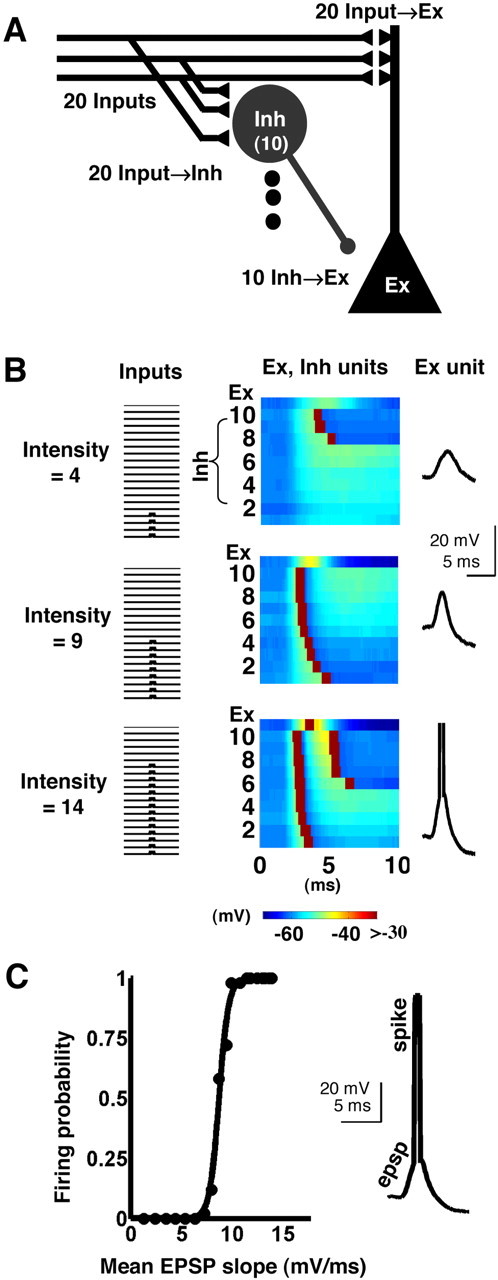
Model of CA1 circuit. A, Model of disynaptic inhibition circuit composed of one excitatory neuron (Ex), 10 inhibitory neurons (Inh), and 20 inputs (Input), with three synapse types: Input→Ex, Input→Inh, and Inh→Ex. The 20 different input fibers represent the Schaffer collaterals. Each input fiber synapses onto each of the 10 Inh neurons and onto the Ex neuron dendritic compartment. Each of the Inh neurons synapses onto the Ex neuron somatic compartment. B, Input, Inh, and Ex neuron responses for a single trial at each of three intensities. The middle panels show the voltages (color scale) of both the Ex unit (top rows) and the Inh units (all other rows) on the same time scale. In this example, low intensity stimulation was applied by activating only four input fibers, which activated three of the Inh cells with long latency. The resulting EPSP-IPSP waveform (right) can be measured at both the dendrite and soma of the Ex cell (shown here at the soma). At medium intensity, every Inh neuron fired an action potential, over a range of latencies, and the Ex unit was near threshold. At the highest intensity shown, the Inh units fired with short latency, half of the Inh neurons fired a second action potential with long latency, and the Ex unit was suprathreshold. C, Simulated E-S curve (I/O function) generated by running additional trials like the ones shown in B for 20 intensities. Fifty trials were run at each intensity, and the Ex neuron firing probability was plotted versus mean EPSP slope.
Integrate-and-fire units. Membrane time constants were 30 msec for the Ex unit (gpas = 0.1 mS/cm2; C = 3 μF/cm2) and 15 msec for the Inh units (gpas = 0.1 mS/cm2; C = 1.5 μF/cm2). The thresholds were -45 mV for the Ex unit and -50 mV for the Inh units. A random amount of noise current in the range of ±25 pA for the Ex unit and ±5 pA for the Inh units was injected at each time step (dt = 0.05 msec). In both Ex and Inh units, resting membrane potential (Epas) was -60 mV, and the voltage was determined by the following:
 |
When threshold was reached, gon (1 S/cm2) was switched on for the duration of the spike (0.6 msec), and the amplitude of the spike was determined by the equilibrium potential of gon (Eon = 40 mV). At offset, goff (1 S/cm2) was turned on for one time step, and the repolarizing potential after the spike was determined by the equilibrium potential of goff (Eoff =-53 mV for the Ex unit and -65 for the Inh units). The afterhyperpolarization (AHP) (gAHP = 0.35 mS/cm2 for the Ex unit and 0.02 mS/cm2 for the Inh units; EAHP =-90 mV) was also turned on with goff and decayed according to the following:
 |
where τAHP = 5 msec for the Ex unit and 10 msec for the Inh units. Because integrate-and-fire neurons do not have a relative refractory period, we incorporated a “dynamic threshold” in the Ex unit to reduce multiple spiking. The presence or absence of a dynamic threshold does not influence the data presented here because, as in the experimental data, we focused only on the probability of the first spike. The threshold of the Ex unit was increased by 30 mV immediately after a spike and returned to its initial value (Thr0 =-45 mV) according to the following:
 |
where τThr = 4 msec.
Synapses. The Input units were connected to the Ex and Inh units by excitatory synapses with AMPARs, and the Inh units were connected to the Ex unit by inhibitory synapses with GABAARs. The synaptic delays were 1.4 msec for Input→Ex and Input→Inh and 0.6 msec for Inh→Ex. AMPA and GABAA synaptic currents were simulated using a kinetic model as described previously (Destexhe et al., 1994; Buonomano, 2000). The reversal potentials were 0 mV for the excitatory synapses (EEx) and -70 mV for the inhibitory synapses (EInh). The forward (α) and backward (β) rate constants that determine transmitter binding to receptors were as follows: excitatory synapses: α = 1.5 msec-1mm-1, β = 0.75 msec-1; inhibitory synapses: α = 0.5 msec-1mm-1, β = 0.15 msec-1.
Simulations
E-S curves. In hippocampal slice experiments, a wide range of intensities are used to make the E-S curves, and increasing stimulation intensity results in increased recruitment of Schaffer collateral axons. Thus, I/O curves were simulated by sequentially activating each of the Inputs. The lowest intensity was simulated by a spike in a single Input, and higher intensities were simulated by recruiting additional Input units (see Fig. 5B). E-S curves were constructed in the same manner as for intracellular recordings (described above), by measuring the EPSP slope and spike probability at all intensities. For all intensities, the probability of cell firing in 50 trials was plotted versus the average EPSP slope over those 50 trials (see Fig. 5C). We quantified the changes in E-S curves by analyzing the threshold (E50) of the fitted sigmoidal functions (see Fig. 7 A, B).
Figure 7.
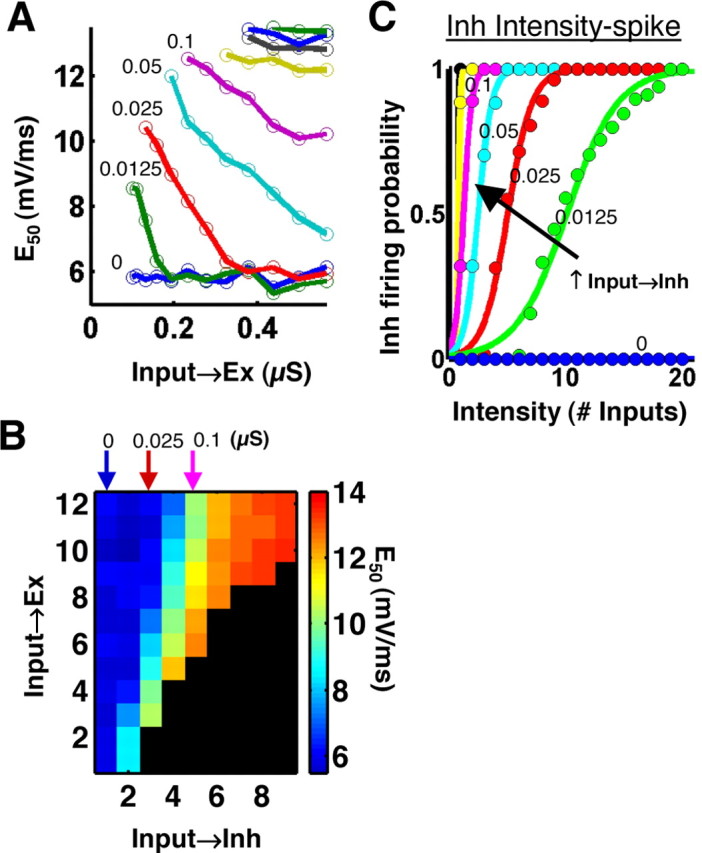
Synapse space. A, The E50 of the E-S curves (the EPSP slope at 50% firing probability) was examined while varying the Input→Inh and Input→Ex strengths over a range of values. Smaller E50 indicates a more leftward shifted E-S curve. The different colored lines represent nine different strengths of the Input→Inh connection (same color code in A and C; the numbers represent Input→Inh strengths in microsiemens). E-S potentiation can be seen as a decrease in E50 with increasing Input→Ex synaptic strength (i.e., LTP), in certain inhibitory states. B, E50 of the E-S curves is plotted on a color scale for each combination of Input→Inh (x-axis) and Input→Ex (y-axis) strengths tested. Note that the axes in B correspond to parameter number and not parameter value; therefore, these axes are not drawn to scale as in A. Note the color changes, representing changes in E50, along the horizontal (Input→Inh) axis, as well as the vertical (Input→Ex) axis for the middle values of Input→Inh strength. This implies that E-S potentiation can be produced by changes in inhibition as well as by LTP (in some inhibitory states). The E-S curves for a subset of the parameters, indicated by the arrows in B, were displayed in Figure 6 B. C, Intensity-spike curves for the Inh neuron population, as in Figure 6C. Each colored curve corresponds to the Input→Inh state of the same color used in A. E-S potentiation (A) was not produced in the conditions corresponding to either the floor or saturation states of the inhibitory neurons.
Long-term potentiation. When LTP is induced in slices, only a subset of synapses undergoes plasticity because the induction protocols are applied at intermediate intensities. In the simulations, to implement LTP in a physiological manner, only 50% of the Input synapses were modified (Inputs 1-10), which would correspond approximately to applying the induction protocol at half-maximum intensity. LTP was induced by increasing the synaptic conductance of the Input→Ex synapses by 110 to 560%. Note that these values do not directly translate into percentage of LTP, which was calculated as the percentage of increase in EPSP slope (see Fig. 6).
Figure 6.

Simulated E-S potentiation. A, EPSP slope was plotted versus intensity (number of Inputs activated) for different degrees of LTP (colored curves). We simulated LTP by increasing the Input→Ex strengths at the 10 lowest intensities. For each level of LTP, this resulted in a leftward/upward shift of the intensity-EPSP curve. The legend indicates the magnitudes of LTP produced, quantified as the normalized EPSP slope at Intensity = 10. The three rows correspond to different Input→Inh states (left). The magnitudes of LTP were identical in each state. B, E-S curves were constructed as in Figure 5C for the different degrees of LTP shown in A. The three rows correspond to the three inhibitory states shown in A; the colored curves in each panel correspond to the E-S curves produced after each level of LTP. The leftward shifts seen in the middle row (and to a lesser extent in the bottom row) represent E-S potentiation. C, Firing probability was plotted versus intensity (number of Inputs activated) for both the Ex neuron (colored curves) and the population of Inh neurons (black curves). The goal here was to understand the behavior of the Inh and Ex units together. The firing probability for the Inh neuron population was calculated as the mean percentage of Inh neurons firing at least one action potential. The three rows correspond to the same Input→Inh states as in A and B, and the colored curves correspond to the same levels of LTP. As Input→Inh strength increased (top to bottom row), the Inh intensity-spike curve shifted left, and the Ex intensity-spike curves shifted right. B and C together show that E-S potentiation occurred when the recruitment of excitation and inhibition were balanced (see also Fig. 7).
Results
Associative LTP produces E-S potentiation in CA1 pyramidal neurons
The hypothesis that LTP alone can produce E-S potentiation by changing the excitatory-inhibitory balance (Wilson et al., 1981; Abraham et al., 1987) generates the prediction that associative LTP induced with a pairing protocol should be sufficient to induce E-S potentiation in single cells. We tested this prediction using sharp intracellular recordings in CA1 pyramidal neurons from acute rat hippocampal slices. LTP was induced in one pathway by pairing EPSPs with postsynaptic depolarization (Fig. 1A,B). Specifically, 60 presentations of four pulses were paired with postsynaptic current injection (100 msec, 2-4 nA) sufficient to cause ∼10 spikes in the postsynaptic cell (see Materials and Methods). In the cells expressing LTP (21 of 23 cells; mean LTP, 209% of baseline), there was also significant E-S potentiation (mean E50 shift, -22.3%; n = 21; p < 0.005, t20 = -3.65) (Figs. 1C,D, 2). As a control, we analyzed a separate group of interleaved experiments in which the E-S curves were performed at the same time points as in the experimental group. The experiment shown in Figure 1 is an example in which both the control and LTP protocols were performed in the same cell. Specifically, after a baseline I/O curve (I/O #1), we waited 20 min, administered I/O #2, and subsequently used the pairing protocol to induce LTP. Between 10 and 20 min after completion of the pairing protocol, we administered I/O #3. As shown in Figure 1C, the E-S curves from I/O #1 (light gray) and I/O #2 (dark gray) were similar, but LTP produced a strong left shift of I/O #3 (black). In this example, there was a slight shift to the right of the E-S curve in the control conditions (I/O #1 to I/O #2), indicating the variability in making multiple E-S curves. This is also evident by the scatter of the control data in Figure 2. The degree of variability seems larger than in a simple LTP experiment, but this is expected because we are looking at a circuit property and because eliciting spikes near threshold is inherently probabilistic. On average, we detected no significant shift in the E-S curve in the control experiments (mean E50 shift, -3.41%; n = 22; p = 0.45; t21 =-0.77) (Fig. 2), and the mean shift produced in the LTP group was significantly different from control (unpaired two-tailed Student's t test; p = 0.016; t41= -2.52) (Fig. 2).
Figure 2.
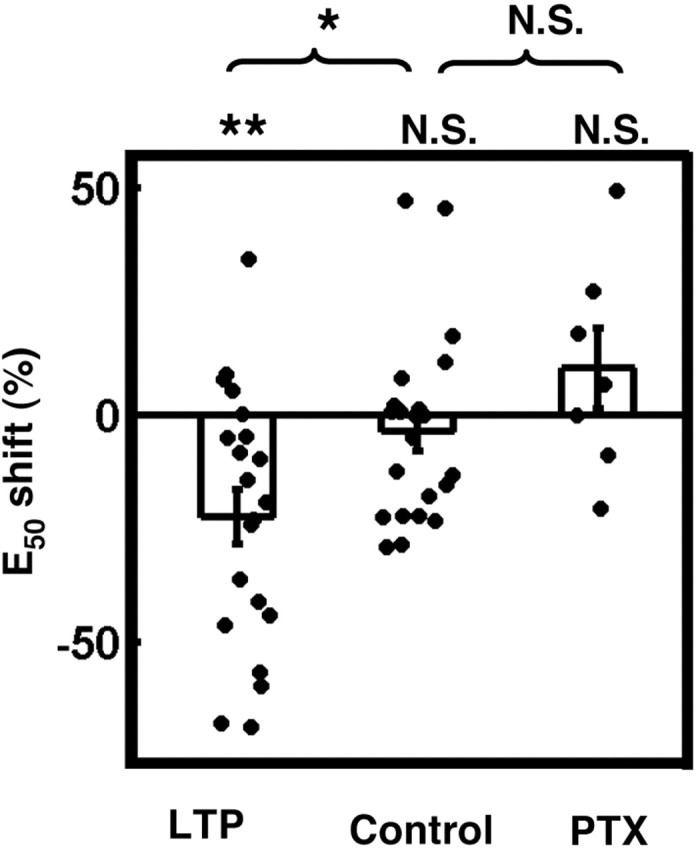
Pairing-induced E-S potentiation depends on GABAARs. The percentage of shift in E50 is plotted for associative LTP experiments (n = 21) and interleaved time control experiments (n = 22), in which I/O curves were made without inducing LTP. In a subset of experiments (n = 5) (see Fig. 1), the control and LTP experiments were performed in the same cell. Bars represent the mean; error bars represent ±SEM. In a separate set of experiments, LTP was induced and I/O curves were made in the continuous presence of 50 μm PTX (n = 7). Although associative LTP produced significant E-S potentiation in ACSF, the effect was blocked by PTX. N.S., Not significant; *significant difference from control (p < 0.05); **significant difference from zero (p < 0.005).
Examination of the voltage traces corresponding to pre- and post-LTP EPSPs close to firing threshold (50% firing probability) (Fig. 1D, left) revealed no apparent differences in resting membrane potential or in threshold potential after LTP. Note that after LTP, however, threshold was reached by broader EPSPs with smaller slopes and thus longer latencies. Pre- and post-LTP EPSPs of the same slope were analyzed by choosing points on the two E-S curves that were aligned vertically. Figure 1D (right) demonstrates that when matched for slope, post-LTP EPSPs reached a greater peak depolarization and elicited more action potentials than pre-LTP EPSPs, which appear to have been “cutoff” earlier by inhibition (Buonomano and Merzenich, 1998; Pouille and Scanziani, 2001). Because the pairing protocol used here is unlikely to have produced changes in IPSP strength or intrinsic excitability (see below), these data would suggest that LTP of pyramidal neuron EPSPs is sufficient to produce E-S potentiation by changing the excitatory/inhibitory ratio.
Pairing-induced E-S potentiation requires intact GABAAR-mediated inhibition
To further assess the relative contribution of inhibition versus intrinsic excitability in pairing-induced E-S potentiation, we repeated the above experiments in the continuous presence of the GABAAR antagonist PTX (50 μm). We found that although the mean LTP in PTX was 163% of baseline, PTX abolished pairing-induced E-S potentiation (Fig. 2). In fact, there was a trend toward a right shift of the E-S curve after pairing in PTX (mean E50 shift, 10.3%), but this shift was not significant (n = 7; p > 0.25; t6 = 1.17). We detected no significant difference in the E-S shifts produced in the PTX and time-control groups (unpaired two-tailed Student's t test; p = 0.15; t27 = 1.48). These findings suggest that the mechanism of pairing-induced E-S potentiation relies on GABAAergic inhibition and not on changes in intrinsic membrane properties. We also explicitly tested the effects of pairing on intrinsic excitability in these experiments by injecting a series of hyperpolarizing and depolarizing current steps before and after LTP induction (see Materials and Methods), and we found no significant changes in the input resistance (paired two-tailed Student's t test; meanpre = 39.2 MΩ; meanpost = 45.9 MΩ; n = 7; p > 0.30; t6 = 1.11) or threshold [two-way ANOVA with repeated measures over one factor (intensity); p = 0.95; F(1,12) = 0.0045] (Fig. 3). It is therefore unlikely that the pairing protocol used here produced changes in intrinsic neuronal excitability.
Associative pairing protocol does not produce plasticity of fast IPSPs
LTD in the Inh→Ex synapses was previously shown to contribute to tetanus-induced E-S potentiation (Lu et al., 2000; Chevaleyre and Castillo, 2003). Because the above findings showed that pairing-induced E-S potentiation required intact GABAAR-mediated inhibition, we next explored the possibility that the E-S potentiation we observed with pairing-LTP was caused by parallel plasticity of fast IPSPs. We recorded isolated IPSPs (Fig. 4) by including the AMPAR antagonist CNQX (20 μm) in the ACSF and recording at rest and hyperpolarized potentials (-80 mV). Note that NMDARs and metabotropic glutamate receptors (mGluRs) were intact, so potential inhibitory plasticity as described by Lu et al. (2000) and Chevaleyre and Castillo (2003) was not blocked. After a 10 min baseline period, we paired IPSPs with postsynaptic depolarization with the same protocol used above for the induction of LTP of EPSPs (Fig. 1). There were no significant changes in mean IPSP slope (Fig. 4) or amplitude (data not shown) in either the paired (n = 9; mean slope, 106% of baseline; p > 0.1; t8 = 1.51; mean amplitude, 97% of baseline; p > 0.5; t8 =-0.63) or unpaired (n = 8; mean slope, 108% of baseline; p = 0.30; t7 = 1.12; mean amplitude, 101% of baseline; p > 0.5; t7 = 0.16) pathways, and the paired pathway did not differ significantly from the unpaired pathway in either average normalized slope (unpaired Student's t tests; p > 0.5; t15 = 0.21) or amplitude (p > 0.5; t15 = 0.58). Thus, the associative pairing protocol used to produce LTP of EPSPs did not produce changes in fast IPSPs. Note that short-term changes, measured within 1 min after pairing, were observed in the late component of the IPSPs (Fig. 4D, top row) (mean amplitude at 150 msec, 70% of baseline; p < 0.05; t7 =-2.38). However, these short-term changes were not significantly different from changes produced in the unpaired pathway (unpaired Student's t test; p = 0.5; t12 = -0.717), and long-term changes in the late component were not observed (Fig. 4D, bottom row). Moreover, because the latency of GABABR-mediated slow IPSPs is longer than the mean action potential latency in response to a single stimulus (Marder and Buonomano, 2003), it is unlikely that GABABR plasticity contributes to E-S potentiation. Taken together, the above findings thus suggest that pairing-induced E-S potentiation is caused by a relative decrease in inhibition after LTP and not by LTD of IPSPs or increases in intrinsic neuronal excitability.
Model of CA1 disynaptic inhibitory circuitry
To further characterize the minimal mechanisms necessary for E-S plasticity, we developed a model of CA1 that was aimed at reproducing the I/O characteristics observed in acute hippocampal slices. Our disynaptic model of CA1 circuitry was composed of a single excitatory (Ex) neuron and a population of 10 inhibitory (Inh) neurons arranged in a feedforward manner, with two synapse types represented in the feedforward inhibitory branch (Fig. 5A). The circuit incorporated 20 inputs (Input) and a total of three synapse types: Input→Ex, Input→Inh, and Inh→Ex. Each unit was simulated as a single or dual compartment integrate-and-fire unit (see Materials and Methods). Figure 5B shows sample responses of each unit at three different intensities. E-S I/O curves for the Ex neuron (Fig. 5C) were constructed in the same manner as for intracellular experiments. That is, for a given set of parameters, multiple trials per intensity were run, and the probability of an action potential occurring in the Ex unit was used as the output measure (ordinate axis). The mean EPSP slope was used as the input measure (abscissa). In addition to generating the appropriate E-S curves, the model qualitatively simulated the expected left shift produced by decreasing inhibition. Specifically, increasing the concentration of PTX produced progressive left shifts of field E-S curves (p < 0.0001; F(3,33) = 68.4; data not shown) (Abraham et al., 1987; Lu et al., 2000). Analogous experiments in the simulations revealed similar progressive left shifts (data not shown) (see also Fig. 7B). Thus, our computational model of CA1 was capable of simulating the essential features of the experimentally observed E-S curves.
Simulated LTP produces E-S potentiation in specific inhibitory states
We next used the model to examine the hypothesis that pyramidal cell LTP is capable of generating E-S potentiation in the absence of inhibitory plasticity or changes in excitability (Wilson et al., 1981; Abraham et al., 1987). Because E-S potentiation studies have been performed over a variety of intensity levels and in different genetic (Lu et al., 2000) and pharmacological conditions (Evans and Viola-McCabe, 1996), we studied the effects of LTP on the simulated E-S curves over a wide range of different initial conditions. We performed a parametric analysis of synapse space to analyze the E-S shifts produced by LTP across a series of Input→Inh strengths (Figs. 6, 7). This approach allowed us to determine whether E-S potentiation was present in all or in some inhibitory states and whether discrepancies in previously published experimental results may have arisen from experimental conditions. To examine the effects of LTP on the E-S curves, we performed simulations that were comparable with LTP experiments in slices. We simulated a range of magnitudes of LTP by incrementally increasing the synaptic weights at half of the Input→Ex synapses, the half activated by the lower intensities, as would occur during LTP induction in slices (see Materials and Methods). Figure 6A shows four different degrees of LTP (colored curves) in three different Input→Inh states (rows). Note that in the simulations, LTP produced leftward/upward shifts of the intensity-EPSP relationship, consistent with experimental observations and the definition of LTP (Bliss and Lomo, 1973; Leung and Au, 1994). Although the Input→Inh state did not affect the magnitude of LTP produced (Fig. 6A), it did affect whether or not E-S potentiation was produced (Fig. 6B). In the absence of inhibition (Input→Inh = 0 μS), LTP failed to produce E-S potentiation (Fig. 6B, top), whereas with moderate inhibition (Input→Inh = 0.025, 0.1 μS), LTP shifted the E-S curve to the left (Fig. 6B, middle and bottom). We quantified the relationship between the strength of the Input→Inh connection and E-S potentiation by examining the E50 of the E-S curves (the EPSP slope at 50% firing probability) across synapse space (Fig. 7A,B). The results show that LTP produced a decrease in the E50 of the E-S curve (i.e., E-S potentiation) when LTP was implemented at intermediate Input→Inh weights, but not at very large or very small Input→Inh weights (Fig. 7A,B).
E-S potentiation occurs in states in which inhibition and excitation are balanced
We have shown that whether or not LTP at the Input→Ex synapses produced E-S potentiation was a function of the strength of the Input→Inh synapses. To better understand the conditions under which E-S potentiation occurred, we examined the firing behavior of the Inh and Ex units together (Fig. 6C). Because the slope of the EPSP in the Ex neuron is not a relevant measure for the Inh units, we plotted firing probability against number of Input fibers activated (intensity-spike curves). This allowed us to examine the relative recruitment of Ex and Inh spikes with increasing intensity in different inhibitory states. As with the E-S curves shown in Figure 6B, the colored curves in Figure 6C represent the firing probability of the Ex neuron, after different degrees of LTP. The black curves represent the firing probability of the Inh neuron population. The top panel depicts a condition similar to a PTX experiment (Input→Inh = 0 μS). In this case, no inhibition was present because the inhibitory neurons never fired, as indicated by the flat black line. The middle panel shows a condition of moderate Input→Inh strength, in which inhibition and excitation were recruited in a balanced manner. Note, however, that before LTP, the Inh intensity-spike curve (black) was to the left of the Ex intensity-spike curve (blue), indicating that the Inh neurons began firing at lower intensities than the Ex neuron. In the bottom panel, Input→Inh strength was greater, causing the Inh intensity-spike curve to shift farther left and the Ex intensity-spike curve to shift farther right. This resulted in a greater separation between the intensities for recruiting excitation and inhibition. The intensity-spike curves for the Inh neuron population are replotted in Figure 7C for nine different Input→Inh strengths (color-coded as in Fig. 7A). By comparing A and C in Figure 7, it appears that shifts in E50 did not occur in the conditions corresponding to either the floor or saturation states of the inhibitory neurons. We argue that the range of states in which E-S potentiation occurred is precisely the physiological range, because inhibition and excitation are normally recruited in a balanced manner that allows inhibition to have an impact on Ex neuron activity (Galarreta and Hestrin, 1998; Karnup and Stelzer, 1999; Pouille and Scanziani, 2001). Moreover, inhibitory neurons are driven by fewer input fibers than excitatory neurons (Miles, 1990; Marshall et al., 2002), consistent with the data shown in the middle and bottom panels of Figure 6C.
Mechanism of E-S potentiation is a change in the number and latency of recruited inhibitory neurons relative to EPSP slope
The above data would suggest that changes in the relative recruitment of excitatory and inhibitory strengths are important for E-S potentiation, because E-S potentiation was observed in states in which the Ex and Inh dynamic ranges overlapped (Fig. 6C, middle). However, E-S potentiation was also observed in states in which the dynamic range of the Ex neuron did not correspond with changes in the probability of Inh neurons firing, because Inh firing was already maximal (Fig. 6C, bottom). Thus, relative changes in the recruitment of Inh neurons alone cannot fully explain E-S potentiation. To further understand the mechanisms underlying the E-S shifts, we examined the responses of the Inh neuron population and the Ex neuron in the states that generated E-S potentiation. Figure 8A shows two E-S curves from the middle panel of Figure 6B (blue and magenta curves), along with voltage traces illustrating the magnitude of LTP at low-intensity stimulation (intensity, three Inputs). The traces in Figure 8B correspond to the numbered points on the E-S curves, showing that after LTP, threshold was reached by broader EPSPs with smaller slopes and thus longer latencies, as was shown in the experimental data (Fig. 1D). The traces in Figure 8C correspond to the boxed points on the E-S curves that intersect the vertical dotted line. Thus, the EPSP slopes in Figure 8C are matched for each condition. Note that the EPSPs from the potentiated Input→Ex conditions (magenta) were more likely to elicit spikes for the same-sized EPSP slope. The key question regarding E-S potentiation is why does an EPSP of the same slope have a higher probability of producing an action potential after LTP? Because a direct consequence of LTP is that EPSP slopes are enhanced without changing the intensity, it follows that the intensity must be lowered to produce the same EPSP slope after LTP. When the intensity is lowered, there are two effects on the inhibitory neuron population: decreased firing and increased latency (Fig. 5). Indeed, comparison of the Inh neuron population (Fig. 8C, right) related to each of the matched EPSPs revealed that after LTP, the same-sized EPSP slope was evoked with fewer Inh neurons firing. Moreover, the Inh neurons fired at longer latencies (Fig. 8C, right).
Figure 8.
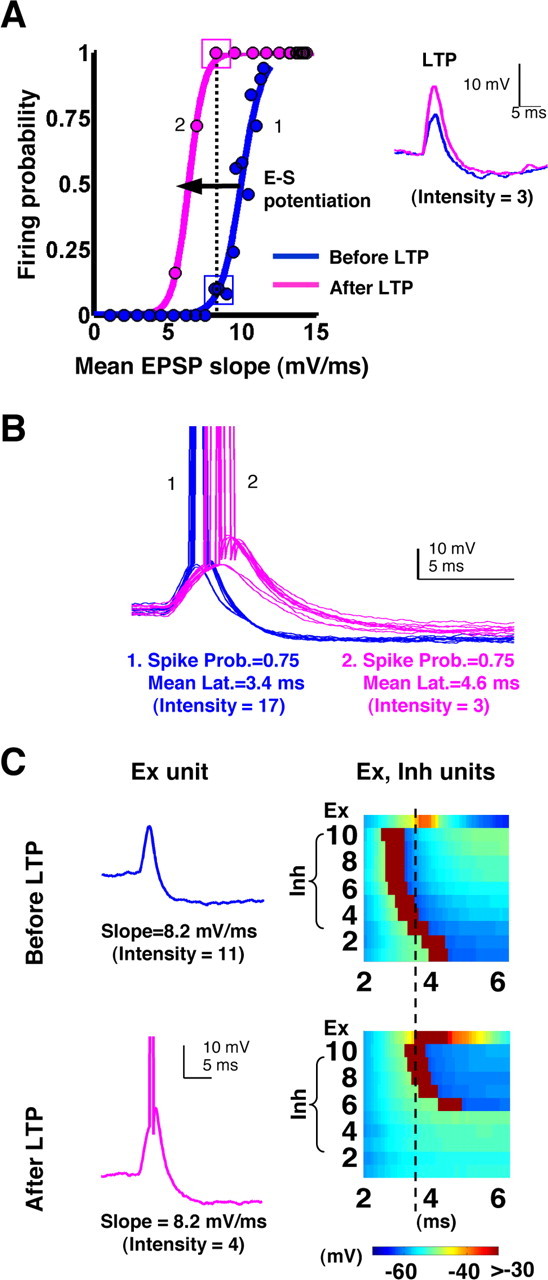
Timing and balance of inhibition underlie E-S potentiation. Detailed Ex and Inh neuron data from the simulated LTP experiment shown in the middle panel of Figure 6 B (blue and magenta E-S curves) are shown. A, The baseline E-S curve is shown in blue, along with the baseline EPSP evoked at Intensity = 3. LTP was induced by increasing the Input→Ex strength at 10 of the 20 input synapses. The post-LTP EPSP (magenta) evoked at Intensity = 3 is shown superimposed on the baseline EPSP (blue). E-S potentiation is seen as the left shift of the E-S curve (blue to magenta). The dotted line indicates the EPSP slope for which the most dramatic effect of E-S potentiation is observed. The points on this line (boxes) are presented in C. B, Ten sample traces (of a total of 50) from the points labeled 1 and 2 on the E-S curves in A. At the intensities that produced the same spike probability before and after LTP, the traces before LTP exhibited a shorter latency to spike. This is consistent with the experimental data shown in Figure 1. C, Plots of the voltage responses of the Ex and Inh neurons at the intensities producing matched EPSPs (A; dotted line). The traces on the left show that the same EPSP slope produced a subthreshold EPSP before LTP but a suprathreshold EPSP after LTP. As in the experimental studies in which we decreased the stimulus intensity to match the EPSP slopes, note that here we are comparing EPSPs at different intensities. The panels on the right show the responses of both the Ex neuron and the population of Inh neurons. The vertical dashed line is drawn for reference. After LTP, the intensity needed to produce the same EPSP slope recruited fewer Inh neurons, and those that were recruited exhibited a longer latency. This produced an apparent facilitation of the EPSP amplitude, so that a previously subthreshold EPSP slope could now produce an action potential, thus generating E-S potentiation.
As noted above, some cases of E-S potentiation were observed without visible changes in the relative recruitment of Inh neurons. In these cases, the shift in the latency of firing of the Inh neurons was the mechanism of E-S potentiation. It is well established that the timing of the arrival of excitation and inhibition plays a powerful role in controlling Ex neuron firing (Karnup and Stelzer, 1999; Fricker and Miles, 2000; Pouille and Scanziani, 2001) (see Discussion). The increase in the latency of Inh neurons observed here was critical for E-S potentiation because it allowed the Ex neuron to reach a greater peak depolarization before the onset of a significant degree of inhibition. As a result, post-LTP EPSPs of a fixed slope had a higher probability of reaching threshold before being cutoff by inhibition. Thus, E-S potentiation was caused by changes in the relative recruitment and timing of inhibitory neurons.
Discussion
In this study, we showed that associative LTP produced E-S potentiation, an enhancement of spike probability in response to a synaptic input of a fixed magnitude (Figs. 1, 2). E-S potentiation was dependent on GABAAergic inhibition (Fig. 2) but was not caused by inhibitory plasticity (Fig. 4) or changes in intrinsic excitability (Fig. 3). These findings suggested that E-S potentiation was caused by changes in the excitatory-inhibitory balance in local circuits. We developed a neural network model of the CA1 disynaptic inhibitory circuitry (Fig. 5) to examine the mechanisms underlying the effect of LTP on the neuronal I/O function. As suggested previously, simulations showed that LTP of EPSPs onto a pyramidal neuron changed the balance of excitation and inhibition relative to a given EPSP slope (Fig. 8C). Furthermore, the model revealed that an important component of the shift in the excitatory-inhibitory balance was attributable to changes in the timing of spikes in the inhibitory neurons (Fig. 8C). Thus, under intact pharmacological conditions, E-S potentiation should be an obligatory component of Hebbian forms of associative LTP, supporting a physiological role for E-S potentiation.
Pairing-induced E-S potentiation
E-S potentiation has been reported previously in the hippocampus in the context of high-frequency stimulation or theta burst stimulation to induce LTP. Paired orthodromic and antidromic stimulation has also been used previously to produce an extracellular associative E-S potentiation that was expressed without LTP (Jester et al., 1995). E-S potentiation had not yet been examined intracellularly using an associative LTP induction protocol. A pairing protocol would be expected to produce intracellular LTP of the EPSPs, without changing the other synapses in the network (Input→Inh and Inh→Ex). Because it was suggested previously that E-S potentiation relies on plasticity at other synaptic loci (see below) (McMahon and Kauer, 1997; Lu et al., 2000; Chevaleyre and Castillo, 2003), it has most likely been assumed that E-S potentiation would not be observed using an intracellular pairing protocol. However, it was also previously suggested that LTP alone could produce E-S potentiation by shifting the excitatory-inhibitory balance (Wilson et al., 1981; Abraham et al., 1987). Here, we demonstrated that associative LTP induced by pairing EPSPs with postsynaptic depolarization produced E-S potentiation (Figs. 1, 2), supporting the idea that LTP alone is sufficient for E-S potentiation.
It was important to rule out the possibilities that changes in intrinsic excitability or in the inhibitory synapses could also have contributed to the E-S potentiation observed here. Several recent studies have focused on the long-term plasticity of intrinsic excitability and its possible relationship to E-S potentiation (Sourdet et al., 2003; Frick et al., 2004) (for review, see Daoudal and Debanne, 2003; Zhang and Linden, 2003). These studies have not, in general, used a pairing protocol to induce LTP (but see Frick et al., 2004) (Wang et al., 2003). Here, we found that pairing does not change input resistance or firing threshold (Fig. 3), consistent with previous reports using a similar protocol (Buonomano and Merzenich, 1996; Buonomano, 1999; Feldman, 2000). Although we did not observe changes in excitability as measured in the soma (Fig. 3), we cannot rule out local changes in dendritic excitability as reported by Frick et al. (2004). However, that study reported increases in the amplitude of back-propagating action potentials, which were already generated at the soma. Therefore, we would not expect these local dendritic changes to explain E-S potentiation. LTD of Inh→Ex synaptic strengths has been reported as a mechanism for tetanus-induced E-S potentiation that relies on calcineurin signaling and NMDARs (Lu et al., 2000) or endocannabinoid signaling and mGluRs (Chevaleyre and Castillo, 2003). Both of these types of inhibitory plasticity were not blocked in our experiments because we studied IPSPs in the presence of CNQX only. Because we found no changes in fast IPSPs after pairing (Fig. 4), we conclude that the mild induction protocol used here to induce LTP is unlikely to have induced inhibitory plasticity.
Mechanisms underlying E-S potentiation
Because of the relative complexity of understanding the I/O functions of CA1 neurons, we developed a computational model of the CA1 circuitry to examine the mechanisms underlying E-S potentiation. Our computer simulations revealed that LTP of the Input→Ex synapses was sufficient for E-S potentiation, in the absence of excitability changes or inhibitory plasticity. This was only the case, however, if inhibition was present and if inhibition was balanced with excitation (Figs. 6, 7). Analysis of the simulations revealed that E-S potentiation occurred because after LTP, a given EPSP slope could be reached with a lower stimulation intensity, which elicited fewer spikes, and spikes with longer latencies, in the inhibitory neuron population (Fig. 8C). The requirement for balanced inhibition and excitation thus arose because in order for E-S potentiation to occur, the intensity differences for matching pre- and post-LTP EPSP slopes had to correspond with functional changes in inhibition. If all intensities of the Ex neuron I/O curves before and after LTP elicited similar inhibition, then the same EPSP slope led to the same firing probability, and E-S shifts did not occur. Previous results suggest that the physiological state is indeed one in which excitation is balanced with inhibition (Galarreta and Hestrin, 1998; Karnup and Stelzer, 1999; Pouille and Scanziani, 2001). Therefore, our data indicate that a primary mechanism of E-S potentiation is that EPSPs of a fixed slope evoked after LTP have less effective inhibition and thus a greater probability of reaching firing threshold. Theoretically, this mechanism will operate whenever LTP is produced under intact pharmacological conditions.
The data presented here establish that LTP of EPSPs is sufficient to produce E-S potentiation because LTP changes the relative recruitment and latency of inhibitory neurons. These results do not imply however, that other mechanisms do not also contribute under some experimental conditions. For instance, either LTD of IPSPs or a change in excitability likely underlies the cases of E-S potentiation that have been reported to occur in the absence of LTP (Bliss and Lomo, 1973; Andersen et al., 1980; Abraham et al., 1985; Taube and Schwartzkroin, 1988; Jester et al., 1995). Nonetheless, whereas E-S potentiation is reliably observed in the hippocampus after tetanus-LTP, studies addressing the issue of tetanus-induced plasticity in the inhibitory branch of the disynaptic circuit have reported a variety of results (McLean et al., 1996; McBain and Maccaferri, 1997; McBain et al., 1999; Gaiarsa et al., 2002), ranging from no changes in inhibition (Abraham et al., 1987), to LTP of IPSPs (Kairiss et al., 1987; Stelzer et al., 1994; Ouardez and Lacaille, 1995; Xie et al., 1995; Maccaferri and McBain, 1996; Cowan et al., 1998; Shew et al., 2000; Perez et al., 2001) to LTD of IPSPs (McMahon and Kauer, 1997; Lu et al., 2000; Chevaleyre and Castillo, 2003). Although we argue that inhibitory plasticity does not contribute to E-S potentiation when using a relatively mild pairing protocol, it may play a significant role under other induction protocols that more strongly engage the inhibitory circuitry.
Functional significance of E-S potentiation
Behavior is ultimately determined by I/O transformations imposed by neural circuits. Accordingly, it is not LTP itself but, rather, changes in whether or not a neuron fires, or when it fires, in a given context that in the end must underlie changes in behavior. Although LTP of the Schaffer collateral-to-CA1 pyramidal neuron synapses has been proposed to underlie certain forms of hippocampal-dependent learning, E-S potentiation could play an equally important role by potentiating the I/O function of neurons. Consequently, changes in the expression or properties of E-S potentiation could explain the dissociation between learning and LTP observed in some transgenic animals. For example, mice with the α5-subunit of the GABAAR knocked out are reported to have enhanced hippocampal-dependent learning and normal LTP (Collinson et al., 2002; Crestani et al., 2002). It is possible that genetic manipulations could shift the inhibitory state or change the plasticity profile of various synapse types in ways that could alter E-S potentiation without changing LTP or vice versa. Moreover, subtle changes in the dynamic range of inhibitory neurons or even small changes of 1-2 msec in the latency to fire of the inhibitory neurons might lead to functional changes in the I/O function of hippocampal neurons and changes in E-S potentiation, independent of changes in LTP per se. Therefore, an understanding of the conditions influencing E-S potentiation may be essential to understanding the nature of the relationship between LTP and learning.
Importance of inhibition in neural computations
Most experimental work on synaptic plasticity (Brown et al., 1990; Malenka and Nicoll, 1999), as well as theoretical work on neural processing (Hebb, 1949; von der Malsburg, 1973), has thus far focused on changes in the strength of EPSPs between excitatory neurons. However, it is increasingly clear that inhibition plays a fundamental role in neural processing (Sillito, 1975; Crook and Eysel, 1992; Buonomano, 2000; Shapley et al., 2003; Wehr and Zador, 2003). As stated above, changes in neural firing are controlled by both excitation and inhibition. In a simple disynaptic circuit composed of a single excitatory (Ex) neuron and a population of inhibitory (Inh) neurons, whether or not the Ex neuron fires in response to a single pulse depends primarily on the net interaction between the synaptic weights at three synapse types: Input→Ex, Input→Inh, and Inh→Ex. The firing characteristics of the Ex cell after the induction of LTP will depend, in part, on whether the LTP induction protocol alters the synaptic strength at the Input→Inh or Inh→Ex synapses (Fig. 7B). The I/O function of the pyramidal cell is furthermore dependent on the nonlinearities of the firing of the Inh neuron population and, more importantly, on the temporal relationship between the arrival of the EPSP and IPSP (Figs. 6, 7, 8). Indeed, shifts of a few milliseconds in the spike timing of inhibitory neurons can determine whether the Ex neuron will fire or not (Buonomano, 2000; Pouille and Scanziani, 2001; Wehr and Zador, 2003).
As discussed previously (Buonomano, 2000; Marder and Buonomano, 2003), the ability of an IPSP to cutoff an ascending EPSP and to prevent it from reaching threshold arises, in part, from the disynaptic nature of inhibition, which provides a head start for the EPSP, and from the relatively fast time constant of inhibitory neurons (Brown et al., 1981; Spruston and Johnston, 1992), which allows the EPSP and IPSP to interact. Thus, implicit in our study is that inhibition is disynaptic, with minimal contribution from direct stimulation of inhibitory axons. We and others have shown that to elicit IPSPs in the presence of CNQX/APV, the distance between the recording and stimulating electrodes should generally be <100 μm (Davies and Collingridge, 1989; Davies et al., 1990, their Fig. 1A; Zhang et al., 1993; Roepstorff and Lambert, 1994; Lu et al., 2000; Marder and Buonomano, 2003; current study) (Fig. 4 and data not shown). At distances >200 μm, it is known that activation of IPSPs is disynaptic (Davies and Collingridge, 1989; Davies et al., 1990; Pouille and Scanziani, 2001). The disynaptic nature of the IPSPs in our experiments is consistent with the fact that we never observed IPSP onsets before EPSP onsets.
Conclusion
The experimental and theoretical findings presented here demonstrate the importance of understanding the dynamic nature of the excitatory-inhibitory balance, and how this balance sculpts the I/O function of pyramidal neurons. Specifically, we show that relatively subtle changes in the number of inhibitory neurons recruited or in the latency of the inhibitory neurons are sufficient to produce E-S potentiation. Thus, an interesting consequence of the fact that pyramidal neurons receive balanced excitation and inhibition is that LTP will produce a shift in the I/O function, further enhancing the ability of LTP to increase cell firing.
Footnotes
This work was supported by National Institutes of Health (NIH) Grant MH60163. C.P.M. was supported by NIH National Institute of General Medical Sciences Training Grant GM08042, the Medical Scientist Training Program, the Aesculapians Fund of the David Geffen School of Medicine at University of California, Los Angeles, and the ARCS (Achievement Rewards for College Scientists) Foundation. We thank Uma Karmarkar and Tom O'Dell for reading previous versions of this manuscript.
Correspondence should be addressed to Dr. Dean V. Buonomano, Brain Research Institute, University of California, Los Angeles, Box 951761, Gonda Center, 695 Young Drive South, Los Angeles, CA 90095. E-mail: dbuono@ucla.edu.
Copyright © 2004 Society for Neuroscience 0270-6474/04/248873-12$15.00/0
References
- Abraham WC, Bliss TVP, Goddard GV (1985) Heterosynaptic changes accompany long-term but not short-term potentiation of the perforant path in the anaesthetized rat. J Physiol (Lond) 363: 335-349. [DOI] [PMC free article] [PubMed] [Google Scholar]
- Abraham WC, Gustafsson B, Wigstrom H (1987) Long-term potentiation involves enhanced synaptic excitation relative to synaptic inhibition in guinea-pig hippocampus. J Physiol (Lond) 394: 367-380. [DOI] [PMC free article] [PubMed] [Google Scholar]
- Andersen P, Sundberg SH, Sveen O, Swann JW, Wigstrom H (1980) Possible mechanisms for long-lasting potentiation of synaptic transmission in hippocampal slices from guinea pigs. J Physiol (Lond) 302: 463-482. [DOI] [PMC free article] [PubMed] [Google Scholar]
- Bliss TV, Collingridge GL (1993) A synaptic model of memory: long-term potentiation in the hippocampus. Nature 361: 31-39. [DOI] [PubMed] [Google Scholar]
- Bliss TVP, Gardner-Medwin AR (1973) Long-lasting potentiation of synaptic transmission in the dentate area of the unanaesthetized rabbit following stimulation of the perforant path. J Physiol (Lond) 232: 357-374. [DOI] [PMC free article] [PubMed] [Google Scholar]
- Bliss TVP, Lomo T (1973) Long-lasting potentiation of synaptic transmission in the dentate area of the anaesthetized rabbit following stimulation of the perforant path. J Physiol (Lond) 232: 331-356. [DOI] [PMC free article] [PubMed] [Google Scholar]
- Brown TH, Fricke RA, Perkel DH (1981) Passive electrical constants in three classes of hippocampal neurons. J Neurophysiol 46: 812-827. [DOI] [PubMed] [Google Scholar]
- Brown TH, Kairiss EW, Keenan CL (1990) Hebbian synapses: biophysical mechanisms and algorithms. Annu Rev Neurosci 13: 475-511. [DOI] [PubMed] [Google Scholar]
- Buonomano DV (1999) Distinct functional types of associative long-term potentiation in neocortical and hippocampal pyramidal neurons. J Neurosci 19: 6748-6754. [DOI] [PMC free article] [PubMed] [Google Scholar]
- Buonomano DV (2000) Decoding temporal information: a model based on short-term synaptic plasticity. J Neurosci 20: 1129-1141. [DOI] [PMC free article] [PubMed] [Google Scholar]
- Buonomano DV, Merzenich MM (1996) Associative synaptic plasticity in hippocampal CA1 neurons is not sensitive to unpaired presynaptic activity. J Neurophysiol 76: 631-636. [DOI] [PubMed] [Google Scholar]
- Buonomano DV, Merzenich MM (1998) Net interaction between different forms of short-term synaptic plasticity and slow-IPSPs in the hippocampus and auditory cortex. J Neurophysiol 80: 1765-1774. [DOI] [PubMed] [Google Scholar]
- Buzsáki G (1984) Feed-forward inhibition in the hippocampal formation. Prog Neurobiol 22: 131-153. [DOI] [PubMed] [Google Scholar]
- Chavez-Noriega LE, Bliss TVP, Halliwell JV (1989) The EPSP-spike (E-S) component of long-term potentiation in the rat hippocampal slice is modulated by GABAergic but not cholinergic mechanisms. Neurosci Lett 104: 58-64. [DOI] [PubMed] [Google Scholar]
- Chevaleyre V, Castillo PE (2003) Heterosynaptic LTD of hippocampal GABAergic synapses: a novel role of endocannabinoids in regulating excitability. Neuron 38: 461-472. [DOI] [PubMed] [Google Scholar]
- Collinson N, Kuenzi FM, Jarolimek W, Maubach KA, Cothliff R, Sur C, Smith A, Out FM, Howell O, Atack JR, McKernan RM, Seabrook GR, Dawson GR, Whiting PJ, Rosahl TW (2002) Enhanced learning and memory and altered GABAergic synaptic transmission in mice lacking the alpha 5 subunit of the GABAA receptor. J Neurosci 22: 5572-5580. [DOI] [PMC free article] [PubMed] [Google Scholar]
- Cowan AI, Stricker C, Reece LJ, Redman SJ (1998) Long-term plasticity at excitatory synapses on aspinous interneurons in area CA1 lacks synaptic specificity. J Neurophysiol 79: 13-20. [DOI] [PubMed] [Google Scholar]
- Crestani F, Keist R, Fritschy J-M, Benke D, Vogt K, Prut L, Bluthmann H, Mohler H, Rudolph U (2002) Trace fear conditioning involves hippocampal α5 GABAA receptors. Proc Natl Acad Sci USA 99: 8980-8985. [DOI] [PMC free article] [PubMed] [Google Scholar]
- Crook JM, Eysel UT (1992) GABA-induced inactivation of functionally characterized sites in cat visual cortex (Area 18): effects on orientation tuning. J Neurosci 12: 1816-1825. [DOI] [PMC free article] [PubMed] [Google Scholar]
- Daoudal G, Debanne D (2003) Long-term plasticity of intrinsic excitability: learning rules and mechanisms. Learn Mem 10: 456-465. [DOI] [PubMed] [Google Scholar]
- Daoudal G, Hanada Y, Debanne D (2002) Bidirectional plasticity of excitatory postsynaptic potential (EPSP)-spike coupling in CA1 hippocampal pyramidal neurons. Proc Natl Acad Sci USA 99: 14512-14517. [DOI] [PMC free article] [PubMed] [Google Scholar]
- Davies CH, Davies SN, Collingridge GL (1990) Paired-pulse depression of monosynaptic GABA-mediated inhibitory postsynaptic responses in rat hippocampus. J Physiol (Lond) 424: 513-531. [DOI] [PMC free article] [PubMed] [Google Scholar]
- Davies SN, Collingridge GL (1989) Role of excitatory amino acid receptors in synaptic transmission in area CA1 of rat hippocampus. Proc R Soc Lond B Biol Sci 236: 373-384. [DOI] [PubMed] [Google Scholar]
- Destexhe A, Mainen ZF, Sejnowski TJ (1994) An efficient method for computing synaptic conductances based on a kinetic model of receptor binding. Neural Comput 6: 14-18. [Google Scholar]
- Evans MS, Viola-McCabe KE (1996) Midazolam inhibits long-term potentiation through modulation of GABAA receptors. Neuropharmacology 35: 347-357. [DOI] [PubMed] [Google Scholar]
- Feldman DE (2000) Timing-based LTP and LTD at vertical inputs to layer II/III pyramidal cells in rat barrel cortex. Neuron 27: 45-56. [DOI] [PubMed] [Google Scholar]
- Frick A, Magee J, Johnston D (2004) LTP is accompanied by an enhanced local excitability of pyramidal neuron dendrites. Nat Neurosci 7: 126-135. [DOI] [PubMed] [Google Scholar]
- Fricker D, Miles R (2000) EPSP amplification and the precision of spike timing in hippocampal neurons. Neuron 28: 559-569. [DOI] [PubMed] [Google Scholar]
- Gaiarsa J-L, Caillard O, Ben-Ari Y (2002) Long-term plasticity at GABAergic and glycinergic synapses: mechanisms and functional significance. Trends Neurosci 25: 564-570. [DOI] [PubMed] [Google Scholar]
- Galarreta M, Hestrin S (1998) Frequency-dependent synaptic depression and the balance of excitation and inhibition in the neocortex. Nat Neurosci 1: 587-594. [DOI] [PubMed] [Google Scholar]
- Hebb DO (1949) The organization of behavior: a neuropsychological theory. New York: Wiley.
- Hines ML, Moore JW (1997) Computer simulations with NEURON. http://neuron.duke.edu/.
- Jester JM, Campbell LW, Sejnowski TJ (1995) Associative EPSP-spike potentiation induced by pairing orthodromic and antidromic stimulation in rat hippocampal slices. J Physiol (Lond) 484 3: 689-705. [DOI] [PMC free article] [PubMed] [Google Scholar]
- Kairiss EW, Abraham WC, Bilkey DK, Goddard GV (1987) Field potential evidence for long-term potentiation of feed-forward inhibition in the rat dentate gyrus. Brain Res 401: 87-94. [DOI] [PubMed] [Google Scholar]
- Karnup S, Stelzer A (1999) Temporal overlap of excitatory and inhibitory afferent input in guinea-pig CA1 pyramidal cells. J Physiol (Lond) 516 2: 485-504. [DOI] [PMC free article] [PubMed] [Google Scholar]
- Lacaille J-C, Mueller AL, Kunkel DD, Schwartzkroin PA (1987) Local circuit interactions between oriens/alveus interneurons and CA1 pyramidal cells in hippocampal slices: electrophysiology and morphology. J Neurosci 7: 1979-1993. [DOI] [PMC free article] [PubMed] [Google Scholar]
- Leung LS, Au AS (1994) Long-term potentiation as a function of test pulse intensity: a study using input/output profiles. Brain Res Bull 33: 453-460. [DOI] [PubMed] [Google Scholar]
- Lu YM, Mansuy IM, Kandel ER, Roder J (2000) Calcineurin-mediated LTD of GABAergic inhibition underlies the increased excitability of CA1 neurons associated with LTP. Neuron 26: 197-205. [DOI] [PubMed] [Google Scholar]
- Maccaferri G, McBain CJ (1996) Long-term potentiation in distinct subtypes of hippocampal nonpyramidal neurons. J Neurosci 16: 5334-5343. [DOI] [PMC free article] [PubMed] [Google Scholar]
- Malenka RC, Nicoll RA (1999) Long-term potentiation—a decade of progress? Science 285: 1870-1874. [DOI] [PubMed] [Google Scholar]
- Marder CM, Buonomano DV (2003) Differential effects of short- and long-term potentiation on cell firing in the CA1 region of the hippocampus. J Neurosci 23: 112-121. [DOI] [PMC free article] [PubMed] [Google Scholar]
- Marshall L, Henze DA, Hirase H, Leinekugel X, Dragoi G, Buzsaki G (2002) Hippocampal pyramidal cell-interneuron spike transmission is frequency dependent and responsible for place modulation of interneuron discharge. J Neurosci 22: RC197(1-5). [DOI] [PMC free article] [PubMed] [Google Scholar]
- Martin SJ, Grimwood PD, Morris RGM (2000) Synaptic plasticity and memory: an evaluation of the hypothesis. Annu Rev Neurosci 23: 649-711. [DOI] [PubMed] [Google Scholar]
- McBain CJ, Maccaferri G (1997) Synaptic plasticity in hippocampal interneurons? A commentary. Can J Physiol Pharmacol 75: 488-494. [PubMed] [Google Scholar]
- McBain CJ, Freund TF, Mody I (1999) Glutamatergic synapses onto hippocampal interneurons: precision timing without lasting plasticity. Trends Neurosci 22: 228-235. [DOI] [PubMed] [Google Scholar]
- McCormick D, Wang Z, Huguenard J (1993) Neurotransmitter control of neocortical neuronal activity and excitability. Cereb Cortex 3: 387-398. [DOI] [PubMed] [Google Scholar]
- McLean H, Caillard O, Ben-Ari Y, Gaiarsa J-L (1996) Bidirectional plasticity expressed by GABAergic synpases in the neonatal rat hippocampus. J Physiol (Lond) 496 2: 471-477. [DOI] [PMC free article] [PubMed] [Google Scholar]
- McMahon LL, Kauer JA (1997) Hippocampal interneurons express a novel form of synaptic plasticity. Neuron 18: 295-305. [DOI] [PubMed] [Google Scholar]
- Miles R (1990) Variation in strength of inhibitory synapses in the CA3 region of guinea-pig hippocampus in vitro. J Physiol (Lond) 431: 659-676. [DOI] [PMC free article] [PubMed] [Google Scholar]
- Ouardouz M, Lacaille J-C (1995) Mechanisms of selective long-term potentiation of excitatory synapses in stratum oriens/alveus interneurons of rat hippocampal slices. J Neurophysiol 73: 810-819. [DOI] [PubMed] [Google Scholar]
- Perez Y, Morin F, Lacaille J-C (2001) A hebbian form of long-term potentiation dependent on mGluR1a in hippocampal inhibitory interneurons. Proc Natl Acad Sci USA 98: 9401-9406. [DOI] [PMC free article] [PubMed] [Google Scholar]
- Pouille F, Scanziani M (2001) Enforcement of temporal fidelity in pyramidal cells by somatic feed-forward inhibition. Science 293: 1159-1163. [DOI] [PubMed] [Google Scholar]
- Roepstorff A, Lambert JDC (1994) Factors contributing to the decay of the stimulus-evoked IPSC in rat hippocampal CA1 neurons. J Neurophysiol 72: 2911-2926. [DOI] [PubMed] [Google Scholar]
- Shapley R, Hawken M, Ringach DL (2003) Dynamics of orientation selectivity in the primary visual cortex and the importance of cortical inhibition. Neuron 38: 689-699. [DOI] [PubMed] [Google Scholar]
- Shew T, Yip S, Sastry BR (2000) Mechanisms involved in tetanus-induced potentiation of fast IPSCs in rat hippocampal CA1 neurons. J Neurophysiol 83: 3388-3401. [DOI] [PubMed] [Google Scholar]
- Sillito AM (1975) The contribution of inhibitory mechanisms to the receptive field properties of neurons in the striate cortex of the cat. J Physiol (Lond) 250: 305-329. [DOI] [PMC free article] [PubMed] [Google Scholar]
- Sourdet V, Russier M, Daoudal G, Ankri N, Debanne D (2003) Long-term enhancement of neuronal excitability and temporal fidelity mediated by metabotropic glutamate receptor subtype 5. J Neurosci 23: 10238-10248. [DOI] [PMC free article] [PubMed] [Google Scholar]
- Spruston N, Johnston D (1992) Perforated patch-clamp analysis of the passive membrane properties of three classes of hippocampal neurons. J Neurophysiol 67: 508-529. [DOI] [PubMed] [Google Scholar]
- Staff NP, Spruston N (2003) Intracellular correlate of EPSP-spike potentiation in CA1 pyramidal neurons is controlled by GABAergic modulation. Hippocampus 13: 801-805. [DOI] [PubMed] [Google Scholar]
- Stelzer A, Simon G, Kovacs G, Rai R (1994) Synaptic disinhibition during maintenance of long-term potentiation in the CA1 hippocampal subfield. Proc Natl Acad Sci USA 91: 3058-3062. [DOI] [PMC free article] [PubMed] [Google Scholar]
- Taube JS, Schwartzkroin PA (1988) Mechanisms of long-term potentiation: EPSP/spike dissociation, intradendritic recordings, and glutamate sensitivity. J Neurosci 8: 1632-1644. [DOI] [PMC free article] [PubMed] [Google Scholar]
- Tomasulo RA, Levy WB, Steward O (1991) LTP-associated EPSP/spike dissociation in the dentate gyrus: GABAergic and non-GABAergic components. Brain Res 561: 27-34. [DOI] [PubMed] [Google Scholar]
- von der Malsburg C (1973) Self-organization of orientation sensitive cells in the striate cortex. Kybernetik 14: 84-100. [DOI] [PubMed] [Google Scholar]
- Wang Z, Xu NI, Wu CP, Duan S, Poo MM (2003) Bidirectional changes in spatial dendritic integration accompanying long-term synaptic modifications. Neuron 37: 463-472. [DOI] [PubMed] [Google Scholar]
- Wathey JC, Lytton WW, Jester JM, Sejnowski TJ (1992) Computer simulations of EPSP-spike (E-S) potentiation in hippocampal CA1 pyramidal cells. J Neurosci 12: 607-618. [DOI] [PMC free article] [PubMed] [Google Scholar]
- Wehr M, Zador AM (2003) Balanced inhibition underlies tuning and sharpens spike timing in auditory cortex. Nature 426: 442-446. [DOI] [PubMed] [Google Scholar]
- Wigstrom H, Gustafsson B (1985) Facilitation of hippocampal long-lasting potentiation by GABA antagonists. Acta Physiol Scand 125: 159-172. [DOI] [PubMed] [Google Scholar]
- Wilson RC, Levy WB, Steward O (1981) Changes in translation of synaptic excitation to dentate granule cell discharge accompanying long-term potentiation. II. An evaluation of mechanisms utilizing dentate gyrus dually innervated by surviving ipsilateral and sprouted crossed temporodentate inputs. J Neurophysiol 46: 339-355. [DOI] [PubMed] [Google Scholar]
- Xie Z, Yip S, Morishita W, Sastry BR (1995) Tetanus-induced potentiation of inhibitory postsynaptic potentials in hippocampal CA1 neurons. Can J Physiol Pharmacol 73: 1706-1713. [DOI] [PubMed] [Google Scholar]
- Zhang L, Weiner JL, Carlen PL (1993) Potentiation of γ-aminobutyric acid type A receptor-mediated synaptic currents by pentobarbital and diazepam in immature hippocampal CA1 neurons. J Pharmacol Exp Ther 266: 1227-1235. [PubMed] [Google Scholar]
- Zhang W, Linden DJ (2003) The other side of the engram: experience-driven changes in neuronal intrinsic excitability. Nat Rev Neurosci 4: 885-900. [DOI] [PubMed] [Google Scholar]