

Abstract
Many spikes in amperometric records of exocytosis events initially exhibit a prespike feature, or foot, which represents a steady-state flux of neurotransmitter through a stable fusion pore spanning both the vesicle and plasma membranes and connecting the vesicle lumen to the extracellular fluid. Here, we present the first evidence indicating that vesicular volume before secretion is strongly correlated with the characteristics of amperometric foot events. l-3,4-Dihydroxyphenylalanine and reserpine have been used to increase and decrease, respectively, the volume of single pheochromocytoma cell vesicles. Amperometry and transmission electron microscopy have been used to determine that as vesicle size is decreased the frequency with which foot events are observed increases, the amount and duration of neurotransmitter released in the foot portion of the event decreases, and vesicles release a greater percentage of their total contents in the foot portion of the event. This previously unidentified correlation provides new insight into how vesicle volume can modulate the activity of the exocytotic fusion pore.
Keywords: fusion pore, exocytosis, amperometry, transmission electron microscopy, PC12 cells, vesicle volume, foot
Introduction
The nature of the exocytotic fusion pore remains obscure despite investigation into the regulatory mechanisms for exocytosis (Sulzer and Pothos, 2000). The main difficulty has been an inability to directly monitor release from single fusion pores. Over the past decade, methodologies have been developed to monitor neurotransmitter release during single exocytosis events (Wightman et al., 1991; Henry et al., 1998; Stevens and Williams, 2000; Taraska et al., 2003). Most of this work, which has shed light on the mechanisms and kinetics of vesicular neurotransmitter release, has been done with neuroendocrine cells.
In both neuroendocrine cells and neurons, vesicular exocytosis has generally been described as an all-or-none process. Indeed, amperometric measurements of current produced during oxidation of released secretory products from adrenal chromaffin cells (Wightman et al., 1991), mast cells (Alvarez de Toledo et al., 1993), PC12 cells (Chen et al., 1994), and mammalian neurons (Jaffe et al., 1998; Hochstetler et al., 2000) have shown that a single fusion event results in a single spike-like current. In contrast, early patch-clamp investigations of exocytosis on mast cells have suggested that neurotransmitter release proceeds in at least two main stages (Breckenridge and Almers, 1987; Zimmerberg et al., 1987). First, the vesicle connects to the extracellular medium via a stable fusion pore. This is followed by a sudden enlargement of the initial pore as the internal vesicle matrix is completely exposed to the extracellular fluid.
Amperometric transients from exocytosis are often preceded by a small pedestal, called the “foot” of the spike (Chow et al., 1992; Alvarez de Toledo et al., 1993). Combined patch-clamp and amperometric measurements have confirmed that the foot represents neurotransmitter release through the fusion pore in beige mouse mast cells (Alvarez de Toledo et al., 1993). Furthermore, in chromaffin cells the catecholamine released during the amperometric foot and during the main portion of the spike is the same (Wightman et al., 1995), thus confirming the existence of a dynamic fusion pore.
Vesicular volume can be modulated by physiological (Zimmermann and Whittaker, 1974; Maler and Mathieson, 1985; Wickelgren et al., 1985), genetic (Karunanithi et al., 2002), and pharmacological (Colliver et al., 2000a; Sulzer and Edwards, 2000) factors. To better understand how vesicular volume changes might regulate exocytotic release through the fusion pore, we have pharmacologically manipulated vesicular volume and examined the amperometric features preceding catecholamine secretion events from rat pheochromocytoma (PC12) cells. Although Alvarez de Toledo et al. (1993) and Amatore et al. (2000) have hypothesized a relationship between the size of secretory vesicles and the characteristics of amperometric foot events, experimental data that directly support this theory have been lacking. The amount and duration of neurotransmitter released in the foot portion of the event are directly related to vesicular volume; however, there is an inverse relationship between vesicle volume and the frequency of observed foot events, as well as the percentage of vesicular content released during the foot portion of the event. If each of these factors subtly affects the rate of rise in neurotransmitter concentration in the synaptic cleft, cells may be able to modulate synaptic communication by manipulating vesicle volume.
Materials and Methods
Cell culture. Stock PC12 cells were generously provided by Dr. Dave Sulzer (Columbia University) and maintained as described previously (Kozminski et al., 1998). In brief, PC12 cells were grown on mouse collagen IV-coated culture dishes (Becton Dickinson, Bedford, MA) in supplemented RPMI-1640 medium. Cells were kept in a 7% CO2 atmosphere at 37°C and were subcultured approximately every 7-9 d or when confluency was reached. Cells were used for all experiments between days 7 and 12 of subculturing.
Electrode preparation and experimental setup. Carbon fiber microelectrodes (5 μm diameter) were constructed as described previously (Pothos et al., 1998b) and back-filled with 3 m KCl. Electrode tips were polished at a 45° angle on a diamond dust-embedded micropipette beveling wheel (Model BV-10; Sutter Instrument Co., Novato, CA). Cyclic voltammograms were generated for each electrode in a nitrogen-saturated 0.1 mm dopamine solution (in 0.1 m PBS, pH 7.4), and only electrodes with stable current-potential curves were used.
Cells were prepared for an experiment as described previously (Colliver et al., 2000a). Exocytosis was stimulated at ∼30 sec intervals with a 5 sec, 20 psi pulse (Picospritzer II; General Valve, Fairfield, NJ) of physiological saline with 100 mm K+ as described previously (Colliver et al., 2000a). All experiments were performed at 37 ± 1°C. Culture dishes were warmed using a solid state Peltier heating device (Bionomic System, 20/20 Technology, Inc., Wilmington, NC).
Data acquisition and data analysis. Electrodes were held at + 0.65 V versus a locally constructed sodium-saturated calomel reference electrode using a commercially available patch-clamp instrument (Axopatch 200B; Axon Instruments, Foster City, CA) configured as described previously (Borges et al., 1997). The output was digitized at 5 kHz and filtered at 2 kHz using an internal four-pole low-pass Bessel filter. Data were displayed in real time (Axoscope 8.1.0.07; Axon Instruments) and stored to the computer with no subsequent filtering.
Exocytotic spikes were identified, and the spike characteristics area, t1/2 (milliseconds), and imax (picoamperes), as well as foot area (femtocoulombs) and foot duration (milliseconds) were determined using Mini Analysis software (Synaptosoft). Signals were designated as spikes if their imax values were 5× the SD of a 1 sec portion of stable baseline recorded before the first stimulation. The onset of the foot was defined as the time when the signal exceeded the peak-to-peak noise of a 5 msec time segment, and the end of the foot was defined by the inflection point between the foot and the main event. This threshold value was determined by mathematically taking the second derivative of the trace. All peaks identified by the program were inspected visually, and unfit peaks were manually excluded from the data sets. Double peaks, those with more than one peak (jagged tops), and those without a smooth decline to baseline were removed. On average, those removed constituted ∼5% of the well resolved spikes.
Amperometry experiments. A same-cell paradigm for the amperometry experiments has been applied, as described previously (Colliver et al., 2000a). The same electrode was used to measure release from a cell before and after drug treatment. This approach minimizes cell-to-cell and electrode variability and, as a result, should be more sensitive to changes in spike characteristics as compared with measuring release from separate groups of cells (Pothos et al., 1998a; Colliver et al., 2000b).
The frequency of events exhibiting a prespike feature, or foot, was calculated as follows. For each cell, the number of events exhibiting a well defined foot was divided by the total number of clean, nonoverlapping amperometric events. Data for the foot frequencies are reported as ratio values created from the same PC12 cell before and after it was treated with drug (i.e., mean frequency after/mean frequency before). Absolute foot frequencies, calculated by taking samples of mean values for different cells, are also reported. Each cell was stimulated at least twice, and the position of the electrode and injector relative to the cell were recorded. Both were then lifted above the cell and out of solution, and cells were exposed to 100 μm l-3,4-dihydroxyphenylalanine (l-DOPA) (dissolved in physiological saline) or 100 nm reserpine (dissolved in dimethyl sulfoxide) by adjusting the physiological saline surrounding the cells. After a 90 min incubation period, cells were rinsed with physiological saline without drug and allowed to rewarm to 37°C. Post-drug measurements were usually obtained 15-17 min after rinsing by repositioning the working electrode and injector to their original location. Additionally, to ensure reliable placement of the electrode, only cells that maintained their morphology during the incubation period were used.
Electron microscopic analysis. PC12 cells were rinsed with PBS, pH 7.4, and treated with Ca2+- and Mg2+-free 0.05% trypsin-EDTA (Invitrogen, Gaithersburg, MD) for 30 sec. The trypsin-EDTA solution was replaced with PBS, and the cells were dispersed into solution by flushing them off the culturing substrate. Single-cell suspensions were transferred to microfuge tubes and pelleted at 100 × g for 10 min. Cell pellets were chemically stimulated with physiological saline containing 100 mm K+ and immediately incubated overnight at 4°C in Karnovsky's fixative (Karnovsky, 1965). Finally, the pellets were prepared for transmission electron microscopy (TEM) as described previously (Colliver et al., 2000a) and viewed on a transmission electron microscope (1200EXII; JEOL, Peabody, MA) at 80 kV.
Quantitative analysis of vesicle structures was performed using SigmaScan (Version 5.0.0, SPSS, Inc., Chicago, IL) as described previously (Colliver et al., 2000a). TEM images were imported into this software, and the limiting membrane of each vesicle as well as the perimeter of its dense core were traced. Once each object was inscribed, SigmaScan determined its diameter. Diameter was defined as the distance between the two most distal points on the initial trace. Only vesicles in which a dense core could be clearly identified were measured. Volume values were calculated on the basis of the simplified assumption that the vesicle structures were spherical. No corrections for factors such as plane of section were made (Coupland, 1968). As a result, the measured changes in volume reflect relative changes in vesicle morphology.
Statistical analysis. For the TEM analysis, mean values for vesicle sizes were calculated from each cell, and samples of mean values for different treatment groups, instead of pooled samples, were compared statistically (Colliver et al., 2000b). This approach was taken to ensure that cells with a large number of vesicles would not be overrepresented within a treatment group. The plots for foot area and foot duration were constructed by pooling all of the foot data for a treatment group, rather than averaging per cell. This was done to ensure that cells exhibiting few amperometric feet would not be overrepresented and thus skew the data. All data were tested for significant differences using the t test (SigmaPlot, Version 7.00; SPSS, Inc.). Results for all tests were considered significant if associated p values were <0.05. All values are reported as the mean ± SEM, and all plots were created using SigmaPlot.
Results
Amperometric and TEM evidence for release via the fusion pore
Amperometric data from a stimulated PC12 cell are shown in Figure 1, which depicts single release events. The area of each signal is directly proportional to the number of molecules released by the relationship Q = nNF, where Q is the charge of each current transient, N is the number of moles, F is Faraday's constant (96,485 C/equivalent), and n is the number of electrons transferred per oxidized molecule (two for catecholamines) (Wightman et al., 1991). Representative amperometric spikes, one preceded by a foot and one without a foot, are presented in Figure 1B. A schematic of the two-stage release process is shown in Figure 1C. The theoretical correlation between the stage of release and the actual current trace is indicated by reference number. TEM images of fusing dense-core vesicles are presented in Figure 1, D and E. PC12 dense-core vesicles typically exhibit a morphology in which a space (halo) between the dense core and the vesicular membrane can be identified. In this example, one dense-core vesicle in each image appears to be undergoing exocytosis (dark arrows). The two vesicles indicated are clearly connected to the cell membrane. Moreover, the dense core in the vesicle fusing in Figure 1E appears to be swelling. Other vesicles in each image exhibit an atypical, clear morphology. This may simply be attributable to the plane of section (the cut may have missed the dense core), or alternatively, these vesicles may not contain dense cores.
Figure 1.

A, Representative amperometric data from a single PC12 cell. The arrow under the trace represents the time of stimulus (100 mm K+) application. B, Examples of individual amperometric current transients. The trace on the left has no discernable foot signal; that on the right is preceded by a foot. C, A schematic diagram illustrating the flux of neurotransmitter through the fusion pore. The stages of fusion are numerically coordinated with the associated regions of the amperometric traces in B. D, E, Representative TEM images of PC12 cell dense-core vesicles fusing with the plasma membrane on stimulation with 100 mm K+. Dark arrows indicate vesicles that appear to be undergoing exocytosis. Scale bars, 50 nm.
Foot frequency as a function of vesicle volume
To alter vesicular volume, we have used pharmacological manipulations that directly affect the vesicular monoamine transporter (VMAT)-mediated transport of catecholamines into PC12 cell vesicles. Amperometric and TEM studies have established that treatment of PC12 cells with l-DOPA (a dopamine precursor) or reserpine (an inhibitor of the VMAT) increases (Pothos et al., 1996, 1998a) or decreases (Kozminski et al., 1998), respectively, the total amount of electroactive transmitter(s) released from dense-core vesicles and, importantly, that this exposure to l-DOPA or reserpine increases or decreases, respectively, vesicular volume (Colliver et al., 2000a).
In this study, we examined release from PC12 cell vesicles exhibiting a mean diameter of 192 ± 9 nm for control cells. This value is similar to those reported previously for PC12 cells (Schubert and Klier, 1977; Schubert et al., 1980). When PC12 cells were treated with 100 μm l-DOPA for 90 min, the mean vesicular diameter increased to 254 ± 15 nm. This increase is significant when compared with control values and corresponds to a 32% increase in vesicle diameter or a 132% increase in vesicle volume. In contrast, PC12 cell dense-core vesicles were observed to significantly decrease in size (mean vesicular diameter of 130 ± 8 nm) after a 90 min treatment with 100 nm reserpine, a potent inhibitor of the VMAT (Varoqui and Erickson, 1997).
We have used a same-cell paradigm for amperometry experiments in which the same electrode is used to measure release from a cell before and after drug exposure. This technique is especially useful because each cell serves as its own control. No changes were seen in the general amperometric spike characteristics, or in the frequency of release events detected, in the control condition after a 90 min incubation in physiological saline. Furthermore, no significant differences were detected in the mean spike area, t1/2, and imax values before and after exposure to physiological saline (data not shown). Exposure of PC12 cells to 100 μm l-DOPA for 90 min significantly decreased the observed frequency of foot events to 72% of control (Fig. 2A). In contrast, when PC12 cells were treated for 90 min with 100 nm reserpine, there was an increase in the frequency of foot events to 155% of the measurements done at control cells. Under control conditions, an average of ∼33.7 ± 0.5% of the exocytotic events from PC12 cells exhibited a prespike feature. Thus, a clear trend exists in relating the frequency of foot events to vesicular volume.
Figure 2.

A, Summary of mean foot frequency ratio values created at individual PC12 cells (see Materials and Methods). For the ratios presented, an average of 117 ± 14 and 87 ± 21 amperometric values were used to determine before and after means, respectively. Error bars represent the mean ± SEM of foot frequency ratio values for the different experimental conditions (control, n = 6 cells; l-DOPA, n = 6; reserpine, n = 5). Because the mean foot frequency ratio values approximate 1 for control cells, it is clear that the incubation time itself did not have a significant effect on foot frequencies. B, Plot of foot frequencies calculated in this work as compared with foot frequencies reported in the literature for various-sized vesicles. Foot frequencies for PC12 cells were calculated by taking samples of mean values for different cells [reserpine-treated cells are denoted “R” in plot (n = 5; foot frequency of 52 ± 4%), saline-treated (control) cells are denoted “C” (n = 6; foot frequency of 34 ± 3%), and l-DOPA-treated cells are denoted “D” (n = 6; foot frequency of 24 ± 1%)]. Literature values are plotted for bovine adrenal chromaffin cells (denoted “A” in plot) (Chow et al., 1992), mouse mast cells (denoted “M” in plot) (Alvarez de Toledo et al., 1993), and beige mouse mast cells (denoted “BM” in plot) (Alvarez de Toledo et al., 1993), which have average vesicular radii of 125 nm (Neher, 1993), 400 nm (Breckenridge and Almers, 1987), and 1350 nm (Breckenridge and Almers, 1987), respectively. **p < 0.01 and ***p < 0.001 versus control, respectively (t test).
A comparison was made with reports in the literature on the frequency of amperometric foot events from secreting cell lines that have vesicles of known size (Fig. 2B). Specifically, the data presented in this work were compared with foot frequencies reported for bovine adrenal chromaffin cells (Chow et al., 1992) (marked “A”), mast cells from normal mice (Alvarez de Toledo et al., 1993) (marked “M”), and beige mouse mast cells (Alvarez de Toledo et al., 1993) (marked “BM”), which have average vesicular radii of 125 nm (Neher, 1993), 400 nm (Breckenridge and Almers, 1987), and 1350 nm (Breckenridge and Almers, 1987), respectively. PC12 vesicular radii were calculated to be 65 ± 4 nm for 312 vesicles in reserpine-treated PC12 cells (marked “R”) (n = 11), 96 ± 9 nm for 517 vesicles in control cells (marked “C”) (n = 11), and 127 ± 7 nm for 434 vesicles in l-DOPA-treated cells (marked “D”) (n = 11). In addition, the ratio of dense core to halo volume has been calculated to be 0.31 ± 0.030 (n = 9) for reserpine-treated cells and 0.11 ± 0.017 (n = 10) for l-DOPA-treated cells. These values are significantly different from that calculated for control cells, 0.23 ± 0.022 (n = 12), with p < 0.05 and p < 0.001, respectively. The frequency data have been fit to a line with equation y = -0.07 + 110e-0.01x + 0.01x and with an R2 value of 0.99. Within the data set taken from our laboratory (R,C,D), the trend is linear. Clearly, an inverse relationship exists between vesicular volume and the frequency with which amperometric events exhibit feet.
Foot frequency as a function of vesicular content
One hypothesis for the appearance of feet preceding some amperometric spikes, but not others, is that two pools of vesicular catecholamine content may be present within the cell, differentially using the fusion pore as a mechanism to regulate the rate of exocytotic release. Because the area of each amperometric event is directly proportional to the number of molecules released (Wightman et al., 1991), event areas (the integrated amperometric current) have been converted to the number of molecules detected and histograms created. Figure 3A depicts a histogram for cells in the control condition in which the frequency of events is plotted versus the log of the number of molecules detected for those events with feet and without. When no foot is observed, the Gaussian distribution of event area exhibits a shoulder toward smaller amounts of transmitter released. In agreement with previous work (Schroeder et al., 1996), however, there is not a significant shift in the distribution. A similar histogram for data obtained from l-DOPA-treated PC12 cells is shown in Figure 3B. This treatment appears to increase the amount of neurotransmitter stored in the vesicular halo of dense-core vesicles (Colliver et al., 2000a). In this case, a shift in the Gaussian distribution of event area is clearly not evident, indicating that no single pool of vesicles (those that exhibit feet or those that do not) is loaded preferentially. This is in agreement with previous work showing that pretreatment with l-DOPA uniformly increases the quantal size of PC12 catecholamine release (Pothos et al., 1996).
Figure 3.
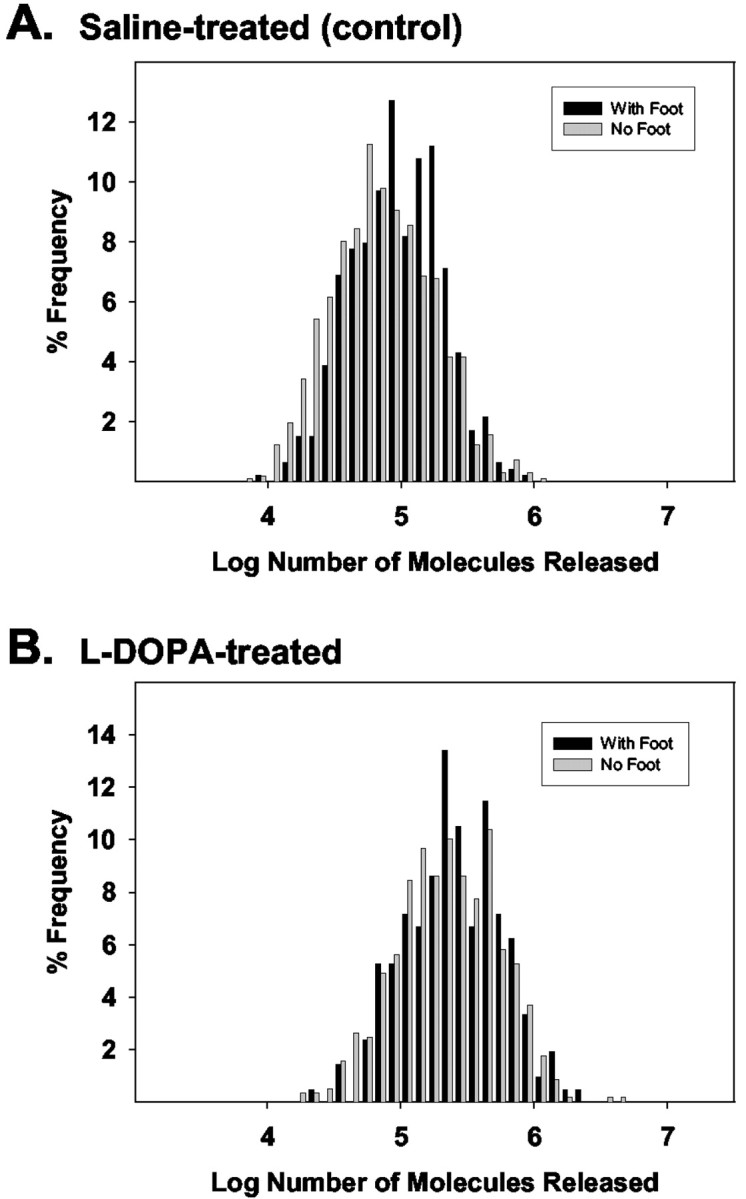
Histograms of raw spike characteristics are heavily skewed to the right, so normalized histograms from log-transformed values were created (Pothos et al., 1998b; Colliver et al., 2000b). A, B, A comparison of the Gaussian distributions for the log transform of the number of molecules released for those spikes with feet, and without, in the control condition (n = 6 cells) (A) and after a 90 min incubation in 100 μm l-DOPA (n = 6 cells) (B). Although a shoulder appears to be present in the distribution of control cells with versus without feet, there is not a significant shift in the Gaussian distributions under either set of conditions presented here in either control or l-DOPA-treated cells.
Foot area and foot duration as a function of vesicle size
Averaged amperometric current transients before (black) and after (gray) the 90 min incubation period for a reserpine-treated cell (n = 28 before; n = 37 after), saline-treated cell (n = 85 before; n = 59 after), and l-DOPA-treated cell (n = 73 before; n = 41 after) are presented in Figure 4A. For each cell, all current transients that exhibited feet were included in the averaged traces, and the scale bar is the same for the three treatment groups. After a 90 min saline incubation, the averaged amperometric trace is similar to that before the incubation, thus demonstrating the stability of the carbon fiber electrode over this time period.
Figure 4.
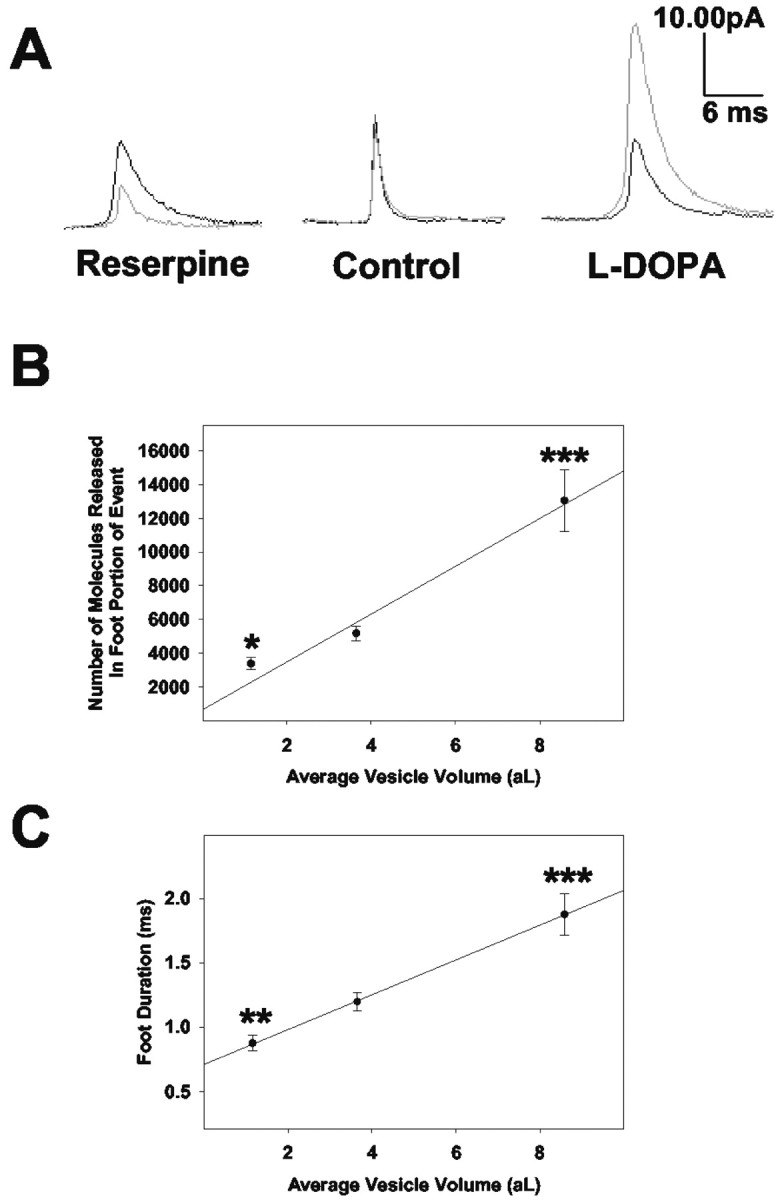
Both the number of molecules released through the exocytotic fusion pore and the time course of said release are dependent on vesicular size. Calculations for vesicular volume are as described in the Materials and Methods. A, Averaged amperometric current transients for one reserpine-treated (n = 28 before; n = 37 after), saline-treated (n = 85 before; n = 73 after), or l-DOPA-treated (n = 73 before; n = 41 after) PC12 cell before (black) and after (gray) the 90 min incubation period. The scale bar is the same for all three averaged transients. The traces appear without the typical shelf-like feature of a foot. This is primarily a consequence of the averaging of the amperometric traces, which exhibit variable foot geometries. B, Mean foot area values shown as a function of vesicle volume. Under control conditions, a cellular average of 5695 ± 751 molecules were released through the fusion pore (before full fusion) per event. C, Mean foot duration values (the time lapse between the onset of the foot and the inflection point between the foot and the full fusion event) shown as a function of vesicle volume. Under control conditions, the average cellular time course for release through the fusion pore was 1.3 ± 0.1 msec. For the data plotted, all amperometric foot signals were pooled to determine the mean foot area and duration values for reserpine, control, and l-DOPA-treated conditions, respectively. Error bars represent the mean ± SEM of the foot characteristic values for the different experimental conditions (control, n = 6; l-DOPA, n = 6; reserpine, n = 5). *p < 0.05, **p < 0.01, and ***p < 0.001 versus control, respectively (t test).
The number of molecules released during the prespike foot (foot area, femtocoulombs) and the length of the foot, (foot duration, milliseconds) have been determined for each amperometric spike recorded. Dimethylsulfoxide, the vehicle used for reserpine administration, had no significant effect on any of the spike characteristics (n = 3; data not shown). Values for both foot area and foot duration have been pooled and plotted versus average vesicle volume (Fig. 4 B, C). The plots suggest that both foot duration and foot area are directly related to the physical size of the vesicle. Each of the points on the plots is significantly different from control (*p < 0.05; **p < 0.01; ***p < 0.001).
The percentage of the total contents released in the foot portion of the event is dependent on vesicle size
We have plotted the average percentage of the total vesicular contents secreted by a vesicle during the expansion of the fusion pore as a function of average vesicle radius for vesicles in PC12 cells incubated with reserpine, saline, or l-DOPA (Fig. 5). These values were obtained by dividing the number of molecules released in the foot portion of the event by the number of molecules released in the total amperometric event and multiplying by 100. Although there appears to be a trend, there is not a statistically significant difference between the data points. The R2 value for the line is 0.99.
Figure 5.

Percentage of the total contents released during the foot as a function of vesicle radius (calculations for vesicular radii are as described in Materials and Methods). This percentage was obtained by dividing the foot charge by the charge of the total amperometric signal (foot plus spike). The percentage values for each experimental condition examined were then averaged (reserpine, n = 5; control, n = 12; l-DOPA, n = 6); 97, 517, and 182 amperometric spikes were used for each of the points, respectively. By extending the x-axis, the data have been extrapolated to predict that a synaptic vesicle with a radius of 20 nm would release 9% of its total contents through the fusion pore (Δ).
Discussion
Effects of vesicular volume on release via the fusion pore
Vesicle volume is clearly correlated with the frequency with which foot events are observed, the amount and duration of neurotransmitter released in the foot portion of the event, and the proportion of total vesicular content that is released through the fusion pore. This work is physiologically significant because changes in fusion pore dynamics have recently been proposed to play a role in synaptic plasticity (Choi et al., 2000). Additionally, physiological (Zimmermann and Whittaker, 1974; Maler and Mathieson, 1985; Wickelgren et al., 1985), genetic (Karunanithi et al., 2002), and pharmacological (Colliver et al., 2000a; Sulzer and Edwards, 2000) conditions can affect vesicle size. Vesicle size differences have been demonstrated between GABAergic and glutamatergic boutons in the mammalian CNS (Uchizono, 1965; Hamori et al., 1990) and in arthropod excitatory and inhibitory neurons (Uchizono, 1967). Furthermore, differences in synaptic vesicle volume have been shown to correlate well with functional differences in synaptic strength among glutamatergic neurons of Drosophila (Karunanithi et al., 2002). As discussed by Karunanithi et al. (2002), in several instances vesicle size has been found to be inversely related to the level of synaptic activity. Synaptic vesicles in the electroreceptor afferents of gymnotid fish are enlarged after inactivity (Maler and Mathieson, 1985). This can be reversed by stimulation. Similarly, vesicle sizes in lamprey reticulospinal axons (Wickelgren et al., 1985) and in the electric organ of Torpedo (Zimmermann and Whittaker, 1974) are reduced after prolonged high-frequency stimulation. Our work provides new insight into the biological consequences of such vesicular volume modification.
PC12 cell dense-core vesicles (Greene and Tischler, 1976) have a structure and composition similar to the vesicles in normal chromaffin cells (Tischler and Greene, 1978; Wagner, 1985; Fischer-Colbrie and Schober, 1987). It is likely that catecholamine stored in the halo (space between the dense core and the vesicular membrane of a vesicle) of these vesicles is not readily associated with the dense core, and thus that it is the neurotransmitter from this halo that is able to flow freely through the initial fusion pore (Alvarez de Toledo et al., 1993). This idea is supported by the data presented in Figure 4. After incubation in l-DOPA, most of the vesicular volume increase is in the vesicular halo, whereas the dense core swells relatively little (Colliver et al., 2000a). Thus, the excess catecholamine in the halo of the vesicles should increase both the amount of neurotransmitter released through the exocytotic fusion pore before full fusion and the time course of release, as observed. In contrast, on treatment with reserpine, the vesicular halo is significantly diminished in size, less free catecholamine is available to flow through the early fusion pore, and both foot area and duration are relatively decreased.
Interestingly, the frequency with which foot events are exhibited is markedly increased as vesicle size decreases (Fig. 2A), and the foot makes up a relatively larger proportion of the overall release event (Fig. 5). Smaller amperometric signals approach the limits of detection, and thus one might expect, in contrast to what is observed, that the associated feet would be lost in the noise if this were a measurement issue. A comparison has been made with reports in the literature on the frequency of amperometric foot events from other secreting cell lines with known vesicular radii (Fig. 2B), and the trends observed are generally consistent with our data. Additionally, the trend for the proportion of the total event released through the fusion pore is nicely extrapolated to the size of small synaptic vesicles (Fig. 5, inset) to predict that a vesicle with a radius of 20 nm would release 9% of its content through the fusion pore. This value is similar to that postulated previously (Alvarez de Toledo et al., 1993). Furthermore, if transmitter is freely diffusible in small synaptic vesicles (which is not the case in the system examined here), it has been suggested that >50% would be released during transient fusion events (Alvarez de Toledo et al., 1993). These data suggest that as secretory vesicle size increases the frequency of events exhibiting feet decreases, as does the percentage of the total vesicular contents released through the fusion pore.
Mechanisms regulating release via the fusion pore
The trends in these data may be related to the role of the dense core and the ratio of the dense core to total vesicle volume. As free neurotransmitter molecules are emptied from the vesicular halo during release, catecholamine molecules associated with the core begin to be exchanged with hydrated extracellular ions (Uvnas and Aborg, 1983; Khanin et al., 1997), inducing swelling of the dense core matrix (Breckenridge and Almers, 1987; Zimmerberg et al., 1987) without a change in vesicle membrane surface area. The electron micrographs presented in Figure 1, D and E, illustrate the typical morphology of PC12 cell dense-core vesicles, which are readily distributed through the cytoplasm. The fusing dense-core vesicle in Figure 1E (black arrow) suggests that such secretory granule swelling may have been underway at the time of fixation. It has been hypothesized and supported experimentally that this type of swelling may serve to impart a mechanical pressure on the interior vesicular wall in cell types such as chromaffin cells, where the dense core fills the vesicle (Amatore et al., 2000). In systems like the PC12 cell where the dense core fills only a portion of the vesicle, however, expansion of the core is more likely to result in enhanced pressure-driven mass transport through the fusion pore and fluidic pressure on the interior vesicle walls. This is consistent with the data shown in Figure 5. Treatment with reserpine diminishes the vesicular halo; however, the volume of the core remains relatively unchanged. In contrast, l-DOPA increases the volume of the halo relative to the core. Thus, the increase in the ratio of the dense core to total vesicle volume is expected to lead to a greater pressure-based force on the membrane of the smaller reserpinized vesicles. The opposite is true for the larger vesicles in the l-DOPA-treated cells because the ratio of the dense core to total vesicle volume is considerably less.
The pressure exerted by the dense core on the aqueous phase in the vesicle will lead to an increase in mass transport through the fusion pore and a change in membrane dynamics. Evans and Yeung (1994) have shown experimentally that lipid nanotubes connecting vesicles constrict when the tension on one vesicle is increased. If the fusion pore, at some stage, is considered to be a short lipidic nanotube connecting the vesicle to the cell membrane, then an increased intravesicular pressure would increase vesicular membrane tension, leading to constriction of the fusion pore. This would initially stall opening to the full fusion event. Because smaller vesicles have a larger ratio of the dense core to total vesicle volume, greater pressure is exerted on the membrane by the expanding dense core. Thus, smaller vesicles exhibit a higher frequency of observed transmitter release via the fusion pore. The opposite trend is observed for l-DOPA treated vesicles.
The correlations between foot area and duration and vesicle volume (Fig. 4) can also be explained by changes in the membrane dynamic. Although the immediate effect of increased membrane tension might be to restrict a fusion pore in a nanotube geometry, this is expected to be short-lived. An increase in the difference in membrane tension from the cell to the vesicle should result in increased lipid flow through the fusion pore (Monck et al., 1990; Chizmadzhev et al., 1999). Thus, although the pore appears to be initially stabilized through constriction, enhanced lipid flow into the vesicle is expected to rapidly dissipate the membrane energy that restricts the opening of the pore, leading to a faster opening and a foot event of shorter duration.
A toroid model of the fusion pore has been presented previously (Chizmadzhev et al., 2000). It is difficult, however, to explain the collective observations of a higher frequency of release events with feet and the shorter duration and diminished area of these feet at the smaller reserpinized vesicles with this previously described model. In contrast, the model presented here can be used to explain both of these observations, thus providing evidence for a transition state involving a nanotube topology during fusion. It has been reported that the effective distance between the two membranes may be as long as 10-15 nm (Weissenhorn et al., 1999), making the existence of a nanotube geometry feasible while the SNARE (soluble N-ethylmaleimide-sensitive factor attachment protein receptor) assembly is still in place.
Implications in synaptic release
Previous work has not directly addressed the effect of vesicle volume on release via the fusion pore; however, the data presented here are consistent with ideas presented previously (Alvarez de Toledo et al., 1993; Bruns and Jahn, 1995) because they indicate that the smallest vesicles (synaptic) will be most affected by this mode of regulatory control where, by extrapolation of our data, they are expected to demonstrate significant release via the fusion pore. If each of these factors subtly affects the rate of rise in neurotransmitter concentration or the duration of neurotransmitter occupancy in the synaptic cleft, cells may be able to modulate synaptic communication by manipulating vesicle volume. This is even more plausible when considered with reports that the strength and duration of the glutamate transient can markedly alter postsynaptic response and contribute to long-term potentiation (Choi et al., 2000). Thus, this work provides physiologically interesting evidence that the activity of the fusion pore is regulated, at least in part, by vesicle volume and by physiological and pharmacological conditions that affect vesicular volume.
Footnotes
This work was supported by the National Institutes of Health. We gratefully acknowledge Dr. Stephen G. Weber, Dr. Gong Chen, and Marc Maxson for their helpful ideas and suggestions, Dr. Justin Lee for help with Mini Analysis software, Sonja Pyott and Marie Achalabun for amperometric data collection, Nicole Shakir-Botteri for cell culture expertise, and Missy Hazen and Rosemary Walsh for assistance with TEM images.
Correspondence should be addressed to Andrew G. Ewing, Department of Chemistry, 152 Davey Laboratory, The Pennsylvania State University, University Park, PA 16802-6300. E-mail: age@psu.edu.
Copyright © 2004 Society for Neuroscience 0270-6474/04/240303-07$15.00/0
References
- Alvarez de Toledo G, Fernandez-Chacon R, Fernandez JM (1993) Release of secretory products during transient vesicle fusion. Nature 363: 554-558. [DOI] [PubMed] [Google Scholar]
- Amatore C, Bouret Y, Travis ER, Wightman RM (2000) Interplay between membrane dynamics, diffusion and swelling pressure governs individual vesicular exocytotic events during release of adrenaline by chromaffin cells. Biochimie 82: 481-496. [DOI] [PubMed] [Google Scholar]
- Borges R, Travis ER, Hochstetler SE, Wightman RM (1997) Effects of external osmotic pressure on vesicular secretion from bovine adrenal medullary cells. J Biol Chem 272: 8325-8331. [DOI] [PubMed] [Google Scholar]
- Breckenridge LJ, Almers W (1987) Final steps in exocytosis observed in a cell with giant secretory granules. Proc Natl Acad Sci USA 84: 1945-1949. [DOI] [PMC free article] [PubMed] [Google Scholar]
- Bruns D, Jahn R (1995) Real-time measurement of transmitter release from single synaptic vesicles. Nature 377: 62-65. [DOI] [PubMed] [Google Scholar]
- Chen TK, Luo G, Ewing AG (1994) Amperometric monitoring of stimulated catecholamine release from rat pheochromocytoma (PC12) cells at the zeptomole level. Anal Chem 66: 3031-3035. [DOI] [PubMed] [Google Scholar]
- Chizmadzhev YA, Kumenko DA, Kuzmin PI, Chernomordik LV, Zimmerberg J, Cohen FS (1999) Lipid flow through fusion pores connecting membranes of different tensions. Biophys J 76: 2951-2965. [DOI] [PMC free article] [PubMed] [Google Scholar]
- Chizmadzhev YA, Kuzmin PI, Kumenko DA, Zimmerberg J, Cohen FS (2000) Dynamics of fusion pores connecting membranes of different tensions. Biophys J 78: 2241-2256. [DOI] [PMC free article] [PubMed] [Google Scholar]
- Choi S, Klingauf J, Tsien RW (2000) Postfusional regulation of cleft glutamate concentration during LTP at “silent synapses”. Nat Neurosci 3: 330-336. [DOI] [PubMed] [Google Scholar]
- Chow RH, von Ruden L, Neher E (1992) Delay in vesicle fusion revealed by electrochemical monitoring of single secretory events in adrenal chromaffin cells. Nature 356: 60-63. [DOI] [PubMed] [Google Scholar]
- Colliver TL, Pyott SJ, Achalabun M, Ewing AG (2000a) VMAT-mediated changes in quantal size and vesicular volume. J Neurosci 20: 5276-5282. [DOI] [PMC free article] [PubMed] [Google Scholar]
- Colliver TL, Hess EJ, Pothos EN, Sulzer D, Ewing AG (2000b) Quantitative and statistical analysis of the shape of amperometric spikes recorded from two populations of cells. J Neurochem 74: 1086-1097. [DOI] [PubMed] [Google Scholar]
- Coupland RE (1968) Determining sizes and distribution of sizes of spherical bodies such as chromaffin granules in tissue sections. Nature 217: 384-388. [DOI] [PubMed] [Google Scholar]
- Evans E, Yeung A (1994) Hidden dynamics in rapid changes of bilayer shape. Chem Physics Lipids 73: 39-56. [Google Scholar]
- Fischer-Colbrie R, Schober M (1987) Isolation and characterization of chromogranins A, B, and C from bovine chromaffin granules and a rat pheochromocytoma. J Neurochem 48: 262-270. [DOI] [PubMed] [Google Scholar]
- Greene LA, Tischler AS (1976) Establishment of a noradrenergic clonal line of rat adrenal pheochromocytoma cells which respond to nerve growth factor. Proc Natl Acad Sci USA 73: 2424-2428. [DOI] [PMC free article] [PubMed] [Google Scholar]
- Hamori J, Takacs J, Petrusz P (1990) Immunogold electron microscopic demonstration of glutamate and GABA in normal and deafferented cerebellar cortex: correlation between transmitter content and synaptic vesicle size. J Histochem Cytochem 38: 1767-1777. [DOI] [PubMed] [Google Scholar]
- Henry JP, Darchen F, Cribier S (1998) Physical techniques for the study of exocytosis in isolated cells. Biochimie 80: 371-377. [DOI] [PubMed] [Google Scholar]
- Hochstetler SE, Puopolo M, Gustincich S, Raviola E, Wightman RM (2000) Real-time amperometric measurements of zeptomole quantities of dopamine released from neurons. Anal Chem 72: 489-496. [DOI] [PubMed] [Google Scholar]
- Jaffe EH, Marty A, Schulte A, Chow RH (1998) Extrasynaptic vesicular transmitter release from the somata of substantia nigra neurons in rat midbrain slices. J Neurosci 18: 3548-3553. [DOI] [PMC free article] [PubMed] [Google Scholar]
- Karnovsky M (1965) A formaldehyde-glutaraldehyde fixative of high osmolality for use in electron microscopy. J Cell Biol 27: 137A-138A. [Google Scholar]
- Karunanithi S, Marin L, Wong K, Atwood HL (2002) Quantal size and variation determined by vesicle size in normal and mutant Drosophila glutamatergic synapses. J Neurosci 22: 10267-10276. [DOI] [PMC free article] [PubMed] [Google Scholar]
- Khanin R, Parnas H, Segel L (1997) A mechanism for discharge of charged excitatory neurotransmitter. Biophys J 72: 507-521. [DOI] [PMC free article] [PubMed] [Google Scholar]
- Kozminski KD, Gutman DA, Davila V, Sulzer D, Ewing AG (1998) Voltammetric and pharmacological characterization of dopamine release from single exocytotic events at rat pheochromocytoma (PC12) cells. Anal Chem 70: 3123-3130. [DOI] [PubMed] [Google Scholar]
- Maler L, Mathieson WB (1985) The effect of nerve activity on the distribution of synaptic vesicles. Cell Mol Neurobiol 5: 373-387. [DOI] [PMC free article] [PubMed] [Google Scholar]
- Monck JR, Alvarez de Toledo G, Fernandez JM (1990) Tension in secretory granule membranes causes extensive membrane transfer through the exocytotic fusion pore. Proc Natl Acad Sci USA 87: 7804-7808. [DOI] [PMC free article] [PubMed] [Google Scholar]
- Neher E (1993) Secretion without full fusion. Nature 363: 497-498. [DOI] [PubMed] [Google Scholar]
- Pothos E, Desmond M, Sulzer D (1996) l-3,4-Dihydroxyphenylalanine increases the quantal size of exocytotic dopamine release in vitro. J Neurochem 66: 629-636. [DOI] [PubMed] [Google Scholar]
- Pothos EN, Davila V, Sulzer D (1998a) Presynaptic recording of quanta from midbrain dopamine neurons and modulation of the quantal size. J Neurosci 18: 4106-4118. [DOI] [PMC free article] [PubMed] [Google Scholar]
- Pothos EN, Przedborski S, Davila V, Schmitz Y, Sulzer D (1998b) D2-like dopamine autoreceptor activation reduces quantal size in PC12 cells. J Neurosci 18: 5575-5585. [DOI] [PMC free article] [PubMed] [Google Scholar]
- Schroeder TJ, Borges R, Finnegan JM, Pihel K, Amatore C, Wightman RM (1996) Temporally resolved, independent stages of individual exocytotic secretion events. Biophys J 70: 1061-1068. [DOI] [PMC free article] [PubMed] [Google Scholar]
- Schubert D, Klier FG (1977) Storage and release of acetylcholine by a clonal cell line. Proc Natl Acad Sci USA 74: 5184-5188. [DOI] [PMC free article] [PubMed] [Google Scholar]
- Schubert D, LaCorbiere M, Klier FG, Steinbach JH (1980) The modulation of neurotransmitter synthesis by steroid hormones and insulin. Brain Res 190: 67-79. [DOI] [PubMed] [Google Scholar]
- Stevens CF, Williams JH (2000) “Kiss and run” exocytosis at hippocampal synapses. Proc Natl Acad Sci USA 97: 12828-12833. [DOI] [PMC free article] [PubMed] [Google Scholar]
- Sulzer D, Edwards R (2000) Vesicles: equal in neurotransmitter concentration but not in volume. Neuron 28: 5-7. [DOI] [PubMed] [Google Scholar]
- Sulzer D, Pothos EN (2000) Regulation of quantal size by presynaptic mechanisms. Rev Neurosci 11: 159-212. [DOI] [PubMed] [Google Scholar]
- Taraska JW, Perrais D, Ohara-Imaizumi M, Nagamatsu S, Almers W (2003) Secretory granules are recaptured largely intact after stimulated exocytosis in cultured endocrine cells. Proc Natl Acad Sci USA [DOI] [PMC free article] [PubMed]
- Tischler AS, Greene LA (1978) Morphologic and cytochemical properties of a clonal line of rat adrenal pheochromocytoma cells which respond to nerve growth factor. Lab Invest 39: 77-89. [PubMed] [Google Scholar]
- Uchizono K (1965) Characteristics of excitatory and inhibitory synapses in the central nervous system of the cat. Nature 207: 642-643. [DOI] [PubMed] [Google Scholar]
- Uchizono K (1967) Inhibitory synapses on the stretch receptor neurone of the crayfish. Nature 214: 833-834. [DOI] [PubMed] [Google Scholar]
- Uvnas B, Aborg CH (1983) Cation exchange—a common mechanism in the storage and release of biogenic amines stored in granules (vesicles)? I. Comparative studies on the uptake of sodium and biogenic amines by the weak cation (carboxyl) exchangers Amberlite IRC-50 and Sephadex C-50 and by biogenic (granule-enriched) materials in vitro. Acta Physiol Scand 119: 225-234. [DOI] [PubMed] [Google Scholar]
- Varoqui H, Erickson JD (1997) Vesicular neurotransmitter transporters. Potential sites for the regulation of synaptic function. Mol Neurobiol 15: 165-191. [DOI] [PubMed] [Google Scholar]
- Wagner JA (1985) Structure of catecholamine secretory vesicles from PC12 cells. J Neurochem 45: 1244-1253. [DOI] [PubMed] [Google Scholar]
- Weissenhorn W, Dessen A, Calder LJ, Harrison SC, Skehel JJ, Wiley DC (1999) Structural basis for membrane fusion by enveloped viruses. Mol Membr Biol 16: 3-9. [DOI] [PubMed] [Google Scholar]
- Wickelgren WO, Leonard JP, Grimes MJ, Clark RD (1985) Ultrastructural correlates of transmitter release in presynaptic areas of lamprey reticulospinal axons. J Neurosci 5: 1188-1201. [DOI] [PMC free article] [PubMed] [Google Scholar]
- Wightman RM, Jankowski JA, Kennedy RT, Kawagoe KT, Schroeder TJ, Leszczyszyn DJ, Near JA, Diliberto Jr EJ, Viveros OH (1991) Temporally resolved catecholamine spikes correspond to single vesicle release from individual chromaffin cells. Proc Natl Acad Sci USA 88: 10754-10758. [DOI] [PMC free article] [PubMed] [Google Scholar]
- Wightman RM, Schroeder TJ, Finnegan JM, Ciolkowski EL, Pihel K (1995) Time course of release of catecholamines from individual vesicles during exocytosis at adrenal medullary cells. Biophys J 68: 383-390. [DOI] [PMC free article] [PubMed] [Google Scholar]
- Zimmerberg J, Curran M, Cohen FS, Brodwick M (1987) Simultaneous electrical and optical measurements show that membrane fusion precedes secretory granule swelling during exocytosis of beige mouse mast cells. Proc Natl Acad Sci USA 84: 1585-1589. [DOI] [PMC free article] [PubMed] [Google Scholar]
- Zimmermann H, Whittaker VP (1974) Effect of electrical stimulation on the yield and composition of synaptic vesicles from the cholinergic synapses of the electric organ of Torpedo: a combined biochemical, electrophysiological and morphological study. J Neurochem 22: 435-450. [DOI] [PubMed] [Google Scholar]