

Abstract
Lesions of the olfactory periphery provide a means for examining the reconstitution of a diverse and highly regulated population of sensory neurons and the growth, en masse, of nascent axons to the bulb. The olfactory epithelium and its projection onto the bulb are reconstituted after ablation by methyl bromide gas, and some measure of olfactory function is restored. The extent to which the system regenerates the full repertoire of odorant receptor-expressing neurons, particularly their spatially restricted distribution across the epithelial sheet, is unknown, however, and altered odorant receptor expression might contribute to the persistent distortion of odorant quality that is observed in the lesioned-recovered animals. To address the question of receptor expression in the recovered epithelium, we performed in situ hybridization with digoxigenin-labeled riboprobes for eight odorant receptors on the olfactory epithelium from unilaterally methyl bromide-lesioned and control rats. The data demonstrate that the distribution of sensory neuron types, as identified and defined by odorant receptor expression, is restored to normal or nearly so by 3 months after lesion. Likewise, the numbers of probe-labeled neurons in the lesioned-recovered epithelium are nearly equivalent to the unlesioned side at this time. Finally, our evidence suggests that odorant receptors are distributed in multiple overlapping bands in the normal, unlesioned, and lesioned-recovered epithelium rather than in the conventionally accepted three or four zones. Thus, the primary sensory elements required for functional recovery of the olfactory system after damage are restored, and altered function implies the persistence of a more central failure in regeneration.
Keywords: in situ hybridization, olfactory sensory neuron, immunohistochemistry, regeneration, odorant receptor, olfactory epithelium, methyl bromide
Introduction
The capacity for ongoing neurogenesis in the adult mammalian olfactory system is a double-edged sword. On the one hand, that capacity underlies the ability of the system to recover anatomically after injury, as documented previously in numerous studies by numerous investigators (for review, see Graziadei and Monti Graziadei, 1985; Costanzo, 1991; Schwob, 2002). For example, passive inhalation of the selective olfactotoxin methyl bromide (MeBr) destroys olfactory sensory neurons (OSNs) and sustentacular cells in >95% of the olfactory epithelium (OE) (Hurtt et al., 1987, 1988; Schwob et al., 1995, 1999). Despite the severity of the initial lesion, the OE begins to reconstitute within a few days after lesion and has recovered to normal by 6 weeks with respect to the rate of neuronal turnover and the balance between mature and immature OSNs (Schwob et al., 1995). Furthermore, the projections to the olfactory bulb (OB) have essentially stabilized by 8 weeks after lesion (Schwob et al., 1999).
On the other hand, neuronal replacement throughout life raises the question of how perceptual stability is maintained in the face of either piecemeal (e.g., during “normal” life in the laboratory setting) or wholesale (e.g., after lesion) neuronal turnover.
The problem is magnified by the regulated expression of members of the odorant receptor (OR) gene family (Buck and Axel, 1991). Individual OSNs express only one allele at a single OR locus at a high level (Chess et al., 1994). Furthermore, those neurons that express a particular OR are segregated to a limited region of the epithelium, conventionally asserted to correspond to one of three or four nonoverlapping zones, although the OR37 subfamily and other closely related ORs are obvious exceptions to that conventional formulation (Strotmann et al., 1992, 1994a,b, 1999; Ressler et al., 1993; Vassar et al., 1993; Kubick et al., 1997; Konzelmann et al., 1998; Pyrski et al., 2001). Finally, the axons of all of the OSNs that express a particular OR converge to a limited number of glomeruli generally found in only one locus in the medial glomerular layer and another in the lateral part (Ressler et al., 1994; Vassar et al., 1994; Mombaerts et al., 1996; Wang et al., 1998).
The receptotopic organization of the projection of the epithelium onto the OB is likely responsible for establishing odorant-specific patterns of metabolic and physiological activation across the glomerular layer (Johnson et al., 1998, 2002; Malnic et al., 1999; Uchida et al., 2000; Belluscio and Katz, 2001; Meister and Bonhoeffer, 2001). Thus, maintaining perceptual stability may depend on restoring the representation of the OR repertoire in the epithelium during the turnover process. Conversely, a failure to restore the normal repertoire after epithelial damage might compromise olfactory function, despite the substantial anatomical recovery that occurs. Indeed, rats trained to a five-odorant identification task, exposed to MeBr, and retested after a rest period took longer to recover to prelesion performance levels than did control rats (Youngentob and Schwob, 1997; Schwob and Youngentob, 2001). Lesioned animals were also more variable in the types of identification mistakes made during the behavioral task, suggesting an alteration in the perception of odorant quality. The extent to which spatial coding across the glomerular layer is restored after MeBr lesion begins with whether OSNs collectively express the appropriate population of ORs in the lesion-recovered epithelium.
Our analysis addresses the question of whether OR-positive OSNs reconstitute in the OE after damage in terms of segregation in the coronal plane (i.e., along the circumferential axis of the epithelium), total cell number, and anteroposterior (AP) distribution. We performed in situ hybridizations (ISHs) with a panel of eight ORs in unilaterally MeBr-lesioned versus unlesioned control OE in the rat and found that the number and AP position of labeled neurons were comparable. We also found evidence that the conventionally accepted three- or four-zone configuration is an incomplete representation of the rules governing OR expression; each of the eight OR-defined populations has its own circumscribed region along the circumferential axis of the OE, or AP-running band; in aggregate, the regions are better described as a series of overlapping bands that are shifted relative to each other along the circumferential dimension of the epithelium as viewed in the coronal plane than as a smaller number of sharply bounded zones.
Materials and Methods
Animals. Male Sprague Dawley rats were obtained from a commercial supplier (Taconic, Germantown, NY) at 250-300 gm. Rats were food restricted and maintained at 80% of ad libitum body weight (ranging from 200 to 220 gm) with controlled portions of rat chow and Ensure until MeBr exposure, at which point rat chow was available ad libitum. Water was supplied ad libitum, and animals were maintained in a heat- and humidity-controlled vivarium. The animal work was conducted at State University of New York Upstate Medical University, and all animal use protocols were approved by the Committee for Humane Use of Animals.
Methyl bromide lesion. Rats were anesthetized with halothane 1 d before exposure, and the left naris was occluded with cyanoacrylate glue and stabilized with a single stitch of 4-0 silk (Schwob et al., 1999). The following day, awake rats were placed in a wire enclosure measuring 15 × 15 × 15 cm centered in a 30 × 30 × 30 cm Plexiglas box and exposed to MeBr gas (Matheson Gas Products, East Rutherford, NJ) at 330 ppm in purified air at a flow rate of 10 l/min as described (Schwob et al., 1995). The duration of the exposure was 6 hr. The naris occlusion was removed the following morning. Unilaterally lesioned rats were perfused either 3 d (n = 4) or 3 months (n = 7) after lesion as described below. A total of six rats were food restricted but not exposed and served as controls for the effects of the lesion.
Tissue preparation. The MeBr-lesioned rats and control rats age matched for the short-term (n = 4) and long-term (n = 2) lesions were deeply anesthetized with sodium pentobarbital and then perfused intracardially with DEPC-PBS and 4% paraformaldehyde (Fisher Scientific, Suwanee, GA) in 0.05 m sodium phosphate buffer, pH 7.2. The nose and brain were stripped of tissue and external bone and postfixed for 3 hr. The tissue was rinsed in DEPC-PBS and cryoprotected in 30% sucrose made in DEPC-PBS and then frozen in O.C.T. compound (Miles Inc., Elkhart, IN). Olfactory tissue was sectioned on a cryostat (Reichert-Jung 2800 Frigocut) at 16 μm in the coronal plane, collected onto Fisher brand Plus slides (Fisher Scientific), and stored at -20°C.
In situ hybridization: probe preparation. Plasmids containing olfactory receptor DNA inserts [OR14, 16, 18, 37, 107, 124, 133 (gifts from Dr. Heinz Breer, University of Hohenheim, Stuttgart, Germany); I7 (gift from Dr. Linda Buck, Fred Hutchinson Cancer Research Center, Seattle, WA)] (see Table 1) were linearized, and antisense RNA probes were transcribed with digoxigenin (DIG)-labeled UTP (Roche Molecular Biochemicals, Indianapolis, IN) as recommended by the manufacturer. All inserts were sequence verified. DIG-labeled probes were then alkaline hydrolyzed with 0.2 m sodium carbonate buffer, pH 10.2, at 60°C to a length of 250-300 bases according to the following formula: (actual transcript length - desired transcript length)/[0.11 × (actual length × desired length)]. We determined empirically that this size enables the best probe penetration and resultant hybridization within the olfactory epithelium. An antisense probe selective for the 5′-and 3′ untranslated region (UTR) of the OR18 message was prepared by digesting the OR18 plasmid using BglII enzyme, religating, and then linearizing and transcribing the resultant plasmid as above.
Table 1.
Odorant receptor probes used in this study
|
Odorant receptor probe |
Insert/probe length (kb) |
5′ UTR |
Coding region (kb) |
3′ UTR (kb) |
Closest mouse OR homolog |
|---|---|---|---|---|---|
| OR14a | 1.6 | 0 | 0.91 | 0.66 | MOR161-2 |
| OR16 | 2.0 | 0 | 0.81 | 1.19 | MOR258-2 |
| OR37a | 2.1 | 0 | 0.89 | 1.21 | MOR262-8 |
| OR18a | 1.58 | 0.56 kb | 0.93 | 0.09 | MOR231-12 |
| OR133/F12b | 1.67 | 0.37 kb | 0.93 | 0.37 | MOR139-5c |
| OR107a | 1.42 | 0.18 kb | 0.93 | 0.31 | MOR183-2 |
| 17d | 3.5 | 0.52 kb | 0.98 | 2.0 | MOR103-15 |
| OR124 |
1.1 |
0 |
0.78 |
0.32 |
MOR246-2 |
Nucleotide sequence was verified for each of the probes.
OR133 has the identical sequence as F12; ISH labeling with F12 was illustrated in Vassar et al. (1993).
A full-length coding sequence is found in GenBank and derives from the C57BL/6J genome, which was used by the public mouse genome sequencing effort. The closest homolog in the Celera database is MOR139-5P, which is putatively identified as a pseudogene in the mouse strains, which did not include C57BL/6J, used by Celera (Zhang and Firestein, 2002).
ISH labeling with this probe is illustrated in Vassar et al. (1993).
In addition, the 3′UTRs of the OR14 and OR133 messages were cloned from OE RNA using a 3′ RACE kit (Stratagene, La Jolla, CA) according to the manufacturer's instructions. For OR14 the sense primer (5′-CCTTCCATTTTGCCCCTTGACCAAGG-3′) corresponded to nucleotides (nts) 787-812 of the coding sequence. A fragment of 0.87 kb was obtained, cloned into pCR2.1-TOPO vector, and sequence verified. For OR133 the sense primer corresponded to nts 790-815 of the coding sequence. The resultant PCR fragment of 0.53 kb was cloned and sequenced as above. After linearization and transcription in the antisense direction, the resulting DIG-labeled probes were digested to an average length of 250 bases as described above.
In situ hybridization: hybridization protocol. ISH using a single DIG-labeled probe was performed according to a published protocol (Iwema and Schwob, 2003). Hybridized probe was localized by incubation in solution containing the combination of nitro blue tetrazolium (NBT) and 5-bromo-4-chloryl-3-indolyl phosphate (BCIP). Slides were stored dry and imaged after dehydration and coverslipping with DPX (BDH, Poole, UK).
Double ISH with OR37 and OR14. The OR37 probe was linearized and transcribed with fluorescein-labeled UTP (Roche Molecular Biochemicals). OR14 probe preparation was as described above. Sections were prepared for ISH as described above, and both probes were hybridized to the tissue simultaneously; however, the tissue was cycled through the ISH detection procedure twice, once for each probe. The distribution of the bound OR37 probe was visualized first, by incubating with anti-fluorescein-alkaline phosphatase (1:500; Roche Molecular Biochemicals) and using 2-(4-iodophenyl)-3-(4-nitrophenyl)-5-phenyl-tetrazolium chloride and BCIP [each 33 mg/ml in DMSO (Sigma-Aldrich, St. Louis, MO)] as the chromagen, followed by extensive washing. The sections were then incubated with anti-DIG-AP (1:750) and NBT/BCIP to visualize the OR14 probe. Slides were thoroughly rinsed and stored dry.
Quantitative analysis-cell count. The number of probe-positive neurons was quantified for each OR by counting labeled cells at 400× magnification around the circumference of the OE. Counted sections were spaced every 1 mm through the region of the OE extending from the tip of endoturbinate IID through to the level of the anterior pole of the OB. The extrapolated counts for total number of probe-positive profiles were obtained by the following equation: estimated counts for unexamined tissue = {([r1 + r2]/t}*u; r1 = raw cell count for section 1; r2 = raw cell count for section 2; t = section thickness (16 μm); u = uncounted distance between counted sections (984 μm). This equation was repeated for each pair of counted sections (1 + 2, 2 + 3, etc.), thereby providing an estimate of OR-positive cells in the uncounted tissue. The sum of the raw counts from both right and left sides was added to the sum of the estimated counts to provide the final corrected count. It should be emphasized that we counted the number of labeled cell profiles and that the counts were not corrected to determine absolute cell number. The number of counted profiles is likely to be a direct and consistent function of the actual number of OR-positive neurons because neuronal size is comparable with normal in lesioned-recovered OE (Schwob et al., 1995).
Results
OR expression patterns in normal adult rat OE
Our goal was to characterize the expression of various members of the OR family in the lesioned-recovered OE as compared with normal. Because the labeling patterns observed with some of the probes have not been described in detail previously, the first part of the study was an analysis of the distribution of probe-positive neurons across the normal OE. We performed ISH with antisense DIG-labeled riboprobes for each of eight ORs (OR14, OR16, OR18, OR37, OR107, OR124, OR133/F12, I7) on eight adjacent coronal sections (one probe per section) at 11-15 levels throughout the AP extent of the OE beginning immediately anterior to endoturbinate II through its eventual disappearance midway through the OB. Although the sequence of the rat genome remains in early draft form, identification of the closest mouse homolog to each of the eight ORs suggests that the set is widely spaced across the type II members of the OR gene family (Table 1). OR-positive OSNs are easily distinguished from unlabeled cells by the cytoplasmic deposition of dense purple reaction product (Fig. 1) (OR16 and I7). Individual OR-positive OSNs may be adjacent to (Fig. 1F) or at a distance from (Fig. 1B) other OSNs expressing the same OR.
Figure 1.

Neuronal labeling by ISH with either the OR16 (A) or I7 (E) OR probe in normal rat OE visualized with alkaline phosphatase. Boxed areas are shown at higher power in B and F, respectively. Labeled cells are scattered across a restricted territory of the OE and may be close to each other or more highly separated. C, D, Schematics of the OE illustrating the locations of A and E. Scale bars: (in A) A, E, 200 μm; (in B) B, F, 50 μm.
Our ISH results were generally comparable with those published previously (Strotmann et al., 1992; Ressler et al., 1993; Vassar et al., 1993; Sullivan et al., 1996). As expected, the pattern of cell staining by ISH varied among the probes with respect to position, number, and distribution along the AP axis of the OE. Our data confirm that each OR probe labels neurons within a spatially limited sector of the circumference of the OE in the coronal plane that is consistent among animals. In those cases in which the pattern of labeling has been described for a particular OR, our results are quite similar to the published findings (referenced in Table 1). The riboprobes used here hybridized to ORs expressed in four general regions of the OE: OR14 and OR16 are found in the dorsal recess including the dorsal septum and the tips of the dorsal turbinates; OR107, OR124, and I7 are limited to a swathe of epithelium lining the lateral turbinates and cul de sacs; OR18 and OR133/F12 are positioned between the two aforementioned regions; and OR37 expression is restricted primarily to the tips of endoturbinates II and III and ectoturbinate 3.
All eight expression patterns were compared with one another at multiple levels through the epithelium by mapping the distribution of the stained cells on digital images of each of the eight labeled sections and projecting each individual map onto a schematic derived from a middle section of the set hybridized at each level; a representative group of composites from a control animal is illustrated in Figure 2. The distance from the first through eighth section of a set equals 128 μm. Because there is little change in the structure of the nasal cavity over that distance, we can consistently and accurately translate the position of the labeled neurons onto the composite schematic without substantial distortion in their position. The results obtained in this manner are comparable among all five of the control animals that were studied.
Figure 2.
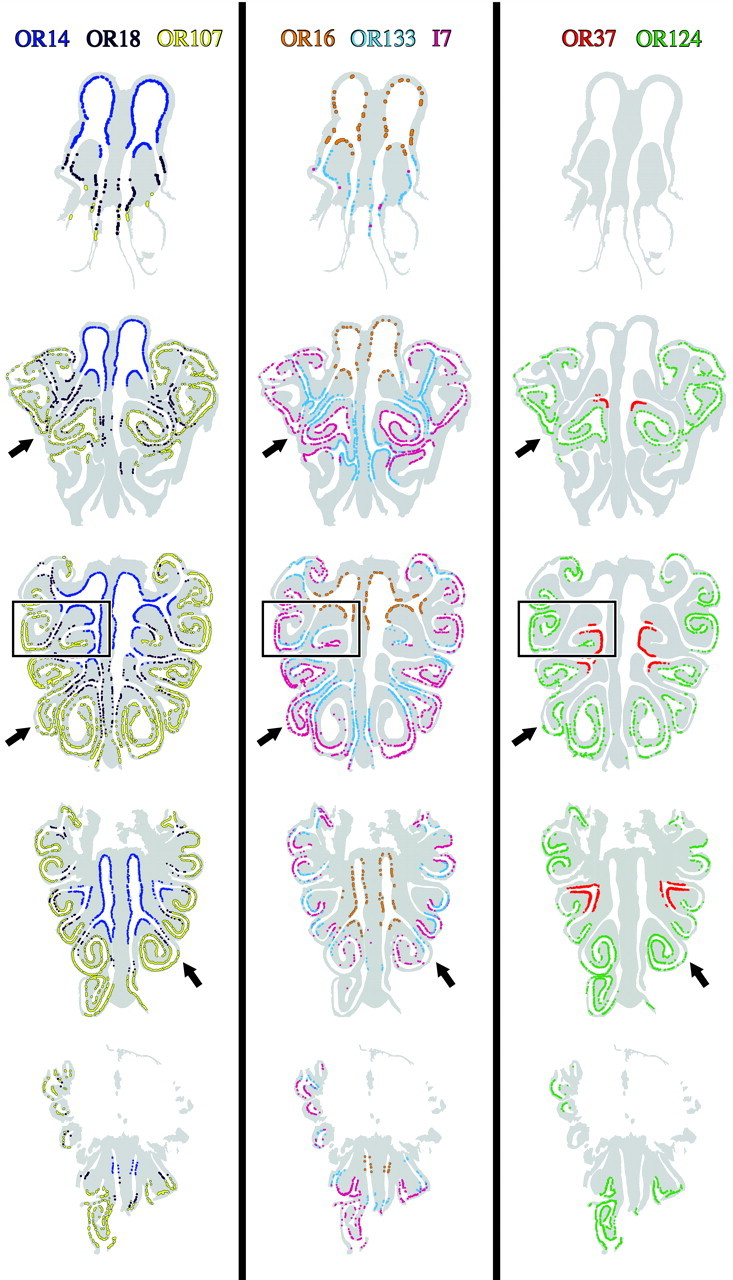
Schematics illustrating OR expression patterns throughout the extent of normal rat OE. Each colored dot designates an OR-positive OSN in a single subject (CI-142) using each of eight OR riboprobes. At each level, the labeling on the eight adjacent sections was compiled onto a single schematic although the OR distributions were separated into three panels for ease of visualization. The boxed area is shown at higher power in Figure 3. The arrows indicate areas where multiple ORs overlap, but only partially.
Analysis of the maps demonstrates that the distribution of OR-positive OSNs is diverse not only in terms of segregation along the circumference of the OE, but also in terms of AP distribution and the density of the individual OR-positive populations.
Labeling with OR probes is distributed in many overlapping bands rather than a few sharply bounded zones
Previous investigators have generally asserted that all ORs are randomly distributed in one of three or four discrete zones arrayed around the circumference of the OE from dorsomedial outward (Strotmann et al., 1992, 1994a,b; Ressler et al., 1993; Vassar et al., 1993; Sullivan et al., 1996). Furthermore, the boundaries between adjacent zones ostensibly permit only limited mixing. The zonal hypothesis also postulates that all parts of the OE should contain neurons labeled by one or more of the ORs in our panel, because it contains representatives of all the presumptive zones. Finally, there ought not be any systematic variation in expression patterns between ORs within the same zone, because the neurons labeled by any one probe have been described as randomly distributed throughout the zone. During the course of our analysis, however, we found evidence that disputes all of these assertions and makes it impossible to classify the distribution of the probe-positive neurons into the three or four conventionally defined zones.
The incompatibilities between the present data and the conventional formulation are evident on examination of the maps constructed by collapsing the distributions of the eight individual probes onto a single central section (Figs. 2, 3). The problems of the zonal model, as conventionally proposed, are particularly evident by focusing on the dorsolateral region of the epithelium in expanded representations that allow all of the probes to be illustrated on a single composite (Figs. 2, 3). In rough terms, the different kinds of OR-positive OSNs could be grouped into three areas as indicated above: dorsomedial-dorsal recess (OR14 and OR16), far lateral (OR 107, OR124, I7), and everything in between, which will be termed the middle region for current purposes (the exception to this scheme being OR37, which is restricted more tightly in its AP and circumferential distribution as described above). Thus, proceeding from dorsomedial to ventrolateral, one first encounters OR14 and OR16 and then progresses to (→) OR18 → OR133/F12 → OR107 → I7 → OR124 (Figs. 2, 3). There is significant overlap between different kinds of probe-positive neurons at the boundaries between the dorsal recess and the middle area. The same is noted at the boundaries between the middle and far lateral areas. Moreover, within each of the three broadly defined regions of the OE, the overlap between the different kinds of probe-positive neurons is only partial. Given that the aforementioned discrepancies are observed consistently across all of the control animals, the data, taken as whole, suggest that each of the ORs in our panel has its own unique pattern of spatially restricted expression.
Figure 3.

Expanded view of the lateral part of the left OE from the middle level shown in Figure 2, in which the labeling from all eight probes is mapped onto a single copy of the schematic section. Each dot marks the position of an OR-positive OSN, and each color represents an OR subtype as indicated. The arrows designate the progression of OR labeling as one proceeds from central to peripheral along the opposing epithelial surfaces. The progression is also indicated by the order of listing the OR probes across the top from central (at the right) toward peripheral (at the left). Each of the eight ORs in the panel has a unique expression pattern in this and other portions of the adult rat OE.
It is useful when illustrating several specific features of the various distributions to highlight the inconsistencies between the current results and the zonal model. First, OR14 and OR16, although in the same “zone,” are not completely overlapping; the expression of OR14 extends farther ventral along the septum and farther lateral along endoturbinate IID than OR16 (Figs. 2, 3). This is immediately apparent by virtue of the fact that expression of OR14, but not OR16, overlaps with that of OR37 in some places, although they tend to be located in different strata of the epithelium as described previously (Figs. 2, 3, 4) (Strotmann et al., 1996). Second, there appears to be a gap between OR14 versus OR18 expression at anterior levels of the epithelium, in which neither are expressed, but not at more posterior levels where the two overlap slightly (Figs. 2, 3, 5). These data are inconsistent with the zonal model because the position of the expression zones shifts relative to each other. Third, the distributions of OR18 and OR133, both of which are found in the middle region, are not coextensive; the medial part of the OR18 territory lacks OR133 labeling and the converse is true of the lateral part of the OR133 sector (Figs. 2, 3). Fourth, there is extensive overlap between OR133/F12 (middle region) and OR107 (lateral region) expression patterns (Figs. 2, 4, 6). Fifth, although they are in the same lateral sector, OR107+ OSNs are found medial to OR124+ and I7+ neurons (Figs. 2, 3). Finally, I7 expression is not coextensive with OR124, particularly in the cul de sacs, despite their overlap within the lateral regions of the epithelium (Figs. 2, 3).
Figure 4.
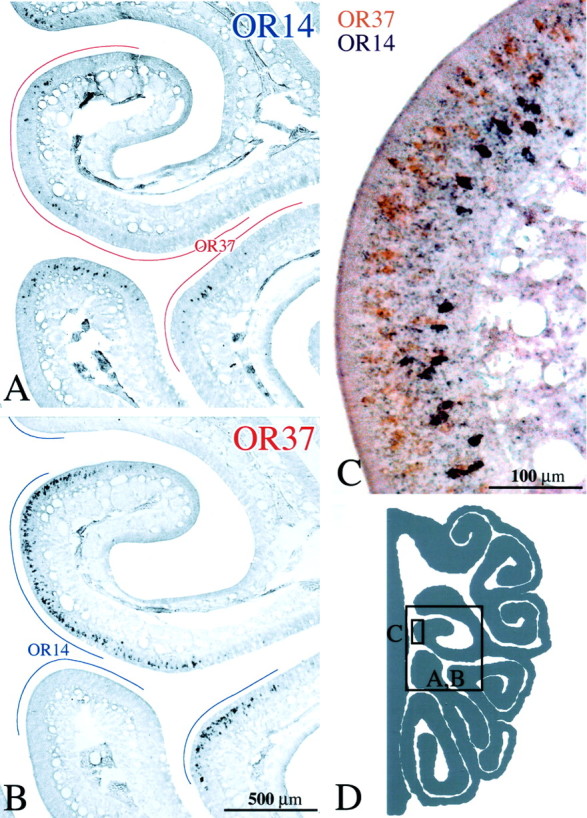
A, B, OSNs labeled by ISH with either OR14 or OR37 riboprobe, respectively, on adjacent sections of control epithelium (CI-127). In this and subsequent figures, the lines drawn in the nasal airspace designate the extent of labeling with the alternate probe on the adjacent section. Note that areas of the epithelium are unique to each probe. C, Double ISH in a single section with both OR14+ OSNs (purple) and OR37+ OSNs (orange). Receptor distribution is stratified, and there is no evidence of colabeling of individual neurons. D, Schematic of a hemisection from the CI-127 showing the location of the photomicrographs. Scale bars: (in B) A, B, 500 μm; C, 100 μm.
Figure 5.

OSNs labeled by ISH with OR14 (A, E) or OR18 (B, F) riboprobe on adjacent sections of control epithelium (CI-128). The lines drawn in the nasal airspace designate the extent of labeling with the alternate probe on the adjacent section. A, B, High-power photomicrographs of anterior OE. Note the extent of the OE that is devoid of both OR14+ and OR18+ OSNs. C, Schematic of a hemisection of anterior epithelium from CI-128 showing the location of A and B. E, F, High-power photomicrographs of posterior OE. Note that in posterior OE the regions of OR14 and OR18 expression are slightly overlapping at the limits of their respective territories. Asterisks in F highlight OR18+ OSNs that are deep within the OR14 sector. D is a schematic of a hemisection of posterior rat OE showing the location of E and F. Scale bars: (in A) A, B, 200 μm; (in E) E, F, 500 μm.
Figure 6.

A, B, OSNs labeled by ISH with OR133 or OR107 riboprobe, respectively, in adjacent sections of control epithelium (CI-126) in the region of endoturbinate II and ectoturbinates 2 and 3. The lines drawn in the nasal airspace designate the extent of labeling with the alternate probe on the adjacent section. Note the numerous regions where labeling with OR133 and OR107 overlap despite the concentration of OR133 more medially and OR107 more laterally. C, Schematic of the hemisection from CI-126 showing the location of the photomicrographs. Scale bar: (in B) A, B, 200 μm.
OR expression is eliminated shortly after unilateral MeBr exposure
Previous descriptions of the acute effects of MeBr exposure and the reconstitution of the OE over the long term have concentrated on animals exposed bilaterally to the toxin (Hurtt et al., 1988; Schwob et al., 1995, 1999). To take advantage of the potential for a within-animal control, we modified the procedure to limit effective exposure to one side of the OE by closing the left naris of rats maintained on chronic food restriction. [For reasons that are incompletely understood at this time, food restriction accentuates the effect of MeBr on the OE in terms of severity and extent of damage (Schwob et al., 1995, 1999).] Indeed, the lesion was mostly limited to the OE on the side that was open during MeBr exposure, despite the gap at the base of the nasal septum that overlies the entrance to the nasopharyngeal duct. We used anti-olfactory marker protein (OMP) immunohistochemistry to assay for sparing and loss on the two sides in a group of six animals killed 3 d after lesion (Table 2). In this set of animals, unilateral exposure destroyed OSNs in 88-99% of the epithelium on the open side but damaged only 0-5% of the OE on the side where the naris was occluded [see also Schwob et al. (1999)].
Table 2.
Extent of damage to the olfactory epithelium in rats exposed to methyl bromide after unilateral naris closure
|
Experimental animal |
Closed-naris side (%) |
Open-naris side (%) |
|---|---|---|
| CI-4 | 0.0 | 93.5 |
| CI-29 | 1.0 | 99.0 |
| CI-50 | 0.0 | 95.0 |
| CI-55 | 1.0 | 95.2 |
| CI-56 | 0.0 | 88.2 |
| CI-57 | 5.0 | 96.5 |
| Group mean ± SEM |
1.2±0.8 |
94.6±1.5 |
The extent of damage was determined in unilaterally lesioned rats by measuring the length of epithelium that was devoid of anti-OMP staining relative to the whole length of the epithelium in OMP-immunolabeled sections through the AP extent of the epithelium as done previously (Schwob et al., 1995).
In a second group of four animals, we performed ISH with the eight ORs 3 d after unilateral MeBr exposure. OR expression patterns on the unlesioned side are comparable with normal tissue with respect to number, spatial segregation, and AP distribution, whereas the OE on the lesioned side is destroyed down to the basal cell layer (e.g., OR18) (Fig. 7). As suggested by the analysis of OMP staining, only a few probe-positive OSNs are spared on the lesioned side of the OE (Table 3) and only in some of the animals. The counts of probe-positive neurons on the closed side suggest also that the unilateral closure is effective in mostly limiting the damage to the side with the open naris, because the numbers are comparable with the control animals (Table 3; see Fig. 11A). The results indicate that the closed side is close to normal and a reasonable control for the effect of the lesion on the distribution of the ORs after the recovery of the epithelium on the open side.
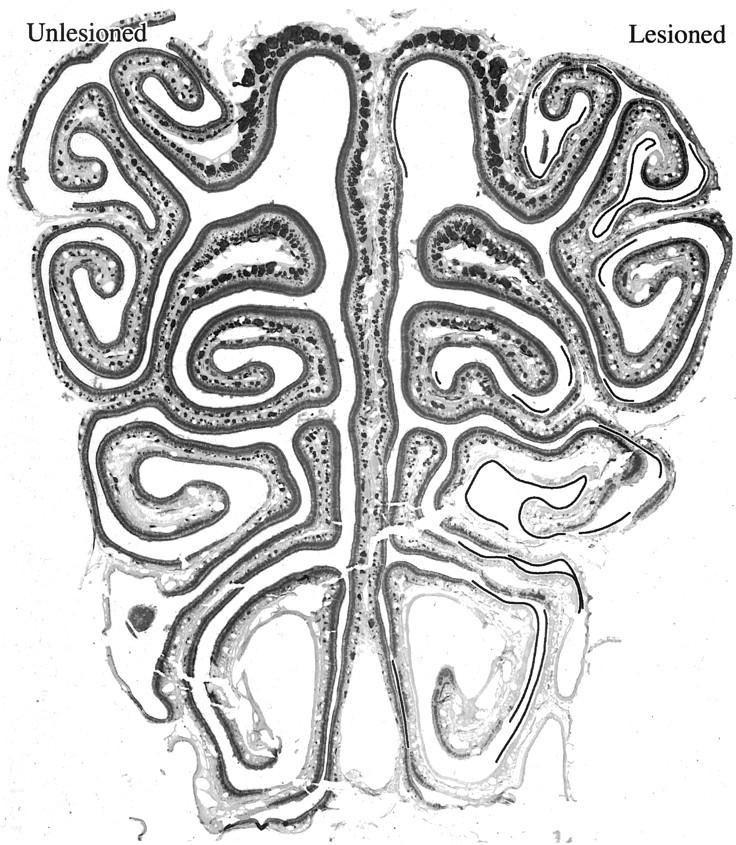
Figure 7.

Three days after unilateral exposure to MeBr, sensory neurons labeled by OR18 riboprobe are completely eliminated from the epithelium on the side exposed to MeBr (CI-129). A, Photomicrograph showing OR18+ OSNs in the nasal cavity on the side where the naris was closed before MeBr exposure. Boxed area is shown at higher magnification in C. D, Side where the naris was open during the MeBr exposure. B, Schematic of the OE showing the location of the photomicrographs. Scale bars: (in A) A, B, 200 μm; C, 50 μm.
Table 3.
Labeling with OR probes 3 d after unilateral methyl bromide exposure
|
OR probe |
Profile count: closed-naris side |
Profile count: open-naris side |
Profile count: ratio percentage |
|---|---|---|---|
| OR14 | 123313 ± 7810 | 1656 ± 1356 | 1.4 ± 1.4% |
| OR16 | 20487 ± 829 | 219 ± 126 | 1.1 ± 0.7% |
| OR37 | 58078 ± 6489 | 0 ± 0 | 0 ± 0% |
| OR18 | 166519 ± 2412 | 1344 ± 1244 | 0.8 ± 0.7% |
| OR133 | 99756 ± 11127 | 1219 ± 1157 | 1.3 ± 1.3% |
| OR107 | 225891 ± 12591 | 5041 ± 3007 | 2.3 ± 1.4% |
| 17 | 95001 ± 14771 | 1344 ± 796 | 1.6 ± 0.9% |
| OR124 |
176568 ± 29512 |
5828 ± 5241 |
2.4 ± 2.0% |
Numbers of DIG-labeled cells were counted on both sides of the nasal cavity in rats killed 3 d after MeBr exposure (mean ± SEM; n = 4). The individual ratio of open-naris versus closed-naris sides is reported as percentage remaining on the lesioned side.
Figure 11.
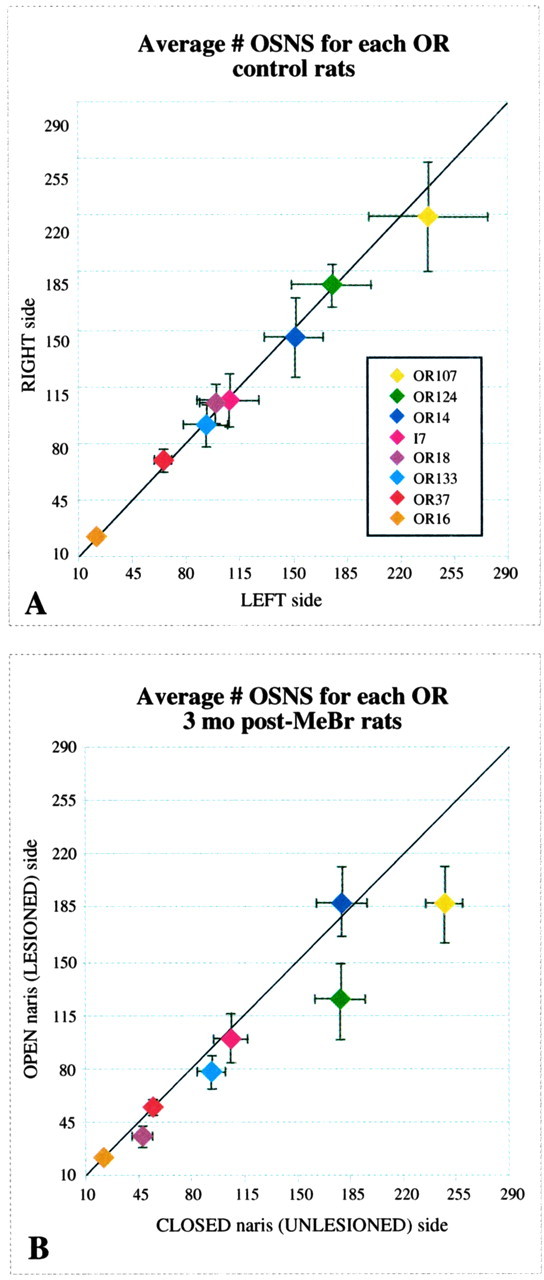
A, The average number of probe-positive OSNs in normal rat OE is illustrated for each OR (n = 5). There is no systematic difference in number between the two sides across this set of probes; however, note the variation in total cell number for each OR. B, The average number of probe-positive OSNs in the OE of unilaterally exposed rats is illustrated for each OR (n = 7). Neurons labeled by OR107 and OR124 are fewer in number on the lesioned-recovered side, whereas the rest of the probe-positive populations fall near the line indicating equal numbers on the unlesioned and lesioned-recovered sides.
OR expression patterns in lesion-recovered OE are indistinguishable from control
We examined OR-positive OSN expression patterns in the OE of unilaterally exposed rats 3 months after MeBr lesion and compared both the closed-naris side and the contralateral, lesioned side with age-matched control tissue. On the closed side, OR-positive OSN expression patterns were indistinguishable from control tissue for all eight probes, as would be expected from the lack of damage on that side acutely after unilateral MeBr exposure. Additionally, the patterns of OR-positive OSN expression on the open, lesioned-recovered side have apparently returned to normal or near-normal with respect to AP extent, circumferential distribution, and the density of label, judging by visual comparison of the two sides with controls (Figs. 2, 8, 9, 10). It is particularly striking that the boundaries of the expression territories are located at the same points along the circumference of the epithelium on the lesioned-recovered side as on the unlesioned side, which in turn are equivalent to control epithelium for all eight of the probes. Any discrepancies between the two sides with respect to the spatially restricted expression of the ORs reflect either technical artifact or patchy replacement of olfactory by respiratory epithelium as a consequence of the severity of the initial damage (Schwob et al., 1995, 1999; Jang et al., 2003). The general result is exemplified by the remarkable degree of similarity in the distributions of OR107+ OSNs on the two sides of a unilaterally lesioned-recovered rat and in controls (Fig. 9). OR107 is limited to the lateral OE in all settings, the density is similar within the expression zone, and the boundaries are equivalent on the two sides of the unilaterally lesioned animals despite the replacement of olfactory by respiratory epithelium as a consequence of MeBr injury in some parts of the OR107 territory (Schwob et al., 1995; 1999) (Figs. 9, 12). OR14, which is expressed in the dorsal recess and on endoturbinates II and III, can be cited as another illustration that the epithelium on the lesioned side recovers to a status essentially indistinguishable from the unlesioned side (Fig. 10). For this probe as well, the locations of the boundaries, the density of label, and the AP extent are comparable on the two sides and also similar to controls. As with the analysis of labeling of control tissue, we translated individual OR-positive OSN expression patterns at each level onto a representative schematic to provide an easy comparison of OR patterns from side-to-side as well as between ORs (Fig. 8); the equivalency of patterns on the two sides is striking, particularly when taken across the group of seven rats as a whole.
Figure 8.

Schematics illustrating OR expression patterns throughout the AP extent of OE from a rat 3 months after unilateral MeBr exposure (CI-133). Lesioned indicates the open-naris side. Unlesioned indicates the closed-naris side. Each colored dot designates an OR-positive OSN. At each level, the labeling on the eight adjacent sections was compiled onto a single schematic, although the OR distributions were separated into three panels for ease of visualization. The absence of OR18 labeling in the epithelium of endoturbinate III of the lesioned side of the middle section of the middle panel (asterisk) is caused by damage to that endoturbinate during ISH processing for OR18. That part of the epithelium is intact on nearby sections and is labeled with OR18 riboprobe in a manner indistinguishable from the unlesioned side.
Figure 9.
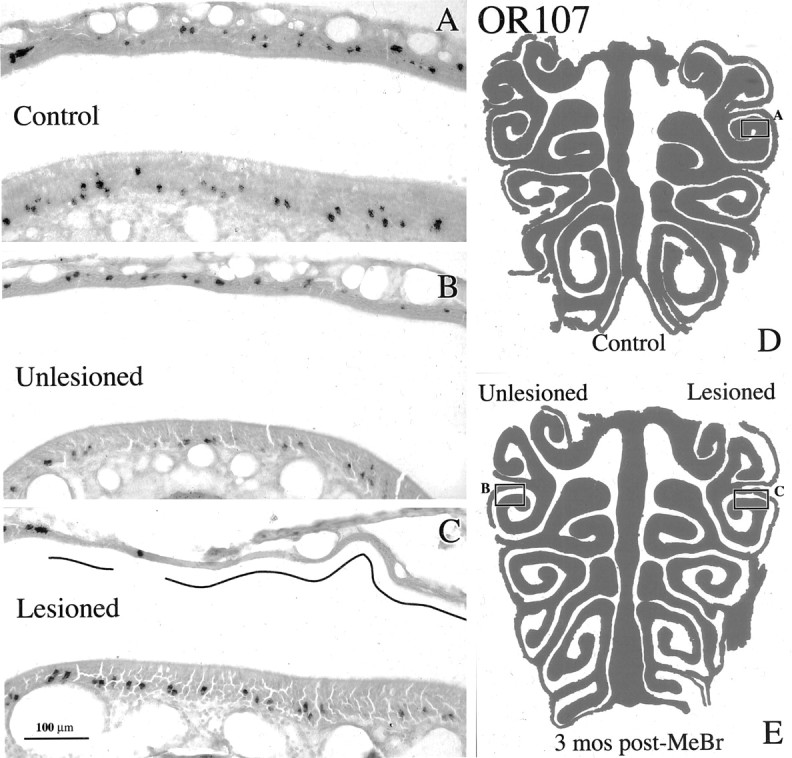
The distribution of OSNs labeled with OR107 riboprobe is restored after recovery from unilateral MeBr lesion. A, OR107 labeling in lateral cul de sac of a control animal (CI-127). B, C, Corresponding areas of the lateral cul de sac from a unilaterally exposed rat at 3 months after lesion (CI-135) on the closed-naris (unlesioned) and the open-naris (lesioned) sides, respectively. The differences in the labeling patterns between the lesioned side and the same region either on the unlesioned side or in the control epithelium are attributable to the patchy replacement of olfactory by respiratory epithelium as shown by the depletion of OMP staining in that area in a nearby section (data not shown). The regions that have undergone respiratory metaplasia are designated by the lines in the nasal cavity. D is a schematic of the OE illustrating the location of A. E, Schematic of the OE illustrating the location of B and C. Scale bar: (in C) A-C, 100 μm.
Figure 10.

The distribution of OSNs labeled with OR14 riboprobe is restored 3 months after unilateral MeBr lesion (AD-16), as shown by both the full-length OR14 riboprobe (A) and another one derived from the 3′UTR of the OR14 message (B). Both probes produce the same pattern of labeling on both sides. Lesioned indicates the open-naris side. Unlesioned indicates the closed-naris side. Counts indicate that slightly fewer OSNs are labeled by the 3′UTR probe; however, the boundaries of the OR14 territory (arrows) are situated in the same locations on both sides with both probes, suggesting that OSNs labeled by cross-hybridization to a closely related but distinct OR share the same territory, which is restored after the epithelium recovers from injury.
Figure 12.
Anti-OMP staining of a mid-anteroposterior section through the nasal cavity of a rat exposed unilaterally to MeBr and allowed to recover for 3 months (CI-137). Lesioned indicates the open-naris side. Unlesioned indicates the closed-naris side. Some of the epithelial lining on the lesioned side of the unilaterally exposed rats lacks OMP-positive neurons in contrast to the unlesioned side (lines drawn in the nasal cavity), indicating that it has undergone metaplasia and reconstituted as respiratory epithelium instead of olfactory.
To assay the extent to which OR expression is restored in the lesioned-recovered epithelium at a more quantitative level, we compared the open-naris and closed-naris sides with respect to total cell number (the latter analysis using the centroid of the distribution as the variable) and on the two sides of unexposed animals as a control. The number of OSNs that express a particular OR was estimated by counting all positive cells on both the right and left sides of each section (11-15 per animal) and correcting for unexamined tissue (see Materials and Methods). In control animals, the average size of the OR-positive neuronal populations ranged from ∼20,000 (OR16) to ∼170,000 (OR107) labeled profiles (Fig. 11A). We did not correct the profile counts to determine absolute cell number, because we were primarily concerned with the differences between the two sides for purposes of comparing lesioned-recovered from unlesioned epithelium in the unilaterally exposed animals, rather than the absolute sizes of the various labeled populations. Because there is no alteration in size of individual OSNs as a consequence of the wholesale turnover of the OE, the numbers of labeled profiles can be compared between the two sides without systematic bias (Schwob et al., 1995). In control animals, side-to-side differences in estimated counts were not evident (Fig. 11A); the similarities were confirmed by comparing the averaged ratio of right side/left side in the control group of five rats with a univariate ANOVA general linear model, with probe as a fixed effect and subject as a random effect (Table 4). The effect of side on the ratios is not significantly different from 1 (F(1,32) = 0.064; p = 0.802), and the effect of probe on ratio does not reach significance (F(7,32) = 1.197; p = 0.333). Thus, an effect of unilateral lesions of the OR in animals exposed to MeBr via one naris can be assayed by comparing the ratio of the counts on the two sides.
Table 4.
Ratio analysis of labeled cell number on both sides of control and unilaterally exposed rats
|
|
Control |
Three months after unilateral MeBr |
||||
|---|---|---|---|---|---|---|
| Odorant receptor probe |
Average ± SEM |
Ratio > 1 |
Average ± SEM |
Ratio > 1 |
||
| OR14 | 0.934 ± 0.056 | 1/5 | 1.063 ± 0.111 | 5/7 | ||
| OR16 | 1.034 ± 0.037 | 3/5 | 0.918 ± 0.156 | 4/7 | ||
| OR37 | 1.053 ± 0.035 | 4/5 | 1.036 ± 0.010 | 4/7 | ||
| OR18 | 1.048 ± 0.070 | 3/5 | 0.797 ± 0.011 | 1/7 | ||
| OR133 | 0.982 ± 0.018 | 3/5 | 0.833 ± 0.013 | 2/7 | ||
| OR107 | 0.925 ± 0.018 | 0/5 | 0.746 ± 0.011 | 1/7 | ||
| 17 | 1.013 ± 0.045 | 3/5 | 0.921 ± 0.012 | 3/7 | ||
| OR124 |
1.044 ± 0.066 |
3/5 |
0.667 ± 0.011 |
0/7 |
||
For each probe, the average ratio of labeled cell number for right/left OE was calculated across the group of control (n = 5) and unilaterally exposed (n = 7) rats. In addition, the number of rats for which labeled cell number was higher on the right or lesioned side of the OE is recorded for each group.
Accordingly, the number of OR-positive OSN profiles was determined in the unilaterally MeBr-lesioned rats (n = 7) in the same way as for the control animals (see Materials and Methods). In keeping with the results of visual inspection, the cell counts confirm that the numbers of OR-positive neurons are indeed similar on the lesioned-recovered and unlesioned sides. Thus, plots of labeled profiles on the lesioned versus unlesioned side fall on or close to the line of identity (slope of one and intercept through the origin) for six of the eight probes (Fig. 11B). OR107 and OR124 are exceptions to that result: the numbers of OR-positive OSNs on the lesioned-recovered side are substantially less than on the unlesioned side for these particular probes (Table 4). Summing across all of the probes for each animal indicates that five of the seven long-term experimental animals showed a lower number of probe-positive profiles on the lesioned-recovered side as compared with the naris-closed side. Nonetheless, the reduction in the number of probe-positive neurons on the lesioned-recovered sides is relatively modest; the number on the lesioned-recovered side is reduced to 85 ± 6.9% of the unlesioned side on average.
To test the significance of the aforementioned observations, ratios of the cell counts on the lesioned versus unlesioned side were calculated for all eight ORs for all seven animals (Table 4). We analyzed the effect of probe (i.e., OR-defined neuron type) and side on the ratios using a univariate ANOVA general linear model. The decrease in ratios on the lesioned side reached significance (F(1,48) = 13.676; p < 0.001), indicating that there is an overall effect of the lesion on OR expression on the lesioned-recovered side. As noted above, however, inspection of the data suggests clearly that the number of labeled cells is not consistently reduced on the lesioned-recovered side across all OR probes (Table 4), although the overall effect of probe does not reach statistical significance (F(7,48) = 1.994; p = 0.075). For example, the marked reductions in the OR107+ and OR124+ neurons are substantial, because the upper limits of the 95% confidence intervals calculated for these two probes are below the theoretical ratio of 1. In contrast, OR14 and OR37 actually label greater numbers of neurons on the lesioned-recovered side on average in this group of animals, leading to ratios greater than 1, although the confidence intervals overlap the theoretical ratio of 1. Thus, it appears that the process of recovery is not uniform for all kinds of neurons.
The overall reduction in number on the lesioned-recovered side and the apparent effect of probe on cell number between the two sides may reflect the significant degree of respiratory metaplasia, i.e., the replacement of olfactory epithelium by respiratory during the reconstitution process, that is observed in ventral and lateral portions of the OE in rats exposed to MeBr while chronically food restricted (Schwob et al., 1995, 1999; Jang et al., 2003). The extent of the metaplasia in the current group of unilaterally exposed animals was determined by staining a series of sections through the extent of the epithelium with anti-OMP (Fig. 12). In all seven of the experimental animals, the extent of OMP staining of the OE was reduced on the lesioned-recovered side relative to the unlesioned side. Thus, some parts of the lateral and ventral nasal epithelium that are demonstrably olfactory and stained with OMP on the unlesioned side are devoid of OMP+ neurons on the lesioned-recovered side (designated by the lines in the nasal cavity in Fig. 12) and are precisely the regions that are normally populated with OR107+ and OR124+ neurons. Segmentation of the images as a function of staining intensity and comparison of the total number of pixels that exceed background on the two sides (which would include both the neuronal somata in the epithelium and their axons in the fascicles in the lamina propria) demonstrated a statistically significant reduction in the OMP-labeling on the lesioned-recovered side.
It is worth noting, however, that not all of the laterally located neuron types are affected equally. I7 overlaps the distributions of 107 and 124 quite substantially (Figs. 2, 12) and is also expressed by neurons in areas of the lateral OE that are undergoing metaplasia after lesion. In contrast to OR107 and OR124, which were reduced to 67 and 75%, respectively, the group average for I7 on the lesioned-recovered side is 92% that of the unlesioned side (Table 4). The reduction seen with I7 is not significantly different from the expected ratio of 1 on the basis of a post hoc Student's t test, which stands in contrast to the significance of the reduction for OR107 and OR124 observed above with post hoc tests.
The data obtained in normal OE and in the lesioned-recovered OE are not artifacts of cross-reactivity with closely homologous ORs
The recently published comprehensive analysis of the OR gene family in mice underscores the degree of sequence identity between individual members of the gene family, which can exceed 95% (Zhang and Firestein, 2002). That degree of identity between closely related members suggests that probes that target the coding sequence likely are labeling neurons that express other, distinct ORs. We were concerned that cross-hybridization with highly related ORs might be responsible for the differences between our results and the interpretations of other investigators with respect to the nature of the spatially restricted expression of ORs (i.e., whether OR expression conforms to a limited number of tightly bounded zones). Furthermore, it is formally possible that the near restoration of the number and distribution of cells labeled by a particular probe in the lesioned-recovered OE might reflect, in part, types of neurons other than the one targeted by the probe. There have been no systematic determinations of the extent of sequence identity that results in detectable cross-hybridization, nor are there any data on the drop in intensity of the label needed to distinguish the signal emanating from the targeted OR as opposed to a closely homologous one.
To evaluate this concern, we cloned cDNAs and manufactured probes that were selective for all or part of the untranslated region of the OR message for OR14, OR18, and OR133, to take advantage of the lesser degree of sequence identity outside the coding region (Kubick et al., 1997). Indeed, taking OR14 as an example, the coding sequence matches five other members at >75% when that sequence is subjected to BLAST (Basic Local Alignment Search Tool) analysis against the rat genome, whereas the 3′UTR sequence matches only two others at 79 and 92%. The degree of identity in the UTR is less for the other two UTR probes. Accordingly, it is likely that the coding sequence probes will label a larger portion of the corresponding gene family than the UTR probes, which will necessarily be more restrictive in their labeling (although possibly not monospecific). Indeed, Southern blots comparing the labeling of digested genomic DNA with DNA probes from the full-length and 3′UTR constructs show more extensive hybridization with the full-length as opposed to the 3′UTR probe (data not shown). For all three of the rat ORs that we studied, probes directed against their respective UTRs of the mRNA generated precisely the same distribution along the circumference of the epithelium and along its AP axis as the full-length or coding sequence antisense probe. Thus, labeling with the antisense 3′UTR of OR14 was limited to the dorsal recess, dorsal septum, and the tips of the endoturbinates, as was true for the full-length probe (Fig. 10, compare A, B). Likewise, the distributions of cells labeled by UTR probes for OR18 and OR133 overlapped but not completely, as was true for the coding sequence probes. These observations held true when comparing control tissue, the unlesioned side of unilaterally exposed animals, and the lesioned-recovered epithelium. Thus, the same fundamental result emerges with either full-length or 3′UTR probes, namely that the distribution of neurons of a particular type is restored to normal or near-normal after recovery from MeBr lesion.
There were differences between full-length and 3′UTR probes in terms of the number of labeled cells. In all three cases, the number of cells labeled with the UTR probes was less than the number labeled with the full-length probes. For example, in the case of OR14, the 3′UTR probe labeled 67% as many cells as the full-length probe when assayed on adjacent sections (Fig. 10). Nonetheless, the ratio measures comparing the two sides of unilaterally lesioned animals held constant. OR14 was one for which the full-length probe labeled a slightly greater number of neurons on the lesioned-recovered side as compared with the unlesioned side (Figs. 10, 11). That relative increase on the lesioned-recovered side was also observed in counts of sections labeled with the 3′UTR probe. Thus, it appears that many of the full-length probes, and perhaps all of them, do cross-hybridize under these conditions. Cross-hybridization to closely related family members does not materially influence the interpretation of the results, however, because the boundaries of the expression domains, the AP extent, and the relative number of labeled cells are all the same on the two sides of the experimental animals with either form of probe.
We conclude that 3 months after MeBr exposure, OR-positive OSNs (1) maintain their respective circumferential expression patterns but (2) may vary in terms of total cell counts.
Discussion
Two major results emerge from the work presented here. First, OR expression is restored to a remarkable extent after recovery from unilateral MeBr lesion for all eight probes in our panel. The overall pattern of OR expression is restored to normal or near normal with respect to all three measures assayed: spatially restricted expression around the circumference of the OE in the coronal plane, numbers of OSNs expressing a particular OR, and their distribution along the AP axis of the epithelium. Second, the patterns of spatial segregation of OR expression in the normal epithelium cannot be reduced to the conventionally asserted model describing three or four zones. The implications of each of the major results will be discussed, beginning with the expression of ORs in normal epithelium.
OR-positive OSN distribution patterns in normal OE
The model whereby OR genes are expressed in OSNs that are randomly scattered throughout one of three or four zones with no evidence of clusters, gradients, or cross-zonal overlap (Strotmann et al., 1992, 1994a,b, 1996, 2000; Ressler et al., 1993; Vassar et al., 1993; Sullivan et al., 1996) cannot be reconciled with the data presented here. Our findings certainly confirm the notion that OR expression is spatially segregated and that the sectors for each OR are disposed in roughly concentric swathes of epithelium centered on the dorsal recess; however, our data suggest that OR genes are expressed in a large number of overlapping bands rather than tightly bounded zones (Fig. 13). Thus, each member of our OR panel partially overlaps with at least one, and generally more than one, other member. As a consequence, our classification of ORs as being expressed in dorsomedial epithelium, lateral epithelium, or areas in between is only approximate and does not imply any sharp boundary between ORs that are concentrated in different areas. For example, the ORs that are expressed in the “in between” area—OR18, OR133/F12, and OR107—are neither expressed coextensively nor reducible to conventional zonal assignments, particularly OR107, which is concentrated in the lateral epithelium. Conversely, we also find a gap between OR14 (expressed dorsomedially) and OR18 at anterior but not posterior levels of the epithelium; none of the members of our panel label OSNs in that particular sector of the epithelium, which is also inconsistent with the conventional formulation. We have no reason to doubt that other ORs, as yet unidentified, are expressed in this “negative” region. Moreover, we find that the OR14+ OSNs are reduced in density where OR14 overlaps the OR37 territory on the tips of the dorsal turbinates, which is also an exception to the three-four-zone model. Finally, the members of the OR37 subfamily themselves do not fit into the conventional model. Left open is the possibility that other “unique” subfamilies may also exist. Although our interpretations are different from the conventional one, our data are substantially the same. For example, we show, like Vassar et al. (1993), that OR133/F12 occupies a zone dorsal and complementary to that for I7. Furthermore, the data in the paper that first postulates the existence of four zones actually show substantial overlap between probes that are ostensibly in different zones (Sullivan et al., 1996).
Figure 13.

A comparison between the conventional four-zone model and the labeling observed with the panel of eight OR probes. The territories for each of the eight probes is shown only along the septal epithelium, except for OR 37, expression of which is limited to the mucosa on the tips of the turbinates (dorsal is to the left). The boundaries for the four zones are transposed from the published patterns of labeling of the mouse epithelium used to develop the four-zone model in relation to the various turbinates (Sullivan et al., 1996). In particular, the ventral boundary for zone 1 is aligned with the boundary between high and low expression levels of the Ig-CAM superfamily member, OCAM/mamFasII, which has been described previously (Yoshihara et al., 1997). OR14 labeling extends into the epithelial region in which OCAM/mamFasII is highly expressed (H. Fang and J. E. Schwob, unpublished observations).
Because each of our probes contains a coding sequence that is highly homologous between the targeted OR and other closely related members of the OR gene family, our probes are likely to cross-hybridize to these family members, as suggested previously (Vassar et al., 1993). Indeed, we demonstrated that such cross-hybridization occurs by comparing the labeling obtained with the entire coding sequence versus that seen when using probes targeted to the less homologous, untranslated region of the OR message. Nonetheless, it is unlikely that such cross-hybridization is responsible for the discrepancies between our results and the usual formulation. If a riboprobe cross-hybridized with other than its own OR, and if the cross-hybridizing OR was expressed in another one of the conventionally described zones, then the labeling pattern would necessarily extend throughout the incorrect zone; i.e., the territory covered by any single probe would fill two of the previously defined zones and occupy close to one-half of the circumference of the epithelium. We observed no such labeling pattern. Furthermore, our observations with the UTR probes for OR14, OR18, and OR133 indicate that the territory in which cross-hybridizing ORs are expressed is coextensive with that occupied by the reference OR, which has also been shown for the OR37 subfamily of ORs (Kubick et al., 1997; Strotmann et al., 1999; Pyrski et al., 2001). Given that coding sequence-containing probes hybridize to a detectable level only with ORs that share substantial sequence identity, it seems likely that members of the same OR subfamilies generally share the same territory, which was an interpretation offered previously (Vassar et al., 1993).
Previous research has defined the presence of a sharp boundary between the dorsomedial epithelium and the ventrolateral epithelium via the expression of the Ig superfamily member olfactory cell adhesion molecule/mammalian homolog 6 fasciclin II (OCAM/mamFas II) or anonymous antigens such as that recognized by the monoclonal antibody CC2 (Schwob and Gottlieb, 1986, 1988; Schwarting and Crandall, 1991; Miyawaki et al., 1996; Yoshihara et al., 1997; Norlin et al., 2001). Our results do not contradict the existence of a boundary delimited by differential expression of these markers; however, we do find that the some of the ORs cross this boundary as well. For example, OR14, although concentrated dorsally, does overlap the ventrolateral region defined by high-level OCAM/mamFas II expression (H. Fang and J. E. Schwob, unpublished data), which may account for those glomeruli that show an intermediate level of staining with antibodies directed against this cell adhesion molecule (Schwob and Gottlieb, 1986).
Our reinterpretation of the OR expression data has several important implications. First, patterns of odorant-evoked intrinsic activity across the mammalian epithelium are characterized by hotspots, the positions of which do not fit the conventional three- or four-zone model (Mackay-Sim and Kesteven, 1994; Youngentob and Kent, 1995; Youngentob et al., 1995; Kent et al., 1996). The location of the hotspots is better accommodated with the model presented here, because the units of OR expression (i.e., bands) are more numerous than four, and the widths of the various bands occupied by the various ORs are not necessarily the same around the circumference of the epithelium (e.g., OR14 vs OR16 and OR107 vs I7 vs OR124). Second, our model has implications for the mechanism that establishes the spatially restricted territories. The four-zone model requires the establishment of multiple, sharply delimited boundaries. The steady shifting in the position of the expression territory could be accommodated by a gradient mechanism around the circumference of the epithelium. The distinction is not trivial, because molecules that are purported to match the conventional zonal boundaries have been proposed as candidate participants in the process of zone formation (Norlin et al., 2001).
Restoration of OR-positive OSN distribution patterns in lesion-recovered OE
The experiments presented here demonstrate that the patterns of OR expression are restored after the recovery from peripheral injury. In particular, the distribution of OR expression around the circumference of the epithelium on the lesioned-recovered side was indistinguishable from the unexposed side or control epithelium for each of the probes. The potential for cross-hybridization that exists for each of the probes raises the formal possibility that the recovery of the pattern reflects closely related ORs rather than the one being specifically targeted by the probe. That the pattern is the same with UTR-directed probes as with the coding-sequence probes and the same on both sides of the unilaterally exposed animals tends to diminish that concern.
Some features of the distribution are not fully recovered as compared with the normal or unlesioned epithelium. The number of probe-positive neurons is slightly down overall on the lesioned-recovered side, which probably reflects the transformation of a significant fraction of olfactory epithelium to respiratory in far lateral and anterior areas after MeBr lesion; however, the decrease in number differs across the group of probes, even those with territories that overlap in the regions at risk for respiratory metaplasia. Indeed, some may even be substantially, consistently higher on the lesioned side as opposed to the unlesioned side. The differences across probes raise the question regarding whether some aspects of sensory experience, or other feature of the environment after lesion, may influence the recovery process and alter the balance between different OR populations. For example, the specificity of glomerular targeting is compromised during the recovery after MeBr lesion (Schwob et al., 1999; Carr et al., 2004; C. L. Iwema, G. Ring, and J. E. Schwob, unpublished observations). As a consequence, it seems likely that multiple types of ORs contact the same glomerulus during reinnervation of the bulb that follows MeBr lesion. Given that inactive neurons are at an apparent disadvantage relative to active neurons in holding on to glomerular territory in some settings (Zhao and Reed, 2001), the differences in relative recovery across probes may be a manifestation of the dependence of olfactory neurons on trophic support from the bulb (Schwob et al., 1992) and, in turn, an influence of sensory experience during reinnervation on the competition between classes of neurons for glomerular territory.
Implications
Our major conclusion is that the patterns of OR expression recover to a remarkable extent after MeBr-induced damage to the epithelium with respect to circumferential expression patterns, cell count, and AP localization within the rat OE. Therefore, severely damaged OE retains the capacity to specify the distribution of OR-positive OSNs. That the stem and progenitor populations retain some form of prespecification with respect to OR choice is an attractive but completely speculative notion, and other alternatives are imaginable. Population size may also be subject to experiential influences. Our results suggest that the abnormalities in sensory coding that are observed after recovery from severe peripheral injury are not caused by insufficient or incorrect reconstitution of the various kinds of OSNs, as defined by OR expression. Rather, a more central locus for the abnormalities is likely, such as the mistargeting of an OR-defined type of neuron to incorrect glomeruli that does occur after severe lesion (Schwob et al., 1999; Schwob, 2002).
Footnotes
This work was supported by a grant from the National Institutes of Health-National Institute on Deafness and Other Communication Disorders (R01 DC00467) to J.E.S. We thank Drs. Heinz Breer and Linda Buck for their generous gifts of the OR probes. We also thank Dr. Frank Margolis for his kind gift of the anti-OMP antiserum. Finally, we thank Dr. Peggy Harris for her assistance with cloning and in situ hybridization.
Correspondence should be addressed to Dr. James E. Schwob, Department of Anatomy and Cellular Biology, Tufts University School of Medicine, 136 Harrison Avenue, Boston, MA 02111. E-mail: jim.schwob@tufts.edu.
Copyright © 2004 Society for Neuroscience 0270-6474/04/240356-14$15.00/0
References
- Belluscio L, Katz LC (2001) Symmetry, stereotypy, and topography of odorant representations in mouse olfactory bulbs. J Neurosci 21: 2113-2122. [DOI] [PMC free article] [PubMed] [Google Scholar]
- Buck L, Axel R (1991) A novel multigene family may encode odorant receptors: a molecular basis for odor recognition. Cell 65: 175-187. [DOI] [PubMed] [Google Scholar]
- Carr V McM, Ring G, Youngentob SL, Schwob JE, Farbman AI (2004) Altered epithelial density and expansion of bulbar projections of a discrete HSP70 immunoreactive subpopulation of rat olfactory receptor neurons in reconstituting olfactory epithelium following exposure to methyl bromide. J Comp Neurol, in press. [DOI] [PubMed]
- Chess A, Simon I, Cedar H, Axel R (1994) Allelic inactivation regulates olfactory receptor gene expression. Cell 78: 823-834. [DOI] [PubMed] [Google Scholar]
- Costanzo RM (1991) Regeneration of olfactory receptor cells. Ciba Found Symp 160: 233-242. [DOI] [PubMed] [Google Scholar]
- Graziadei PPC, Monti Graziadei GA (1985) Neurogenesis and plasticity of the olfactory sensory neurons. Ann NY Acad Sci 457: 127-142. [DOI] [PubMed] [Google Scholar]
- Hurtt ME, Morgan KT, Working PK (1987) Histopathology of acute toxic responses in selected tissues from rats exposed by inhalation to methyl bromide. Fund Appl Toxicol 9: 352-365. [DOI] [PubMed] [Google Scholar]
- Hurtt ME, Thomas DA, Working PK, Monticello TM, Morgan KT (1988) Degeneration and regeneration of the olfactory epithelium following inhalation exposure to methyl bromide: pathology, cell kinetics, and olfactory function. Toxicol Appl Pharmacol 94: 311-328. [DOI] [PubMed] [Google Scholar]
- Iwema CI, Schwob JE (2003) Odorant receptor expression as a function of neuronal maturity in the adult rodent olfactory system. J Comp Neurol 459: 209-222. [DOI] [PubMed] [Google Scholar]
- Jang W, Youngentob SL, Schwob JE (2003) Globose basal cells are required for reconstitution of olfactory epithelium after methyl bromide lesion. J Comp Neurol 460: 123-140. [DOI] [PMC free article] [PubMed] [Google Scholar]
- Johnson BA, Woo CC, Leon M (1998) Spatial coding of odorant features in the glomerular layer of the rat olfactory bulb. J Comp Neurol 393: 457-471. [DOI] [PubMed] [Google Scholar]
- Johnson BA, Ho SL, Xu Z, Yihan JS, Yip S, Hingco EE, Leon M (2002) Functional mapping of the rat olfactory bulb using diverse odorants reveals modular responses to functional groups and hydrocarbon structural features. J Comp Neurol 449: 180-194. [DOI] [PubMed] [Google Scholar]
- Kent PF, Mozell MM, Murphy SJ, Hornung DE (1996) The interaction of imposed and inherent olfactory mucosal activity patterns and their composite representation in a mammalian species using voltage-sensitive dyes. J Neurosci 16: 345-353. [DOI] [PMC free article] [PubMed] [Google Scholar]
- Konzelmann S, Saucier D, Strotmann J, Breer H, Astic L (1998) Decline and recovery of olfactory receptor expression following unilateral bulbectomy. Cell Tissue Res 294: 421-430. [DOI] [PubMed] [Google Scholar]
- Kubick S, Strotmann J, Andreini I, Breer H (1997) Subfamily of olfactory receptors characterized by unique structural features and expression patterns. J Neurochem 69: 465-475. [DOI] [PubMed] [Google Scholar]
- Mackay-Sim A, Kesteven S (1994) Topographic patterns of responsiveness to odorants in the rat olfactory epithelium. J Neurophysiol 71: 150-160. [DOI] [PubMed] [Google Scholar]
- Malnic B, Hirono J, Sato T, Buck LB (1999) Combinatorial receptor codes for odors. Cell 96: 713-723. [DOI] [PubMed] [Google Scholar]
- Meister M, Bonhoeffer T (2001) Tuning and topography in an odor map on the rat olfactory bulb. J Neurosci 21: 1351-1360. [DOI] [PMC free article] [PubMed] [Google Scholar]
- Miyawaki A, Homma H, Tamura H, Matsui M, Mikoshiba K (1996) Zonal distribution of sulfotransferase for phenol in olfactory sustentacular cells. EMBO J 15: 2050-2055. [PMC free article] [PubMed] [Google Scholar]
- Mombaerts P, Wang F, Dulac C, Chao SK, Nemes A, Mendelsohn M, Edmondson J, Axel R (1996) Visualizing an olfactory sensory map. Cell 87: 675-686. [DOI] [PubMed] [Google Scholar]
- Norlin EM, Alenius M, Gussing F, Hagglund M, Vedin V, Bohm S (2001) Evidence for gradients of gene expression correlating with zonal topography of the olfactory sensory map. Mol Cell Neurosci 18: 283-295. [DOI] [PubMed] [Google Scholar]
- Pyrski M, Xu Z, Walters E, Gilbert DJ, Jenkins NA, Copeland NG, Margolis FL (2001) The OMP-lacZ transgene mimics the unusual expression pattern of OR-Z6, a new odorant receptor gene on mouse chromosome 6: implication for locus-dependent gene expression. J Neurosci 21: 4637-4648. [DOI] [PMC free article] [PubMed] [Google Scholar]
- Ressler KJ, Sullivan SL, Buck LB (1993) A zonal organization of odorant receptor gene expression in the olfactory epithelium. Cell 73: 597-609. [DOI] [PubMed] [Google Scholar]
- Ressler KJ, Sullivan SL, Buck LB (1994) Information coding in the olfactory system: evidence for a stereotyped and highly organized epitope map in the olfactory bulb. Cell 79: 1245-1255. [DOI] [PubMed] [Google Scholar]
- Schwarting GA, Crandall JE (1991) Subsets of olfactory and vomeronasal sensory epithelial cells and axons revealed by monoclonal antibodies to carbohydrate antigens. Brain Res 547: 239-248. [DOI] [PubMed] [Google Scholar]
- Schwob JE (2002) Neural regeneration and the peripheral olfactory system. Anat Rec 269: 33-49. [DOI] [PubMed] [Google Scholar]
- Schwob JE, Gottlieb DI (1986) The primary olfactory projection has two chemically distinct zones. J Neurosci 6: 3393-3404. [DOI] [PMC free article] [PubMed] [Google Scholar]
- Schwob JE, Gottlieb DI (1988) Purification and characterization of an antigen that is spatially segregated in the primary olfactory projection. J Neurosci 8: 3470-3480. [DOI] [PMC free article] [PubMed] [Google Scholar]
- Schwob JE, Youngentob SL (2001) Reinnervation of the olfactory bulb and functional capacity after recovery from lesions of the olfactory epithelium. Chem Senses 26: 732. [Google Scholar]
- Schwob JE, Szumowski KE, Stasky AA (1992) Olfactory sensory neurons are trophically dependent on the olfactory bulb for their prolonged survival. J Neurosci 12: 3896-3919. [DOI] [PMC free article] [PubMed] [Google Scholar]
- Schwob JE, Youngentob SL, Mezza RC (1995) Reconstitution of the rat olfactory epithelium after methyl bromide-induced lesion. J Comp Neurol 359: 15-37. [DOI] [PubMed] [Google Scholar]
- Schwob JE, Youngentob SL, Ring G, Iwema CL, Mezza RC (1999) Reinnervation of the rat olfactory bulb after methyl bromide-induced lesion: timing and extent of reinnervation. J Comp Neurol 412: 439-457. [DOI] [PubMed] [Google Scholar]
- Strotmann J, Wanner I, Krieger J, Raming K, Breer H (1992) Expression of odorant receptors in spatially restricted subsets of chemosensory neurones. NeuroReport 3: 1053-1056. [DOI] [PubMed] [Google Scholar]
- Strotmann J, Wanner I, Helfrich T, Beck A, Meinken C, Kubick S, Breer H (1994a) Olfactory neurones expressing distinct odorant receptor subtypes are spatially segregated in the nasal neuroepithelium. Cell Tissue Res 276: 429-438. [DOI] [PubMed] [Google Scholar]
- Strotmann J, Wanner I, Helfrich T, Beck A, Breer H (1994b) Rostro-caudal patterning of receptor-expressing olfactory neurones in the rat nasal cavity. Cell Tissue Res 278: 11-20. [DOI] [PubMed] [Google Scholar]
- Strotmann J, Konzelmann S, Breer H (1996) Laminar segregation of odorant receptor expression in the olfactory epithelium. Cell Tissue Res 284: 347-354. [DOI] [PubMed] [Google Scholar]
- Strotmann J, Hoppe R, Conzelmann S, Feinstein P, Mombaerts P, Breer H (1999) Small subfamily of olfactory receptor genes: structural features, expression pattern and genomic organization. Gene 236: 281-291. [DOI] [PubMed] [Google Scholar]
- Strotmann J, Conzelmann S, Beck A, Feinstein P, Breer H, Mombaerts P (2000) Local permutations in the glomerular array of the mouse olfactory bulb. J Neurosci 20: 6927-6938. [DOI] [PMC free article] [PubMed] [Google Scholar]
- Sullivan SL, Adamson MC, Ressler KJ, Kozak CA, Buck LB (1996) The chromosomal distribution of mouse odorant receptor genes. Proc Natl Acad Sci USA 93: 884-888. [DOI] [PMC free article] [PubMed] [Google Scholar]
- Uchida N, Takahashi YK, Tanifuji M, Mori K (2000) Odor maps in the mammalian olfactory bulb: domain organization and odorant structural features. Nat Neurosci 3: 1035-1043. [DOI] [PubMed] [Google Scholar]
- Vassar R, Ngai J, Axel R (1993) Spatial segregation of odorant receptor expression in the mammalian olfactory epithelium. Cell 74: 309-318. [DOI] [PubMed] [Google Scholar]
- Vassar R, Chao SK, Sitcheran R, Nunez JM, Vosshall LB, Axel R (1994) Topographic organization of sensory projections to the olfactory bulb. Cell 79: 981-991. [DOI] [PubMed] [Google Scholar]
- Wang F, Nemes A, Mendelsohn M, Axel R (1998) Odorant receptors govern the formation of a precise topographic map. Cell 93: 47-60. [DOI] [PubMed] [Google Scholar]
- Yoshihara Y, Kawasaki M, Tamada A, Fujita H, Hayashi H, Kagamiyama H, Mori K (1997) OCAM: a new member of the neural cell adhesion molecule family related to zone-to-zone projection of olfactory and vomeronasal axons. J Neurosci 17: 5830-5842. [DOI] [PMC free article] [PubMed] [Google Scholar]
- Youngentob SL, Kent PF (1995) Enhancement of odorant-induced mucosal activity patterns in rats trained on an odorant identification task. Brain Res 670: 82-88. [DOI] [PubMed] [Google Scholar]
- Youngentob SL, Schwob JE (1997) Changes in odorant quality perception following methyl bromide induced lesions of the olfactory epithelium. Chem Senses 22: 830-831. [DOI] [PubMed] [Google Scholar]
- Youngentob SL, Kent PF, Sheehe PR, Schwob JE, Tzoumaka E (1995) Mucosal inherent activity patterns in the rat: evidence from voltage-sensitive dyes. J Neurophysiol 73: 387-398. [DOI] [PubMed] [Google Scholar]
- Zhang X, Firestein S (2002) The olfactory receptor superfamily of the mouse. Nat Neurosci 5: 124-133. [DOI] [PubMed] [Google Scholar]
- Zhao H, Reed RR (2001) X inactivation of the OCNC1 channel gene reveals a role for activity-dependent competition in the olfactory system. Cell 104: 651-660. [DOI] [PubMed] [Google Scholar]