

Abstract
Disruptions in intracellular Ca2+ signaling are proposed to underlie the pathophysiology of Alzheimer's disease (AD), and it has recently been shown that AD-linked mutations in the presenilin 1 gene (PS1) enhance inositol triphosphate (IP3)-mediated Ca2+ liberation in nonexcitable cells. However, little is known of these actions in neurons, which are the principal locus of AD pathology. We therefore sought to determine how PS1 mutations affect Ca2+ signals and their subsequent downstream effector functions in cortical neurons. Using whole-cell patch-clamp recording, flash photolysis, and two-photon imaging in brain slices from 4-5-week-old mice, we show that IP3-evoked Ca2+ responses are more than threefold greater in PS1M146V knock-in mice relative to age-matched nontransgenic controls. Electrical excitability is thereby reduced via enhanced Ca2+ activation of K+ conductances. Action potential-evoked Ca2+ signals were unchanged, indicating that PS1M146V mutations specifically disrupt intracellular Ca2+ liberation rather than reduce cytosolic Ca2+ buffering or clearance. Moreover, IP3 receptor levels are not different in cortical homogenates, further suggesting that the exaggerated cytosolic Ca2+ signals may result from increased store filling and not from increased flux through additional IP3-gated channels. Even in young animals, PS1 mutations have profound effects on neuronal Ca2+ and electrical signaling: cumulatively, these disruptions may contribute to the long-term pathophysiology of AD.
Keywords: Alzheimer, calcium [Ca], cortex, imaging, patch clamp, pyramidal, inositol triphosphate
Introduction
Inositol triphosphate (IP3) is a ubiquitous second messenger that functions by binding to receptors (IP3Rs) on the endoplasmic reticulum (ER) membrane to cause liberation of sequestered Ca2+ (Berridge, 1998, 2002). The resultant cytosolic Ca2+ transients serve numerous signaling functions in neurons, including modulation of membrane excitability (Yamamoto et al., 2002; Stutzmann et al., 2003), synaptic plasticity (Fujii et al., 2000; Miyata et al., 2000; Nishiyama et al., 2000), and gene expression (Mellstrom and Naranjo, 2001). Moreover, disruptions in this pathway are implicated in Alzheimer's disease (AD) and other neurodegenerative disorders (Abe, 1997; Mattson et al., 2000; LaFerla, 2002). Therefore, factors that modulate or disrupt IP3-mediated Ca2+ signaling are expected to exert powerful physiological and possibly pathological effects on the nervous system.
Among the proteins known to modulate IP3-mediated Ca2+ liberation, recent attention has focused on presenilin 1 (PS1), an ER-localized transmembrane protein required for the proteolysis of amyloid precursor protein (APP) (Selkoe, 2001). Mutant forms of the presenilin 1 (PS1) gene, which account for the majority of early-onset AD cases (Campion et al., 1995; Selkoe, 2001), have been shown to enhance Ca2+ transients in various isolated cell systems that include transfected PC12 cells (Guo et al., 1996), fibroblasts from human familial AD patients (Ito et al., 1994; Hirashima et al., 1996), mutant PS1 knock-in (PS1KI) mouse fibroblasts (Leissring et al., 2000), cultured hippocampal neurons (Guo et al., 1999b), and oocytes overexpressing mutant PS1 (Leissring et al., 1999). Moreover, PS1 mutations have been shown to alter neuronal functions, including increased susceptibility to toxicity (Guo et al., 1999b, Grilli et al., 2000) and facilitation of long-term potentiation in hippocampal slices (Parent et al., 1999; Barrow et al., 2000; Oddo et al., 2003).
Taken together, these data lend strong support to the proposal that disruptions of Ca2+ signaling contribute to the pathogenesis of AD (Khachaturian, 1994; Leissring et al., 1999; Mattson and Chan, 2001; LaFerla, 2002). However, because of technical limitations, previous work has primarily been restricted to cultured cell systems and nonexcitable cells. To validate the involvement of Ca2+ signaling in AD and elucidate the underlying mechanisms, it is crucial to extend these studies to cortical neurons that have developed normally in an intact brain. We addressed this issue using a combination of video-rate two-photon microscopy, flash photolysis of caged IP3, and whole-cell electrophysiology (Nguyen et al., 2001; Stutzmann et al., 2003) to image Ca2+ signals and record corresponding changes in membrane excitability in layer V projection neurons in slices of mouse brain frontal cortex. Neurons from knock-in mice expressing a mutant form of PS1 (PS1M146V) showed appreciably larger (more than threefold) Ca2+ signals and membrane potential responses to photoreleased IP3 than did age-matched nontransgenic (non-tg) animals, and the proportion of neurons responding to IP3 was substantially greater. These actions were restricted to IP3-sensitive ER Ca2+ stores and did not involve changes in voltage-gated Ca2+ influx or cytosolic Ca2+ buffering, supporting a role for a specific IP3-sensitive Ca2+ signaling disruption in the pathogenesis of AD.
Materials and Methods
Transgenic mice and slice preparation. The derivation and characterization of the PS1M146V knock-in (PS1KI) mice and the nontransgenic (non-tg) controls have been described previously (Guo et al., 1999a). The PS1KI mice express the targeted allele at normal physiological levels in the absence of endogenous PS1 but do not show an overt neuropathology. Age-matched (4-5 week postnatal) non-tg control mice were of the same background strain (C57BL/6). Brain slices were prepared as described (Stutzmann et al., 2003), in adherence with protocols approved by the University of California Irvine Institutional Animal Care and Use Committee. Briefly, mice were deeply anesthetized with halothane and decapitated. The brains were quickly removed and placed in ice-cold artificial CSF (aCSF) containing (in mm): 125 NaCl, 2.5 KCl, 1.25 NaH2PO4, 10 d-glucose, 25 NaHCO3, 2 CaCl2, 1.2 MgSO4, pH 7.3-7.4, bubbled with 95%O2/5% CO2. Slices (300 μm) were cut from coronal sections containing the prefrontal cortex using a Vibroslice (Camden Instruments). The aCSF was bubbled with 95% O2/5% CO2 and superfused at room temperature (22-24°C) at a flow rate of ∼3 ml/min.
Whole-cell recordings and solutions. Visualized whole-cell patch-clamp recordings were performed using an infrared-differential interference contrast (IR-DIC) setup. Patch pipettes (3-4 MΩ) were filled with intracellular solution containing (in mm): 135 K-methlysulfonate, 10 HEPES, 10 Na-phosphocreatine 10, 2 MgCl2, 4 NaATP, and 0.4 NaGTP (pH adjusted to 7.3-7.4 with KOH), as well as 50 μm fura-2 (Molecular Probes, Eugene, OR) and 10 μm caged IP3 (Molecular Probes). Signals were acquired at 1 kHz using an Axopatch 1C amplifier and analyzed using Clampex 8.1 and Clampfit 8.1 software (Axon Instruments, Union City, CA).
Ca2+ imaging and flash photolysis. Imaging was performed using a custom-made video-rate two-photon microscope, as described (Nguyen et al., 2001). In brief, excitation was provided by trains (80 MHz) of ultra-short (∼100 fsec) pulses at 780 nm from a Ti:sapphire laser (Tsunami; Spectra-Physics, Mountain View, CA). The laser beam was scanned at a frame-scan rate of 30 frames per second and focused onto the specimen through a 40× water-immersion objective (numerical aperture = 0.8). Emitted fluorescence light was detected by a wide-field photomultiplier to derive a video signal that was captured and analyzed by the MetaMorph package (Universal Imaging, West Chester, PA). For clarity, images and traces of fura-2 fluorescence are expressed as inverse pseudo-ratios: F0/ΔF or F0/F (F is the fluorescence at any given pixel and time, F0 is the average resting fluorescence at that pixel before stimulation, and ΔF is the decrease of fluorescence on stimulation), so that increases in [Ca2+] correspond to increasing ratios. Ratio values in the present experiments appeared well below dye saturation levels. Most cells showed peak F0/ΔF values <2.5, whereas maximum values >5.0 were seen in response to strong stimuli. Data are expressed as mean ± 1 SEM, and statistical comparisons were made using a two-tailed t test with 5% confidence interval for normally distributed data, or χ2 tests for nonparametric data.
Photolysis of caged IP3 was accomplished by flashes of UV light (340-400 nm) derived from a 100 W Hg arc lamp coupled to an electronically controlled shutter (Uniblitz). The irradiance at the specimen was ∼50 mW/mm-2, focused as a uniform circle (radius ∼50 μm) centered on the imaging field. Stimulus strength was regulated by the flash duration. On the basis of previous calibration (Parker and Ivorra, 1992), a flash of 10 msec duration would photolyse ∼4% of the total caged IP3, resulting in an intracellular concentration of free IP3 of ∼0.4 μm.
Immunoblot analysis. Detailed Western blot methodology has been described previously (Oddo et al., 2003). Cortical layers from PSIKI and non-tg control mice were homogenized in a solution of 50 mm Tris, pH 8.0, in purified water containing 0.7 mg/ml Pepstatin A supplemented with a complete Mini protease inhibitor tablet (Roche 1836153). The soluble fraction of the supernatant was saved, and the pellet was spun again in a solution of 10 mm Tris, pH 7.5, 150 mm NaCl, and 2% Triton plus 0.7 mg/ml Pepstatin A in H20 again at 100,000 × g for 1 hr at 4°C. Proteins in the supernatant and membrane fractions were resolved by SDS-PAGE (10% bis-Tris, 10% Tris-glycine; Invitrogen) under reducing conditions and transferred to nitrocellulose membrane. The membrane was incubated in a 5% solution of nonfat milk for 1 hr at 20°C. After overnight incubation with primary antibody, the blots were washed in Tween TBS and incubated at 20°C with secondary antibody. Protein extracts were monitored by quantitative immunoblotting. Four samples were analyzed for each group, and all samples were normalized to β-actin. Antibody sources and dilutions are as follows: anti-calsenilin (1:100) (Zymed Laboratories Inc.), anti-calbindin (1:5000) (Chemicon), anti-IP3 against all receptor subtypes (1:200) (Sigma), and anti-SERCA 2b (1:45,000). Secondary antibodies were obtained from Sigma (anti-rabbit 1:20,000 and anti-mouse 1:50,000).
Results
Ca2+ signals were imaged from both non-tg and PS1KI mice (n = 28 and 25 neurons, respectively). Neurons in the medial prefrontal cortex were studied because of their importance in cognitive functions (Goldman-Rakic, 1995; Rainer et al., 1998) and their vulnerability in AD-related cognitive decline and aging (Pearson et al., 1985; Grill and Riddle, 2002; Bussiere et al., 2003). Moreover, we had previously characterized the physiological dynamics of IP3-Ca2+ signaling in these cells (Stutzmann et al., 2003). Records were obtained from cells in non-tg and PS1KI mice that showed electrophysiological properties characteristic of regularly spiking pyramidal neurons (McCormick et al., 1985), with respective resting membrane potentials of -63.6 ± 1.08 and -65.6 ± 1.4 mV and input resistances of 216.7 ± 11.7 and 186 ± 12.1 MΩ (differences not statistically significant).
Enhanced IP3-evoked Ca2+ signals in neurons expressing PS1 mutations
Neurons were loaded with fura-2 (50 μm) and caged IP3 (10 μm) via the whole-cell pipette, and flashes of UV light of varying duration were applied to photorelease IP3. This approach allowed us to directly control [IP3] within a single cell, thereby circumventing ambiguities associated with the application of Gq-coupled agonists. The resulting Ca2+ transients were monitored from the soma (excluding nucleus) and proximal apical dendrite (Stutzmann et al., 2003). Because fura-2 shows a decrease in fluorescence with increasing [Ca2+] with two-photon excitation at 780 nm, images and measurements are presented as a pseudo-ratio (F0/F and F0/ΔF; see Materials and Methods) so that increasing cytosolic free [Ca2+] corresponds to an increasing ratio.
Ca2+ signals in representative neurons from age-matched (4-5 week) non-tg and PS1KI mice are illustrated in Figure 1, demonstrating some of the key similarities and differences in Ca2+ signaling between these groups. Photorelease of IP3 with all flash durations tested (7-100 msec, 50 mW/mm-2) resulted in a markedly larger Ca2+ response in the PS1KI neuron when compared with the non-tg neuron. However, spike-evoked Ca2+ transients during spike trains (100 pA depolarizing current for 500 msec; n = 5-6 spikes) were of similar amplitude, despite the difference in IP3-evoked responses. Different than the somatic localization of IP3-evoked Ca2+ transients, signals resulting from Ca2+ influx through voltage-gated plasma membrane channels were larger in the proximal dendrite than in the soma.
Figure 1.
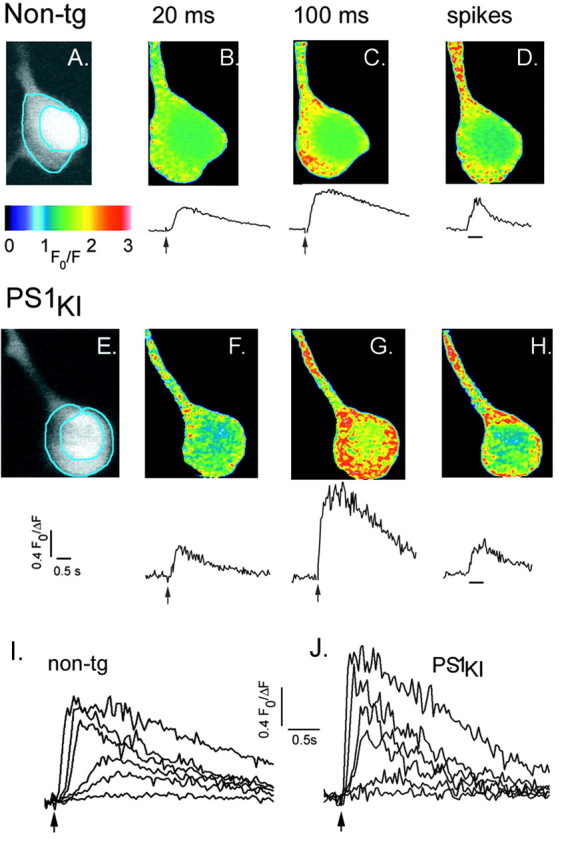
Ca2+ signals evoked by flash photorelease of IP3 and by trains of action potentials in strongly responding non-tg and PS1KI cortical neurons. A, Two-photon image showing resting fluorescence of a non-tg neuron loaded with fura-2. The annular region (excluding nucleus) from which Ca2+ measurements were taken is outlined in blue. B, C, Images and corresponding Ca2+ transients evoked by photolysis flashes with respective durations of 20 and 100 msec. Images show fluorescence ratios (F/ΔF) and are pseudocolored so that increasing ratios (increasing free [Ca2+]) are depicted by increasingly “warm” colors. Each ratio image was formed from ∼10 averaged video frames during stimulation and ∼20 averaged control frames. Traces show measurements of fura-2 fluorescence ratios from the region marked in A. Photolysis flashes were delivered when marked by the arrows. D, Ca2+ transients in the same neuron resulting from a train of action potentials evoked by depolarizing current injection (100 nA, 500 msec). E-H, Corresponding images and traces in a PS1KI neuron. I, Superimposed traces show fluorescence ratio signals in the soma of a non-tg cortical neuron, in response to photolysis flashes with durations of 7, 10, 15, 30, 50, and 100 msec. J, Similar traces from a PS1KI neuron obtained using the same flash durations.
Figure 2A shows a scatter plot of amplitudes of IP3-evoked Ca2+ responses from individual neurons (PS1KI, n = 14; non-tg, n = 15) evoked by a range of flash durations. For each flash duration, the proportion of cells showing Ca2+ responses was greater in the PS1KI mice, and the average responses were larger. Pooled data derived from all of these neurons are plotted in Figure 2, B and C. Both the non-tg and PS1KI neurons displayed a characteristic nonlinear dependence of Ca2+ signal amplitude on [IP3] (Stutzmann et al., 2003), with a similar threshold flash duration required to evoke detectable signals (Fig. 2B). In contrast to this marked enhancement of IP3-evoked Ca2+ signals in the soma, Ca2+ signals elicited by action potential trains (500 msec, 0.1 nA) were only slightly enhanced in PS1KI neurons (by 22 and 6% in the soma and dendrite, respectively; differences not statistically significant). Across all flash durations, the PS1KI neurons on average gave larger responses than non-tg neurons at all suprathreshold flash durations, with the potentiation being greatest (372%) for strong (50 msec) flashes (Fig. 2C). The IP3-evoked Ca2+ signals in the proximal dendrites were also enhanced in the PS1KI cells with moderate to long flash durations, whereas the spike-evoked signals were unchanged (Fig. 2D).
Figure 2.

Enhancement of IP3-evoked Ca2+ signals in PS1KI neurons. Data in this figure were derived by pooling measurements from all neurons examined (i.e., including nonresponding and weakly responding cells). A, Distribution of IP3-Ca2+ responses evoked by photolysis flashes with durations of 10, 20, 50, and 100 msec. Filled symbols (non-tg, gray; PS1KI, black) are measurements from individual neurons; corresponding means and SE are shown as open symbols. B, Mean peak amplitude of fluorescence signals from the soma measured from non-tg (open circles; n = 15) and PS1KI neurons (filled squares; n = 14) and plotted as a function of flash duration. Amplitudes of Ca2+ signals evoked by trains of action potentials are shown at the right. Error bars indicate 1 SEM. C, Bar graph showing average peak amplitudes of IP3-evoked Ca2+ responses in PS1KI neurons as a percentage of that in non-tg neurons at corresponding flash durations. Data for action potential-evoked signals are shown at the right. D, Mean peak amplitude of fluorescence signals from the proximal apical dendrite measured from non-tg (open circles; n = 11) and PS1KI neurons (filled squares; n = 13).
PS1 mutation alters the distribution of IP3-evoked Ca2+ responses
IP3-evoked Ca2+ signals show considerable variability among different neurons (Fig. 2A) (Stutzmann et al., 2003). To further characterize the effects of the PS1 mutation on the distribution of cell responses, we categorized neurons as “nonresponders” (which fail to give Ca2+ signals even with strong photorelease of IP3), “weak responders” (which respond only to strong photorelease-flash >30 msec), or strong responders (which demonstrate a clear IP3-evoked Ca2+ response even at short flash durations). The proportions of non-, weak, and strong responders for the non-tg cells (n = 15) was 0.2, 0.33, and 0.47, respectively, whereas the corresponding proportion for PS1KI cells (n = 14) was 0.07, 0.0, and 0.93 (differences significantly different; p < 0.025; χ2 = 7.77). To determine whether this shift in proportion of responding neurons accounts entirely for the observed overall enhancement of Ca2+ signals in the PS1KI mice, we replotted the dose-response relationships after excluding nonresponding neurons (Fig. 3A). Within this population, an appreciable potentiation of Ca2+ responses to strong photolysis flashes remained, although PS1KI and non-tg groups showed nearly identical Ca2+ signals in response to action potential trains.
Figure 3.
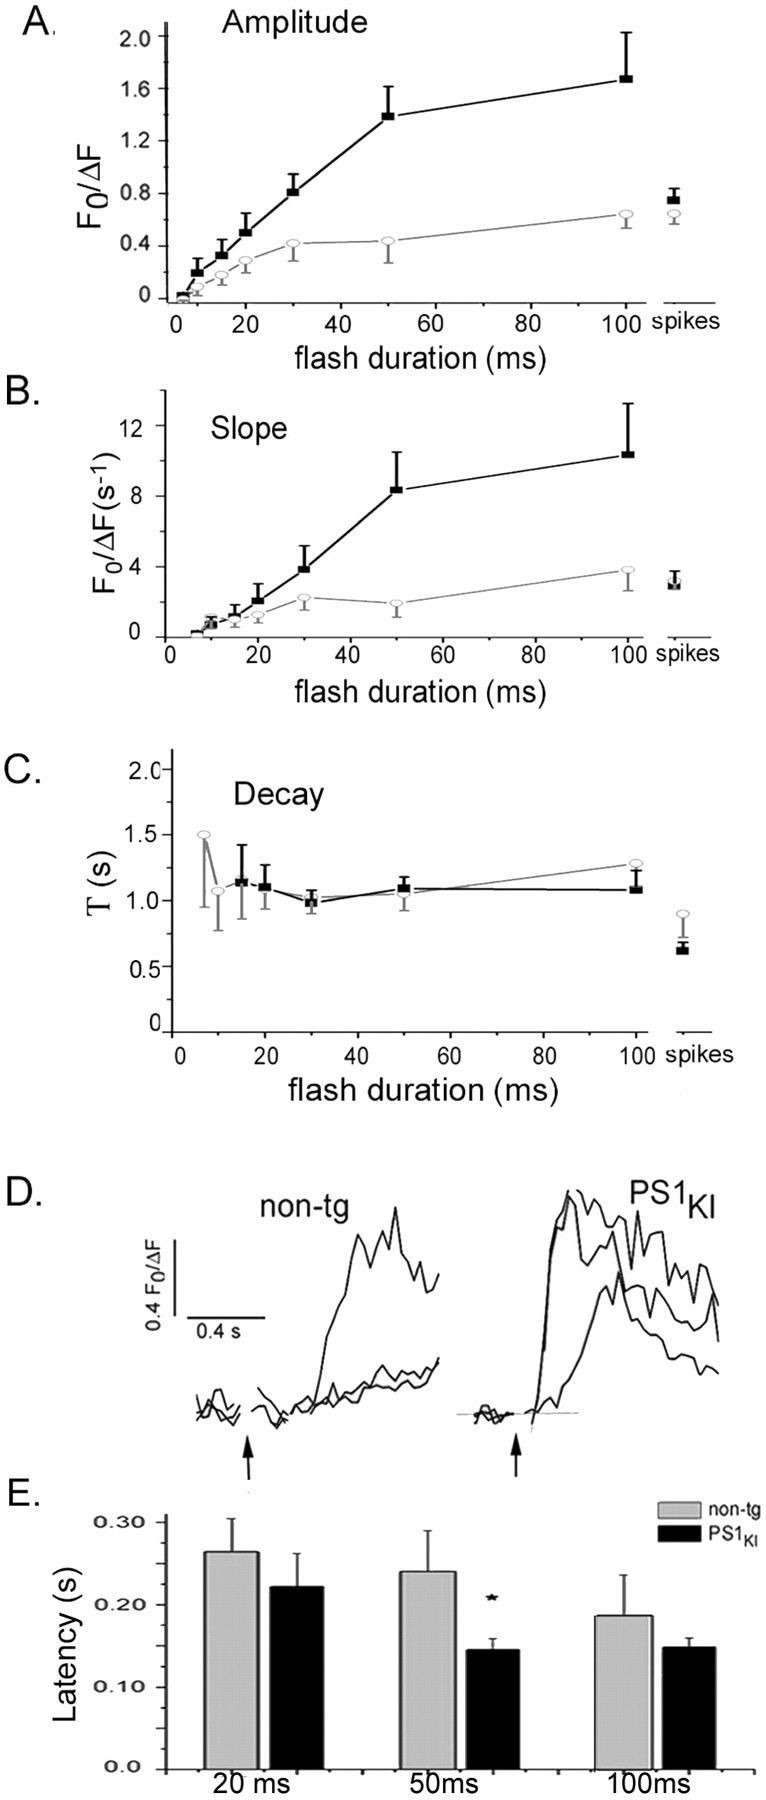
Amplitudes and kinetics of IP3-evoked Ca2+ signals in responsive PS1KI and non-tg neurons. Data in this figure were derived after excluding neurons that failed to responded to IP3. A, Dose-response relationships of IP3-evoked Ca2+ signals in non-tg (gray circles; n = 4-12) and PS1KI (black squares; n = 8-14) neurons. B, Mean rising slopes of IP3- and spike-evoked Ca2+ responses for non-tg (open circles; n = 4-12) and PS1KI (filled squares; n = 8-14) neurons. C, Mean decay time constants of IP3- and action potential-evoked Ca2+ signals in non-tg (open circles; n = 4-12) and PS1KI neurons (filled squares; n = 8-14) derived from single exponential fits to the decay of fluorescence signals. D, Representative Ca2+ traces showing response latencies from non-tg (left) and PS1KI neurons (right) in response to photolysis flashes with durations of 20, 50, and 100 msec. Latencies were measured as the interval between the onset of the flash artifact and time at which a straight-line fit to the rising phase of Ca2+ signals (dotted lines in the PS1KI traces) intercepted the baseline. E, Mean latencies in non-tg (gray) and PS1KI (black) neurons after flash durations of 20, 50, and 100 msec (n = 5-12 cells per group). Bars marked by asterisk are significantly different (p < 0.05) between these two groups.
Ca2+ kinetics in PS1KI neurons
We measured kinetic parameters including initial rate of rise, decay time constant, and latency of IP3-evoked Ca2+ signals, pooling data from strong and weak responders in each group. The upstroke of IP3-evoked responses was enhanced by almost 200% in PS1KI neurons (Fig. 3B); however, no differences were apparent between non-tg and PS1KI neurons in the rate of decay of IP3-evoked Ca2+ signals, although the decay rate for action potential-evoked Ca2+ transients was slightly slower in the PSKI neurons. In both non-tg and PS1KI neurons the latency to onset of Ca2+ liberation after photorelease of IP3 shortened progressively with increasing flash duration (Fig. 3D), but PS1KI neurons on average showed shorter latencies (Fig. 3E).
IP3-mediated hyperpolarization is enhanced in PS1KI neurons
IP3-evoked Ca2+ liberation leads to opening of Ca2+-dependent K+ channels, thereby resulting in membrane hyperpolarization and a decreased electrical excitability that strongly affects neuronal spiking patterns (Stutzmann et al., 2003). In both non-tg and PS1KI neurons the membrane hyperpolarization increased progressively with increasing flash duration, but responses were significantly greater in PS1KI neurons than in non-tg cells (Fig. 4A). This potentiation was most prominent at longer flash durations (Fig. 4B).
Figure 4.
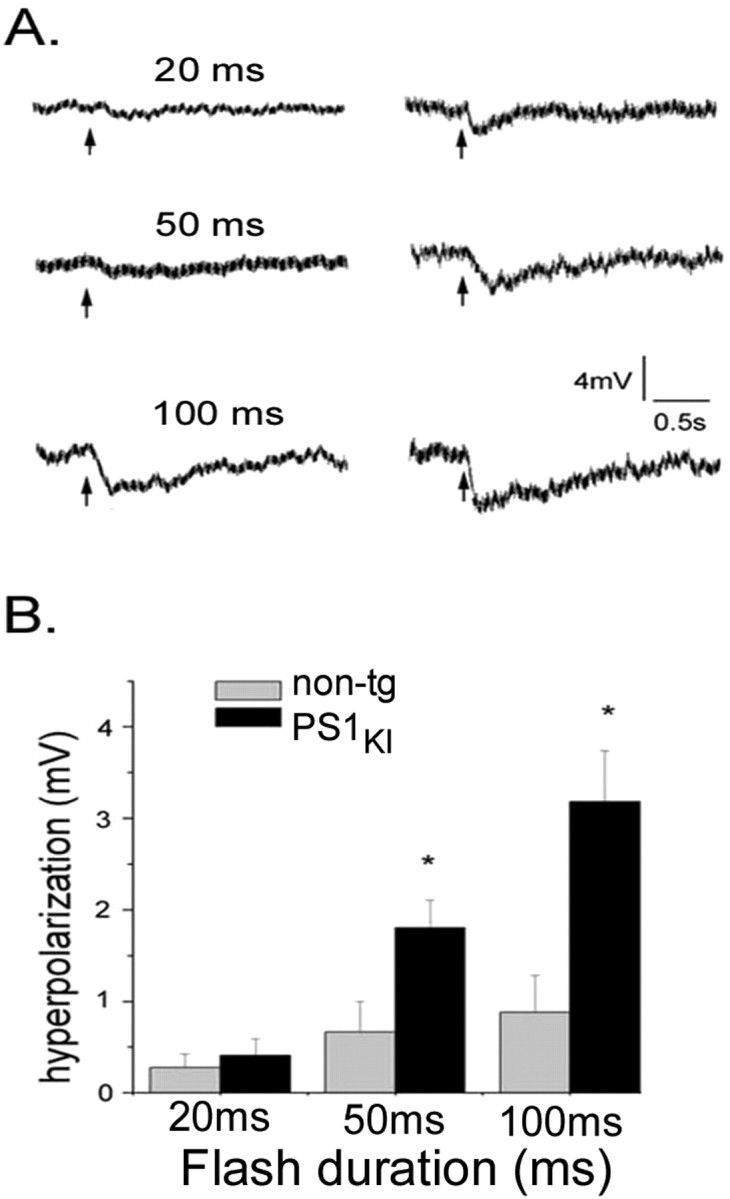
IP3-evoked hyperpolarizing membrane potential responses are enhanced in PS1KI neurons. A, Representative traces of membrane potential in a non-tg neuron (left column) and a PS1KI neuron (right) in response to photolysis flashes with durations as indicated in milliseconds. B, Bar graph showing average IP3-evoked hyperpolarizations evoked by these photolysis flashes, pooled from all non-tg (gray bars; n = 15-17) and PS1KI (black bars; n = 11-15) neurons.
Levels of IP3R and Ca2+ signaling proteins
To further elucidate the mechanisms underlying the enhancement of IP3-mediated Ca2+ signaling in PS1M146V mice, we determined whether the levels of selected key proteins implicated in cellular Ca2+ signaling were altered. We monitored the steady-state levels of the following proteins obtained from cortical homogenates: IP3 receptor, calsenilin, SERCA-2b, and calbindin-D. IP3Rs directly mediate calcium release from the ER, SERCA2b and calsenilin interact with presenilin to modulate calcium signaling (Buxbaum et al., 1998; Leissring et al., 2000), and calbindin-D is a high-affinity calcium buffering protein found in interneurons and subpopulations of cortical pyramidal neurons (Fujimaru and Kosaka, 1996; Hof et al., 1999). Densitometric analysis of Western blots revealed that the levels of these candidate proteins were not significantly different (p > 0.05) in 4- to 5-week-old PSKI and non-tg mice (data not shown).
Discussion
We used two-photon imaging and flash photolysis of caged IP3 to demonstrate that IP3-evoked Ca2+ transients in cortical neurons are substantially and specifically potentiated in transgenic mice expressing an AD-linked mutation of the presenilin gene. Our results offer mechanistic insights into the locus of PS1 modulation of Ca2+ signaling and reveal changes in downstream electrical excitability in a cell type and brain region sensitive to AD pathology.
The peak amplitude and rate of rise of IP3-evoked Ca2+ signals were much greater, on average, in neurons from PS1KI mice (>350%) than in age-matched non-tg mice. In contrast, Ca2+ signals evoked by trains of action potentials were not very different. Thus, the actions of the PS1 mutant appear specific to IP3-mediated ER Ca2+ liberation rather than involving general changes in cytoplasmic Ca2+ regulation such as alterations in cytosolic Ca2+ buffering capacity or voltage-gated Ca2+ influx. Immunoblot analyses showed that IP3R levels were not increased in the cortical homogenates of PS1KI mice, suggesting that the enhanced Ca2+ liberation did not arise simply through an increase in numbers of release channels (Leissring et al., 1999). Moreover, we did not observe a leftward shift in dose-response curves for IP3 action that might suggest an increase in sensitivity of IP3R. Instead, our results are consistent with previous observations in nonexcitable and cultured cells (Leissring et al., 2000; Mattson et al., 2000; Herms et al., 2003) that point to an overfilling of ER Ca2+ stores. The underlying mechanisms remain unclear because we are presently unable to measure ER store levels directly, but they likely do not involve increases in the number or activity of the SERCA pumps that accumulate Ca2+ into the ER, because levels of SERCA 2b protein were unaltered by the PS1M146V mutation in cortical homogenates, as were the rate constants of cytosolic Ca2+ clearance after both IP3- and action potential-evoked signals. It remains possible, however, that a change in “set point” of the SERCA pumps could cause a continued uptake at basal cytosolic-free Ca2+ levels, resulting in enhanced store filling over time.
Another mechanism that may contribute to increased store filling is downregulation of the passive leak of Ca2+ from the ER. The ER Ca2+ store content is set by a balance between active uptake through SERCA pumps and passive leak into the cytosol. Experiments in nonexcitable cells using thapsigargin to assess the Ca2+ leak by measuring the rise in cytosolic [Ca2+] after block of SERCA pumps showed little change after PS1M146V expression (Guo et al., 1999b; Leissring et al., 2000; Yoo et al., 2000; Camello et al., 2002). Neurons, however, use the ER leak more predominantly to maintain homeostasis than do nonexcitable cells (Simpson et al., 1995; Solovyova et al., 2002), so that even subtle changes may have profound effects on intraluminal Ca2+ levels. It is also possible that increased amounts of Ca2+ buffering proteins in the ER lumen could increase the total Ca2+ storage capacity for any given luminal-free Ca2+ concentration.
A further finding was the increase in the proportion of neurons responding to moderate levels of IP3. The PS1 mutation results, therefore, not only in an exaggeration of IP3-evoked Ca2+ signals in responding neurons but appears to shift weak and nonresponders to strong responders. The heterogeneity of IP3-evoked Ca2+ responses likely reflects the recent Ca2+ filling or release history of the ER (Yoshizaki et al., 1995; Garaschuk et al., 1997), and we had demonstrated that nonresponding neurons could sometimes be rescued by allowing the ER to fill via Ca2+ entry during action potentials (Stutzmann et al., 2003). Thus, ER Ca2+ stores in most neurons from PS1KI mice are likely overfilled, with possible subsequent consequences for neuronal signaling, metabolism, and neuropathology.
Finally, we examined the effects of the PS1 mutation on downstream Ca2+-dependent modulation of membrane excitability. In non-tg neurons, photoreleased IP3 evokes a transient membrane hyperpolarization via activation of Ca2+-sensitive K+ conductances, although the spatial relationship between the intracellular Ca2+ stores and the K+ channels and the specific class(es) of K+ channel involved are not known (Sah, 1996; Stutzmann et al., 2003). The magnitude of the membrane hyperpolarization was significantly larger in neurons from PS1KI mice, presumably because of the enhanced Ca2+ release from ER stores. This hyperpolarization continued to increase even with flash durations longer than required to evoke near-maximal Ca2+ signals, possibly as a result of the steeply nonlinear Ca2+ dependence of the underlying conductance change (Stutzmann et al., 2003). The enhanced IP3-evoked hyperpolarization leads to an interesting reciprocal effect on neuronal excitability. PS1M146V increases the “excitability” of the ER, yet this is transduced as an inhibition of plasma membrane electrical excitability that will lead to changes in spike patterning and reduced responsiveness to excitatory synaptic inputs.
Footnotes
This work was supported by National Institutes of Health Grants GM48071, AG17968, and AG16573. We thank Imithri De Silva for assistance in data analysis and manuscript preparation, and Dr. Frank Wujtack for the gift of the SERCA 2b primary antibody.
Correspondence should be addressed to Grace E. Stutzmann, Department of Neurobiology and Behavior, University of California, Irvine, McGaugh Hall 1146, Irvine, CA 92697-4550. E-mail: grace@uci.edu.
Copyright © 2004 Society for Neuroscience 0270-6474/04/240508-06$15.00/0
References
- Abe K (1997) Clinical and molecular analysis of neurodegenerative diseases. J Exp Med 181: 389-409. [DOI] [PubMed] [Google Scholar]
- Barrow PA, Empson RM, Gladwell SJ, Anderson CM, Killick R, Yu X, Jefferys JG, Duff K (2000) Functional phenotype in transgenic mice expressing mutant human presenilin-1. Neurobiol Dis 7: 119-126. [DOI] [PubMed] [Google Scholar]
- Berridge M (1998) Neuronal calcium signaling. Neuron 21: 13-26. [DOI] [PubMed] [Google Scholar]
- Berridge M (2002) The endoplasmic reticulum: a multifunctional signaling organelle. Cell Calcium 32: 235-249. [DOI] [PubMed] [Google Scholar]
- Bussiere T, Gold G, Kovari E, Giannakopoulos P, Bouras C, Perl DP, Morrison JH, Hof PR (2003) Stereologic analysis of neurofibrillary tangle formation in prefrontal cortex area 9 in aging and Alzheimer's disease. Neuroscience 117: 577-592. [DOI] [PubMed] [Google Scholar]
- Buxbaum JD, Choi EK, Luo Y, Lilliehook C, Crowley AC, Merriam DE, Wasco W (1998) Calsenilin: a calcium-binding protein that interacts with the presenilins and regulates the levels of a presenilin fragment. Nat Med 4: 1177-1181. [DOI] [PubMed] [Google Scholar]
- Camello C, Lomax R, Petersen OH, Tepikin AV (2002) Calcium leak from intracellular stores—the enigma of calcium signalling. Cell Calcium 32: 355-361. [DOI] [PubMed] [Google Scholar]
- Campion D, Flaman JM, Brice A, Hannequin D, Dubois B, Martin C, Moreau V, Charbonier F, Didierjean O, Tardieu S, Penet C, Puel M, Pasquier F, Le Doze F, Bellis G, Calenda A, Heiolig R, Martinez M, Mallet J, Bellis M, Clerget-Darpoux F, Agid Y, Trebourg T (1995) Mutations of the presenilin gene in families with early-onset Alzheimer disease. Hum Mol Genet 4: 2373-2377. [DOI] [PubMed] [Google Scholar]
- Fujii S, Matsumoto M, Igarashi K, Kato H, Mikoshiba K (2000) Synaptic plasticity in hippocampal CA1 neurons of mice lacking type 1 inositol-1,4,5-trisphosphate receptors. Learn Memory 7: 312-320. [DOI] [PMC free article] [PubMed] [Google Scholar]
- Fujimaru Y, Kosaka T (1996) The distribution of two calcium binding proteins, calbindin D-28K and parvalbumin, in the entorhinal cortex of the adult mouse. Neurosci Res 24: 329-343. [DOI] [PubMed] [Google Scholar]
- Garaschuk O, Yaari Y, Konnerth A (1997) Release and sequestration of calcium by ryanodine-sensitive stores in rat hippocampal neurones. J Physiol (Lond) 502: 13-30. [DOI] [PMC free article] [PubMed] [Google Scholar]
- Goldman-Rakic P (1995) Cellular basis of working memory. Neuron 14: 477-485. [DOI] [PubMed] [Google Scholar]
- Grill J, Riddle D (2002) Age-related and laminar-specific dendritic changes in the medial frontal cortex of the rat. Brain Res 937: 8-21. [DOI] [PubMed] [Google Scholar]
- Grilli M, Diodato E, Lozza G, Brusa R, Casarini M, Uberti D, Rozmahel R, Westaway D, St. George-Hyslop P, Memo M, Ongini E (2000) Presenilin-1 regulates the neuronal threshold to excitotoxicity both physiologically and pathologically. Proc Natl Acad Sci USA 97: 12822-12827. [DOI] [PMC free article] [PubMed] [Google Scholar]
- Guo Q, Furukawa K, Sopher BL, Pham DG, Xie J, Robinson N, Martin GM, Mattson M (1996) Alzheimer's PS-1 mutation perturbs calcium homeostasis and sensitizes PC12 cells to death induced by amyloid beta-peptide. NeuroReport 8: 379-383. [DOI] [PubMed] [Google Scholar]
- Guo Q, Fu W, Sopher GL, Miller MW, Ware CB, Martin GM, Mattson MP (1999a) Increased vulnerability of hippocampal neurons to excitotoxic necrosis in presenilin-1 mutant knock-in mice. Nat Med 5: 101-106. [DOI] [PubMed] [Google Scholar]
- Guo Q, Sebastian L, Sopher BL, Miller MW, Ware CB, Martin GM, Mattson MP (1999b) Increased vulnerability of hippocampal neurons from presenilin-1 mutant knock-in mice to amyloid beta-peptide toxicity: central roles of superoxide production and caspase activation. J Neurochem 72: 1019-1029. [DOI] [PubMed] [Google Scholar]
- Herms J, Schneider I, Dewachter I, Caluwaerts N, Kretzschmar H, Van Leuven F (2003) Capacitive calcium entry is directly attenuated by mutant presenilin-1, independent of the expression of the amyloid precursor protein. J Biol Chem 278: 2484-2489. [DOI] [PubMed] [Google Scholar]
- Hirashima N, Etcheberrigaray R, Bergamaschi S, Racchi M, Battaini F, Binetti G, Govoni S, Alkon DL (1996) Calcium responses in human fibroblasts: a diagnostic molecular profile for Alzheimer's disease. Neurobiol Aging 17: 549-555. [DOI] [PubMed] [Google Scholar]
- Hof PR, Glezer II, Conde F, Flagg RA, Rubin MB, Nimchinsky EA, Vogt Weisenhorn DM (1999) Cellular distribution of the calcium-binding proteins parvalbumin, calbindin, and calretinin in the neocortex of mammals: phylogenetic and developmental patterns. J Chem Neuroanat 16: 77-116. [DOI] [PubMed] [Google Scholar]
- Ito E, Oka K, Etcheberrigaray R, Nelson TJ, McPhie DL, Tofel-Grehl B, Gibson GE, Alkon DL (1994) Internal Ca2+ mobilization is altered in fibroblasts from patients with Alzheimer's disease. Proc Natl Acad Sci USA 91: 534-538. [DOI] [PMC free article] [PubMed] [Google Scholar]
- Khachaturian ZS (1994) Calcium hypothesis of Alzheimer's disease and brain aging. Ann NY Acad Sci 747: 1-11. [DOI] [PubMed] [Google Scholar]
- LaFerla F (2002) Calcium dyshomeostasis and intracellular signalling in Alzheimer's disease. Nat Rev Neurosci 3: 862-872. [DOI] [PubMed] [Google Scholar]
- Leissring M, Paul B, Parker I, Cotman C, LaFerla F (1999) Alzheimer's presenilin-1 mutation potentiates inositol 1,4,5-trisphosphate-mediated calcium signaling in Xenopus oocytes. J Neurochem 72: 1061-1068. [DOI] [PubMed] [Google Scholar]
- Leissring MA, Akbari Y, Fanger CM, Cahalan MD, Mattson MP, FM. L (2000) Capacitative calcium entry deficits and elevated luminal calcium content in mutant presenilin-1 knockin mice. J Cell Biol 149: 793-798. [DOI] [PMC free article] [PubMed] [Google Scholar]
- Mattson M, LaFerla F, Chan S, Leissring M, Shepel P, Geiger J (2000) Calcium signaling in the ER: its role in neuronal plasticity and neurodegenerative disorders. Trends Neurosci 23: 222-229. [DOI] [PubMed] [Google Scholar]
- Mattson MP, Chan S (2001) Dysregulation of cellular calcium homeostasis in Alzheimer's disease: bad genes and bad habits. J Mol Neurosci 17: 205-224. [DOI] [PubMed] [Google Scholar]
- McCormick DA, Conners BW, Lighthall JW, Prince DA (1985) Comparitive electrophysiology of pyramidal and sparsely spiny neurons of the neocortex. J Neurophysiol 54: 782-806. [DOI] [PubMed] [Google Scholar]
- Mellstrom B, Naranjo J (2001) Mechanisms for Ca2+-dependent transcription. Curr Opin Neurobiol 11: 312-319. [DOI] [PubMed] [Google Scholar]
- Miyata M, Finch E, Khiroug L, Hashimoto K, Hayasaka S, Oda S, Inouye M, Takagishi Y, Augustine G, Kano M (2000) Local calcium release in dendritic spines required for long-term synaptic depression. Neuron 28: 233-244. [DOI] [PubMed] [Google Scholar]
- Nguyen Q, Callamaras N, Parker I (2001) Consruction of a two-photon microscope for video-rate Ca2+ imaging. Cell Calcium 30: 383-393. [DOI] [PubMed] [Google Scholar]
- Nishiyama M, Hong K, Mikoshiba K, Poo M, Kato K (2000) Calcium stores regulate the polarity and input specificity of synaptic modification. Nature 408: 584-588. [DOI] [PubMed] [Google Scholar]
- Oddo S, Caccamo A, Shepherd J, Murphy M, Golde TE, Kayed R, Metherate R, Mattson MP, Akbari Y, LaFerla FM (2003) Triple-transgenic model of Alzheimer's disease with plaques and tangles: intracellular Abeta and synaptic dysfunction. Neuron 39: 409-421. [DOI] [PubMed] [Google Scholar]
- Parent A, Linden DJ, Sisodia SS, Borchelt DR (1999) Synaptic transmission and hippocampal long-term potentiation in transgenic mice expressing FAD-linked presenilin 1. Neurobiol Dis 6: 56-62. [DOI] [PubMed] [Google Scholar]
- Parker I, Ivorra I (1992) Characteristics of membrane currents evoked by photoreleased inositol triphosphate in Xenopus oocytes. Am J Physiol 263: C154-C165. [DOI] [PubMed] [Google Scholar]
- Pearson RC, Esiri MM, Hiorns RW, Wilcock GK, Powell TP (1985) Anatomical correlates of the distribution of the pathological changes in the neocortex in Alzheimer disease. Proc Natl Acad Sci USA 82: 4531-4534. [DOI] [PMC free article] [PubMed] [Google Scholar]
- Rainer G, Asaad W, Miller E (1998) Selective representation of relevant information by neurons in the primate prefrontal cortex. Nature 393: 577-579. [DOI] [PubMed] [Google Scholar]
- Sah P (1996) Ca2+-activated K+ currents in neurones: types, physiological roles and modulation. Trends Neurosci 19: 150-154. [DOI] [PubMed] [Google Scholar]
- Selkoe DJ (2001) Alzheimer's disease: genes, proteins, and therapy. Physiol Rev 81: 741-766. [DOI] [PubMed] [Google Scholar]
- Simpson PB, Challiss RA, Nahorski SR (1995) Neuronal Ca2+ stores: activation and function. Trends Neurosci 18: 299-306. [DOI] [PubMed] [Google Scholar]
- Solovyova N, Veselovsky N, Toescu EC, Verkhratsky A (2002) Ca2+ dynamics in the lumen of the endoplasmic reticulum in sensory neurons: direct visualization of Ca2+-induced Ca2+ release triggered by physiological Ca2+ entry. EMBO J 21: 622-630. [DOI] [PMC free article] [PubMed] [Google Scholar]
- Stutzmann GE, LaFerla FM, Parker I (2003) Ca2+ signaling in mouse cortical neurons studied by two-photon imaging and photoreleased inositol triphosphate. J Neurosci 23: 758-765. [DOI] [PMC free article] [PubMed] [Google Scholar]
- Yamamoto K, Hashimoto K, Nakano M, Shimohama S, Kato N (2002) A distinct form of calcium release down-regulates membrane excitability in neocortical pyramidal cells. Neuroscience 109: 665-676. [DOI] [PubMed] [Google Scholar]
- Yoo A, Cheng I, Chung S, Grenfell TZ, Lee H, Pack-Chung E, Handler M, Shen J, Xia W, Tesco G, Saunders AJ, Ding K, Frosch MP, Tanzi RE, Kim TW (2000) Presenilin-mediated modulation of capacitative calcium entry. Neuron 3: 561-572. [DOI] [PubMed] [Google Scholar]
- Yoshizaki K, Hoshino T, Sato M, Koyano H, Nohmi M, Hua SY, Kuba K (1995) Ca2+-induced Ca2+ release and its activation in response to a single action potential in rabbit optic ganglion cells. J Physiol (Lond) 486: 117-187. [DOI] [PMC free article] [PubMed] [Google Scholar]