

Abstract
Glutamatergic inputs from the subthalamic nucleus are suspected to provide a prominent source of excitation to globus pallidus (GP) neurons, despite their scarce number and mainly distal dendritic location. In this study we address the issue of whether dendritic sodium channels may facilitate the effect of excitatory inputs in GP. First, we examined the subcellular distribution of sodium channels using electron microscopic observations of immunoperoxidase and immunogold labeling. Voltage-gated sodium channels were found throughout GP dendrites and furthermore exhibited a specific clustering at sites of excitatory synaptic inputs. To examine the possibility that these channels could mediate dendritic spike generation, synaptic stimulation at visualized dendritic sites was performed during whole-cell recordings in vitro. These recordings revealed dendritic spike initiation in response to small excitatory inputs even for very distal stimulation sites. In contrast, subthreshold responses were mostly or fully attenuated at the soma for stimulation sites on distal dendrites. Computer simulations support the hypothesis that postsynaptic clustering of sodium channels allows dendritic triggering of spikes in response to inputs that would be too small to trigger a spike given uniformly distributed dendritic sodium channels. These findings indicate that postsynaptic sodium channel clustering is an effective mechanism to mediate a novel form of synaptic amplification and dendritic spike initiation. The ability of small amounts of excitation to trigger spikes in GP dendrites supports the prominent role of subthalamic input in the control of GP activity.
Keywords: sodium channel, globus pallidus, subthalamic nucleus, dendritic processing, synaptic integration, subcellular localization
Introduction
Less than 10% of synapses onto globus pallidus (GP) neurons are excitatory, and many of these excitatory inputs contact distal dendritic sites (Falls et al., 1983; Kita and Kitai, 1987; Shink and Smith, 1995). The dendrites of GP neurons have an average diameter of only 1 μm, and frequently extend over 1 mm in length (Park et al., 1982; Cooper and Stanford, 2000). If these dendrites acted only as passive structures, a large proportion of excitatory inputs would be too distal to have any significant direct effect on the somatic membrane potential (Rall, 1995; Segev and London, 2000; Williams and Stuart, 2002). In contrast, the high firing frequencies of GP neurons in vivo (DeLong, 1971; Jaeger et al., 1993; Magill et al., 2001) suggests that the limited excitatory input may be able to drive these neurons to levels above their intrinsic pacemaker activity (Cooper and Stanford, 2000). Thus, the control of spiking by excitatory input in these neurons is likely to involve active dendritic processes. Furthermore, recent evidence points to a strong interaction between subthalamic nucleus (STN) and GP that may trigger regenerative bursting (Plenz and Kitai, 1999; Bevan et al., 2002; Terman et al., 2002).
In several types of neurons, the presence of voltage-gated sodium channels in the dendritic tree allows action potentials initiated at the axosomatic region to propagate actively into the dendrites (Stuart and Sakmann, 1994; Hausser et al., 1995; Spruston et al., 1995; Stuart et al., 1997). Under conditions of strong synaptic inputs, action potentials may be generated first in the dendrites and then propagate to the soma in some types of neurons, greatly enhancing the impact of distal synapses (Chen et al., 1997; Golding and Spruston, 1998; Schwindt and Crill, 1998; Hausser et al., 2000; Martina et al., 2000). The purpose of the present study was to test the possibility that action potentials could be generated in the dendrites of GP neurons and to determine the conditions under which excitatory synaptic inputs could trigger dendritic spikes.
The initiation and propagation of dendritic action potentials depends on the spatial distribution of voltage-gated sodium channels (Golding et al., 2001; Vetter et al., 2001). Therefore, we started our study of active sodium conductances in GP dendrites with an electron microscopic (EM) examination of the subcellular localization of sodium channels. Voltage-gated sodium channels were found throughout the whole dendritic tree of GP neurons, and showed a significant clustering at sites of excitatory synaptic inputs. The novel finding of a clustering of sodium channels postsynaptic to excitatory synapses has important implications for possible mechanisms of synaptic integration. We further examined the functional significance of dendritic sodium channels with intracellular recordings in vitro as well as computer simulations.
Materials and Methods
Anatomy
Primary antibodies. Affinity-purified rabbit polyclonal antibodies raised against synthetic peptide sequences corresponding to unique sequences on each isoform of the voltage-gated sodium channel α subunit were used. Anti-Nav1.1 (Upstate Biotechnology, Waltham, MA) recognized residues 1993-2009 on the intracellular C terminal, anti-Nav1.2 (Upstate Biotechnology) recognized residues 1932-1947 on the C terminal, anti-Nav1.3 (Alomone Labs, Jerusalem, Israel) recognized residues 511-524 on the intracellular loop between domains I and II, and anti-Nav1.6 (Alomone and Sigma, St. Louis, MO) recognized residues 1042-1061 on the intracellular loop between domains II and III. The Nav1.6 antibodies from the two suppliers yielded similar patterns of peroxidase labeling at both light microscopic (LM) and EM levels. The Sigma antibody was used primarily for LM and EM observations of immunoperoxidase-stained tissue, including LM examination of null mutant mouse tissue. The Alomone antibody was used for both LM and EM observations of immunoperoxidase- and immunogold-stained material from rat tissue. Initial experiments with antibodies against Nav1.3, an isoform known to be expressed transiently in the developing brain (Beckh et al., 1989), did not exhibit any labeling in the adult rat GP. To confirm the specificity of the antibodies, we performed the following control experiments: (1) Sections were incubated in solutions in which the primary antisera were replaced by nonimmune rabbit serum. (2) Sections were incubated with a primary antibody solution that was first preabsorbed for 2 hr at room temperature with 10-100 μg/ml of the peptide against which the antibody was generated (see Fig. 1). Specifically, the Nav1.1 antibody was preincubated with the peptide CIVEKHEQEGKDEKAKDK, the Nav1.2 antibody with CYKKDKGKEDEGTPIKE, and the Nav1.6 antibody with CIANHTGVDIHRNGDFQKNG. Nav1.1 and Nav1.2 epitope peptides were synthesized at the Emory University Microchemical Facility (Atlanta, GA) and the Nav1.6 peptide was obtained from Alomone Labs. (3) GP sections from Nav1.6 null mutant mice (Raman et al., 1997) were completely devoid of staining when incubated with the Nav1.6 antiserum, whereas control mice from the same litter showed strong immunoperoxidase labeling.
Figure 1.

Antibody specificity controls. Light micrographs showing peroxidase labeling for each of the sodium channel isoforms in the globus pallidus (top). The first three columns show rat tissue, whereas the last shows Nav1.6 labeling in mouse tissue. With each antibody, the densest areas of labeling are found in the neuropil, whereas the fiber bundles that perforate the pallidum are seen as lighter areas. Note the presence of small spots of intense Nav1.6 labeling within the fiber bundles, likely corresponding to strongly labeled nodes of Ranvier seen at the EM level (Fig. 2). The bottom row shows control sections in which, before incubation with the tissue sections, each antibody was preincubated with control peptides corresponding to the unique regions of the isoform against which each antibody was generated (see Material and Methods for details). Incubations were also performed with Nav1.6 antibodies using Nav1.6 null mutant mouse tissue (bottom right). In sections incubated with preabsorbed antibodies or in null mutant mouse sections, there was a complete loss of sodium channel immunoreactivity (bottom). Scale bar, 200 μm.
Animals and tissue processing. All procedures were approved by the Institutional Animal Care and Use Committee of Emory University and conformed to National Institutes of Health guidelines. Perfusion-fixed tissue from nine adult Sprague Dawley rats was processed for pre-embedding peroxidase and immunogold immunocytochemistry as described previously (Hanson and Smith, 2002). These animals were perfused with cold Ringer's solution followed by 300 ml of a mixture of 4% paraformaldehyde and 0.1% glutaraldehyde. The brains were then removed from the skull and postfixed for 1-3 hr in 4% paraformaldehyde before being cut into 60 μm slices on a vibratome. Labeling with anti-sodium channel antibodies (0.25-0.5 μg/ml) was visualized using either peroxidase reaction product or silver-intensified gold particles. Tissue was then processed for EM, and ultrathin sections were collected for observation with a Zeiss (Oberkochen, Germany) EM-10C electron microscope. Tissue from two Nav1.6 (Scn8a) null mutant mice (Raman et al., 1997) and two control littermates were processed for pre-embedding LM peroxidase immunocytochemistry. The mouse brains were fixed by immersion in cold fixative (4% paraformaldehyde and 0.1% glutaraldehyde) for 48 hr. They were then processed for immunocytochemistry in the same manner as the rat brains.
Analysis of material. Tissue was sampled randomly from three different animals for each quantitative measurement of peroxidase or immunogold labeling. Only areas of ultrathin sections close enough to the surface that antibody penetration was strong were used. Once such an area was identified using low-magnification observations in a randomly selected section, it was systematically scanned at 20,000-31,500× magnification, and all labeled elements were documented.
For the peroxidase labeling of each isoform, all labeled axons were counted and categorized as large myelinated axons, large unmyelinated axons, or small unmyelinated axons. For the immunogold labeling, the locations of plasma membrane-bound gold particles were determined for each labeled dendrite with ultrastructural preservation that allowed accurate discrimination of synaptic versus extrasynaptic sites. Only the gold particles that were in direct contact with the plasma membrane were categorized as membrane-bound. These plasma membrane-bound particles were categorized in three groups based on their location relative to synapses. Gold particles located in the main body of symmetric and asymmetric synaptic junctions were scored as synaptic. All other particles were categorized as extrasynaptic. The number of plasma membrane-bound gold particles in direct contact with asymmetric synapses, symmetric synapses, and extrasynaptic sites were scored and totaled from all micrographs examined for a given antibody. These totals were then used to determine the percentage of labeling at synaptic versus extrasynaptic sites in each animal (see Fig. 4 A-C). A total of at least 100 labeled dendrites were examined for each antibody in each animal, resulting in observations of over 1800 membrane-bound gold particles. As a control, the proportion of well preserved dendritic membrane contributing to asymmetric synapses, symmetric synapses, or extrasynaptic membrane was measured in 100 dendrites without respect to labeling in each of three different animals (see Fig. 4 A-C).
Figure 4.

Quantification of sodium channel immunogold labeling at different portions of the plasma membrane. A-C, The percentage of gold particle labeling for each sodium channel isoform at extrasynaptic sites, symmetric (inhibitory) synapses, and asymmetric (excitatory) synapses along the plasma membrane of GP neurons was scored. As a control, the percentage of each type of membrane found in random observations of GP tissue is shown. This value reflects the percentage of labeling expected based on a random distribution of labeling along the plasma membrane. For comparison, the distribution of labeling for L-type calcium channels described in our previous study (Hanson and Smith, 2002) (pooled data from α1C- and α1D-isoforms) is shown. Data are expressed as means ± SE of measurements in three different animals (see Materials and Methods). Asterisks above the measurements of each sodium channel isoform at asymmetric synapses indicate that the levels of labeling are significantly higher than that expected from a random distribution of labeling along the plasma membrane (Mann-Whitney U test; p < 0.05). Note that in contrast with sodium channels, the level of L-type calcium channel labeling is not significantly different from that expected based on a random distribution. D, Relative density of sodium channel isoform immunogold labeling at different portions of the plasma membrane. Normalized values were calculated as the percentage of labeling for each isoform at a given type of membrane divided by the percentage of dendritic membrane that contributes to that type of membrane. Note that the relative density of labeling for each sodium channel isoform is approximately six times higher at asymmetric synapses than at extrasynaptic membrane or symmetric synapses.
Electrophysiology
Slice recordings. Frontal slices through the GP (300 μm) were prepared from 16- to 25-d-old male Sprague Dawley rats (n = 33; Charles River Laboratories, Wilmington, MA). Whole-cell recordings were obtained with an Axoclamp-2B amplifier (Axon Instruments, Union City, CA) from visually identified neurons at a recording temperature of 32°C. The slice medium contained the following (in mm): 124 NaCl, 3 KCl, 1.2 KH2PO4, 26 NaHCO3, 2 CaCl2, 1.9 MgS04, and 20 glucose. Electrodes were filled with a solution containing the following (in mm): 140 K-gluconate, 10 HEPES, 10 NaCl, 0.2 EGTA, 4 MgATP, 0.4 NaGTP, 0.05 spermine, and 5 glutathione. In some experiments, 20 μm Alexa Fluor 568 hydrazide (sodium salt, Molecular Probes, Eugene, OR) and 1.0% biocytin were incorporated in the electrode solution. Electrode resistance ranged between 8 and 12 MΩ. Electrodes were coated with Sylgard (#184; Dow-Corning, Midland, MI). Alexa-filled dendrites were visualized using a rhodamine filter set. To minimize phototoxic damage, the UV light source was shuttered (Uniblitz; Vincent Associates, Rochester, NY) so that the slice was illuminated for only 100 msec out of each 1.5 sec, during which an image was acquired with a Dage-MTI (Michigan City, IN) IR1000 camera. After recording, slices were placed in 10% buffered formalin (Sigma). Neurons filled with biocytin were revealed using a Vectastain ABC kit (Vector LaboratoriesMicroBrightField, Williston, VT).
Stimulation. Inhibitory synaptic transmission was blocked using 40 μm picrotoxin. Glass pipette electrodes identical to the recording electrodes were filled with 0.5 m NaCl or with slice medium, and were placed in the slice in the dendritic field of the recorded GP neuron. For experiments with visualized dendrites a small amount of rhodamine was added to the stimulation pipette filling solution to visualize the pipette while targeting filled dendrites. Biphasic stimuli of 0.2 msec duration and 5-40 V amplitude were delivered using stimulus-isolation units (World Precision Instruments, Sarasota, FL). These electrodes provided very focal stimulation of only a few fibers, as evidenced by a change or disappearance of responses when moving the stimulation electrode by ∼10 μm. In experiments with visualized dendrites, stimulation close to a dendrite often resulted in a stimulation response. Unresponsive sites were also encountered, but their extent was not further quantified because lateral movement in the slice with the stimulation pipette would physically disrupt the somatic recording. In some recordings AP-5 (200 μm; Tocris Cookson, Ellisville, MO), CNQX (20 μm; Tocris), and rhodamine were included in the stimulation pipette to allow visualized application of receptor antagonists. This solution was pressure-applied with a Picospritzer II (Parker Hannifin, Pneutronics Division, Hollis, NH), using pulses of 5-10 psi for 100-500 msec. The visualized solution spread to a diameter of 15-30 μm and remained visible for 2-15 sec, depending on the depth of the stimulation electrode in the slice, before being washed away by the perfusate. In other experiments, 1-1.5 mm glutamate [l-glutamic acid (Tocris) brought to physiological pH with NaOH] was applied through the stimulating electrode using 5-50 msec pressure pulses.
Computer simulations
A compartmental GP model neuron was built from a reconstructed GP neuron that was filled with biocytin during whole-cell recording in vitro. The GENESIS software package (www.genesis-sim.org/GENESIS) running under the Linux operating system on a personal computer was used throughout. A GENESIS morphology file was generated from the Neurolucida (MicroBrightField) reconstruction using the software cvapp (www.compneuro.org). The neuron was simulated as 512 compartments each with a maximum electrotonic length of 0.01 space constants. Simulations were updated using a time step of 10 μsec. Based on the observation that only a small proportion of synapses onto GP neurons are excitatory (Shink and Smith, 1995), 27 of the 512 compartments were selected at random as sites of excitatory inputs (see Fig. 8 A). Passive properties were determined by recording from a GP neuron rendered passive by the inclusion of the voltage-gated ion channel blockers containing the following (in mm): 0.001 TTX, 2 4-AP, 10 TEA, 0.1 CdCl2, 1 NiCl2, and 5 CsCl; and the synaptic blockers: 0.01 CNQX, 0.1 AP-5, and 0.04 picrotoxin in the bath, resulting in an input resistance of 250 MΩ. Specific membrane resistivity (RM = 1.47 Ωm2), specific membrane capacitance (CM = 0.024 F/m2), and specific axial resistivity (RA = 1.74 Ωm) were determined by fitting the model to experimental voltage decays after short somatic current injection impulses (0.5 msec, 1-1.5 nA) (Thurbon et al., 1998). These experimental data were obtained from the same neuron that was morphologically reconstructed for the model.
Figure 8.

Facilitation of dendritic spike initiation by different degrees of clustering. Only the activated synapse (indicated in Fig. 7A) was given increasing cluster densities, which was quantified as an x-fold conductance density increase compared with the baseline dendritic level. All other synapses were given cluster levels such that the anatomically determined average sixfold clustering at synapses was maintained for each simulation. The facilitation of dendritic spike initiation by clustering was measured by the normalized threshold amplitude of an EPSC needed to trigger a spike with specific cluster parameters compared with the model with uniform Na conductance. (For example using the parameters shown in Fig. 7B, the clustered model threshold size of 300 pS compared with the uniform model threshold size of 650 pS is equivalent to a normalized amplitude of 300/650 pS = 0.46.) The facilitation of dendritic spike initiation by clustering was examined for: A, Different values of mean sodium channel density. B, Different values of RM and RA. C, Different values of Eleak. D, Adjustments to the size of the synaptic compartment (see Results). E, Variations in the slope of voltage dependence of sodium channel activation (m∞). F, Facilitation of dendritic spike initiation by synaptic inputs at different distances from a cluster of sodium channels. The site of synaptic input was moved in either direction away from the site of the sodium channel cluster (denoted by 0 on the x-axis). In this set of simulations, other synapses on this portion of the dendritic tree were relocated to random sites on other dendritic branches to allow isolation of the effect of a single sodium channel cluster at varying distances along the dendrite. Dashed lines in A-D indicate the default value of each parameter that was used throughout the other panels of this figure as well as in Figure 5, with the exception of E, in which a resting potential of -70 mV was used. Note that the absolute threshold EPSC amplitude for a uniform channel distribution also changes for different values of RA, RM, and Eleak, but that only relative differences in the threshold EPSC changes between uniform and clustered simulations are graphed to determine the effect of clustering.
The only active properties incorporated into the model were fast voltage-gated sodium channels and delayed-rectifier potassium channels. Because specific kinetics from sodium channels in GP have not been reported, we used an established description of sodium channel kinetics obtained from measurements in dissociated hippocampal neurons (Traub et al., 1991). Activation and inactivation parameters were shifted by 5 mV in the depolarized direction to match our data on the spike threshold in GP. The maximal sodium conductance in the model was set to 2 nS/μm2, and was equal in the soma and the dendrites (uniform distribution). This value led to a peak sodium current of 5 nA in the soma during a simulated action potential, which was needed to generate a rise-to-peak of 0.2 msec, as seen experimentally in GP action potentials. It should be noted that the maximal conductance specified in the model was never achieved during an action potential because of the presence of a substantial proportion of inactivated and closed-channel conductance at the time of peak current. To explore the effects of sodium channel clustering at synapses, a model with a sixfold level of sodium conductance density in the 27 compartments receiving excitatory input compared with the remaining dendritic compartments was constructed. The soma retained a level of 2 nS/μm2 in these clustered simulations, whereas the remaining dendritic compartments were scaled down to 1.58 nS/μm2 so that the total dendritic sodium conductance was left unaltered from the uniform condition. To further examine the effect of different sodium channel densities achieved in a cluster, a single compartment with a stimulated excitatory synapse was set to a sodium channel density of 6- to 60-fold compared with nonsynaptic dendritic compartments. The total delayed rectifier potassium conductance was always distributed uniformly in the model and always equaled the total sodium conductance. To determine the effects of Na channel kinetics on synaptic triggered spike initiation, we varied the slope of steady-state activation and inactivation parameters and the value of activation and inactivation time constants. Varying the ratio of sodium to potassium conductance was done in control simulations, but did not have a significant effect on the results reported with the default ratio.
Excitatory synaptic conductances were simulated using dual exponential waveforms with tau1 = 0.2 msec and tau2 = 2 msec. The excitatory reversal potential was 0 mV, and the peak conductance was varied between 0.01 and 15 nS to find the threshold size needed to trigger spikes at each site of excitatory input in the uniform and clustered models.
Results
Subcellular localization of sodium channels
To determine the distribution of voltage-gated sodium channels in GP neurons, observations of tissue immunostained with antibodies against sodium channel α subunit isoforms Nav1.1, Nav1.2, and Nav1.6 were made at the EM level. Together, these sodium channel α subunit isoforms comprise those known to be present in neurons of the adult rat brain (Goldin, 1999, 2001). As an initial test of the specificity of the antibodies, control rat brain sections were stained with antibodies that had been preincubated with the peptide against which they were generated (see Materials and Methods). This resulted in a complete loss of labeling for each antibody (Fig. 1). In addition, the Nav1.6 antibody was tested in tissue from Scn8a null mutant mice (Raman et al., 1997). In contrast with control littermates, these sections lacked any labeling for Nav1.6 (Fig. 1). To further demonstrate the specificity of antibodies used, we examined the pattern of peroxidase labeling across different axonal compartments in the GP. The vast majority of Nav1.1 labeling in axons was specifically localized at myelinated portions of the axon (Fig. 2A,D). Consistent with previous observations, Nav1.2 was found mainly in small unmyelinated axons (Westenbroek et al., 1989) (Fig. 2B,D), and Nav1.6 was specifically associated with nodes of Ranvier (Caldwell et al., 2000; Boiko et al., 2001) (Fig. 2C,D). A low level of labeling for each type of sodium channel was also found in axon terminals. In contrast with their unique pattern of axonal distribution, the three sodium channel isoforms displayed the same pattern of peroxidase labeling within postsynaptic neuronal compartments. Each isoform was found within neuronal somata and dendrites of all diameters within the GP, which indicates that these channels are found throughout the whole extent of GP dendrites (Fig. 2E-G). To characterize the exact location of membrane-bound sodium channels in dendrites we used the pre-embedding immunogold technique. With this approach, we found that the plasma membrane-bound immunogold labeling for all three sodium channel isoforms was often found at the postsynaptic specialization of asymmetric excitatory synapses. To assess the unique association of this labeling with synaptic membranes, the presence of immunogold particles was observed through serial ultrathin sections (Fig. 3A-E).
Figure 2.

Peroxidase labeling of Nav1.1, Nav1.2, and Nav1.6 sodium channel isoforms in the GP. A, Nav1.1 preferentially labels large myelinated axons. B, Nav1.2 preferentially labels small unmyelinated axons. C, Nav1.6 preferentially labels large unmyelinated axons. Large unmyelinated axons were of the same diameter and occurred in bundles with myelinated ones, indicating that they represent unmyelinated nodes of Ranvier of myelinated axons. D, For each sodium channel isoform, all labeled axons were counted, and the relative distribution across different types of axons are plotted. Note that 50% of all axonal Nav1.6 labeling was found in large unmyelinated axons considered to represent nodes of Ranvier. This indicates a highly specific association of Nav1.6 with nodes of Ranvier, because they represented only a small fraction of the profiles scored. Data are pooled from measurements in three different animals (see Materials and Methods). E-G, Dendritic labeling for Nav1.1, Nav1.2, and Nav1.6. Note that even very-small-diameter, and therefore presumably very distal, dendrites were labeled. The arrowheads point at synapses onto labeled dendrites, whereas the arrows in E indicate asymmetric synapses onto an unlabeled dendritic profile. Scale bars: (in A) A-C, 0.75 μm; (in E) E, F, 0.5 μm; G, 1.0 μm.
Figure 3.

Immunogold labeling of sodium channels at asymmetric synapses onto GP neuron dendrites. A-C, Three serial sections through different levels of a dendrite labeled with Nav1.1. Plasma membrane-associated gold particles located at an asymmetric synapse are indicated with arrows. D, E, Two serial sections through different levels of a dendrite labeled with Nav1.2. Similar observations were made with Nav1.6 (data not shown). F, Extrasynaptic plasma-membrane labeling with Nav1.1. Scale bars: (in A) A-C, 0.6 μm; (in D) D-F, 0.5 μm.
In addition, a quantitative analysis indicated a significant overall enhancement of labeling for each sodium channel isoform at asymmetric synapses compared with extrasynaptic membranes or parts of the membrane involved in the formation of symmetric synapses (Fig. 4). On average, sodium channel labeling was approximately six times higher at asymmetric synapses than at other sites along the plasma membrane of GP neurons. The absence of any such clustering for L-type calcium channel labeling in the GP (Hanson and Smith, 2002) (Fig. 4) rules out the possibility that this pattern of labeling might be a technical artifact of the immunogold method for the localization of ion channels. Although our measurements indicate enhanced sodium channel levels directly within the postsynaptic membrane, the possibility of enhanced sodium channel levels in the extrasynaptic membrane surrounding excitatory synapses could not be quantified. This is because in observations of two-dimensional dendritic cross sections, the distance of any given piece of extrasynaptic membrane from excitatory synapses that might be nearby is unknown. Therefore, whether the clustering of sodium channels at asymmetric synaptic membranes is complemented by clustering in the nearby extrasynaptic membrane, remains undetermined.
Initiation of dendritic action potentials
In several types of neurons, action potentials have been found to originate in the dendrite and then propagate to the soma in response to strong synaptic input (Chen et al., 1997; Golding and Spruston, 1998; Martina et al., 2000). Thus, we tested whether the levels of sodium channels in dendrites were sufficient to trigger dendritic action potentials in GP neurons, although they receive only sparse excitatory input. To address this hypothesis, whole-cell recordings were obtained from GP neurons in vitro. Because distal dendrites of GP neurons are too thin for direct dendritic recordings, we recorded from the somata of GP neurons in voltage-clamp mode at negative holding potentials to obtain responses to electrical stimulation of dendritic excitatory inputs. Using this method, the soma and adjacent areas cannot initiate action potentials because of the voltage clamp, but the more distal portions of GP neurons can do so because of an imperfect space clamp. Nevertheless, even the dendrites do experience some steady-state hyperpolarization from the voltage-clamp (Spruston et al., 1993; Segev and London, 2000), which can be used to manipulate the spike threshold. In addition, we also performed current-clamp recordings for most of the same stimulation sites.
In a first set of experiments, somatic responses were measured after electrical activation of excitatory synapses at random sites in the local vicinity of the neuron (50-300 μm from the soma). We found three profiles of synaptic responses. (1) Large EPSCs at a short latency that did not lead to voltage-clamp escape of action potentials (n = 7 neurons) (Fig. 5A). In current clamp, stimulation at these sites triggered action potentials. (2) Small EPSCs at a longer latency that showed voltage-clamp escape of action potentials except at very hyperpolarized membrane potentials (n = 2) (Fig. 5B). (3) No detectable subthreshold EPSCs, but action potential escape after a short delay (n = 3) (Fig. 5C). In current clamp, these stimulation sites showed a complete absence of subthreshold EPSPs, but a single action potential was triggered when the hyperpolarizing bias current was reduced (Fig. 5D). Such stimulation-triggered action potentials without subthreshold EPSPs were initiated at a membrane potential substantially below the threshold of spontaneous spiking in the absence of bias current. These data suggest that the size of EPSCs recorded from the soma diminished as inputs at electrotonically more distal sites were stimulated, but that action potentials were triggered at the site of synaptic input. These action potentials escape voltage-clamp control when the stimulation sites are far from the clamped soma.
Figure 5.

Responses of GP neurons to electrical stimulation of excitatory inputs in somatic voltage clamp while inhibition was blocked with 40 μm picrotoxin. Stimulation times are indicated with vertical bars. Holding potentials (in mV) are indicated to the left of each current trace. Stimulus artifacts have been removed, and absolute current levels have been offset in the voltage traces for clarity. A, Two examples of stimulation sites for which EPSCs were observed over a range of subthreshold voltage-clamp holding potentials. B, Examples of stimulation sites in which voltage escape at the site of synaptic input allowed action potential currents to escape at less-hyperpolarized holding potentials. C, Examples of stimulation sites without subthreshold EPSC responses, although action potential currents were observed at less-hyperpolarized holding potentials. D, Current-clamp recordings of synaptically elicited action potentials in the absence of subthreshold responses.
In a second set of experiments, we tested this interpretation directly by stimulating next to dendrites visualized with the fluorescent dye Alexa 568 that was included in the whole-cell solution (n = 25 neurons) (Fig. 6A). Responses to synaptic stimulation could often be observed when the stimulation electrode was placed within 10-15 μm of identified dendrites. In voltage clamp, dendritic stimulation sites at a distance <250 μm from the soma that resulted in spike responses always showed EPSCs when the holding potential was hyperpolarized below spike threshold (n = 14) (Fig. 6A). The threshold holding potential at which spike escape occurred was often close to the threshold for spike initiation in current clamp, but was 5-10 mV below this value in some cases. In current clamp, these stimulation distances from the soma resulted in EPSPs when a negative bias current was given to hyperpolarize the cell, and in a spike response when the cell was more depolarized (n = 8). The spike peak after stimulation at depolarized membrane potentials occurred commonly at 0.8-1.5 msec after the stimulation pulse, which was similar to the latency of the EPSP onset at more hyperpolarized potentials. The timing of spikes at the onset of EPSPs in the soma suggests that the spike was triggered locally at the site of stimulation, where the depolarization is expected to be more rapid. Stimulation sites beyond 250 μm from the recording site at the soma in voltage clamp at very hyperpolarized potentials either showed small EPSC components (n = 6) or no subthreshold EPSC (n = 6) (Fig. 6B). For these distal sites, spike escape occurred at more-hyperpolarized holding potentials that could reach 40 mV below the spike threshold seen in current clamp (Fig. 6B). In current clamp, these distal sites led to delayed small or indiscriminable EPSPs at very hyperpolarized membrane potentials, and to spike responses at potentials of -65 to -70 mV, which was far negative to the threshold of spontaneous spikes measured as -43.4 ± 3.5 mV (n = 10 neurons). These results indicate that excitatory inputs to GP dendrites >250 μm from the soma are electrotonically too distant to generate measurable subthreshold responses in the soma, but readily evoke dendritic spikes at negative potentials. GP dendrites commonly extend >500 μm in length, and in morphological measurements from biocytin-filled neurons from our slice recordings (n = 7), we found that 36 ± 7% of the dendritic tree was distal to 300 μm and 49 ± 7% was distal to 250 μm, indicating that a substantial proportion of inputs to GP neurons is likely to be too remote to influence the soma without eliciting a regenerative potential.
Figure 6.

Synaptic stimulation of visualized dendrites. Neurons were recorded using an intracellular solution containing Alexa Fluor 568, and visualized dendrites were followed to distal regions, allowing placement of stimulation electrodes (see Materials and Methods). A1, B1, The morphology of recorded neurons obtained after histological processing of biocytin fills. The placement of somatic recording electrodes and stimulation electrodes is illustrated. Main dendritic branches that were not stimulated are truncated (indicated with perpendicular lines). A2, B2, Images of stimulation electrodes and dendrites (boxed area from A1 and B1) obtained with fluorescence imaging during recording. The stimulation site in A showed subthreshold EPSCs at hyperpolarized potentials in the somatic voltage clamp, whereas the more distal stimulation site in B showed no subthreshold EPSCs. A3, B3, CNQX and AP-5 were pressure-applied from the stimulation electrode along with rhodamine to allow visualization of the glutamate receptor antagonist application (see Materials and Methods). Antagonist application eliminated the responses completely. Responses fully recovered after 2-15 sec (data not shown). C, Voltage-clamp recordings of responses to glutamate application. The arrow indicates the onset of a 5 msec glutamate application to a dendritic site ∼250 μm from the soma. Absolute current levels for different holding potentials are offset for clarity. D, Current-clamp recordings of glutamate responses in the same neuron. Note the action potentials initiated when the somatic Vm was far below spike threshold. Scale bars: (in A1) A1, B1, 0.1 mm; (in A2) A2, A3, B2, B3, 10 μm.
Control experiments were undertaken to exclude possible artifactual stimulation results. To exclude nonsynaptic direct electrical stimulation of dendrites or axons as a mechanism of action potential initiation, we repeated the stimulation after puffing a small amount of the glutamate receptor blockers CNQX and AP-5 near the dendrite via the stimulation electrode (n = 5). After a puff of blockers, stimulation-elicited action potentials and subthreshold responses were transiently abolished for a few seconds (Fig. 6A,B). When stimulation fluid without blockers was puffed at a dendrite in the same manner, the response remained (n = 2). To further ensure that local glutamate excitability of dendrites was the cause of spike initiation, visualized dendrites were exposed to local puffs of glutamate via the stimulation electrode of 5-50 msec duration (n = 7). These glutamate puffs led to prolonged subthreshold inward current in the soma at all stimulation distances, including sites >300 μm. This finding is in agreement with the temporal filtering properties of dendrites that allow slow currents elicited with glutamate application to pass to the soma but filter out the fast EPSCs expected with synaptic transmission. Spikes escaped from the glutamate-elicited dendritic EPSCs even at somatic holding potentials far below the threshold of spontaneous spikes (Fig. 6C). Current-clamp recordings during dendritic glutamate application also showed action potential initiation even when a bias current hyperpolarized the soma 20 mV below this somatic spike threshold (Fig. 6D). These findings are easily explained by a local dendritic synaptic depolarization that leads to dendritic spike initiation, because voltage gradients can readily develop in thin dendrites even when the soma is voltage-clamped far below spike threshold. To support this conclusion further, a final set of control experiments used dual somatic whole-cell recordings to eliminate the possibility that the current-passing electrode measured membrane potential (Vm) incorrectly during voltage clamp, or that the other side of the soma (which frequently has an elongated shape in GP) might show a pronounced voltage escape. The maximal voltage deflection found at opposite ends of the soma was 5 mV, either when actual synaptic stimulation was performed or when simulated EPSCs were injected with one of the two electrodes (n = 2). In our recordings in which synapses were activated with stimulation along the dendrites, spikes were elicited even at somatic holding potentials as hyperpolarized as -80 mV (Fig. 5). Therefore, a voltage escape of 5 mV is far too small to allow the soma to reach threshold in these recordings. Because axons of GP neurons originate from the soma or main dendrites close to the soma (Park et al., 1982; Cooper and Stanford, 2000), axonal spike initiation near the soma can be excluded in the action potential generation we observed for events with no or small subthreshold responses. In fact, the only condition not leading to action potential generation in voltage-clamp was stimulation close to the soma that elicited maximal EPSC sizes (Fig. 5A). Axonal spike initiation with a low-voltage threshold could be expected if one inadvertently stimulated distal axonal sites (e.g., in a network of collaterals). However, this was definitely not the case in our visualized recordings, because the patch pipettes stimulated only a very small area close to a visualized dendrite, whereas no axonal branches were seen in the vicinity. In fact, axons of GP neurons run primarily orthogonal to the frontal orientation of slices used in our study (Kita and Kitai, 1994; Nambu and Llinas, 1997), and are thus likely transected close to the root in our preparation. We did, indeed, frequently observe a transected process at the surface of the slice close to the soma, which could easily be the axon. However, it was not possible to differentiate an axon from a dendrite over a distance of only 10-50 μm at a near vertical orientation.
A final set of control experiments was undertaken to address the possibility that dendrites were made hyperexcitable by blocking all background inhibition with picrotoxin. Additional recordings were obtained in the absence of picrotoxin and electrical or glutamate stimulation were applied (n = 16 cells). In all cases tested, glutamate puffs directed at visualized dendrites at distances of 50-300 μm from the soma via a patch pipette led to robust spike responses in current clamp as well as in voltage clamp at holding potentials well below spontaneous escape (n = 6). Electrical stimulation at visualized dendritic sites led to a variable mix of inhibitory and excitatory responses, but in six cells a stimulation site producing mainly excitation was found. These sites at 80-300 μm from the soma produced spike responses in current clamp and voltage clamp indistinguishable from spiking observed in the presence of picrotoxin. Therefore, we can exclude that dendrites were made hyperexcitable by the presence of picrotoxin.
Function of sodium channel clustering at excitatory synapses
The physiological finding that dendritic action potentials in GP neurons can be triggered even by excitatory inputs too small to elicit subthreshold events at the soma is likely to be linked to the anatomical finding that sodium channels exhibit an increased density at excitatory synapses. To examine the specific consequences of a clustered sodium channel distribution, we used computer simulations of a compartmental GP neuron (Fig. 7) (see Materials and Methods). First, using experimentally constrained values for internal and membrane resistivities, a model neuron with AMPA-type synapses along the dendrite was able to replicate the experimental amplitude distribution of subthreshold responses to excitatory inputs. In particular, distal inputs fully attenuated before reaching the soma (Fig. 7A).
Figure 7.
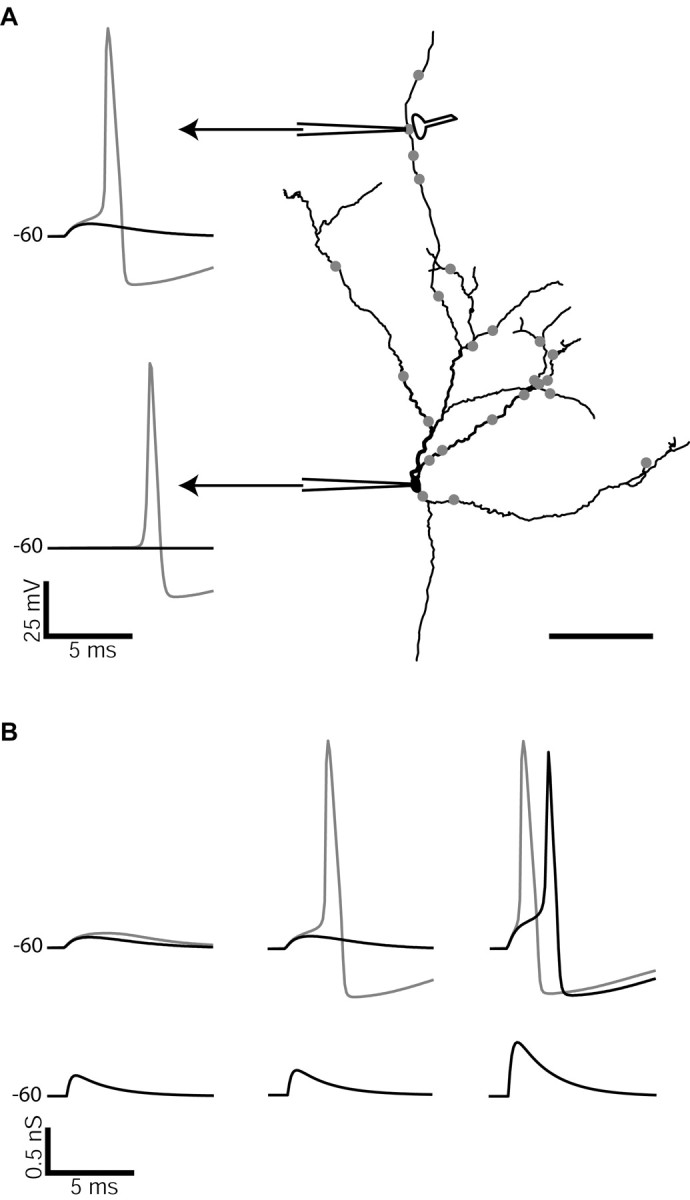
The comparison of synaptic responses with and without synaptic sodium channel clusters in a model GP neuron. A, The morphology of the model is shown with sites of excitatory input indicated by filled gray circles. Simultaneous voltage traces are shown from the indicated site of synaptic input as well as from the soma. Black traces indicate voltage responses in the uniform model and gray traces in the clustered model. B, Voltage responses (top) at the distal site of synaptic input to different sizes of synaptic input (bottom). A peak synaptic conductance of 250 pS (left) led to subthreshold EPSPs in both the uniform and clustered models. At 300 pS (middle) the clustered model fired an action potential, whereas only a subthreshold EPSP was seen in the uniform model (also shown in A). Only when the synaptic conductance was increased to at least 650 pS (right) did the uniform model also initiate an action potential. In this example the level of sodium channel clustering at the illustrated distal input site was 30-fold. Scale bar, 0.1 mm.
Although our immunogold study showed a statistically significant average sixfold increase of sodium channel density at excitatory synapses, these data do not reveal the absolute level of channel density at individual synapses because of the low sensitivity of the immunogold technique. Thus, the anatomical findings are ambiguous with respect to the variability of sodium channel density between synapses. The immunogold analysis is equally compatible with a uniform sixfold increase of sodium channel density at all excitatory synapses, or a much higher level of clustering at a subset of synapses, whereas other synapses do not show any increase in density. To explore the likely consequences of the possible variability in synaptic clustering, we used the model to determine the properties of dendritic spike initiation with average sodium channel conductance levels at compartments receiving excitatory input being either uniformly six times higher than in nonsynaptic dendritic compartments, or by generating a single special input site with up to 60 times the baseline sodium channel density. A model with uniform sodium density of 2 nS/μm2 in soma and all dendritic compartments was used as a baseline to determine the effect of clustering. The sodium conductance in the soma was maintained at this density in the clustered models also, but the baseline dendritic conductance was reduced to 1.46-1.58 nS/μm2 to maintain the same total sodium conductance in the model in the presence of 27 cluster sites. It should be noted that the model was not constructed to contain all physiological conductances of GP neurons, but to isolate the effect of dendritic sodium channel density on spike initiation in a morphologically realistic model. Thus, the only conductance that was clustered was the sodium conductance, and the only other voltage-gated conductance present was a delayed rectifier required in the repolarization of action potentials.
We examined the effect of different levels of sodium channel clustering at our distal sample synapse on the size of synaptic input needed to elicit a dendritic spike in comparison with a uniform sodium channel distribution (Figs. 7, 8). Figure 7 illustrates the findings using the example of input at an isolated cluster with 30 times synaptic sodium channel density. When a simulated AMPA synapse with a 300 pS peak conductance (corresponding to a 18 pA peak current at -60 mV) was activated at this site, it created only a subthreshold response in the uniform model, but a dendritic action potential was triggered in the model with 30 times clustering (Fig. 7A). As seen in the experimental data with current-clamp recordings (Figs. 5, 6), the spike propagated in full size to the soma. When the peak synaptic conductance was lowered to 250 pS, action potential initiation failed even in the model with clustering, whereas an increase in peak conductance to 650 pS was needed to allow the uniform model to trigger a dendritic action potential (Fig. 7B). Thus, overall, the clustering of sodium channels at the synapse lowered the threshold of EPSC amplitude needed to trigger a dendritic action potential compared with a uniform distribution, whereas strong inputs could elicit dendritic spikes in all conditions. All cluster levels examined resulted in a lowering of the threshold amplitude, with a 23% decrease in synaptic amplitude needed to trigger a spike already occurring at a cluster level of six times.
We quantified the decrease of peak EPSC amplitude needed to trigger an action potential with different clustering levels in comparison with a uniform sodium channel distribution for physiological parameters likely to have an impact on this measurement (Fig. 8). First, the total sodium conductance density in the dendritic tree is an important parameter in dendritic spike initiation. Because the limitations of pre-embedding immunocytochemistry prevent measurements of the absolute levels of proteins, we could not derive this parameter from our EM study. Thus, the facilitation of dendritic spike initiation by sodium channel clustering was examined using several different levels of total dendritic sodium conductance (Fig. 8A). The results show that sodium channel clustering significantly decreases the threshold EPSC amplitude, triggering a spike for all levels of sodium conductance, but that the effect is enhanced at higher levels. For all levels of sodium conductance examined, the threshold EPSC amplitude to trigger spikes at a cluster density of ≥6 times remained between 0.1 and 0.6 nS, indicating that dendritic spike initiation is a robust phenomenon across a wide range of sodium channel densities. We performed additional simulations with a “hot” soma, using up to 100-fold increases in the somatic sodium channel density. The presence of a hot soma did not alter the initiation of dendritic action potentials or the role of clustering at distal synaptic inputs, because the soma was too electrotonically distant to be significantly depolarized by subthreshold inputs.
A parameter of great significance in triggering and conducting dendritic action potentials in vivo is the specific RM. A decrease in RM allows synaptic and spike currents to be shunted, and thus tends to impede spike initiation. In vivo, RM fluctuates greatly from moment to moment because of the opening and closing of synaptic and voltage-gated conductances. In GP, a pronounced contribution to these fluctuations likely derives from continuous inhibitory inputs caused by massive innervation from the striatum as well as from GP collaterals (Shink and Smith, 1995; Smith et al., 1998). In addition, activation of additional voltage-gated channels, including Ih and a variety of potassium channels in GP neurons (Cooper and Stanford, 2000), not included in our simplified model likely also contribute to these fluctuations in RM. Varying RM in the model indicated that sodium channel clustering was more effective in enhancing dendritic spike initiation with low values of RM (Fig. 8B). Again, overall spike initiation was robust, and always occurred for threshold EPSC peak amplitudes below 0.6 nS for models with clustered sodium channels.
The Vm at the time of synaptic input is expected to have a significant influence on reaching spike threshold with an EPSC of a given size. The most convenient method to vary Vm uniformly in the model was to set a different leak reversal potential (Eleak) in different simulations, which in the absence of other currents leads to a matching shift in the stable resting Vm. We found that clustering facilitated dendritic spikes at all membrane potentials, but that the effect was most dramatic when Vm was close to spike threshold when the input occurred (Fig. 8C). Because GP neurons have intrinsic pacemaker currents and show fast spike rates in vivo, a value of Vm close to spike threshold would be expected to be common, and sodium channel clustering would be most effective in this condition. The threshold peak conductance required to trigger a spike increased between -58 and -75 mV for each cluster level, and had a value of 1 nS at -75 mV for a cluster level of 30.
The observation that sodium channel clustering at synapses facilitates dendritic spike initiation indicates that there is some degree of electrical isolation of sites of excitatory input relative to other portions of the dendrite. Because specific RA is a major determinant of the degree of electrical isolation of different parts of a neuron, the behavior of the model was examined over a range of RA values (Fig. 8B). The importance of clustering in facilitating dendritic spike initiation was maintained over the full range of possible RA values, including the value of RA determined by fitting the passive model to physiological responses to somatic current injection (see Materials and Methods). When RA was increased from 1 to 3 Ωm, the threshold EPSC amplitudes decreased approximately twofold because of the increase of local EPSP amplitudes with the increase in local input resistance. However, at high values of RA and low values of sodium channel density and/or membrane resistivity, action potential propagation could fail at branch points (data not shown).
Although our anatomical data showed that only 2% of the membrane area was devoted to asymmetric synapses, these data do not preclude that sodium channels are also clustered in the membrane in the immediate vicinity of asymmetric synapses. Our default simulation included sodium clusters in 5% of all compartments, which account for close to 5% of the total membrane area. Thus, this distribution assumes some sodium channel clustering within the synaptic compartment, but outside of the postsynaptic density. We determined the effect of membrane area devoted to sodium channel clusters on spike threshold by adjusting the length (and therefore the surface area) of compartments containing such clusters within a range of 0.2-2.0 times the default, thus leading to 1-10% of total membrane area with clusters (Fig. 8D). These simulations show that the amount of threshold reduction effected by clustering linearly increases with cluster area for low cluster levels, and supralinearly for high cluster levels. In effect, there is a direct tradeoff between cluster level and cluster area, indicating that the total amount of sodium conductance in a cluster determines the amount of threshold EPSC reduction present.
The specific kinetics of the model sodium channel are likely important to the observed enhancement of dendritic action potential initiation caused by channel clustering. In particular, the slope of the voltage dependence of steady-state activation (m∞) affects the amount of subthreshold current flow during depolarization before an all-or-none action potential is triggered. Therefore, we examined how the observed threshold reduction with the standard channel changed as a function of the slope of the m∞ voltage dependence while the half-activation voltage remained constant. The original 5-95% voltage activation range of the Traub channel was -48.5 to -7 mV. Our factor of 1.5× slope adjustment led to a 5-95% activation range of -58 to 4 mV, and the factor of 0.5× resulted in a range of -39 to -18 mV. We found that shallower activation slopes (factors of 1.25× or 1.5×) led to spontaneous spiking at our standard leak reversal potential of -60 mV. Therefore, we used a leak-reversal potential of -70 mV to examine the reduction of threshold EPSC amplitude as a function of Na channel kinetics. The results show that the threshold EPSC amplitude to trigger a spike is much reduced when the slope of the Na activation function is shallow, and is increased for steeper than default slopes (Fig. 8E). In contrast, variations of the same magnitude in the steady-state inactivation slope (h∞) or the time constants of activation or inactivation (τm and τh) led to maximum changes in threshold EPSC amplitude of only a few percentage points for all levels of clustering.
EPSPs spread from the site of synaptic input along the dendritic tree for some distance. Thus, it seems likely that even a synapse without a sodium channel cluster located close to another synapse with a cluster could exhibit facilitated initiation of dendritic spikes. This effect was quantified by moving the site of synaptic input to various distances along the dendrite from the site of a sodium channel cluster (Fig. 8F). This analysis showed that stronger clustering resulted in an influence of the cluster on spike initiation over greater distances along the dendrite. Thus, a cluster of sodium channels at a synapse not only enhances spike initiation at that synapse, but to a lesser degree, the cluster also acts as a hot spot that can enhance the initiation of spikes in response to the activation of nearby inputs.
Discussion
The majority of excitatory inputs to GP neurons originates from the STN, and a strong inhibitory output pathway from GP, in turn, feeds back onto STN. The GP-STN circuit has been under intense scrutiny recently, because deep-brain stimulation in the STN has become a successful treatment for Parkinson's disease. In anesthetized rats, GP and STN can show coupled bursting that is increased after 6-OHDA lesions (Magill et al., 2000, 2001), an effect that is dependent on input from the cortex to STN. In fact, the corticosubthalamopallidal flow of information has received increased attention by several investigators (Kita, 1994; Nambu et al., 2000; Urbain et al., 2000). In this context, it remains puzzling that STN inputs to GP provide <10% of synapses on GP neurons, and most of these synapses make contacts onto thin extended dendrite sites (Falls et al., 1983; Kita and Kitai, 1987; Shink and Smith, 1995). Our present results provide an important contribution to the understanding of this system, indicating that STN input onto GP could provide a strong control of GP spiking via direct dendritic spike initiation that is made possible by sodium channel clusters at excitatory synapses. Although dendritic spike initiation with strong synaptic inputs has been shown in other types of neurons, the present study is the first to demonstrate specific clustering of sodium channels at excitatory synapses. As a consequence of this phenomenon, small distal excitatory inputs are transmitted to the soma only by dendritic spike initiation.
Localization of sodium channels
The main finding of the immunocytochemical localization of sodium channels was the enhanced level of labeling at the postsynaptic densities of excitatory synapses. The specificity of the antibodies used in the present study was confirmed by preabsorption controls, the absence of dendritic staining in Nav1.6 null mutants, as well as the specific differential pattern of localization of each sodium channel isoform within different types of axons (Fig. 2). One previous study has described examples of dendritic labeling at synapses in neurons of cerebellum and the cerebral cortex using peroxidase labeling of Nav1.6 (Caldwell et al., 2000). However, the present study provides the first quantitative description of preferential sodium channel labeling at synapses using the high-resolution immunogold technique.
Dendritic spikes triggered by distal synaptic input
The main findings of our in vitro whole-cell recordings is that GP neurons can initiate dendritic action potentials in response to excitatory synaptic inputs. Furthermore, excitatory inputs located >250 μm distal from the soma showed only very small or no subthreshold EPSCs or EPSPs, indicating that distal spike initiation was the only effective mode of transmitting information to the soma for excitatory synaptic sites on approximately half of the dendritic tree. The predominant view of action potential initiation and propagation in many types of neurons is that action potentials are first initiated in the axon or soma and then actively propagate into the dendrites (Stuart and Sakmann, 1994; Hausser et al., 1995; Spruston et al., 1995; Stuart et al., 1997). However, recent studies have demonstrated that strong, synchronous synaptic inputs can also elicit action potentials in the dendrites, which then propagate forward to the soma (Chen et al., 1997; Golding and Spruston, 1998; Schwindt and Crill, 1998; Hausser et al., 2000; Martina et al., 2000). GP neurons provide an interesting contrast to pyramidal neurons in that each main dendrite of GP neurons exhibits much less branching and receives only sparse excitation, greatly limiting the potential for spatial summation of excitatory inputs in the distal dendrites. Our results indicate that these neurons have developed a mode of integration by which even small excitatory inputs can trigger dendritic spikes. The elimination of dendritic spike responses to stimulation by the application of glutamate receptor antagonists to a section of dendrite only 10-30 μm long, and the loss of synaptic responses when the stimulation electrode was moved by as little as 10 μm, indicates that activation of only very few presynaptic fibers can trigger dendritic spikes in GP neurons. However, these data do not exclude the possibility that a low threshold of action potential generation at the soma or in the initial segment of the axon may be an important mechanism of spike generation in response to proximal inputs or caused by intrinsic pacemaker currents. Nevertheless, the finding that almost half of all excitatory inputs on a GP neuron are likely to be attenuated too much to cause a detectable subthreshold EPSP at the soma suggests that dendritic spiking is likely to be a dominant mode of excitatory input processing in GP. Although we did not investigate the cause of synaptic attenuation, our model indicated that the electrotonic distance of a synapse located >300 μm from the soma on a thin dendrite is sufficient to account for nearly full attenuation. In addition, filtering processes such as shunting by an activated Ih conductance (Magee, 1998) could further attenuate EPSPs before they reach the soma. It remains to be determined, however, whether a single input is sufficient to trigger a spike, or whether a small synchronous burst of inputs is required. In addition, our methods did not let us determine the spatial layout of dendritic initiation sites, which could be quite punctate based on the presence of sodium channel clusters at excitatory synapses. The presence of unresponsive stimulation sites suggests that not all areas of GP dendrites may trigger spikes. Although we could not constrain these variables with our physiological methods, we could determine the functional consequences within a plausible range of sodium channel distributions in computer simulations.
Synaptic clustering of sodium spikes facilitates spike initiation
The main finding from our model GP neuron is that the threshold amplitude of a synaptic conductance needed to trigger a dendritic spike is substantially less when sodium channels are clustered at excitatory synapses than when they are distributed uniformly. This effect is robust for variations in membrane resistance, axial resistance, and the density of clusters. Our finding that a shallow slope of the steady-state activation function of simulated Na channels greatly enhances dendritic spike initiation with synaptic input suggests that Na current in GP dendrites may have a significant subthreshold component to allow spike initiation. The size of EPSCs needed to trigger action potentials in the model was well within the range of the average size of 0.5 nS peak conductance that we have measured for proximal inputs in vitro (Hanson and Jaeger, 2002). The focal stimulation with patch pipettes also used in our previous study in conjunction with the sparse excitatory innervation of GP neurons suggest that this amplitude of synaptic conductance corresponds to few synaptic inputs. If single inputs at distal dendritic sites have amplitudes between 0.5 and 0.05 nS, they would fall precisely into the range that triggers spikes in our model when the membrane potential is 2-15 mV below spike threshold. This suggests that dendritic action potential generation may depend on depolarization caused by previous inputs or by intrinsic conductances. The significance of such a context could be enhanced by a depolarization-dependent NMDA component in synaptic responses, which was not addressed by the present study using isolated inputs at hyperpolarized potentials. It should also be noted that additional active currents in GP neurons not present in our simplified model are likely to further shift the values of threshold synaptic conductances needed to trigger dendritic spikes.
Functional considerations
It is generally accepted that GP neurons are potently controlled by massive inhibitory inputs from the striatum as well as by local inhibitory collaterals. Recent studies have demonstrated that inhibitory inputs can restrict the propagation of action potentials in dendrites (Tsubokawa and Ross, 1996; Xiong and Chen, 2002). In addition, our model demonstrates that the initiation of dendritic spikes is impeded by shunting when RM is low. Thus, the finding that typical EPSC amplitudes may fall right around the threshold for spike initiation allows for a rich computational substrate of interactions between inhibition and excitation. Studies using dynamic clamping (Jaeger and Bower, 1999; Gauck and Jaeger, 2000) suggest that shunting is a major mechanism by which the subthreshold membrane potential is controlled, and that this potential reflects the relative balance between excitation and inhibition. The dendritic spike initiation supported by the present results indicates that this balance between excitation and inhibition may not be globally effective but could control the initiation of spikes in each dendrite of GP neurons.
Short-term plasticity of excitatory inputs to GP includes facilitation and depression (Hanson and Jaeger, 2002). The finding that sufficiently large EPSCs can trigger dendritic spikes, could enhance the significance of this short-term plasticity because a nonlinear relationship between EPSC size and somatic responses is introduced. Short bursts of STN inputs provide maximal facilitation, and might thus allow inputs that would be subthreshold during low-frequency presynaptic activity to trigger dendritic spikes. Long-term plasticity mechanisms may also interact with dendritic spikes, because high-voltage-activated calcium channels are enriched in distal dendrites of GP neurons (Hanson and Smith, 2002). Such a calcium signal has been shown to mediate the induction of long-term synaptic potentiation in other types of neurons (Magee and Johnston, 1997). Lastly, one might speculate that the observed heterogeneity of sodium channel clustering at excitatory synapses may originate from activity- or dopamine- (Cantrell and Catterall, 2001; Maurice et al., 2001) dependent regulation of sodium channel densities. Such changes in sodium channel density could be involved in long-term plasticity mechanisms that contribute to STN-GP activity patterns.
Footnotes
This work was supported by National Institutes of Health Grants NS39852, RR00165, and MH12999. We thank Jean-François Paré and Lisa Kreiner for technical assistance, Jeremy Edgerton for helping with control experiments, and Ronald Calabrese, Michael Crutcher, Hitoshi Kita, and Christopher Muly for helpful comments on this work. The Scn8a null mutant and control mouse brains were a gift from Leslie Sprunger.
Correspondence should be addressed to Dr. Dieter Jaeger, Department of Biology, Emory University, 1510 Clifton Road, Atlanta, GA 30322. E-mail: djaeger@emory.edu.
Copyright © 2004 Society for Neuroscience 0270-6474/04/240329-12$15.00/0
References
- Beckh S, Noda M, Lubbert H, Numa S (1989) Differential regulation of three sodium channel messenger RNAs in the rat central nervous system during development. EMBO J 8: 3611-3616. [DOI] [PMC free article] [PubMed] [Google Scholar]
- Bevan MD, Magill PJ, Terman D, Bolam JP, Wilson CJ (2002) Move to the rhythm: oscillations in the subthalamic nucleus-external globus pallidus network. Trends Neurosci 25: 525-531. [DOI] [PubMed] [Google Scholar]
- Boiko T, Rasband MN, Levinson SR, Caldwell JH, Mandel G, Trimmer JS, Matthews G (2001) Compact myelin dictates the differential targeting of two sodium channel isoforms in the same axon. Neuron 30: 91-104. [DOI] [PubMed] [Google Scholar]
- Caldwell JH, Schaller KL, Lasher RS, Peles E, Levinson SR (2000) Sodium channel Na(v)1.6 is localized at nodes of Ranvier, dendrites, and synapses. Proc Natl Acad Sci USA 97: 5616-5620. [DOI] [PMC free article] [PubMed] [Google Scholar]
- Cantrell AR, Catterall WA (2001) Neuromodulation of Na+ channels: an unexpected form of cellular plasticity. Nat Rev Neurosci 2: 397-407. [DOI] [PubMed] [Google Scholar]
- Chen WR, Midtgaard J, Shepherd GM (1997) Forward and backward propagation of dendritic impulses and their synaptic control in mitral cells. Science 278: 463-467. [DOI] [PubMed] [Google Scholar]
- Cooper AJ, Stanford IM (2000) Electrophysiological and morphological characteristics of three subtypes of rat globus pallidus neurone in vitro. J Physiol (Lond) 527: 291-304. [DOI] [PMC free article] [PubMed] [Google Scholar]
- DeLong MR (1971) Activity of pallidal neurons during movement. J Neurophysiol 34: 414-427. [DOI] [PubMed] [Google Scholar]
- Falls WM, Park MR, Kitai ST (1983) An intracellular HRP study of the rat globus pallidus. II. Fine structural characteristics and synaptic connections of medially located large GP neurons. J Comp Neurol 221: 229-245. [DOI] [PubMed] [Google Scholar]
- Gauck V, Jaeger D (2000) The control of rate and timing of spikes in the deep cerebellar nuclei by inhibition. J Neurosci 20: 3006-3016. [DOI] [PMC free article] [PubMed] [Google Scholar]
- Goldin AL (1999) Diversity of mammalian voltage-gated sodium channels. Ann NY Acad Sci 868: 38-50. [DOI] [PubMed] [Google Scholar]
- Goldin AL (2001) Resurgence of sodium channel research. Annu Rev Physiol 63: 871-894. [DOI] [PubMed] [Google Scholar]
- Golding NL, Spruston N (1998) Dendritic sodium spikes are variable triggers of axonal action potentials in hippocampal CA1 pyramidal neurons. Neuron 21: 1189-1200. [DOI] [PubMed] [Google Scholar]
- Golding NL, Kath WL, Spruston N (2001) Dichotomy of action-potential backpropagation in CA1 pyramidal neuron dendrites. J Neurophysiol 86: 2998-3010. [DOI] [PubMed] [Google Scholar]
- Hanson JE, Jaeger D (2002) Short-term plasticity shapes the response to simulated normal and Parkinsonian input patterns in the globus pallidus. J Neurosci 22: 5164-5172. [DOI] [PMC free article] [PubMed] [Google Scholar]
- Hanson JE, Smith Y (2002) Subcellular distribution of high-voltage-activated calcium channel subtypes in rat globus pallidus neurons. J Comp Neurol 442: 89-98. [DOI] [PubMed] [Google Scholar]
- Hausser M, Stuart G, Racca C, Sakmann B (1995) Axonal initiation and active dendritic propagation of action potentials in substantia nigra neurons. Neuron 15: 637-647. [DOI] [PubMed] [Google Scholar]
- Hausser M, Spruston N, Stuart GJ (2000) Diversity and dynamics of dendritic signaling. Science 290: 739-744. [DOI] [PubMed] [Google Scholar]
- Jaeger D, Bower JM (1999) Synaptic control of spiking in cerebellar Purkinje cells: dynamic current clamp based on model conductances. J Neurosci 19: 6090-6101. [DOI] [PMC free article] [PubMed] [Google Scholar]
- Jaeger D, Gilman S, Aldridge JW (1993) Primate basal ganglia activity in a precued reaching task: preparation for movement. Exp Brain Res 95: 51-64. [DOI] [PubMed] [Google Scholar]
- Kita H (1994) Physiology of two disynaptic pathways from the sensorimotor cortex to the basal ganglia output nuclei. In: The basal ganglia IV (Percheron G, ed), pp 263-276. New York: Plenum.
- Kita H, Kitai ST (1987) Efferent projections of the subthalamic nucleus in the rat: light and electron microscopic analysis with the PHA-L method. J Comp Neurol 260: 435-452. [DOI] [PubMed] [Google Scholar]
- Kita H, Kitai ST (1994) The morphology of globus pallidus projection neurons in the rat: an intracellular staining study. Brain Res 636: 308-319. [DOI] [PubMed] [Google Scholar]
- Magee JC (1998) Dendritic hyperpolarization activated currents modify the integrative properties of hippocampal CA1 pyramidal neurons. J Neurosci 18: 7613-624. [DOI] [PMC free article] [PubMed] [Google Scholar]
- Magee JC, Johnston D (1997) A synaptically controlled, associative signal for Hebbian plasticity in hippocampal neurons. Science 275: 209-213. [DOI] [PubMed] [Google Scholar]
- Magill PJ, Bolam JP, Bevan MD (2000) Relationship of activity in the subthalamic nucleus-globus pallidus network to cortical electroencephalogram. J Neurosci 20: 820-833. [DOI] [PMC free article] [PubMed] [Google Scholar]
- Magill PJ, Bolam JP, Bevan MD (2001) Dopamine regulates the impact of the cerebral cortex on the subthalamic nucleus-globus pallidus network. Neuroscience 106: 313-330. [DOI] [PubMed] [Google Scholar]
- Martina M, Vida I, Jonas P (2000) Distal initiation and active propagation of action potentials in interneuron dendrites. Science 287: 295-300. [DOI] [PubMed] [Google Scholar]
- Maurice N, Tkatch T, Meisler M, Sprunger LK, Surmeier DJ (2001) D1/D5 dopamine receptor activation differentially modulates rapidly inactivating and persistent sodium currents in prefrontal cortex pyramidal neurons. J Neurosci 21: 2268-2277. [DOI] [PMC free article] [PubMed] [Google Scholar]
- Nambu A, Llinas R (1997) Morphology of globus pallidus neurons: its correlation with electrophysiology in guinea pig brain slices. J Comp Neurol 377: 85-94. [PubMed] [Google Scholar]
- Nambu A, Tokuno H, Hamada I, Kita H, Imanishi M, Akazawa T, Ikeuchi Y, Hasegawa N (2000) Excitatory cortical inputs to pallidal neurons via the subthalamic nucleus in the monkey. J Neurophysiol 84: 289-300. [DOI] [PubMed] [Google Scholar]
- Park MR, Falls WM, Kitai ST (1982) An intracellular HRP study of the rat globus pallidus. I. Responses and light microscopic analysis. J Comp Neurol 211: 284-294. [DOI] [PubMed] [Google Scholar]
- Plenz D, Kitai ST (1999) A basal ganglia pacemaker formed by the subthalamic nucleus and external globus pallidus. Nature 400: 677-682. [DOI] [PubMed] [Google Scholar]
- Rall W (1995) In: The theoretical foundation of dendritic function (Segev I, Rinzel J, Shepherd GM, eds), pp 122-146. Cambridge, MA: MIT.
- Raman IM, Sprunger LK, Meisler MH, Bean BP (1997) Altered subthreshold sodium currents and disrupted firing patterns in Purkinje neurons of Scn8a mutant mice. Neuron 19: 881-891. [DOI] [PubMed] [Google Scholar]
- Schwindt PC, Crill WE (1998) Synaptically evoked dendritic action potentials in rat neocortical pyramidal neurons. J Neurophysiol 79: 2432-2446. [DOI] [PubMed] [Google Scholar]
- Segev I, London M (2000) Untangling dendrites with quantitative models. Science 290: 744-750. [DOI] [PubMed] [Google Scholar]
- Shink E, Smith Y (1995) Differential synaptic innervation of neurons in the internal and external segments of the globus pallidus by the GABA- and glutamate-containing terminals in the squirrel monkey. J Comp Neurol 358: 119-141. [DOI] [PubMed] [Google Scholar]
- Smith Y, Bevan MD, Shink E, Bolam JP (1998) Microcircuitry of the direct and indirect pathways of the basal ganglia. Neuroscience 86: 353-387. [DOI] [PubMed] [Google Scholar]
- Spruston N, Jaffe DB, Williams SH, Johnston D (1993) Voltage- and space-clamp errors associated with the measurement of electrotonically remote synaptic events. J Neurophysiol 70: 781-802. [DOI] [PubMed] [Google Scholar]
- Spruston N, Schiller Y, Stuart G, Sakmann B (1995) Activity-dependent action potential invasion and calcium influx into hippocampal CA1 dendrites. Science 268: 297-300. [DOI] [PubMed] [Google Scholar]
- Stuart G, Spruston N, Sakmann B, Hausser M (1997) Action potential initiation and backpropagation in neurons of the mammalian CNS. Trends Neurosci 20: 125-131. [DOI] [PubMed] [Google Scholar]
- Stuart GJ, Sakmann B (1994) Active propagation of somatic action potentials into neocortical pyramidal cell dendrites. Nature 367: 69-72. [DOI] [PubMed] [Google Scholar]
- Terman D, Rubin JE, Yew AC, Wilson CJ (2002) Activity patterns in a model for the subthalamopallidal network of the basal ganglia. J Neurosci 22: 2963-2976. [DOI] [PMC free article] [PubMed] [Google Scholar]
- Thurbon D, Luscher HR, Hofstetter T, Redman SJ (1998) Passive electrical properties of ventral horn neurons in rat spinal cord slices. J Neurophysiol 79: 2485-2502. [DOI] [PubMed] [Google Scholar]
- Traub RD, Wong RK, Miles R, Michelson H (1991) A model of a CA3 hippocampal pyramidal neuron incorporating voltage-clamp data on intrinsic conductances. J Neurophysiol 66: 635-650. [DOI] [PubMed] [Google Scholar]
- Tsubokawa H, Ross WN (1996) IPSPs modulate spike backpropagation and associated [Ca2+]i changes in the dendrites of hippocampal CA1 pyramidal neurons. J Neurophysiol 76: 2896-2906. [DOI] [PubMed] [Google Scholar]
- Urbain N, Gervasoni D, Souliere F, Lobo L, Rentero N, Windels F, Astier B, Savasta M, Fort P, Renaud B, Luppi PH, Chouvet G (2000) Unrelated course of subthalamic nucleus and globus pallidus neuronal activities across vigilance states in the rat. Eur J Neurosci 12: 3361-3374. [DOI] [PubMed] [Google Scholar]
- Vetter P, Roth A, Hausser M (2001) Propagation of action potentials in dendrites depends on dendritic morphology. J Neurophysiol 85: 926-937. [DOI] [PubMed] [Google Scholar]
- Westenbroek RE, Merrick DK, Catterall WA (1989) Differential subcellular localization of the RI and RII Na+ channel subtypes in central neurons. Neuron 3: 695-704. [DOI] [PubMed] [Google Scholar]
- Williams SR, Stuart GJ (2002) Dependence of EPSP efficacy on synapse location in neocortical pyramidal neurons. Science 295: 1907-1910. [DOI] [PubMed] [Google Scholar]
- Xiong W, Chen WR (2002) Dynamic gating of spike propagation in the mitral cell lateral dendrites. Neuron 34: 115-126. [DOI] [PubMed] [Google Scholar]