

Abstract
The integration of visual information is a critical task that is performed by neurons in the extrastriate cortex of the primate brain. For motion signals, integration is complicated by the geometry of the visual world, which renders some velocity measurements ambiguous and others incorrect. The ambiguity arises because neurons in the early stages of visual processing have small receptive fields, which can only recover the component of motion perpendicular to the orientation of a contour (the aperture problem). Unambiguous motion signals are located at end points and corners, which are referred to as terminators. However, when an object moves behind an occluding surface, motion measurements made at the terminators formed by the intersection of the object and the occluder are generally not consistent with the direction of object motion. To study how cortical neurons integrate these different motion cues, we used variations on the classic “barber pole” stimulus and measured the responses of neurons in the middle temporal area (MT or V5) of extrastriate cortex of alert macaque monkeys. Our results show that MT neurons are more strongly influenced by the unambiguous motion signals generated by terminators than to the ambiguous signals generated by contours. Furthermore, these neurons respond better to terminators that are intrinsic to a moving object than to those that are accidents of occlusion. V1 neurons show similar response patterns to local cues (contours and terminators), but for large stimuli, they do not reflect the global motion direction computed by MT neurons. These observations are consistent with psychophysical findings that show that our perception of moving objects often depends on the motion of terminators.
Keywords: cortex, illusion, striate cortex, vision, visual, MT
Introduction
The primate visual system is remarkably good at measuring the velocity of moving objects. Such measurements are computationally challenging because local velocity measurements often depend on the shape of the object and the geometry of its surroundings. For example, the well known “aperture problem” (Fennema and Thompson, 1979; Adelson and Movshon, 1982; Marr, 1982) results when velocity measurements are made in the neighborhood of an extended edge or contour. In this case, it is possible to measure only the component of velocity that is perpendicular to the orientation of a contour: the velocity measurement is rendered one-dimensional (Fig. 1a). In contrast, two-dimensional features, like end points, corners, and intersections, allow accurate velocity measurements, even on very small spatial scales (Fig. 1a). These features are often called terminators (Shimojo et al., 1989). Mathematically, terminators can be detected based on two-dimensional spatial derivatives (Zetzsche and Barth, 1990) or local curvature (Dobbins et al., 1987).
Figure 1.

Contour and terminator signals. a, When a tilted line moves to the right, the motion signals located along the length of the line are ambiguous because they are equally consistent with an infinite number of actual velocities. In contrast, the motion of the intrinsic terminators found at the end points of the line specifies the correct direction of motion. b, When the line moves behind an occluding surface (gray rectangle), extrinsic terminators are formed at the intersection of the line and the occluder. These signals appear to move downward, although the line is moving rightward. c, When a grating moves behind an elongated aperture, terminators are formed in which the gratings meets the edge of the aperture. Perceptually, the grating appears to slide along the long axis of the aperture.
Of course, visual space is three-dimensional, and this further complicates the interpretation of motion signals. When one object passes behind another, an observer has access only to the two-dimensional retinal projection of the visual scene. On the retina, the points of intersection between the object and the occluder are two-dimensional, but the corresponding motion signals do not coincide with the global motion of the object (Fig. 1b). These features are often referred to as extrinsic terminators (Shimojo et al., 1989), because they do not belong to the object and are instead accidents of occlusion. Perceptually, the visual system appears to use non-motion cues like binocular disparity (Shimojo et al., 1989) and monocular occlusion (Lorenceau and Shiffrar, 1992; Shiffrar et al., 1995; Lidén and Mingolla, 1998) to distinguish extrinsic terminators from terminators that are actually part of the moving object. The latter are referred to as intrinsic terminators.
Perhaps the most famous demonstration of the effect of intrinsic terminators on perception is the “barber pole” illusion (Wallach, 1935; Wuerger et al., 1996), which results when a moving grating is viewed through an invisible rectangular aperture (Fig. 1c). The grating appears to slide along the long axis of the aperture, presumably because of the terminators along the perimeter of the aperture. If depth cues are introduced into the display indicating that the grating is behind the aperture, the visual system then treats these terminators as extrinsic, and the grating appears to move in a direction perpendicular to its orientation (Shimojo et al., 1989; Stoner et al., 1990; Lidén and Mingolla, 1998; Duncan et al., 2000).
To understand how the visual system uses various types of motion signals, we recorded from neurons in the middle temporal area (MT) of alert macaque monkeys. MT is specialized for motion, and many MT neurons are capable of measuring the global direction of object motion, even when conflicting local signals are present (Movshon et al., 1986; Rodman and Albright, 1989; Pack et al., 2001; Pack and Born, 2001). Also, we have recently found that the two-dimensional motion of terminators is faithfully encoded by V1 neurons that exhibit strong surround suppression (Pack et al., 2003). We were, therefore, interested to see how these local two-dimensional motion signals were represented in area MT. Our results suggest that MT neurons treat contour and terminator signals differently, assigning greater weight to terminators than to contour signals, and emphasizing intrinsic over extrinsic terminators.
Materials and Methods
Extracellular recordings. Two adult rhesus macaque monkeys were prepared for chronic MT recording, as described previously (Born et al., 2000). Each animal underwent a magnetic resonance imaging scan to locate MT within the coordinates of a plastic grid inserted into a surgically implanted recording cylinder. MT was then identified on the basis of depth, prevalence of direction-selective neurons, receptive field size, and visual topography. The centers of receptive fields ranged in eccentricity from 3.4 to 19.2°, with a mean eccentricity of 9.5°. Neuronal signals were recorded extracellularly using tungsten microelectrodes (MicroProbe, Potomac, MD) with standard amplification and filtering (BAK Electronics, Mt. Airy, MD). Single units were isolated using a dual time and amplitude window discriminator (BAK Electronics). All procedures were approved by the Harvard Medical Area Standing Committee on Animals.
Visual stimuli. We used stimuli that were designed to create different proportions of contour, intrinsic terminator, and extrinsic terminator motion. The control condition was a grating windowed in a square aperture. The experimental conditions all involved stretching or deforming this aperture (to change the number or direction of intrinsic terminators) or surrounding it with occlusion cues (to render some terminators extrinsic). All stimuli were generated by a personal computer containing a video board (SGT-plus; Number Nine, Cambridge, MA) on a monitor with a pixel size of 0.08° and a refresh rate of 60 Hz. Each neuron was tested with gratings presented in square apertures (4.6° wide), to obtain a baseline direction-tuning curve. Unless stated otherwise, the gratings were square-wave, 0.5 cycles/degree with a duty cycle of 0.5. The luminance of the grating stripes was 13.9 cd/m2, against a background of 0.02 cd/m2. The grating stimuli moved at 10°/sec. Perceptually, this stimulus is multistable (Castet et al., 1999), but the direction-tuning curves, when averaged across trials, were always unimodal and similar to those obtained with random dot fields. The barber pole stimuli consisted of the same grating stimulus described above, but the aperture was a rectangle that could be oriented either vertically or horizontally. For the barber pole stimuli, the angle between the orientation of the aperture and the orientation of the grating was always 45°. In the 3:1 aspect ratio condition, the long axis of the rectangle was 7.2° long, and the short axis was 2.4°. In the 1.5:1 and 5:1 aspect ratio conditions, the total area of the aperture was held constant, whereas the lengths of the sides were adjusted. This led to apertures that were 5.1 × 3.4° and 9.3 × 1.9° for the two conditions. For some cells, we also tested the effect of surrounding the barber pole aperture with a frame. The frame was 0.8° wide and had a luminance of 33.6 cd/m2. In another series of experiments, we used a 3:1 aperture with indentations along the sides. The indented aperture actually consisted of 16 small apertures (0.4 × 2.4°) staggered to give the appearance of a single aperture with 0.4° indentations (see Fig. 8a). For these experiments, the indented aperture and the straight edge aperture contained a grating with a fundamental spatial frequency of 1.5 cycles/degree and a duty cycle of 0.25.
Figure 8.

Effect of aperture shape on barber pole responses in MT neurons. a, The stimulus used for these experiments was a grating windowed in an aperture with aspect ratio 3:1. The aperture had a series of 0.4° indentations that caused the local direction of terminator motion to be perpendicular to the orientation of the grating. b, Rotation of the PD for 37 MT neurons in the straight-edge aperture condition. c, Rotation of the PD for the same 37 MT neurons in the indented-aperture condition.
For the experiments on extrinsic terminators, we used a grating windowed in a square aperture, with long flanking bars on either side of the aperture, to simulate occlusion. The bars were 7.2° long, 0.8° wide, and had a luminance of 33.6 cd/m2. In a second experiment, we reduced the length of the flanking bars to 4.6° (the same length as that of the square aperture).
Procedure. Monkeys were required to fixate a small spot to within 1° to obtain a liquid reward. Fixation was monitored with an eye coil (Robinson, 1963). On each trial, the stimulus appeared and remained stationary for 240 msec, after which it moved for 1 sec at a constant velocity. For the control direction-tuning curves (square apertures), the stimulus moved in one of eight directions on each trial. For the barber pole and occluder experiments, the stimulus moved in one of only four oblique directions. Each stimulus condition was repeated 5–10 times in blockwise random order.
Analysis. For all experiments, direction-tuning curves were generated by averaging spiking responses over bins that were either 40 msec in width (for the time course analyses) or 800 msec in width (for all other analyses). For the time course analyses, we averaged the responses of each cell to all stimulus presentations and smoothed the resulting function by convolving it with a Gaussian (SD, 3 msec). We then determined the response latency as the point at which the firing rate exceeded 2 SDs above the mean prestimulus firing rate. Population averages for the time course analyses were then computed relative to the response latency of each cell. For the time-averaged results, we considered only the sustained portion of the responses of a cell, which we defined to be 200–1000 msec after the onset of stimulus motion. For each 40 msec or 800 msec time bin, the preferred direction (PD) was computed as the vector average of each stimulus direction weighted by the response of a neuron to that direction. The effects of aperture elongation and occlusion cues were then quantified as the extent to which these cues caused the PD to rotate in the clockwise or counterclockwise directions.
Because the PD is expressed in polar (angular) coordinates and our stimulus manipulations were in Cartesian (horizontal/vertical) coordinates, it was necessary to reorganize the data somewhat (Fig. 2). Specifically, for the barber pole experiments, the data can be described in terms of the four different directions of grating contour motion (45, 135, 225, and 315°). This yields two sets of data, one for each aperture orientation. For the vertical aperture, we have the responses V = (V45, V135, V225, V315). Similarly, for the horizontal aperture, we have H = (H45, H135, H225, H315). These were converted to polar coordinates by defining the angle ϕ between the direction of the contour motion and the orientation of the rectangular aperture, measured clockwise from the motion direction. For instance, when the grating contour direction was up and to the left (135°), a vertically oriented aperture would define an angle of ϕ = 45° (Fig. 2a). Similarly, a horizontally oriented aperture would define an angle of ϕ = –45° (Fig. 2b). The tuning curves for the two different ϕ conditions were obtained by collecting all of the corresponding vertical and horizontal aperture configurations at each of the four possible directions of contour motion. Thus, the ϕ = 45° responses were R45 = (H45, V135, H225, V315), and the ϕ = –45° responses were R-45 = (V45, H135, V225, H315). PDs were then calculated as the vector averages of the values in R45 and R-45. To the extent that the neurons responded to motion along the long axis of the aperture, the ϕ = 45° and ϕ = –45° conditions would be expected to introduce counterclockwise and clockwise rotations of the PDs, respectively. The analysis for the experiments with flanking occluders was identical, with vertical flankers corresponding to the horizontal aperture condition and horizontal flankers corresponding to the vertical aperture condition.
Figure 2.

Data analysis. On each trial, the grating moved in one of four oblique directions. In the ϕ = 45° condition (a), the apertures were oriented 45° clockwise from the motion direction. In the ϕ = –45° condition (b), the apertures were rotated 45° counterclockwise from the motion direction. For example, when the motion direction was up and to the left (dotted rectangles), the aperture was oriented vertically in the ϕ = 45° condition and horizontally in the ϕ = –45° condition.
For all stimulus conditions, the angular deviation was calculated as the difference between the PD obtained in the square aperture condition and that obtained in the ϕ = 45° or ϕ = –45° condition. Thus, an angular deviation of 0° corresponded to instances in which the PD was unaffected by the aperture configuration. An angular deviation of 45° corresponded to responses that were completely determined by the component of motion parallel to the orientation of the aperture. There was generally no difference between the magnitudes of the effects of ϕ = 45° and ϕ = –45° stimulus manipulations, so in some cases they were averaged in the presentation of the results.
To describe the effects of aperture orientation, we developed a few simple models, which are described in Results and shown in Figure 5. Briefly, if the responses were unaffected by the orientation of the aperture, then we would predict similar tuning curves in the ϕ = 45° and ϕ = –45° cases. This is referred to as the “contour prediction.” If the neurons responded only to motion along the long axis of the barber pole, then the PDs would rotate by 45° clockwise or counterclockwise, which we call the “long axis prediction.” If the neurons responded to the terminators moving along both the long and short axes of the aperture, but not to the contours, then we can calculate the predicted rotation of the PD as follows. We consider a coordinate system aligned with the direction of contour motion, which we define to be 0° (see Fig. 5). Because the angle between the orientation of the grating and the orientation of the aperture was always 45°, we can describe the direction of terminator motion along the long axis of the grating by the vector  . We use a unit vector because the speed of motion along the long and short axes of the aperture was equal. Thus, motion along the short axis can be described by
  . For a stimulus with an aspect ratio of A, the vector average is (
 ) which simplifies to [
 ]. The predicted angular deviation can then be computed as tan–1[(A – 1)/(A + 1)]. Thus, for aspect ratios of 1.5:1, 3:1, and 5:1, the values of the “terminator average predictions” are 11.3, 26.6, and 33.7°, respectively.
Figure 5.

A few ways to combine contour and terminator signals for a barber pole stimulus with an aperture aspect ratio of 3:1. The direction of motion perpendicular to the orientation of the contour is 0°, by definition. If the neuron responds only to terminator motion along the long axis of the aperture, then the measured motion direction will differ from the contour motion direction by 45°. A vector average or vector sum of only terminator signals (called the terminator average prediction) predicts a deviation of 26.6° from the contour motion direction. An indiscriminate vector average or vector sum of contour and terminator signals would lie somewhere between 0 and 26.6°, depending on how the different signals were weighted.
For the flanker experiment, we used a nonparametric analysis (Duncan et al., 2000) that compares the data with two different predictions, each derived from the data obtained in the square aperture condition. One prediction is that the cells should see only the component of motion perpendicular to the contours, which we call the contour prediction. Because the contours moved in oblique directions during the flanker experiments, this prediction is derived entirely from the oblique directions in the square aperture condition. The other prediction is that the cells will respond to the intrinsic terminator motion, which we call the terminator prediction. This prediction is derived entirely from the cardinal directions in the square aperture condition. The analysis measures the extent to which the data conform to each of these predictions, taking into account the fact that the two predictions are correlated with each other. The resulting partial correlation coefficient is given by:
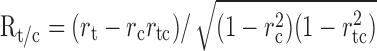 |
where Rtc is the partial correlation of the data with the terminator prediction, rt is the raw correlation of the data with the terminator prediction, rc is the raw correlation of the contour prediction, and rtc is the correlation of the terminator prediction with the contour prediction.
Eye movements. The analysis of eye movement data were conducted during separate sessions, but with identical visual stimuli and fixation requirements. Vertical and horizontal eye position signals were low-pass filtered (six-pole Bessel, –3 dB at 250 Hz), and velocity was obtained with an analog circuit that differentiated the position signals at frequencies below 50 Hz and rejected higher frequencies. Both position and velocity signals were digitized at 1 kHz and stored to disk for offline analysis. Peak-to-peak voltage noise levels corresponded to a position noise of <2 arc-min and a velocity noise of <1°/sec. Microsaccades were detected using a modification of a previously published algorithm (Martinez-Conde et al., 2000) implemented in MATLAB. Briefly, the analysis program used the horizontal and vertical eye velocities to calculate absolute eye speed and then flagged data points that exceeded 3°/sec. These regions were then examined to determine whether the direction of the eye movement changed by >15° across any 1 msec bin, and, if it did, the corresponding points were unflagged. The remaining flagged regions were classified as microsaccades if the amplitude of the eye movement was >3 arc-min and <2° (the diameter of our fixation window) and if the mean eye speed was >10°/sec [to eliminate blink artifacts (Collewijn et al., 1985)]. The eye movements detected in this way were confirmed by visual inspection, had typical saccadic velocity profiles, and displayed a relationship between amplitude and peak velocity that fell along the main sequence (Bair and O'Keefe, 1998). To examine smooth eye movements that may have been induced by our visual stimuli, we first removed all saccades from the eye movement traces, clipping a period from 10 msec before the beginning to 10 msec after the end of the saccade. These gaps were not interpolated but rather filled in with “missing value” markers that were handled gracefully by our analysis routines. We next inspected the aligned raw and averaged eye velocity traces to be sure that all saccades had been removed. For each trial, we then calculated the average eye velocities over each of 11 consecutive 40 msec bins, beginning 120 msec before the onset of stimulus motion and ending 320 msec after motion onset.
Results
We recorded from a total of 125 MT neurons in two alert rhesus macaque monkeys. Our goal was to determine how MT neurons combine motion vectors that belong to different parts of the stimulus (contours and terminators).
Contours and intrinsic terminators
We recorded the responses of MT neurons to barber pole stimuli like the one shown in Figure 1c. For each neuron, we first determined the control PD from its response to gratings that were windowed with square apertures (aspect ratio, 1:1). For the barber pole stimuli, the motion directions were always oblique, whereas the apertures were always horizontally or vertically oriented. As a result, the aperture orientation always differed from the motion direction by an angle of ϕ = 45° or ϕ = –45°. It was, therefore, possible to subdivide the barber pole trials according to these two types (Fig. 2), which were expected to induce opposite effects on the directional responses of neurons. Thus, if there were no effect of the aperture configuration, we would expect the PDs in both cases to be equal to the PD obtained in the square aperture condition. In contrast, a strong effect of aperture configuration would be expected to induce a rotation of 45° clockwise or counterclockwise.
Barber poles
Figure 3 shows the responses of one MT neuron to the barber pole stimuli. The PD of a neuron, as shown in Figure 3a, was diagonally upward and rightward, but it also responded well to pure rightward or pure upward motion. The response latency of this neuron was 63 msec, and during the interval between 63 and 103 msec (Fig. 3, early), there was little effect of aperture elongation on the direction selectivity (Fig. 3b,c): the peak motion response occurred for motion up and to the right, with little difference between the ϕ = 45° and ϕ = –45° conditions.
Figure 3.

Responses of one MT neuron to barber pole stimuli. a, When the stimulus is a grating viewed through a square aperture, the PD of the neuron is up and to the right. b, c, Over the first 40 msec of the response of this neuron, the tuning curve is only slightly affected by the elongation of the aperture. d, e, For longer stimulus durations (200–1000 msec after the onset of stimulus motion), when the stimulus is viewed through a horizontally oriented aperture, the neuron responds strongly to any direction of grating motion that contains a rightward component, regardless of the vertical component of motion. When the grating is viewed through a vertically oriented aperture, the time-averaged response is strong for any direction of motion that contains an upward component, regardless of the horizontal component.
If we examine the later time period, from 200–1000 msec after the onset of stimulus motion (Fig. 3, late), a different pattern of responses emerges. When the aperture was oriented horizontally (Fig. 3d,e), the neuron responded primarily to the horizontal component of motion. That is, it responded well when the grating motion had a rightward component and poorly when the grating motion had a leftward component. Note that this response pattern was almost entirely independent of the vertical component of the grating motion. When the grating contours moved obliquely downward and rightward (Fig. 3e), the neuron still responded strongly, although this direction evoked little response when the grating was viewed through a square aperture (Fig. 3a). Similarly, the responses to gratings presented in the vertically oriented aperture depended primarily on the vertical component of motion. The solid black lines in the tuning curves in Figure 3, d and e, show that the PD of a neuron for the different aperture configurations rotated by ∼45° clockwise or counterclockwise. The response of this neuron seemed to depend entirely on the direction of terminator motion along the long axis of the aperture.
The top row of Figure 4 shows time-averaged response patterns from another MT neuron. In the square aperture condition, this neuron responded best to motion down and to the left. As in Figure 3, the later responses to barber pole motion depended on the direction of terminator motion. This was seen in the tendency for the horizontally oriented aperture to evoke a strong response to any grating motion that had a leftward component (Fig. 4b,c). Similarly, the vertically oriented aperture evoked responses to any grating motion that had a downward component. However, in both barber pole conditions, the cell responded best to down–left motion. The solid black lines in the tuning curves indicate that the PD rotated by 28° counterclockwise in the ϕ = 45° condition and 31° clockwise in the ϕ = –45° condition.
Figure 4.

Time-averaged responses of two MT neurons to barber pole stimuli. a, Tuning of the first cell for gratings viewed through a square aperture. b, c, The horizontal grating orientation tends to emphasize the horizontal (leftward) portion of the grating motion. The vertical grating orientation emphasizes the vertical (downward) component of the grating motion. For both b and c, the best response occurs for down–left motion. d–f is the same as for a–c but for a cell that showed almost no effect of aperture orientation.
The bottom row of Figure 4 shows a cell that was relatively unaffected by the orientation of the apertures. The square aperture condition shown in Figure 4d indicates that the PD of the cell was up and to the right, and the same holds true for the barber pole conditions shown in Figure 4, e and f. Thus there was very little influence of aperture configuration on any of these responses. For instance, from the square aperture condition one would predict that the cell would respond well to rightward motion, but in the horizontal aperture conditions (Fig. 4b,c), the cell responded well only when the grating motion had both an upward and a rightward component. The response of this neuron, therefore, was primarily determined by the contour motion.
Models
We developed a few simple models that captured the range of effects seen in MT neurons. The models also helped to quantify some predictions that one might make about how terminator and contour signals could be combined in MT. Mathematically, motion signals are described as vectors, and vectors can be combined in numerous ways. Some of the simplest predictions are shown in Figure 5. One possibility is that MT neurons respond only to the motion of the contours (Fig. 5, contour). In this case, responses should be independent of the shape of the aperture, so we have designated this prediction as 0° in the analyses that follow. This model is consistent with the behavior observed in the bottom row of Figure 4. Another extreme possibility is that MT neurons respond only to the terminators along the long axis of the barber pole. This long axis prediction leads to a motion vector that deviates from the contour direction by 45°. The neuron shown in Figure 3 exhibited this behavior. If MT neurons compute a vector average of only the terminator motion vectors, the predicted direction for a barber pole with an aspect ratio of 3:1 would be 26.6° (see Materials and Methods). Because we did not vary the speed of motion, we cannot distinguish between a vector average and a vector sum of terminator motion. We, therefore, refer to both these predictions as the terminator average prediction. The responses of the neuron shown in the top row of Figure 4 are approximately consistent with this model. An indiscriminate vector average or vector sum of terminator and contour signals would lead to an output that was between 0 and 26.6°, depending on how the various motion signals were weighted. We call this the indiscriminate average prediction. Finally, the intersection-of-constraints (IOC) (Adelson and Movshon, 1982) solution would lead to various predictions, depending on the details of the implementation (Beutter et al., 1996). Note that for a grating viewed through a square aperture, all of the above predictions would be 0°, except for the long axis, which is undefined. Of course, many other combination rules are possible, and we address some of them in Discussion.
Figure 6, b and c, shows the range of effects found in 66 MT cells that were tested with the 3:1 aspect ratio barber pole. All of the cells were significantly direction-tuned for the barber pole stimuli (Rayleigh-z test, p < 0.05). For 51 of 66 (77%) of the neurons, the PD in the ϕ = –45 case was rotated significantly clockwise from the PD in the ϕ = 45 case (one-tailed Watson–Williams test, p < 0.05). None of the cells showed a significant rotation in the opposite direction, as suggested in Figures 6, b and c. For the ϕ = –45° condition, the average rotation induced by aperture orientation was 23.4° clockwise, with a circular SD (csd) of 17.9°. For the ϕ = 45° condition, the mean was 23.2° counterclockwise, with a csd of 16.6°. These means of the distributions are approximately consistent with the terminator average prediction illustrated in Figure 5. Note that if the neurons were simply insensitive to the motion of the terminators along the short axis of the barber pole, the PD would always rotate by nearly 45° (Pack and Born, 2001), which was rarely the case.
Figure 6.

Effects of a perture orient at ion on the directional tuning of the MT population (n= 66). a, Time course of the response. Time t = 0 is the latency for each cell. On average, the earliest response is independent of the elongation of the aperture (indiscriminate average, dotted line), but later responses deviate substantially in the direction predicted by the terminator average hypothesis (dashed line) for both ϕ = –45° and ϕ = 45° manipulations of the aperture configuration. The average PD obtained with gratings displayed in square apertures is stable over time (middle curve). The gray regions indicate predictions of an indiscriminate averaging rule. Error bars represent circular SEM. b, Time-averaged effect of the aperture configuration on the MT population (n = 66) for the ϕ = –45° aperture configuration. c, Time-averaged effect of the aperture configuration on the MT population for the ϕ = 45° aperture configuration.
We were also interested in the time course of the effect of aperture configuration. Previous work has shown that, for stimuli containing multiple motion cues, MT neurons respond initially to the motion of contours, with later responses depending primarily on the motion of terminators (Pack and Born, 2001). As indicated by the difference between the early and late responses shown in Figure 3, we saw a similar temporal evolution in these experiments. To examine this effect with the barber pole stimuli more carefully, we grouped the responses for each aperture configuration into 40 msec bins and computed the rotation of the PD induced by the terminators across each bin. For this analysis, we computed the latency of each cell individually, aligned the data from each cell on this latency (defined as time t = 0), and then averaged the subsequent temporal responses across cells. On average, the early responses for both ϕ conditions show no effect of aperture configuration, with later responses reflecting the influence of terminators (Fig. 6a). In other words, the earliest responses appear to be primarily determined by the contour motion (Fig. 5, contour), later responses shift to an indiscriminate average of terminators and contours, and the sustained part of the response corresponds closely to the average of the terminator motion.
Effect of aperture aspect ratio
Perceptual experiments have shown that the strength of the barber pole illusion depends on the aspect ratio of the aperture through which the grating is displayed. That is, increasing the elongation of an aperture along a particular axis increases the probability that observers perceive grating motion along that axis (Castet et al., 1999; Fisher and Zanker, 2001). We tested the effect of the aperture aspect ratio on 51 MT neurons by examining aspect ratios of 1.5:1 and 5:1. The terminator average predictions for these two cases were 11.3 and 33.7° (see Materials and Methods), and the results conformed very well to these predictions. For the 1.5:1 aspect ratio, the PD rotated by an average of 15.0° (csd, 18.2°) (Fig. 7a), and for the 5:1 aspect ratio, the PD rotated by an average of 37.5° (csd, 15.9°) (Fig. 7b). For the 5:1 aspect ratio, the vast majority of MT neurons (45 of 51; 88%) were sensitive to intrinsic terminator motion, (one-tailed Watson–Williams test, p < 0.05). This proportion was substantially lower in the 1.5:1 aspect ratio condition (28 of 51; 55%). Figure 7c shows the mean results for the population (solid line), along with the terminator average prediction (dotted line).
Figure 7.

Effect of aspect ratio on barber pole responses in MT neurons. a, Rotation of the PD for 51 MT neurons in response to a barber pole stimulus with an aspect ratio of 1.5:1. b, Rotation of the PD for the same 51 MT neurons in response to a barber pole stimulus with an aspect ratio of 5:1. c, Comparison of the mean rotation of the PD for the MT population (solid line) with that predicted from the terminator average (Term. Avg.) prediction (dotted line) for aspect ratios of 1.5:1, 3:1, and 5:1.
Effect of aperture shape
In the barber pole illusion, the grating appears as a rigid object drifting along the long axis of the aperture. However, the perceptual effect is attributable entirely to the local motion of terminators along the edges of the aperture. This can be demonstrated by placing small indentations in the aperture, so that the local direction of terminator motion is unrelated to the global orientation of the aperture (Fig. 8a). In this case, the barber pole illusion is abolished, and observers perceive the grating to be moving perpendicular to its orientation (Power and Moulden, 1992; Kooi, 1993).
We tested the effect of local aperture structure on an additional 37 MT cells. The aspect ratio of the aperture was 3:1, and for each cell, we compared the responses to gratings moving in straight-edged apertures to those obtained with gratings that had small (0.4° indentations). For these experiments, we used a grating with a somewhat higher spatial frequency (1.5 cycles/degree), because the perceptual effect is strongest at high spatial frequencies (Kooi, 1993). The results indicate that the indentations rendered the MT cells insensitive to the global orientation of the aperture. For the indented aperture case, only 2 of 37 (5%) cells showed a significant rotation of the PD (one-tailed Watson–Williams test, p < 0.05), as would be expected by chance. For the same neurons, 32 of 37 (86%) showed a significant rotation when the same grating windowed in a straight-edged aperture. The mean rotation of the PD for the indented aperture condition was 1.2° (csd, 19.3°) (Fig. 8c), whereas the mean rotation for the straight-edged aperture condition was 28.9° (csd, 15.2°) (Fig. 8b). Note that the latter figure is somewhat higher than what we obtained for the 3:1 aspect ratio barber poles with a lower spatial frequency grating. Although there are some theoretical reasons to suspect an influence of spatial frequency on the barber pole illusion (Fisher and Zanker, 2001), we have not studied this issue any further. In any case, both results are consistent with the notion that MT neurons integrate terminator signals at very small spatial scales relative to their receptive field diameters (Pack et al., 2003).
Effect of stimulus size
For 21 cells that had relatively large receptive fields, we measured the effect of doubling the size of the barber pole stimulus on the neural responses. The aspect ratio of the aperture remained 3:1, but both the length and width were doubled. This manipulation has two major effects. First, the amount of contour motion increases with the total stimulus area, whereas the amount of terminator motion increases with the length of the sides of the aperture. Because the area increases faster than the perimeter of the aperture, this manipulation increases the relative contribution of the contour signals (by approximately a factor of two). Second, because the stimulus was centered on the receptive field, the terminators are pushed toward the periphery of the receptive field. Both of these manipulations might be expected to increase the strength of the contour motion signals, which would push the angular deviations of the PDs toward 0° (Fig. 5, contour prediction). However, our results indicate that this was not the case. When the large barber poles were used, the average rotation of the PD was 26.3° (csd, 20.9°). For the same subset of cells, the rotation of the PD for the standard barber pole size was 21.9° (csd, 18.8°). Thus, if there was any effect of switching to a larger stimulus size, it was to increase the effect of the terminators along the long axis of the aperture. This result is completely inconsistent with the indiscriminate average prediction.
Effect of stimulus position
For the same 21 neurons, we also examined the effect of changing the position of the barber pole stimulus within the MT receptive fields. Specifically, we positioned the short end of the aperture over the center of the receptive field, with the long axis extending out toward the periphery of the receptive field. In this case, the mean rotation of the PD introduced by the aperture configuration was 17.3° (csd, 22.1°). The corresponding rotation for the control condition (barber pole centered on the receptive field) was 20.6° (csd, 16.2°). This difference did not reach significance (Watson–Williams test, p > 0.2). Nonetheless, it remains possible that the spatial structure of the receptive field exerted a modest effect on the integration of motion signals. However, the main effect of aperture configuration was robust to changes in stimulus position.
Dots moving within apertures
We also sought to measure the effect of the elongated apertures directly, by replacing the grating stimulus with a random dot field. Each dot was 1 pixel in size and so did not generate motion signals at the boundaries of the aperture. Furthermore, because the individual dots in the dot field are not oriented, the aperture problem does not apply locally. Therefore, the configuration of the aperture would not be expected to influence the directional responses. For 22 cells, we compared the PDs obtained with gratings to those obtained with dots displayed in elongated apertures. Although the effect of aperture configuration was drastically reduced, it was not completely eliminated. The mean rotation of the PD for the dots was 3.8° (csd, 18.9°) compared with 20.4° (csd, 12.6°) for grating stimuli shown in the same aperture. The distribution was significantly different from 0° (Watson–Williams test, p < 0.05). Thus, it is possible that the aperture itself exerted a small influence on the measured motion direction, regardless of the stimulus it contained.
Contours and extrinsic terminators
Thus far, our results support the notion that MT neurons are particularly sensitive to motion signals generated by intrinsic terminators at aperture borders. We next sought to measure the responses of MT neurons to extrinsic terminators. Extrinsic terminators occur wherever one object passes behind another, and this situation can be simulated by introducing occlusion cues, as in Figure 1b. In the case of the barber pole illusion, an effective occlusion cue can be generated by placing a bright frame around the aperture. Perceptually, this manipulation greatly reduces the magnitude of the barber pole illusion (Shiffrar et al., 1995),
We compared the responses of 66 MT neurons to barber pole stimuli with and without an occlusion cue in the form of a white frame surrounding the aperture. If MT neurons made use of the occlusion cue, then we would expect the bias introduced by the aperture configuration to decrease when the aperture was surrounded by a frame. Figure 9 shows the results for one cell. In Figure 9a, the response of the neuron to grating stimuli in square apertures peaked for motion up and to the left. Figure 9, b and c, shows that the response of the neuron was strongly affected by the orientation of the aperture, yielding substantially different tuning curves in the ϕ = 45° and ϕ = –45° conditions. Figure 9, d and e, shows the result of repeating the experiment with a bright white frame surrounding the aperture. In this case, the aperture configuration had little effect on the directional response: the cell responded only when the grating moved up and to the left, in agreement with a contour motion prediction. Thus, when the aperture was surrounded by the frame, the response was directly predictable from the square aperture condition. When there was no frame, the response depended on the elongation of the aperture.
Figure 9.

Effect of extrinsic terminators on the barber pole responses of an MT neuron. a, Response of a single neuron to the grating stimulus viewed through a square aperture. The PD is up and to the left. b, c, When the grating is elongated, the neuron responds primarily to the component of grating motion parallel to the orientation of the aperture, while ignoring the perpendicular component of motion. d, e, When the aperture is surrounded by a white frame, the effects of the aperture elongation are eliminated. The neuron responds only to motion up and to the left.
The reduction in the effect of aperture configuration was consistent across the MT population. However, for most cells the frame did not completely abolish the barber pole effect. When the frame was present, the mean rotation of the PD was 11.3° (csd, 19.2°). For the same subset of cells, the same stimuli without the frame rotated the PDs by 23.3° (csd, 16.2°). These results are consistent with an indiscriminate average prediction in which the contours and extrinsic terminators are given approximately equal weight.
Intrinsic versus extrinsic terminators
In the previous experiment, we used a stimulus that pitted contour motion signals against extrinsic terminator motion signals and found that the extrinsic terminator signals exerted an effect, but one that was reduced relative to the intrinsic terminator signals. To compare directly the influence of intrinsic and extrinsic terminator motion signals, we used an occluded grating stimulus. This stimulus consisted of a grating presented inside a square aperture, which was flanked by a pair of vertical or horizontal bars. Perceptually, the bars act as an occlusion cue, rendering the terminators along one dimension extrinsic, while leaving the terminators along the perpendicular dimension intrinsic. This stimulus yields a robust perceptual illusion in which the grating appears to slide along the dimension that contains the intrinsic terminators (Lidén and Mingolla, 1998).
To the extent that MT neurons favor intrinsic terminator motion over extrinsic terminator motion, the predicted responses are similar to those generated by elongating the aperture in the barber pole experiments. When the square aperture is flanked by vertical occluders, the response should reflect the horizontal component of the direction-tuning curve of each cell. Similarly, horizontal occluders should emphasize the vertical component of the tuning curve. Figure 10 shows the result for one MT neuron. The PD of this cell for gratings in a square aperture with no flankers was up and to the left (Fig. 10a). When the aperture was flanked by horizontal occluders, the neuron responded well only when the vertical component of motion was upward (Fig. 10b,c). Similarly, when the aperture was flanked by vertical occluders, the neuron responded well only when the horizontal component of motion was leftward (Fig. 10b,c). In other words, the effect of the flankers was qualitatively similar to the effect of elongating the aperture in the barber pole experiments. However, in this case, the motion signals were the same in all conditions: all that changed was the position of the flankers.
Figure 10.

Effect of extrinsic terminators on the responses of an MT neuron to gratings in square apertures. a, When the grating moves within a square aperture, the PD of the neuron is up and to the left. b, c, Vertical flanking occluders cause the neuron to respond to any stimulus that contains a leftward motion component. Horizontal flanking occluders cause the neuron to respond to any stimulus that contains an upward motion component.
We obtained tuning curves like those shown in Figure 10 for 74 MT neurons. To measure the effect of the occlusion cue on the neural responses, we calculated the extent to which the flanker configuration rotated the PD. This analysis was identical to that used in the barber pole experiments. Figure 11 shows the time course of the effect. As in the barber pole experiments, the initial results reflected primarily the motion of the grating contours. Subsequent responses depended on the configuration of the flankers. Figure 11, b and c, shows the distribution of angular deviations across the MT population. The mean angular deviation was 16.6° (csd, 15.5°). Across the population, there was a significant rotation of the PD for 73% (54 of 74) of the neurons (one-tailed Watson–Williams test, p < 0.05). Thus, the intrinsic terminators had a robust effect on MT responses, overcoming opposing motion signals from contours and extrinsic terminators.
Figure 11.

Response of the population of MT neurons to square aperture stimuli with flanking occluders. a, Time course of the response relative to the response latency of each cell. The earliest responses are independent of the position of the flankers and depend almost entirely on the contour motion of the grating (dotted line). Subsequent responses take into account the occluder position for both the ϕ = –45° and ϕ = 45° configurations. Error bars represent circular SEM. b, Time-averaged effect of flanker configuration for the ϕ = –45° rotation condition across the MT population (n = 74). c, Time-averaged effect of flanker configuration for the ϕ = 45° rotation condition across the MT population.
The influence of intrinsic and extrinsic terminators on MT responses has been studied previously, using binocular disparity rather than monocular occlusion as a depth cue (Duncan et al., 2000). The result of these experiments also suggest that intrinsic terminators affect the directional responses of MT neurons more than extrinsic terminators. Duncan et al. (2000) expressed their results in terms of a partial correlation coefficient, which captures the correlation between the observed responses and those predicted by the motion of the intrinsic terminators. By this metric, a coefficient of 1.0 indicates that the neurons responded solely to the direction of motion favored by the intrinsic terminators, whereas a coefficient of –1.0 suggests a reliance on extrinsic terminators. Under this analysis, MT neurons exhibited a variety of behaviors, with a mean correlation coefficient of 0.10 (Duncan et al., 2000). To facilitate comparison between the two studies, we computed the analogous partial correlation coefficient for our population of MT cells. For the 74 MT neurons in our population, the mean correlation coefficient was 0.69, indicating that the majority of cells were strongly influenced by the intrinsic terminators, as shown in Fig. 11, b and c.
There are several possible explanations for the higher correlation values found in the current study than in previous work (Duncan et al., 2000). One possibility is that monocular occlusion cues are more potent than binocular disparity cues as indicators of depth relationships (Lidén and Mingolla, 1998; Anderson, 1999; Castet et al., 1999). Whereas this may be part of the explanation, it seems more likely that the discrepancy is attributable to differences in the placement of the stimuli within the receptive fields. In our experiments, the depth cues (the occluders) and terminators were always within the classical receptive fields of the neurons under study, whereas Duncan et al. (2000) placed their depth cues outside the receptive fields. Thus, their experiments enabled them to study the propagation of information from the surround to the center of the receptive fields, whereas our experiments focused on interactions within the receptive field centers.
Effect of grating luminance
At first glance, it might appear that the occlusion cues exert an influence simply by reducing the effective contrast of the nearby terminators. This explanation would apply equally to the frame surrounding the aperture in the barber pole experiments and the flankers in the previous experiment. However, the difference in luminance between the grating (13.9 cd/m2) and the flanker (33.6 cd/m2) was 19.7 cd/m2. This is greater than the difference in luminance between the grating and background, which was 13.8 cd/m2. Thus, a definition of contrast based on local luminance differences would suggest that the contrast of the extrinsic terminators was actually greater than that of the intrinsic terminators. However, because the word “contrast” has no clear definition for nonperiodic stimuli (Peli, 1997), it remains possible that the luminance difference reduced the efficacy of the terminators.
One possibility is that a logarithmic transformation of luminance in the retina would reduce the contrast of the extrinsic terminators (Noest and van den Berg, 1993). Therefore, for 15 MT cells, we repeated the flanker experiment with a different grating luminance (7.0 cd/m2). This manipulation doubled the luminance difference between the flanker and the grating, making the luminance contrast of the extrinsic terminators greater than that of the intrinsic terminators, even taking into account a logarithmic compression of luminance contrast. However, it had little effect on the deviation of the PDs, which averaged 16.5° (csd, 18.1°) compared with 16.8° (csd, 14.3°) in the corresponding high-luminance conditions. We conclude that the magnitude of the luminance difference between the flankers and the grating is not crucial for terminator classification.
Effect of occluder length
Lidén and Mingolla (1998) reported that their perceptual effect depended on the length of the flanking bars. When the bars were shortened, so as to be the same length as the grating patch, the magnitude of the perceptual illusion was substantially reduced. Because the local motion signals were the same in both cases, this finding suggested an additional, global influence of surface layout on motion perception.
We examined the influence of flanking bar length on the motion responses of 24 MT neurons. The control stimulus consisted of the occluded square aperture stimulus used in the previous experiments (Fig. 10). For comparison, we tested the same neurons with a version of the same stimulus in which the flankers were shortened to be exactly as long as the grating patch. This manipulation had little effect on the MT responses. In the control condition, the flanker configuration rotated the PD by 19.1° (csd, 17.9°), whereas in the short-flanker condition, the PD by 18.9° (csd, 17.4°). Although we cannot rule out the possibility that a difference would emerge with a larger sample, the response from this limited population of MT neurons is not consistent with the large perceptual effect reported by Lidén and Mingolla (1998).
Observations on V1 cells
To get a general idea of the types of signals that are available in the input to MT, we also examined a small number of cells in striate cortex (V1). The stimuli were exactly the same as those used in the MT study, even with respect to their size, so they were in no sense optimal for the V1 neurons. Nonetheless, we observed many of the same effects in V1 as in MT. We recorded from a total of 22 direction-selective (direction index, >0.5) V1 neurons, the receptive fields of which had eccentricities ranging from 3.0 to 7.2°.
Intrinsic terminators
Because the motion signals at the aperture edges seemed to dominate the responses of MT cells, we first sought to measure the responses to such signals in V1. The stimulus was the square grating patch (1:1 aspect ratio) used in our MT experiments. For 22 V1 cells, we compared the responses to gratings centered on the receptive fields to gratings that were displaced so that the horizontal or vertical edge of the grating patch was centered on the receptive field (Fig. 12). Because the gratings were much larger than the classical receptive fields, gratings centered on the receptive fields provided motion information from contours only. In contrast, when the end points of the grating were in the receptive field, the motion signals were attributable to intrinsic terminators. Neurons that failed to respond to large gratings centered on their receptive fields were not included in this analysis, although such neurons probably contribute to motion integration in MT (Pack et al., 2003).
Figure 12.

Responses of a representative V1 neuron to terminators and contours. a, Direction tuning of this neuron, as measured with a grating windowed in a large square aperture. b, Responses of the same neuron when the horizontal or vertical edge of the aperture was centered on the receptive field, so that the neuron was stimulated with intrinsic terminators. c, Responses of the same neuron when the 3:1 aspect ratio barber pole stimulus was placed over its receptive field. The stimulus was considerably larger than the minimum response field of the neuron. d, Responses of the same neuron when extrinsic terminators moved through the receptive field.
Figure 12 shows data from one V1 neuron. The neuron was very direction selective for a grating centered on its receptive field, with a PD favoring down–left motion (Fig. 12a). When the horizontal edge of the grating patch was centered on the receptive field, the neuron responded primarily to the horizontal component of motion, with very little dependence on the orientation of the grating or its actual motion direction (Fig. 12b, top). In other words, the neuron responded to the rightward or leftward motion of the terminators along the edge of the aperture. Similarly, when the vertical edge of the grating patch was centered on the receptive field, the neuron responded to the vertical component of the grating motion (Fig. 12b, bottom).
The neuron described in Figure 12 was typical of the V1 neurons from which we recorded. Most (17 of 22; 77%) of the V1 cells showed a significant rotation of the PD when the position of the aperture was changed (one-tailed Watson–Williams test, p < 0.05). Furthermore, the response to terminators was quite robust relative to the responses to gratings centered on the receptive fields, for which the firing rate was reduced by an average of 44%. This is consistent with the finding that most macaque V1 neurons are strongly suppressed by extended contours passing through their receptive fields (Jones et al., 2001; Sceniak et al., 2001).
Barber poles
The preceding results suggest that intrinsic terminator signals are represented in the outputs of V1 neurons. This raises the possibility that the globally integrated motion direction is also represented in these neurons. We tested this idea by measuring the responses of 22 V1 neurons to the same, relatively large, barber pole stimuli (3:1 aspect ratio) we used in MT. As in the MT experiments, the stimulus was centered on the receptive fields. For most neurons, the edges of the barber pole were well outside the receptive fields, so this experiment provided a means of testing the extent to which information propagated into the receptive fields, via either horizontal connections (Gilbert and Wiesel, 1983) or feedback from higher areas, such as MT (Maunsell and van Essen, 1983).
The response of the example neuron in Figure 12 depended entirely on the local motion signals moving through its receptive field, with no influence of the aperture orientation (Fig. 12c). This was generally the case with the neurons we examined, although we did find a significant effect of aperture configuration in 8 of 22 (36%) of the neurons tested (one-tailed Watson–Williams test, p < 0.05). For these eight neurons, the average rotation of the PD was 15.1°. One possible explanation for this latter finding is that the end points of the grating were in the receptive field, either because we underestimated the receptive field size or because we did not center the stimulus perfectly. To examine this possibility, we tested the eight cells that showed a significant effect of aperture elongation with barber pole stimuli that were twice the size of the original. This manipulation eliminated the effect of aperture orientation in all eight cells. That is, all of the neurons we studied behaved like the one in Figure 12, for suitably large barber pole stimuli. Our conclusion from this limited sample of cells is that V1 neurons respond to local stimulus features, either terminators or contours. The different response properties found in V1 and MT could merely reflect a difference in the spatial scale of the receptive fields, or they could reflect genuinely different integrative properties. Because we used the same stimuli in both experiments, we cannot presently distinguish between these two possibilities. However, it does not appear that stimuli that extend far beyond the classical receptive fields of these neurons influence the direction-tuning curves, other than modulating the overall responsiveness.
Extrinsic terminators
We also sought to compare the responses of V1 neurons to intrinsic and extrinsic terminators. For these experiments, the intrinsic terminator stimulus was the same grating as that in Figure 12, and the extrinsic terminator stimulus was the occluded grating we used to study MT cells. In both cases, the edge of the grating was centered on the V1 receptive field. Figure 12d shows the response of one cell to these different stimuli. The cell responded well to the intrinsic terminators but was strongly suppressed by the flanker of the occluded grating. This suppression was largely independent of the orientation of the flanker. For the 16 direction-selective V1 cells for which we tested these stimuli, the response to extrinsic terminators was, on average, 39% of the response to intrinsic terminators. This result is consistent with mechanisms known to exist in V1, such as surround suppression (Maffei and Fiorentini, 1976) and cross-orientation suppression (DeAngelis et al., 1992).
Fixational eye movements
Although eye position was monitored continuously during the experiment, the animals were free to move their eyes within a fixation window 2° in diameter. Such eye movements typically consist of pursuit eye movements in the direction of target motion and small microsaccades around the fixation point (Bair and O'Keefe, 1998). It is, therefore, possible that fixational eye movements contributed to some of the findings reported here.
To examine this possibility, we analyzed the fixational eye movements made by the same two monkeys during >5000 fixation trials in which barber pole stimuli were displayed. Consistent with previous reports (Bair and O'Keefe, 1998), the monkeys made very few microsaccades (on average, 1.1/trial), and 80% of these occurred >200 msec after the onset of stimulus motion. The neuronal effects of aperture orientation were evident in our data before this point (Fig. 6). Also consistent with previous findings (Bair and O'Keefe, 1998; Churchland and Lisberger, 2000), the directions of the microsaccades were uncorrelated with stimulus motion direction (linear regression; p > 0.1). Finally, there was no significant effect of aperture orientation on the directional distributions of microsaccades (Watson–Williams test, p > 0.1).
We also observed smooth eye movements that began ∼100 msec after the onset of stimulus motion and lasted for an additional 100–200 msec. These movements were correlated with the grating motion direction but had an average speed of <0.4°/sec, which is unlikely to affect MT responses appreciably (Churchland and Lisberger, 2001). In a few cases (<8% of the conditions tested), smooth eye movements were significantly affected by aperture configuration (two-dimensional, two-sample Kolmogorov–Smirnoff test, p < 0.05); however, for these cases the eye movement directions were just as likely to be in the direction opposite that predicted by terminator motion as in the same direction (binomial test, p > 0.15).
In summary, the fixational eye movements made by the animals were both rare and of an exceedingly small magnitude and bore no systematic relationship to the orientation of the barber pole apertures. We conclude that the impact of fixational eye movements on our physiological data were negligible.
Discussion
Our results describe a neural correlate of the classic barber pole illusion, in which the perceived direction of a moving grating is affected by the orientation of the aperture in which it is windowed. Beyond suggesting a link between neuronal responses and perception, these results place several constraints on models of motion integration in MT. First, the majority of MT neurons in alert animals are highly sensitive to the motion of two-dimensional image features (terminators). This can be seen most clearly in Figure 7b, in which the direction tuning of almost every neuron tested can be predicted from the motion of the terminators. We have obtained similar results with tilted bars (Pack and Born, 2001), plaids (Pack et al., 2001), and two-flash apparent motion stimuli (Pack et al., 2003). Second, the computation of two-dimensional motion occurs on a spatial scale that is much smaller than MT receptive field diameters. That is, when information about two-dimensional motion is concentrated in a small region of the visual field, the resulting terminator signals exert a powerful effect on the responses of MT neurons (Fig. 8). Third, MT neurons respond less to terminators that are rendered extrinsic by depth cues such as occlusion (Figs. 9, 10, 11). This effect also appears to be quite local in the receptive field because more global surface cues had virtually no effect on the responses. Fourth, consistent with our previous findings (Pack and Born, 2001), the earliest responses of MT neurons communicate information about the motion of contours, whereas later responses are primarily concerned with the motion of terminators (Figs. 6, 11).
Representation of two-dimensional image features in V1
We have used the word “terminator” here to describe the end points (or terminations) formed along the edges of an aperture that contains a grating. A more expansive definition would include any local image region that contains discontinuities (or luminance gradients) in both spatial dimensions. In contrast, a “contour” is a change in luminance along one spatial dimension, which is, by definition, perpendicular to the orientation of the edge. Although a linear mechanism is well suited to detect a contour, some nonlinearity of processing is necessary for effective detection of terminators (Zetzsche and Barth, 1990).
An important nonlinearity used by the visual cortex is surround suppression, which is present in the majority of V1 neurons (Jones et al., 2001; Sceniak et al., 2001). Neurons with strong surround suppression respond well to terminators and are suppressed by extended contours centered on their receptive fields (Hubel and Wiesel, 1965; Saito et al., 1988; Heider et al., 2000; Pack et al., 2003). Within V1, surround suppression is strongest in layer 4B (Sceniak et al., 2001), which supplies ∼90% of the input from V1 to MT (Maunsell and van Essen, 1983; Shipp and Zeki, 1989; Movshon and Newsome, 1996). Thus, it is reasonable to assume that much of the input to MT carries information about terminators. Furthermore, surround-suppressed neurons are, by definition, inhibited by stationary edges that intersect their receptive fields, which might explain why the occlusion cues in our experiments were so effective at reducing the effects of extrinsic terminator motion. All of these effects of surround suppression are consistent with more general information-processing functions attributed to the striate cortex, such as decorrelation and sparse coding (Barlow, 1961; Vinje and Gallant, 2000).
Integration of motion signals in MT
A number of previous studies have used dot stimuli or small motion patches to investigate the responses of MT neurons to multiple stimuli moving within their receptive fields. The consensus from these studies has been that, when more than one stimulus is present in the receptive field, the response of most neurons is well described by a vector average of the responses to the two stimuli presented separately (Snowden et al., 1991; Recanzone et al., 1997; Britten and Heuer, 1999).
Our results can also be well described by a vector average, provided the terminator motion signals are given much more weight than the motion of contours. For a barber pole with an aspect ratio of 3:1, this type of calculation predicts an angular deviation of 26.6° (Fig. 5). Our results yielded an average angular deviation of 23.3° for MT neurons. For barber poles of both lower and higher aspect ratios (1.5:1 and 5:1), the neuronal population averages were, likewise, very close to that predicted by a vector average of terminators (Fig. 7c). The angular deviation was influenced somewhat by the position of the terminators within the receptive field, but there was little influence of contour signals. This was particularly evident in the experiment with large barber poles, in which the amount of contour motion was increased and the terminators were placed further in the periphery of the receptive fields, a manipulation that produced very little effect on the response of the MT neurons. Vector-averaging models of MT responses have been proposed based on psychophysical observations on the integration of first- and second-order motion signals (Wilson et al., 1992). It would be interesting to see how they react to the stimuli used in our experiments.
Many models rely on the computation of local motion energy (Adelson and Bergen, 1985), which is usually hypothesized to be performed in V1. In our barber pole experiments, the motion energy in the long axis direction was always <20% of the motion energy in the contour direction, so the responses of motion energy detectors alone are not sufficient to explain our results. However, motion energy models can be extended to include a second stage (usually identified with MT) in which local measurements are combined in a nonlinear manner to provide estimates of velocity. One example of such a computation is the IOC algorithm (Fennema and Thompson, 1979; Adelson and Movshon, 1982), which has been shown to be consistent with much of the MT data (Simoncelli and Heeger, 1998). Some velocity-domain models do indeed predict that the global motion measurements should depend on the aspect ratio of the aperture in barber pole stimuli (Beutter et al., 1996). However, most MT neurons do not construct the type of velocity-space representation hypothesized by these models (Majaj et al., 1999; Priebe et al., 2003). Models that rely explicitly on local measurement of terminator motion have also been proposed (Lorenceau et al., 1993; Rubin et al., 1995; Grossberg et al., 2001) and appear to be qualitatively consistent with recent V1 data (Pack et al., 2003; Tinsley et al., 2003).
Integration of motion cues in perception and behavior
A vector-average model also accounts for some psychophysical observations, particularly in stimuli that do not contain terminators (Mingolla et al., 1992; Rubin and Hochstein, 1993), low-contrast stimuli (Lorenceau et al., 1993; Weiss et al., 2002), and stimuli that are displayed only briefly (Lorenceau et al., 1993). The latter two findings are consistent with a significant role for surround-suppressed V1 cells, because surround suppression is reduced at low contrasts (Polat et al., 1998; Sceniak et al., 1999) and short durations (Pack et al., 2003). When stimulus conditions are optimal for inducing eye movements, a similar effect of stimulus duration is seen during ocular following (Masson et al., 2000; Masson and Castet, 2002) and the initiation of smooth pursuit eye movements (Pack and Born, 2001; Born et al., 2002; Masson and Stone, 2002).
Our results from the barber pole experiments are, in general, consistent with human perception. For the stimulus conditions we used, humans generally perceive an angular deviation of ∼20–30° (Castet et al., 1999; Fisher and Zanker, 2001), although there is substantial variability among observers, and even from trial to trial within observers (Castet et al., 1999).
For the experiments involving extrinsic terminators, our results are also qualitatively similar to human perception. Occlusion cues reduce the effect of terminators, as found previously for other depth cues (Shimojo et al., 1989; Stoner et al., 1990; Duncan et al., 2000), and the effect of terminators seems to be quite local in visual space (Power and Moulden, 1992; Kooi, 1993). However, the magnitude of the effects seen for perception is substantially larger than that seen in our population of MT cells. For the square apertures with flanking occluders, the angular deviation found perceptually nears 45° (Lidén and Mingolla, 1998), more than twice the size of the effect seen in the average MT cell. One possible explanation for this discrepancy is the effect of attention: the monkeys in our experiments were rewarded for simply maintaining fixation, whereas psychophysical subjects must attend to the stimulus. Because attention is capable of shifting MT responses from a vector average to a winner-take-all computation for pursuit targets (Recanzone and Wurtz, 2000), it is not difficult to imagine a role for it in further emphasizing the influence of terminators.
Footnotes
This work was supported by National Science Foundation Cognitive Neuroscience Grant BCS-0235398 (C.C.P.), the Harvard College Research Program (A.J.G.), National Institutes of Health Grants EY11379 and EY12196, and the Whitehall Foundation (R.T.B.). Phillip Hendrickson provided excellent technical assistance. We thank Marge Livingstone, John Assad, and Eric Schwartz for helpful comments on a previous version of this manuscript.
Correspondence should be addressed to Dr. Christopher Pack, Department of Neurobiology, Harvard Medical School, 220 Longwood Avenue, Boston, Massachusetts 02115. E-mail: cpack@hms.harvard.edu.
DOI:10.1523/JNEUROSCI.4387-03.2004
Copyright © 2004 Society for Neuroscience 0270-6474/04/243268-13$15.00/0
References
- Adelson EH, Movshon JA (1982) Phenomenal coherence of moving visual patterns. Nature 300: 523–525. [DOI] [PubMed] [Google Scholar]
- Adelson EH, Bergen JR (1985) Spatiotemporal energy models for the perception of motion. J Opt Soc Am A 2: 284–299. [DOI] [PubMed] [Google Scholar]
- Anderson BL (1999) Stereoscopic occlusion and the aperture problem for motion: a new solution. Vision Res 39: 1273–1284. [DOI] [PubMed] [Google Scholar]
- Bair W, O'Keefe LP (1998) The influence of fixational eye movements on the response of neurons in area MT of the macaque. Vis Neurosci 15: 779–786. [DOI] [PubMed] [Google Scholar]
- Barlow H (1961) Possible principles underlying the transformation of sensory messages. In: Sensory communication (Rosenbluth WA, ed). Cambridge, MA: MIT.
- Beutter BR, Mulligan JB, Stone LS (1996) The barberplaid illusion: plaid motion is biased by elongated apertures. Vision Res 36: 3061–3075. [DOI] [PubMed] [Google Scholar]
- Born RT, Groh JM, Zhao R, Lukasewycz SJ (2000) Segregation of object and background motion in visual area MT: effects of microstimulation on eye movements. Neuron 26: 725–734. [DOI] [PubMed] [Google Scholar]
- Born RT, Pack CC, Zhao R (2002) Integration of motion cues for the initiation of smooth pursuit eye movements. Prog Brain Res 140: 225–237. [DOI] [PubMed] [Google Scholar]
- Britten KH, Heuer HW (1999) Spatial summation in the receptive fields of MT neurons. J Neurosci 19: 5074–5084. [DOI] [PMC free article] [PubMed] [Google Scholar]
- Castet E, Charton V, Dufour A (1999) The extrinsic/intrinsic classification of two-dimensional motion signals with barber-pole stimuli. Vision Res 39: 915–932. [DOI] [PubMed] [Google Scholar]
- Churchland MM, Lisberger SG (2000) Apparent motion produces multiple deficits in visually guided smooth pursuit eye movements of monkeys. J Neurophysiol 84: 216–235. [DOI] [PMC free article] [PubMed] [Google Scholar]
- Churchland MM, Lisberger SG (2001) Shifts in the population response in the middle temporal visual area parallel perceptual and motor illusions produced by apparent motion. J Neurosci 21: 9387–9402. [DOI] [PMC free article] [PubMed] [Google Scholar]
- Collewijn H, van der Steen J, Steinman RM (1985) Human eye movements associated with blinks and prolonged eyelid closure. J Neurophysiol 54: 11–27. [DOI] [PubMed] [Google Scholar]
- DeAngelis GC, Robson JG, Ohzawa I, Freeman RD (1992) Organization of suppression in receptive fields of neurons in cat visual cortex. J Neurophysiol 68: 144–163. [DOI] [PubMed] [Google Scholar]
- Dobbins A, Zucker SW, Cynader MS (1987) Endstopped neurons in the visual cortex as a substrate for calculating curvature. Nature 329: 438–441. [DOI] [PubMed] [Google Scholar]
- Duncan RO, Albright TD, Stoner GR (2000) Occlusion and the interpretation of visual motion: perceptual and neuronal effects of context. J Neurosci 20: 5885–5897. [DOI] [PMC free article] [PubMed] [Google Scholar]
- Fennema C, Thompson W (1979) Velocity determination in scenes containing several moving objects. Comput Graphics Image Process 9: 301–315. [Google Scholar]
- Fisher N, Zanker JM (2001) The directional tuning of the barber-pole illusion. Perception 30: 1321–1336. [DOI] [PubMed] [Google Scholar]
- Gilbert CD, Wiesel TN (1983) Clustered intrinsic connections in cat visual cortex. J Neurosci 3: 1116–1133. [DOI] [PMC free article] [PubMed] [Google Scholar]
- Grossberg S, Mingolla E, Viswanathan L (2001) Neural dynamics of motion integration and segmentation within and across apertures. Vision Res 41: 2521–2553. [DOI] [PubMed] [Google Scholar]
- Heider B, Meskenaite V, Peterhans E (2000) Anatomy and physiology of a neural mechanism defining depth order and contrast polarity at illusory contours. Eur J Neurosci 12: 4117–4130. [DOI] [PubMed] [Google Scholar]
- Hubel DH, Wiesel TN (1965) Receptive fields and functional architecture in two non-striate visual areas (18 and 19) of the cat. J Neurophysiol 28: 229–289. [DOI] [PubMed] [Google Scholar]
- Jones HE, Grieve KL, Wang W, Sillito AM (2001) Surround suppression in primate V1. J Neurophysiol 86: 2011–2028. [DOI] [PubMed] [Google Scholar]
- Kooi FL (1993) Local direction of edge motion causes and abolishes the barberpole illusion. Vision Res 33: 2347–2351. [DOI] [PubMed] [Google Scholar]
- Lidén L, Mingolla E (1998) Monocular occlusion cues alter the influence of terminator motion in the barber pole phenomenon. Vision Res 38: 3883–3898. [DOI] [PubMed] [Google Scholar]
- Lorenceau J, Shiffrar M (1992) The influence of terminators on motion integration across space. Vision Res 32: 263–273. [DOI] [PubMed] [Google Scholar]
- Lorenceau J, Shiffrar M, Wells N, Castet E (1993) Different motion sensitive units are involved in recovering the direction of moving lines. Vision Res 33: 1207–1217. [DOI] [PubMed] [Google Scholar]
- Maffei L, Fiorentini A (1976) The unresponsive regions of visual cortical receptive fields. Vision Res 16: 1131–1139. [DOI] [PubMed] [Google Scholar]
- Majaj NJ, Carandini M, Smith MA, Movshon JA (1999) Local integration of features for the computation of pattern direction by neurons in macaque area MT. Soc Neurosci Abstr 25: 269.210. [Google Scholar]
- Marr D (1982) Vision. New York: Freeman.
- Martinez-Conde S, Macknik SL, Hubel DH (2000) Microsaccadic eye movements and firing of single cells in the striate cortex of macaque monkeys. Nat Neurosci 3: 251–258. [DOI] [PubMed] [Google Scholar]
- Masson GS, Castet E (2002) Parallel motion processing for the initiation of short-latency ocular following in humans. J Neurosci 22: 5149–5163. [DOI] [PMC free article] [PubMed] [Google Scholar]
- Masson GS, Stone LS (2002) From following edges to pursuing objects. J Neurophysiol 88: 2869–2873. [DOI] [PubMed] [Google Scholar]
- Masson GS, Rybarczyk Y, Castet E, Mestre DR (2000) Temporal dynamics of motion integration for the initiation of tracking eye movements at ultra-short latencies. Vis Neurosci 17: 753–767. [DOI] [PubMed] [Google Scholar]
- Maunsell JH, van Essen DC (1983) The connections of the middle temporal visual area (MT) and their relationship to a cortical hierarchy in the macaque monkey. J Neurosci 3: 2563–2586. [DOI] [PMC free article] [PubMed] [Google Scholar]
- Mingolla E, Todd JT, Norman JF (1992) The perception of globally coherent motion. Vision Res 32: 1015–1031. [DOI] [PubMed] [Google Scholar]
- Movshon JA, Newsome WT (1996) Visual response properties of striate cortical neurons projecting to area MT in macaque monkeys. J Neurosci 16: 7733–7741. [DOI] [PMC free article] [PubMed] [Google Scholar]
- Movshon JA, Adelson EH, Gizzi MS, Newsome WT (1986) The analysis of moving visual patterns. Exp Brain Res 11: 117–151. [Google Scholar]
- Noest AJ, van den Berg AV (1993) The role of early mechanisms in motion transparency and coherence. Spat Vis 7: 125–147. [DOI] [PubMed] [Google Scholar]
- Pack CC, Born RT (2001) Temporal dynamics of a neural solution to the aperture problem in visual area MT of macaque brain. Nature 409: 1040–1042. [DOI] [PubMed] [Google Scholar]
- Pack CC, Berezovskii VK, Born RT (2001) Dynamic properties of neurons in cortical area MT in alert and anaesthetized macaque monkeys. Nature 414: 905–908. [DOI] [PubMed] [Google Scholar]
- Pack CC, Livingstone M, Duffy K, Born RT (2003) End-stopping and the aperture problem: two-dimensional motion signals in macaque V1. Neuron 39: 671–680. [DOI] [PubMed] [Google Scholar]
- Peli E (1997) In search of a contrast metric: matching the perceived contrast of Gabor patches at different phases and bandwidths. Vision Res 37: 3217–3224. [DOI] [PubMed] [Google Scholar]
- Polat U, Mizobe K, Pettet MW, Kasamatsu T, Norcia AM (1998) Collinear stimuli regulate visual responses depending on cell's contrast threshold. Nature 391: 580–584. [DOI] [PubMed] [Google Scholar]
- Power RP, Moulden B (1992) Spatial gating effects on judged motion of gratings in apertures. Perception 21: 449–463. [DOI] [PubMed] [Google Scholar]
- Priebe NJ, Cassanello CR, Lisberger SG (2003) The neural representation of speed in macaque area MT/V5. J Neurosci 23: 5650–5661. [DOI] [PMC free article] [PubMed] [Google Scholar]
- Recanzone GH, Wurtz RH (2000) Effects of attention on MT and MST neuronal activity during pursuit initiation. J Neurophysiol 83: 777–790. [DOI] [PubMed] [Google Scholar]
- Recanzone GH, Wurtz RH, Schwarz U (1997) Responses of MT and MST neurons to one and two moving objects in the receptive field. J Neurophysiol 78: 2904–2915. [DOI] [PubMed] [Google Scholar]
- Robinson D (1963) A method of measuring eye movement using a scleral search coil in a magnetic field. IEEE Trans Biomed Eng 10: 137–145. [DOI] [PubMed] [Google Scholar]
- Rodman HR, Albright TD (1989) Single-unit analysis of pattern-motion selective properties in the middle temporal visual area (MT). Exp Brain Res 75: 53–64. [DOI] [PubMed] [Google Scholar]
- Rubin N, Hochstein S (1993) Isolating the effect of one-dimensional motion signals on the perceived direction of moving two-dimensional objects. Vision Res 33: 1385–1396. [DOI] [PubMed] [Google Scholar]
- Rubin N, Solomon S, Hochstein S (1995) Restricted ability to recover three-dimensional global motion from one-dimensional local signals: theoretical observations. Vision Res 35: 569–578. [DOI] [PubMed] [Google Scholar]
- Saito H, Tanaka K, Fukada Y, Oyamada H (1988) Analysis of discontinuity in visual contours in area 19 of the cat. J Neurosci 8: 1131–1143. [DOI] [PMC free article] [PubMed] [Google Scholar]
- Sceniak MP, Hawken MJ, Shapley R (2001) Visual spatial characterization of macaque V1 neurons. J Neurophysiol 85: 1873–1887. [DOI] [PubMed] [Google Scholar]
- Sceniak MP, Ringach DL, Hawken MJ, Shapley R (1999) Contrast's effect on spatial summation by macaque V1 neurons. Nat Neurosci 2: 733–739. [DOI] [PubMed] [Google Scholar]
- Shiffrar M, Li X, Lorenceau J (1995) Motion integration across differing image features. Vision Res 35: 2137–2146. [DOI] [PubMed] [Google Scholar]
- Shimojo S, Silverman GH, Nakayama K (1989) Occlusion and the solution to the aperture problem for motion. Vision Res 29: 619–626. [DOI] [PubMed] [Google Scholar]
- Shipp S, Zeki S (1989) The organization of connections between areas V5 and V1 in macaque monkey visual cortex. Eur J Neurosci 1: 309–332. [DOI] [PubMed] [Google Scholar]
- Simoncelli EP, Heeger DJ (1998) A model of neuronal responses in visual area MT. Vision Res 38: 743–761. [DOI] [PubMed] [Google Scholar]
- Snowden RJ, Treue S, Erickson RG, Andersen RA (1991) The response of area MT and V1 neurons to transparent motion. J Neurosci 11: 2768–2785. [DOI] [PMC free article] [PubMed] [Google Scholar]
- Stoner GR, Albright TD, Ramachandran VS (1990) Transparency and coherence in human motion perception. Nature 344: 153–155. [DOI] [PubMed] [Google Scholar]
- Tinsley CJ, Webb BS, Barraclough NE, Vincent CJ, Parker A, Derrington AM (2003) The nature of V1 neural responses to 2D moving patterns depends on receptive-field structure in the marmoset monkey. J Neurophysiol 90: 930–937. [DOI] [PubMed] [Google Scholar]
- Vinje WE, Gallant JL (2000) Sparse coding and decorrelation in primary visual cortex during natural vision. Science 287: 1273–1276. [DOI] [PubMed] [Google Scholar]
- Wallach H (1935) Uber visuell wahrgenommene Bewegungsrichtung. Psychol Forsch 20: 325–380. [Google Scholar]
- Weiss Y, Simoncelli EP, Adelson EH (2002) Motion illusions as optimal percepts. Nat Neurosci 5: 598–604. [DOI] [PubMed] [Google Scholar]
- Wilson HR, Ferrera VP, Yo C (1992) A psychophysically motivated model for two-dimensional motion perception. Vis Neurosci 9: 79–97. [DOI] [PubMed] [Google Scholar]
- Wuerger S, Shapley R, Rubin N (1996) “On the visually perceived direction of motion” by Hans Wallach: 60 years later. Perception 25: 1317–1367. [Google Scholar]
- Zetzsche C, Barth E (1990) Fundamental limits of linear filters in the visual processing of two-dimensional signals. Vision Res 30: 1111–1117. [DOI] [PubMed] [Google Scholar]