

Abstract
The process of generating functionally distinct neocortical areas requires the formation of an intra-neocortical connectivity map. Here, we explore the early development of murine intra-neocortical projections and find that axons from rostral and caudal neurons remain, respectively, within large rostral and caudal domains of the neonatal neocortex. Despite evidence that thalamic input can regulate neocortical areal properties, we found that the neonatal intra-neocortical projection pattern was not perturbed when thalamic input was absent in Gbx2 mutants. On the contrary, in Fgf8 hypomorphic mutants, the rostral neocortex of which acquires more caudal molecular properties, caudally located neurons ectopically project axons into the rostral cortex. Therefore, neocortical patterning by Fgf8 also contributes to arealization through mediating early development of intra-neocortical connectivity.
Keywords: cortex, Fgf8, Gbx2, connectivity, arealization, neocortex
Introduction
The formation of functional subdivisions, or areas, of the neocortex requires the orderly assembly of regionally distinct patterns of cellular organization and connectivity. There is increasing evidence that molecular mechanisms intrinsic to the cortical primordium play a cardinal role in specifying early aspects of neocortical organization (Miyashita-Lin et al., 1999; Nakagawa et al., 1999; Rubenstein et al., 1999; Fukuchi-Shimogori and Grove, 2001, 2003; O'Leary and Nakagawa, 2002; Garel et al., 2003; Grove and Fukuchi-Shimogori, 2003; Garel and Rubenstein, 2005). For instance, expression of the secreted protein FGF8 in the rostral telencephalon regulates the development of rostral neocortical areas (Fukuchi-Shimogori and Grove, 2001; Garel et al., 2003), in part through repressing the expression of Emx2 and COUPTF1 (Crossley et al., 2001; Fukuchi-Shimogori and Grove, 2003; Garel et al., 2003); these transcription factors are required for cortical patterning, particularly of the caudal neocortex (Bishop et al., 2000, 2002; Mallamaci et al., 2000; Zhou et al., 2001). Forming intra- and extra-neocortical connectivity maps are subsequent steps in generating neocortical areas. In murine Fgf8 hypomorphs, although molecular patterning is disrupted, the topography of thalamocortical projections is not discernibly altered (Garel et al., 2003). This may occur because the mechanisms controlling the initial topography of thalamocortical connections appear to rely on signals located outside of the cortex (Garel et al., 2002; DuFour et al., 2003; Seibt et al., 2003; Garel and Rubenstein, 2005). These results have particular salience for developmental and evolutionary biology because ectopic sensory inputs can partially re-specify the functional properties of a neocortical area (Frost, 1999; Sur and Leamey, 2001). Although it is clear that molecular mechanisms operating within the neocortex must participate in its connectivity properties (Vanderhaeghen et al., 2000; Fukuchi-Shimogori and Grove, 2001), there is little information about the mechanisms that generate the intraneocortical (cortico-cortico) wiring diagram, a key feature in defining the function and anatomical boundaries of a given neocortical area (Kaas, 1982). Here, we describe the early development of intra-neocortical projections and explore the roles of thalamic input and Fgf8-mediated regionalization on neonatal cortico-cortico projection maps in mice.
Materials and Methods
Genotyping and mouse colonies. All studies were conducted in strict accordance with protocol guidelines approved by the Committee on Animal Research at the University of California, San Francisco. Adult Fgf8neo heterozygous males and females (maintained in a mixed CD1 and 129G genetic background) and adult Gbx2 heterozygous males and females (maintained in a C57Bl6 genetic background) were mated to obtain homozygous Fgf8neo/neo and Gbx2-/- embryos and neonates. Standard PCR genotyping procedures were conducted to determine the genotype of the offspring (Wassarman et al., 1997; Meyers et al., 1998). Both wild-type and heterozygous littermates were used as control subjects because there were no apparent phenotypic differences between the two (Fgf8+/+ vs Fgf8neo/+ and Gbx2+/+ vs Gbx2+/-). For staging of embryonic day 16.5 (E16.5) wild-type embryos, E0.5 was set at noon of the day of vaginal plug visualization.
Tissue preparation. To obtain E16.5 wild-type embryos, pregnant mothers were killed via cervical dislocation at noon of the 16th day of pregnancy, and embryos were removed from the mother's uterus and killed via hypothermia. To obtain postnatal tissue, postnatal day 0 (P0) pups were killed via hypothermia, and P8 pups were given a lethal dose of Avertin. All pups were perfused transcardially, first with 0.9% buffered saline, then with 4% paraformaldehyde in 0.1 m phosphate buffer, pH 7.4. E16.5 embryos were fixed by immersion in 4% paraformaldehyde at 4°C. The brains of the embryos and pups were removed from the skull and postfixed overnight in 4% paraformaldehyde at 4°C. After fixation, all brains were hemisected along the mid-sagittal sinus. One hemisphere was used for axonal tracing and one for in situ hybridization (ISH), for accurate coregistration of the data.
In situ hybridization. All ISH hemispheres were embedded in gelatin-albumin and cut on a vibratome, into 100 μm sections. Hemispheres were cut in the sagittal or coronal plane. The free-floating ISH protocol (Garel et al., 1999) was conducted with the following probes: Id2 (a gift from M. Israel, Dartmouth Medical School, Hanover, NH) and RZRβ (a gift from M. Becker-Andre, U. Pierre and Marie Curie, Paris, France). After processing, all sections were mounted in a glycerol solution onto glass slides, coverslipped, analyzed, and digitally imaged using a light microscope and a SPOT imaging system connected to a Macintosh computer. Once imaged, individual sections were serially matched to the corresponding section in the opposite hemisphere where dyes were placed, to compare gene expression patterns with the injection site location and label spread and boundaries (Figs. 1, 2).
Figure 1.

Correlation of gene expression boundaries and developing intra-neocortical projections. a-c, Bimodal expression of Id2 in layer 5 at P0 (white arrowhead points to layer 5), high (H) caudally and low (L) more rostrally.d-f, Bimodal expression of RZRβ, high (H) rostrally and low (L) caudally. A boundary is observed when comparing neonatal (P0) expression of Id2 (H) and RZRβ (H) (a-f; white arrowhead). g-i, A DiI crystal (red) was placed in the caudal cortex (c; presumptive visual cortex) and a DiA crystal (green) in the rostral cortex (r; presumptive somatosensory cortex) at E16.5, P0, and P8 (for each age, 1 of 3 cases shown). Retrogradely labeled cells are asymmetrically distributed around the injection sites and do not cross a limit that is approximated by the Id2-RZRβ boundary (white arrowhead). The rostral limit of low Id2 expression in layer 5 correlates with the presumptive motor/somatosensory boundary in P6 mice (c; black arrowhead) (Rubenstein et al., 1999). Likewise, expression of RZRβ is reduced in layer 4 at the same location (f; black arrowhead). The asterisk in c marks the approximate caudal limit of Id2 expression in superficial layers of the cortex. To compare the gene expression (a-f) and dye labeling (g-i) results, anatomical landmarks were identified and are indicated by three hatch marks below each panel: I, rostral pole of the superior colliculus; II, rostral pole of the hippocampus; III, anterior commissure (see supplemental material, available at www.jneurosci.org). Dorsal (D) is up, and rostral (R) is to the right.
Figure 2.

Fluorescent photomicrographs showing caudal DiI (red asterisk) and rostral DiA (green asterisk) neocortical injection sites and resultant distributions of labeled cells in sagittal sections of a P0 wild-type brain (left; 1 of 3 cases shown). As shown in Figure 1, labeled cells form a label field about the injection site, and label fields from each injection site abut but donot overlap. The position where the two label fields abut is correlated with the boundary formed between the complementary high expression of Id2 and RZRβ at P0 (middle and right; arrowheads). Dorsal is up, and rostral is to the right.
Dye tracings. Methods for processing tissue injected with 1,1′-dioctadecyl-3,3,3′,3′-tetramethylindocarbocyanine perchlorate (DiI; Molecular Probes, Eugene, OR) and 4-4-di-hexadecyl aminostyryl N-methyl-pyridinium iodide (DiA; Molecular Probes) have been described previously (Godement et al., 1987; Garel et al., 2003). In each hemisected cortical hemisphere, dye crystals were placed in two of the following four locations: frontal (presumptive motor cortex), parietorostral (presumptive rostral somatosensory cortex), parietocaudal (presumptive caudal somatosensory cortex), and occipital (presumptive visual cortex) (see supplemental material, available at www.jneurosci.org). For dye placement, first a digital image of the hemisphere was taken, and a pre-constructed grid was superimposed on the image to determine dye placement location. This grid was used for consistent reliability of injection site location across cases. Once the position for dye insertion was determined, a small hole was made in the pia at the injection site location, using a 36 gauge syringe needle tip, and the DiI or DiA crystal was inserted into the cortical tissue, through the superficial and middle layers of the cortex. Care was taken to avoid penetration of the crystal into the underlying white matter. Dye brains were stored in 4% paraformaldehyde at room temperature, in darkness, for 8-12 weeks. Brains were then embedded in 5% low-melting point agarose and cut on a vibratome, into 100 μm sections.
Analysis of dye tracings. Each section was digitally imaged three times using different light/UV filters on a fluorescent microscope: blue for the Hoechst cellular counterstain, red for DiI, and green for DiA. These three images were merged and printed at high resolution for analysis. First, the images were organized serially, from rostral to caudal (see Fig. 4). The locations of the two injection sites were verified by observation of thalamocortical connectivity (see Fig. 8 for images of thalamic nuclei verification). For example, for a given case in which injections were made in the putative somatosensory cortex and putative visual cortex, the locations of these were verified by observing retrogradely labeled cells in the ventral posterior (VP) nucleus and the dorsal lateral geniculate nucleus (dLGN) of the thalamus, respectively (see Fig. 8). Second, the cerebral cortex in all coronal sections was “reconstructed” to further assess the injection site positions and the exact location of all resulting retrogradely labeled cell bodies. Anterogradely labeled axon terminals could be also seen in the same locations as cell bodies; however, we chose to limit our analysis to plotting retrogradely labeled cell bodies. Several characteristics of each section were traced and plotted by hand, over the original images, using clear acetate sheets. These characteristics included various landmarks (rostral pole of the superior colliculus, anterior commissure, thalamic nuclei, hippocampus, and vascular patterns) and injection site locations and spread (supplemental material, available at www.jneurosci.org). Three landmarks are noted on the reconstructions with hatch marks: I, rostral pole of the superior colliculus; II, anterior pole of the hippocampus; III, anterior commissure. In addition, all retrogradely labeled cell bodies were drawn on the reconstructions, defining their exact position in the cortex. All single section reconstructions were aligned in register using precise measurement of distance between sections and alignment of landmarks to use two-dimensional data from coronal sections to create a reconstruction of the cortical surface. The end result presents the data (specifically, location of injection sites and labeled cells) from coronal sections in a “flattened” lateral view of the cortical hemisphere. This way, both the rostrocaudal and dorsoventral dimensions of injections site and labeled cell spread can be easily appreciated. This “manually flattening” method is very effective in demonstrating the boundaries of cortical sensory regions using data from axonal tracing studies.
Figure 4.

Intra-neocortical projection patterns in neonatal mice lacking thalamocortical input (a′; Gbx2 null mutants; n = 3) or in mice with rostral patterning defects (b′; Fgf8neo/neo mutants; n = 8) compared with control littermates [a (n = 3), b (n = 8)]. P0 brains were double injected with DiI (red asterisk) and DiA (green asterisk) in the rostral (r) and caudal (c) neocortex. Coronal sections presented from rostral (left) to progressively more caudal (right) levels were analyzed for the distributions of labeled cell bodies. Gbx2 mutants were indistinguishable from wild type (a, a′). On the contrary, Fgf8neo/neo mutants showed a robust phenotype, indicated by red-green overlap (b′; panels 3-5) and red label caudal to this overlap (b′; panel 6), reflecting labeling of caudally positioned cell bodies by rostral dye placements.
Figure 8.

Digital images of DiI and DiA retrogradely labeled cells and axon tracts in the thalami of the Fgf8+/ (6 of 8 cases shown) and Fgf8neo/neo (6 of 8 cases shown) are shown. The cases shown here (a-f, a′-f′) correspond to cases a-f and a′-f′ reconstructed in Figure 6 and to cases a-f and a′-f′ in the supplemental material (available at www.jneurosci.org). By monitoring the distribution of label in the thalamus from a given cortical injection, we give additional definition to the injection site. For instance, dye placements in the caudal neocortex retrogradely label cells in the dLGN, whereas dye placements in the rostral cortex label cells in the region of the developing VP complex or ventral medial (VM; motor related) nuclei. This analysis ascertains that the dye placement position in controls and mutants corresponds to approximately the same cortical regions. These results also confirm recent findings (Garel et al., 2003) (i.e., thalamocortical topography is not altered in the mutant).
Results
The neocortical expression of several genes exhibits discontinuities that appear to prefigure functional subdivisions (Suzuki et al., 1997; Rubenstein et al., 1999; Vanderhaeghen et al., 2000; Yun et al., 2003). Here, we concentrated on the expression of Id2 (Fig. 1a-c) and RZRβ (Fig. 1d-f) at P0, which show complementary distributions (Miyashita-Lin et al., 1999; Rubenstein et al., 1999; Garel et al., 2003; Nakagawa and O'Leary, 2003). Id2 is strongly expressed in presumptive layer 5 in the caudal neocortex, where it shows two levels of expression (Fig. 1a-c). The domain of high expression (H) is caudal to the domain of low expression (L). RZRβ is expressed in a single cortical layer, where it shows high rostral expression (H) and low caudal expression (L) (Fig. 1d-f). The domains of RZRβ and layer 5 Id2 expression appear to abut (Fig. 1a-f, white arrowheads). We assessed whether the position of the Id2-RZRβ boundary correlates with the distributions of nascent intra-neocortical projections; these were visualized using rostral and caudal placements of lipophilic dye tracers that retrogradely label axons and cell bodies. DiA and DiI crystals were inserted, respectively, in the rostral neocortex (r) (presumptive somatosensory/motor cortex) and the caudal neocortex (c) (presumptive visual cortex) of E16.5, P0, and P8 wild-type brains (Figs. 1, 2, 3). We reconstructed the distribution of retrogradely labeled cell bodies on a flattened lateral representation of the neocortex (Fig. 1g-i). The locations of dye placements were verified by examination of retrogradely labeled cells in the thalamus (see Fig. 8). Dye in the caudal/visual cortex labeled the region of the developing dLGN; dye in the rostral/somatosensory cortex labeled the presumptive VP nucleus; dye in the frontal/motor cortex labeled the presumptive ventromedial nucleus. The neocortical cells labeled by the dyes were distributed asymmetrically around the injection sites, forming “label fields”; the asymmetry suggests biases in the intra-neocortical projection patterns. Furthermore, in most cases, the DiI (red) and DiA (green) label fields do not overlap, suggesting that, in wild-type mice, early intraneocortical projections respect a rostrocaudal limit (see Figs. 1, 2, 3, 4, 5, 6). The approximate position of this limit correlates with the boundary formed between the regions of high Id2 and RZRβ expression (Figs. 1, 2; white arrowhead). Thus, the distribution of early intra-neocortical projections shows regional specificity that is correlated with gene expression patterns. From E16.5 to P8, the laminar distribution of retrogradely labeled cells becomes progressively organized into two laminas that approximate layers 3 and 5 (supplemental material, available at www.jneurosci.org).
Figure 3.

Rostral to caudal series of coronal sections from wild-type cortices injected with DiI (red asterisk) and DiA (green asterisk), at three different ages: E16.5 (a), P0 (b), and P8 (c); one of three cases is shown for each age. At these three ages, labeled cell fields asymmetrically surround each dye placement site but do not overlap. Data from cases such as these were used in the reconstructions shown in Figure 1, g-i.
Figure 5.
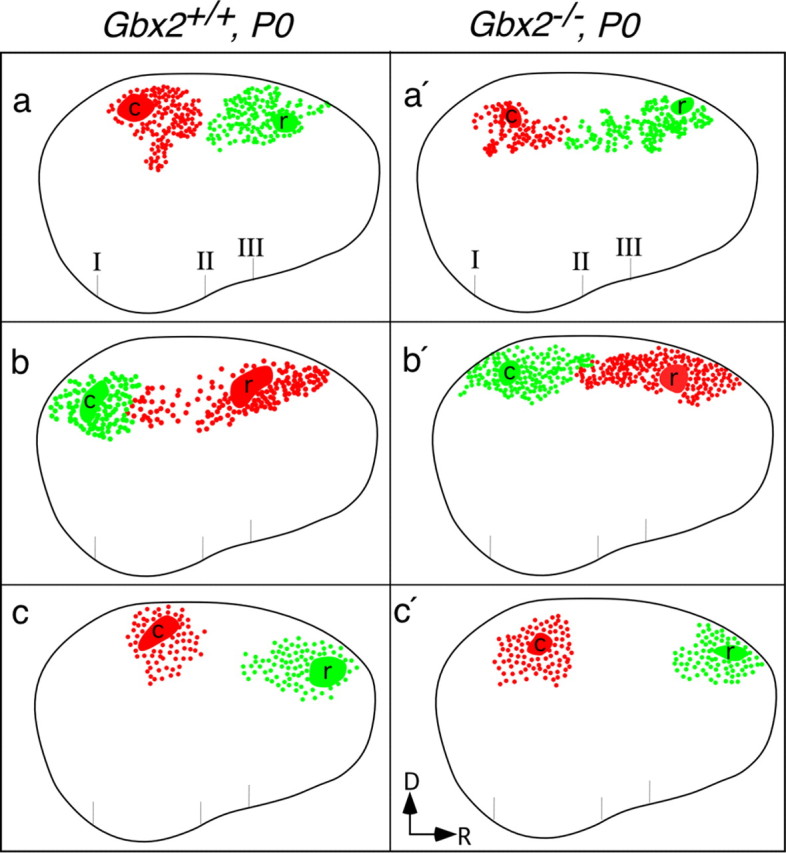
Schematic representations showing normal neonatal patterns of intra-neocortical projections in mice lacking thalamocortical input (Gbx2 null mutants). Three Gbx2+/+ control (a-c) cases and three Gbx2-/- (a′-c′) cases are represented. Note that c and c′ injection sites were approximately half the size of those in the other cases. Also note that the caudal extent of red label in b correlates with the more caudal position of the DiI label. Conventions are as in Figure 1, g-i. D, Dorsal; R, rostral.
Figure 6.
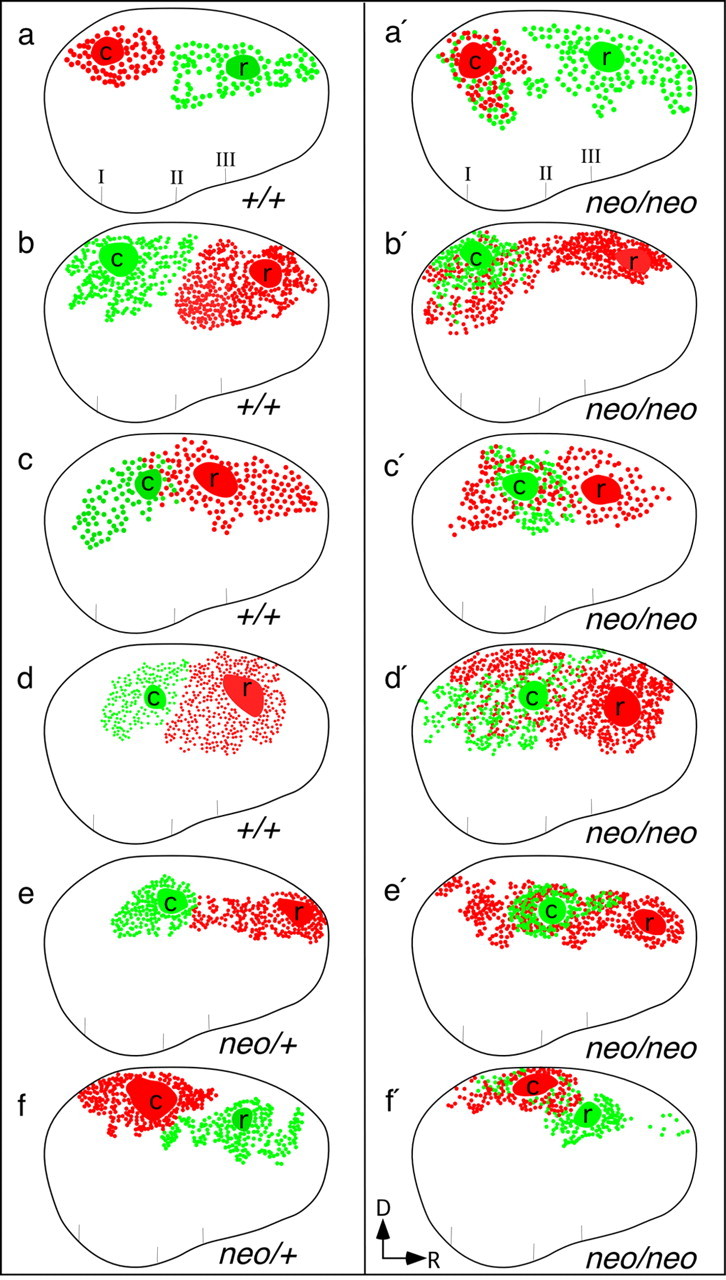
Schematic representations showing aberrant intra-neocortical projections in neonatal mice with abnormal neocortical rostral patterning (Fgf8neo/neo mutants). Fgf8+/+ (a-d; 4 of 5 cases), Fgf8neo/+ (e, f; 2 of 3 cases), and Fgf8neo/neo (a′-f′; 6 of 8 cases) are illustrated. b and b′ show a reconstruction of cases b and b′ in Figure 4. In Fgf8neo/neo mutants, rostral neocortical (r) dye placements robustly label caudally positioned cell bodies, demonstrating that some caudal cells project to a much more rostral position than normal. Conventions are as in Figures 1, g-i, and 5. D, Dorsal; R, rostral.
Next, we tested whether the development of intra-neocortical projections was regulated by thalamic afferents. For this purpose, we studied Gbx2-/- newborns whose cortex lacks most thalamic input but shows normal patterns of gene expression (Miyashita-Lin et al., 1999). We used the DiI-DiA labeling paradigm to compare intra-neocortical projections in Gbx2+/+ and Gbx2-/- littermates (Figs. 4a,a′, 5). As in the wild-type neocortex, the labeled fields from the rostral and caudal injections do not overlap in Gbx2-/- brains, demonstrating that the input from thalamic axons does not play a major role in controlling the formation of early intra-neocortical projections (Figs. 4a,a′, 5).
To begin identifying mechanisms that control intraneocortical connectivity patterns, we studied early neocortical projections in the Fgf8 hypomorphic mutant (Fgf8neo/neo), whose rostral neocortex has more caudal molecular features (Garel et al., 2003). Using the DiI-DiA paradigm, we found a profoundly altered projection pattern in the mutants, whose caudal neurons aberrantly project into the rostral cortex (Figs. 4b′, 6a′-f′). The retrogradely labeled cell fields resulting from the rostral (r) injections overlapped the label fields resulting from caudal (c) injections. Additionally, in some cases (Figs. 4b′, 6b′,c′,e′,f′), labeled cells from the rostral injection sites were observed in more caudal positions than cells labeled by the caudal injections. The aberrant projection of caudal axons into the rostral cortex of Fgf8neo/neo mutants was present at all ages tested (E16.5, E18.5, and P0) (supplemental material, available at www.jneurosci.org).
In conjunction with the alterations in intracortical projections, the Fgf8neo/neo mutants also exhibit molecular changes in the rostral parts of their cortical plate (Fig. 7). There is a rostral shift in the caudal boundary of high RZRβ expression (Fig. 7A,B; arrowhead) and a rostral shift in the caudal limit of the superficial domain of Id2 expression (Fig. 7A′,B′; asterisk). Therefore, whereas thalamocortical wiring is not grossly aberrant in the Fgf8neo/neo mutants (Garel et al., 2003) (Fig. 8) (supplemental material, available at www.jneurosci.org), their intra-neocortical wiring is severely disrupted. Analysis of contralateral projections was not possible because of a defect in the crossing of the corpus callosum (supplemental material, available at www.jneurosci.org).
Figure 7.

Shift in the limits of RZRβ and Id2 expression in the Fgf8neo/neo mutant cortex. Sagittal adjacent sections from Fgf8+/neo (A, A′) and Fgf8neo/neo (B, B′) E18.5 mice are shown. There is a rostral shift in the caudal boundary of high RZRβ expression (arrowhead) and a rostral shift in the caudal limit of the superficial domain of Id2 expression (asterisk).
Discussion
The development of different neocortical areas requires the formation of distinctive intra-neocortical wiring diagrams (Kaas, 1982). Our results provide insight into mechanisms that participate in the formation of early intra-neocortical projections maps and thus arealization. There are two lines of evidence for signals within the developing neocortex that regulate intra-neocortical axonal trajectories. First, the neuronal fields labeled by the retrograde transport of DiI-DiA are asymmetric, implying the existence of local positional information that biases the projection pattern (Fig. 1). Second, in wild-type mice, axon growth from rostral and caudal regions rarely crosses the middle of the cortex at the ages we investigated (Figs. 1, 2, 3, 4, 5, 6) (supplemental material, available at www.jneurosci.org). This segregation of axon projections correlates with changes in gene expression patterns (Figs. 1, 2) (supplemental material, available at www.jneurosci.org) and prefigures the development of subdivisions within the sensory neocortex [i.e., somatosensory (rostroparietal) and visual (caudal-occipital)].
Our analysis of intracortical projections was restricted to identifying retrogradely labeled cell bodies and therefore does not address the distribution of anterogradely labeled axon terminals; this will be investigated in future studies. It will be important to establish the laminar position, branching, and innervation patterns of the ectopic fibers in the Fgf8neo/neo mutants, because this should help characterize whether the ectopic molecular cues in the Fgf8neo/neo mutants affect the guidance and/or targeting of intracortical axons.
The restriction of axon projections between distinct presumptive neocortical locations may reflect the propensity of primary sensory areas to be more interconnected with secondary and tertiary areas of like-modality, then between areas of different modality (Felleman and Van Essen, 1991). In that regard, it is interesting that the lack of thalamic input in the Gbx2 mutant did not alter the neonatal intra-neocortical projection map (Figs. 4a,a′, 5) (Miyashita-Lin et al., 1999). Thus, apparently, thalamic afferents do not play a major role in formatting the initial distribution of intra-neocortical projections. In contrast, a reduction in FGF8 signaling had a profound effect: axon growth from caudal neurons no longer remained restricted to the caudal cortex (Figs. 4b,b′, 6) (see supplemental material, available at www.jneurosci.org). Reduced FGF8 signaling results in the ectopic expression of caudal molecular properties in rostral cortical progenitor cells (i.e., COUP-TFI, Dbx1, Emx2, and FgfR3), diminution of the frontal neocortex, and a rostral shift of the neocortex with laminar molecular features of the parietal cortex (Fukuchi-Shimogori and Grove, 2001, 2003; Garel et al., 2003) (Fig. 7). These changes also likely promote the growth of axons from caudal neurons into the rostral cortex (supplemental material, available at www.jneurosci.org).
There are several possible mechanisms that could account for alterations in intracortical projections in the Fgf8neo/neo mutants. In one scenario, the rostral cortex in the mutants ectopically expresses an attractant, or a permissive cue, for axons growing from caudal neurons, thereby leading to their aberrant growth into the rostral cortex. An alternative mechanism is described in the theoretical schema in the supplemental material (available at www.jneurosci.org). We postulate that the rostral and caudal cortex produce one, or several, substances that are either repellent or nonpermissive for the growth of axons from the caudal and rostral cortex, respectively. The results suggest that reducing FGF8 levels do not alter the relevant properties of the rostral neurons because they continue to be incapable of projecting their axons into the caudal cortex (Figs. 4b′, 6) (supplemental material, available at www.jneurosci.org). In contrast, the data suggest that FGF8 is essential for the ability of the rostral cortex to produce the factor(s) that prevent(s) caudal neurons from projecting their axons into rostral neocortical areas during the stages of development examined in this study. As indicated in Figure 6 and in the supplemental material (available at www.jneurosci.org), we do not know whether all caudal neurons are able to ectopically grow their axons into the rostral cortex of the Fgf8neo/neo mutants because there is always a substantial number of caudal neurons that are unlabeled by the rostral dye. A possible explanation for this result is that these unlabeled caudal neurons grow their axons into rostral regions that are not labeled by the rostral dye injection. Alternatively, there may be different types of neurons in the caudal cortex with distinct competence to grow rostrally. Future studies should address the molecular identities of the postulated factors that mediate the segregation of axonal projections between the rostral and caudal neocortex.
Two cardinal features that define a neocortical area are its interconnections with specific thalamic nuclei and its pattern of corticocortical connectivity. Here, we demonstrate that early aspects of these properties can be dissociated in both the Fgf8 and Gbx2 mutants. This study provides evidence that distinct developmental mechanisms underlie the acquisition of these defining features of neocortical areas.
Footnotes
This work was supported by research grants from the National Institute of Mental Health (NIMH) and the Giannini Family Foundation to K.J.H.; from the Human Frontiers Science Program to S.G.; and from Nina Ireland, the MIND Institute, the National Institute of Neurological Disorders and Stroke (NS34661-05A1), and NIMH (K02MH01046-01) to J.L.R.R.
Correspondence should be addressed to Dr. John L. R. Rubenstein, Nina Ireland Laboratory of Developmental Neurobiology, University of California, San Francisco, Genetics, Development and Behavioral Sciences Building, 1550 Fourth Street, Second Floor South, Room GD 284C, San Francisco, CA 94143-2611. E-mail: jlrr@itsa.ucsf.edu.
Copyright © 2004 Society for Neuroscience 0270-6474/04/248917-07$15.00/0
References
- Bishop KM, Goudreau G, O'Leary DDM (2000) Regulation of area identity in the mammalian neocortex by Emx2 and Pax6. Science 288: 344-349. [DOI] [PubMed] [Google Scholar]
- Bishop KM, Rubenstein JLR, O'Leary DDM (2002) Distinct actions of Emx1, Emx2, and Pax6 in regulating the specification of areas in the developing neocortex. J Neurosci 22: 7627-7638. [DOI] [PMC free article] [PubMed] [Google Scholar]
- Crossley PH, Martinez S, Ohkubo Y, Rubenstein JLR (2001) Coordinate expression of Fgf8, Otx2, Bmp4, and Shh in the rostral prosencephalon during development of the telencephalic and optic vesicles. Neuroscience 108: 183-206. [DOI] [PubMed] [Google Scholar]
- Dufour A, Seibt J, Passante L, Depaepe V, Ciossek T, Frisen J, Kullander K, Flanagan JG, Polleux F, Vanderhaeghen P (2003) Area specificity and topography of thalamocortical projections are controlled by ephrin/Eph genes. Neuron 39: 453-465. [DOI] [PubMed] [Google Scholar]
- Felleman DJ, Van Essen DC (1991) Distributed hierarchical processing in the primate cerebral cortex. Cereb Cortex 1: 1-47. [DOI] [PubMed] [Google Scholar]
- Frost DO (1999) Functional organization of surgically created visual circuits. Restor Neurol Neurosci 15: 107-113. [PubMed] [Google Scholar]
- Fukuchi-Shimogori T, Grove EA (2001) Neocortex patterning by the secreted signaling molecule FGF8. Science 294: 1071-1074. [DOI] [PubMed] [Google Scholar]
- Fukuchi-Shimogori T, Grove EA (2003) Emx2 patterns the neocortex by regulating FGF positional signaling. Nat Neurosci 6: 825-831. [DOI] [PubMed] [Google Scholar]
- Garel S, Rubenstein JLR (2004) Intermediate targets in the formation of topographic projections: inputs from the thalamocortical system. Trends Neurosci 27: 533-539. [DOI] [PubMed] [Google Scholar]
- Garel S, Rubenstein JLR (2005) Patterning of the cerebral cortex: the cognitive neurosciences, Ed 3 (Gazzaniga MS, ed). Cambridge, MA: MIT, in press.
- Garel S, Marin F, Grosschedl R, Charnay P (1999) Ebf1 controls early cell differentiation in the embryonic striatum. Development 126: 5285-5294. [DOI] [PubMed] [Google Scholar]
- Garel S, Yun K, Grosschedl R, Rubenstein JLR (2002) The early topography of thalamocortical projections is shifted in Ebf1 and Dlx1/2 mutant mice. Development 129: 5621-5634. [DOI] [PubMed] [Google Scholar]
- Garel S, Huffman KJ, Rubenstein JLR (2003) Molecular regionalization of the neocortex is disrupted in Fgf8 hypomorphic mutants. Development 130: 1903-1914. [DOI] [PubMed] [Google Scholar]
- Godement P, Vanselow J, Thanos S, Bonhoeffer F (1987) A study in developing visual systems with a new method of staining neurones and their processes in fixed tissue. Development 101: 697-713. [DOI] [PubMed] [Google Scholar]
- Grove EA, Fukuchi-Shimogori T (2003) Generating the cerebral cortical area map. Annu Rev Neurosci 26: 355-380. [DOI] [PubMed] [Google Scholar]
- Kaas JH (1982) The segregation of function in the nervous system: Why do sensory systems have so many subdivisions? Contrib Sens Physiol 7: 201-240. [Google Scholar]
- Mallamaci A, Muzio L, Chan CH, Parnavelas J, Boncinelli E (2000) Area identity shifts in the early cerebral cortex of Emx2-/- mutant mice. Nat Neurosci 3: 679-686. [DOI] [PubMed] [Google Scholar]
- Meyers EN, Lewandoski M, Martin GR (1998) An Fgf8 mutant allelic series generated by Cre- and Flp-mediated recombination. Nat Genet 18: 136-141. [DOI] [PubMed] [Google Scholar]
- Miyashita-Lin EM, Hevner R, Wassarman KM, Martinez S, Rubenstein JLR (1999) Early neocortical regionalization in the absence of thalamic innervation. Science 285: 906-909. [DOI] [PubMed] [Google Scholar]
- Nakagawa Y, O'Leary DD (2003) Dynamic patterned expression of orphan nuclear receptor genes ROR alpha and ROR beta in developing mouse forebrain. Dev Neurosci 25: 234-244. [DOI] [PubMed] [Google Scholar]
- Nakagawa Y, Johnson JE, O'Leary DDM (1999) Graded and areal expression patterns of regulatory genes and cadherins in embryonic neocortex independent of thalamocortical input. J Neurosci 19: 10877-10885. [DOI] [PMC free article] [PubMed] [Google Scholar]
- O'Leary DDM, Nakagawa Y (2002) Patterning centers, regulatory genes and extrinsic mechanisms controlling arealization of the neocortex. Curr Opin Neurobiol 12: 14-25. [DOI] [PubMed] [Google Scholar]
- Rubenstein JLR, Anderson S, Shi L, Miyashita-Lin E, Bulfone A, Hevner R (1999) Genetic control of cortical regionalization and connectivity. Cereb Cortex 9: 524-532. [DOI] [PubMed] [Google Scholar]
- Seibt J, Schuurmans C, Gradwhol G, Dehay C, Vanderhaeghen P, Guillemot F, Polleux F (2003) Neurogenin2 specifies the connectivity of thalamic neurons by controlling axon responsiveness to intermediate target cues. Neuron 39: 439-452. [DOI] [PubMed] [Google Scholar]
- Sur M, Leamey CA (2001) Development and plasticity of cortical areas and networks. Nat Rev Neurosci 2: 251-262. [DOI] [PubMed] [Google Scholar]
- Suzuki SC, Inoue T, Kimura Y, Tanaka T, Takeichi M (1997) Neuronal circuits are subdivided by differential expression of type-II classic cadherins in postnatal mouse brains. Mol Cell Neurosci 9: 433-447. [DOI] [PubMed] [Google Scholar]
- Vanderhaeghen P, Lu Q, Prakash N, Frisen J, Walsh CA, Frostig RD, Flanagan JG (2000) A mapping label required for normal scale of body representation in the cortex. Nat Neurosci 3: 358-365. [DOI] [PubMed] [Google Scholar]
- Wassarman KM, Lewandowski M, Campbell K, Joyner AL, Rubenstein JLR, Martinez S, Martin GR (1997) Specification of the anterior hindbrain and establishment of a normal mid/hindbrain organizer is dependent on Gbx2 gene function. Development 124: 2923-2934. [DOI] [PubMed] [Google Scholar]
- Yun ME, Johnson RR, Antic A, Donoghue MJ (2003) EphA family gene expression in the developing mouse neocortex: regional patterns reveal intrinsic programs and extrinsic influence. J Comp Neurol 456: 203-216. [DOI] [PubMed] [Google Scholar]
- Zhou C, Tsai SY, Tsai MJ (2001) COUP-TFI: an intrinsic factor for early regionalization of the neocortex. Genes Dev 15: 2054-2059. [DOI] [PMC free article] [PubMed] [Google Scholar]