

Abstract
Exocytosis of synaptic vesicles occurs not only at synaptic active zones but also at ectopic sites. Ectopic exocytosis provides a direct and rapid mechanism for neurons to communicate with glia that does not rely on transmitter spillover from the synaptic cleft. In the cerebellar cortex the processes of Bergmann glia cells encase synapses between presynaptic climbing fiber varicosities and postsynaptic Purkinje cell spines and express both AMPA receptors and electrogenic glutamate transporters. AMPA receptors expressed by Purkinje cells and Bergmann glia cells are activated predominantly by synaptic and ectopic release, respectively, and therefore can be used to compare the properties of the two release mechanisms. We report that vesicular release differs at synaptic and ectopic sites in the magnitude of short-term plasticity and the proportions of Ca2+ channel subtypes that trigger glutamate release. High-affinity glutamate transporter-mediated currents in Bergmann glia cells follow the rules of synaptic release more closely than the rules of ectopic release, indicating that the majority of glutamate is released from conventional synapses. On the other hand, ectopic release produces high-concentration glutamate transients at Bergmann glia cell membranes that are necessary to activate low-affinity AMPA receptors rapidly. Ectopic release may provide a geographical cue to guide Bergmann glia cell membranes to surround active synapses and ensure efficient uptake of glutamate that diffuses out of the synaptic cleft.
Keywords: Bergmann glia, Purkinje cell, synaptic transmission, short-term plasticity, spillover, glutamate transporter
Introduction
Exocytosis of synaptic vesicles occurs not only at synaptic active zones but also at sites outside of the active zones, i.e., ectopic sites. Freeze-fracture studies of the neuromuscular junction (Ceccarelli et al., 1979, 1988; Grohovaz et al., 1989), FM1-43 imaging studies that use total internal reflection fluorescence microscopy of retinal bipolar cells (Zenisek et al., 2000, 2003), and ultrastructural studies of hair cells (Beutner et al., 2001; Lenzi et al., 2002) all support the existence of ectopic release. How ectopic release is controlled and regulated remains primarily unknown. We have shown previously that ectopic release from cerebellar climbing fibers (CFs) and parallel fibers (PFs) can be detected by Bergmann glia cells (BGs) (Matsui and Jahr, 2003) that encase CF and PF synapses on Purkinje cells (PCs) (Palay and Chan-Palay, 1974; Spacek, 1985; Xu-Friedman et al., 2001; Grosche et al., 2002). AMPA receptors (AMPARs) and glutamate transporters expressed by PCs and BGs are activated differentially by glutamate released from synaptic and ectopic sites because of both their 10- to ∼100-fold different affinities for glutamate and their distinct locations. Because of this, they can be used to compare the properties of synaptic and ectopic release.
Ectopic release may be particularly important for the maintenance of BG processes that surround CF→ PC synapses. AMPARs expressed by BGs are Ca2+-permeable (Burnashev et al., 1992) because they lack the glutamate receptor 2 (GluR2) subunit. The introduction of GluR2 to BGs by viral delivery causes BG processes to retract from the synapse (Iino et al., 2001). Therefore, it is likely that the Ca2+-permeable AMPARs are necessary to maintain glial encasement of active synapses. However, AMPARs have a low affinity for glutamate (EC50 = 1.2 to ∼1.8 mm) (Bergles et al., 1997; Dzubay and Jahr, 1999) and are not particularly well suited for the detection of low concentrations of glutamate that diffuse from the synaptic cleft (but see Nielsen et al., 2004). Exocytosis directly across the extracellular space from the BG membrane more readily activates these low-affinity receptors (Matsui and Jahr, 2003). The determination of the mechanism and regulation of ectopic release is therefore important for understanding neural-glial communication.
We report that synaptic and ectopic release differ in key attributes, including short-term plasticity and the source of Ca2+ influx for triggering release. These differences in release mechanisms provide evidence for the presence of separate release sites governing synaptic transmission to neurons and glia. In contrast to AMPAR-mediated currents evoked in BGs, synaptically activated glutamate transporter currents (STCs) in BGs have properties closer to synaptic release than to ectopic release. It appears that high-affinity glutamate transporters expressed by BGs (Km = 10 to ∼100 μm) (Bergles et al., 1997; Danbolt, 2001) are well situated for detection and clearance of glutamate diffusing from the synaptic cleft. Thus the two glutamate receptors expressed by BGs have distinct roles: the low-affinity AMPARs detect ectopic release and promote encasement of active synapses, whereas high-affinity glutamate transporters take up glutamate released in the synaptic cleft as well as at ectopic sites and at least partially protect neighboring synapses from spillover.
Materials and Methods
Tissue preparation. Parasagittal (250 μm) or coronal (350 μm) cerebellar slices from postnatal day 12-15 (P12-P15) rats were used for the studies of CF-evoked and PF-evoked responses, respectively. Animals were anesthetized by inhalation of halothane and were decapitated, as approved by the Oregon Health and Science University Institutional Animal Care and Use Committee. Cerebella were cut with a vibroslicer (Leica Instruments, Nussloch, Germany) in ice-cold solution containing (in mm) 119 NaCl, 2.5 KCl, 2 CaCl2, 1.3 MgCl2, 1 NaH2PO4, 26.2 NaHCO3, and 11 glucose (saturated with 95% O2/5% CO2). The slices were incubated in the same solution at 34°C for 30 min and then stored at room temperature. During the recording the slices were superfused with the above solution with the addition of 100 μm picrotoxin to block GABAA receptors. All recordings were performed at 32-35°C, attained by using an in-line heating device (Warner Instruments, Hamden, CT).
Electrophysiological recording. Slices were visualized by using a 40× water immersion objective on an Axioskop 2 FS upright microscope (Zeiss, Thornwood, NY) equipped with infrared differential interference contrast. Whole-cell recordings were made with a MultiClamp 700A patch-clamp amplifier (Axon Instruments, Union City, CA). Signals were filtered at 2-4 kHz and digitized at 10-50 kHz with an ITC-18 interface (Instrutech, Port Washington, NY), using acquisition software written by J. S. Diamond in IgorPro software (WaveMetrics, Lake Oswego, OR). Pipettes with resistances of 1-2 or 2-3 MΩ were used for recordings from PCs and BGs, respectively. Series resistance was compensated by ∼80% for the PC recordings, but not for the BG recordings. PCs typically were voltage clamped at -10 to -30 mV and BGs at -65 mV. CFs were stimulated in parasagittal slices with a theta glass pipette filled with bath solution placed in the granule cell layer, using a constant voltage isolated stimulator (20-100 μsec pulse of 10-99 mV; Digitimer, Hertfordshire, UK). The pipette position and stimulus intensity were adjusted until the voltage necessary to produce an all-or-none response was minimized. PFs were stimulated in coronal slices with the stimulating electrode placed in the molecular layer ∼100 μm from the recorded cell. Data analysis was performed with Axograph 4.6 (Axon Instruments), and statistical analysis was performed with Microsoft Excel (Redmond, WA) and StatView (SAS Institute, Cary, NC). Reported values are given as the mean ± SD.
Pipette solutions and drugs. Pipette solutions for PC recordings contained (in mm) 35 CsF, 100 CsCl, 10 HEPES, and 10 EGTA. Pipette solutions for BG recordings contained 82 CsCH3SO3, 40 CsCl, 20 HEPES, 10 HEDTA, and 3 BaCl2 (Ba2+ was included to increase input resistance of BG) (Matsui and Jahr, 2003). Both pipette solutions were titrated to pH 7.2 with CsOH. The sources of the chemicals are as follows: picrotoxin was from Sigma (St. Louis, MO); (R,S)-α-cyclopropyl-4-phosphonophenylglycine (CPPG), cyclothiazide (CTZ), γ-d-glutamylglycine (γ-d-GG), 2,3-dioxo-6-nitro-1,2,3,4-tetrahydrobenzo [f]quinoxaline-7-sulfonamide (NBQX), and dl-threo-β-benzyloxyaspartic acid (TBOA) were from Tocris Cookson (Ellisville, MO); ω-agatoxin IVA was from Peptides International (Louisville, KY); ω-conotoxin GVIA was from Bachem Biosciences (King of Prussia, PA). ω-Agatoxin IVA and ω-conotoxin GVIA were applied in the presence of 0.1 mg/ml cytochrome c to block nonspecific binding sites.
Results
Short-term plasticity of synaptic versus ectopic release
CF stimulation causes multivesicular release at individual synapses on PCs, and this results in saturation of postsynaptic AMPARs (Wadiche and Jahr, 2001; Foster et al., 2002; Harrison and Jahr, 2003). Pairs of CF stimuli result in paired-pulse depression of the PC EPSC (Dittman and Regehr, 1998; Hashimoto and Kano, 1998; Silver et al., 1998), the magnitude of which is increased when AMPAR saturation is prevented by the rapidly dissociating competitive antagonist γ-d-GG (2 mm) (Fig. 1A) (Wadiche and Jahr, 2001; Foster et al., 2002). Because fewer vesicles are released at each synapse after the second stimulus than after the first, a smaller glutamate concentration transient results. Rapidly dissociating antagonists inhibit ligand binding resulting from smaller concentration transients more than from larger transients and therefore will alter the paired-pulse ratio (PPR = EPSC2/EPSC1) at synapses in which multivesicular release occurs (Tong and Jahr, 1994; Wadiche and Jahr, 2001; Foster et al., 2002). Because γ-d-GG prevents AMPAR saturation, the CF-PC EPSC follows changes in release more linearly in the presence of γ-d-GG than in its absence (Foster et al., 2002).
Figure 1.
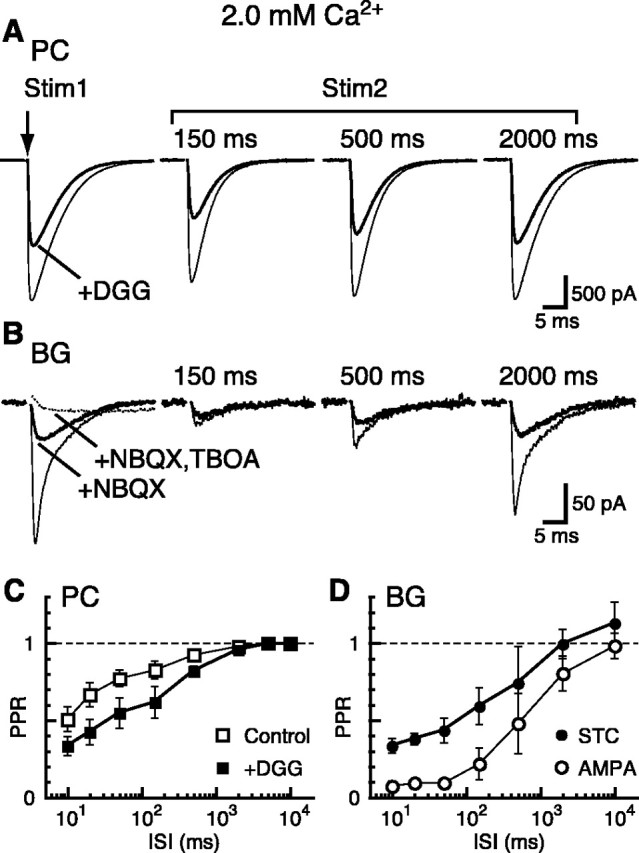
PPR recovery of CF-PC EPSCs and CF-BG responses in 2 mm Ca2+. A, Shown are pairs of CF-PC EPSCs evoked at interstimulus intervals (ISIs) indicated at the top of the traces. Paired stimuli were separated by 15-25 sec. The application of 2 mm γ-d-GG (thick line) decreased the amplitude of the first EPSC but reduced the second EPSC further, causing a decrease in the paired-pulse ratio (PPR = the amplitude of the second EPSC divided by the first EPSC).For ISIs shorter than 50 msec, the EPSCs overlapped. The second EPSC was isolated by subtracting the average of an unpaired EPSC (Vh = -10 mV at 32-35°C). B, Pairs of CF-BG responses were evoked at the same ISIs as above. NBQX (10 μm) blocked AMPAR-mediated currents, isolating the STCs (thick line). Subtraction of the STCs from the control traces (thin line) yielded the AMPAR-mediated component of the evoked response. The STC could be abolished completely with the application of 50 μm TBOA (dotted line). Other illustrated records are the result of subtracting traces recorded at the end of the experiment in NBQX and TBOA to reduce contamination by the stimulus artifact and the small but prolonged potassium component (Bergles and Jahr, 1997) (Vh = -65 mV). C, PPR of CF-PC EPSCs plotted as a function of ISI for control and γ-d-GG conditions. Each data point represents the data in 3-17 cells. Note that the x-axis is in log scale. Error bars in this and all other figures indicate SD. D, PPR of CF-BG responses plotted as a function of ISI for the AMPAR-mediated current and STC component. Each data point represents the data in three to seven cells.
BG responses to CF stimulation consist of two components, a rapid AMPAR-mediated component and a slower glutamate transporter-mediated component; these components can be separated with the AMPAR antagonist NBQX (Fig. 1B) (Bergles et al., 1997; Dzubay and Jahr, 1999). As shown in Figure 1B, there was a remarkable decrease in the PPR of the BG AMPAR-mediated current, much larger than the PPR decrease of the CF-PC EPSC or the CF-BG STC, especially at short intervals (Fig. 1C,D). This large paired-pulse depression is not the result of desensitization because AMPARs recover much too rapidly to account for this depression (Raman and Trussell, 1995; Eliasof and Jahr, 1997; Wadiche and Jahr, 2001), and the depression is still seen in the presence of CTZ (Harrison and Jahr, 2003) (see below).
On the other hand, the PPR of the CF-BG STC was very similar to that of the CF-PC EPSC in the presence of γ-d-GG (Fig. 1C,D). This suggests that activation of the high-affinity BG glutamate transporters mainly reflects glutamate released from spillover of glutamate from the synaptic cleft (but see below), whereas activation of the low-affinity BG AMPARs predominantly reflects release from ectopic sites (Matsui and Jahr, 2003).
Short-term plasticity in low Ca 2+
Paired-pulse depression of the CF-PC EPSC is almost eliminated when extracellular Ca2+ is lowered to 0.5 mm (Fig. 2A,C). In addition, multivesicular release abates and CF synapses release at most a single vesicle per action potential (Wadiche and Jahr, 2001; Foster et al., 2002). In this condition of monovesicular release, BG AMPARs are activated predominantly, if not exclusively, by ectopic release; thus the CF-BG AMPAR-mediated current can be used to monitor changes in ectopic release in the absence of spillover from the synaptic active zones (Matsui and Jahr, 2003).
Figure 2.
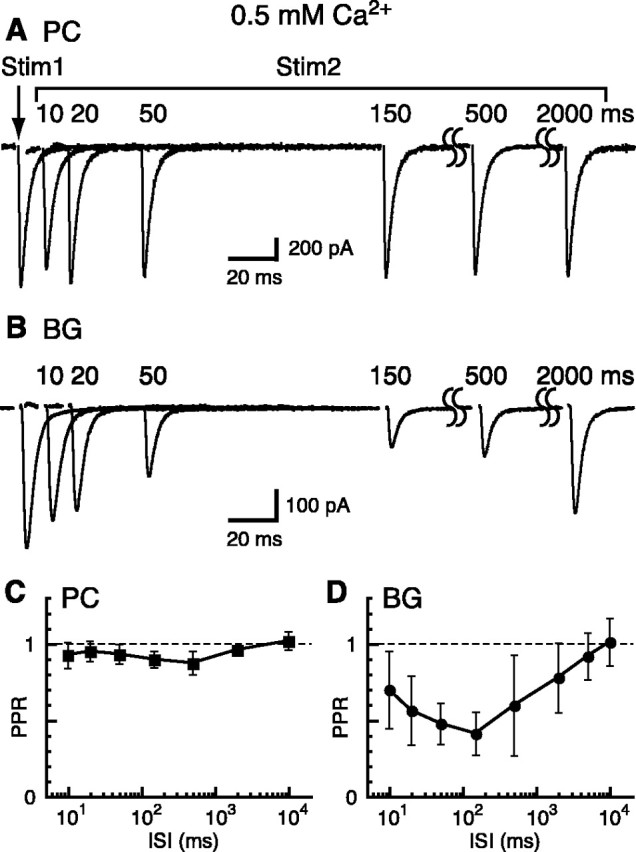
PPR recovery of CF-PC EPSCs and CF-BG responses in 0.5 mm Ca2+. A, Paired-pulse responses of CF-PC EPSCs in 0.5 mm Ca2+ and 2.8 mm Mg2+ (Vh = -10 mV). B, Paired-pulse responses of CF-BG responses in 0.5 mm Ca2+, 2.8 mm Mg2+, and 200 μm CTZ (Vh = -65 mV). These responses are mediated predominantly by AMPARs, because there is very little contribution by the STC in this condition (Matsui and Jahr, 2003). C, PPR of CF-PC EPSCs plotted as a function of ISI (n = 3-20 cells). D, PPR of CF-BG responses plotted as a function of ISI (n = 4-35 cells).
In contrast to the lack of short-term plasticity of the CF-PC EPSC in 0.5 mm Ca2+, the CF-BG AMPAR response still depressed, but with a peculiar time course (Fig. 2B,D). At an interstimulus interval (ISI) of 10 msec, paired-pulse depression of the CF-BG AMPAR response depressed less than at longer intervals; maximum depression was achieved at 150 msec. At an ISI of 150 msec the depression was significantly larger than that of the CF-PC EPSC (PC PPR, 0.90 ± 0.05, n = 20; BG PPR, 0.41 ± 0.14, n = 35; unpaired t test, p < 0.001) as well as that of the CF-BG AMPAR response at 10 msec (BG PPR, 0.70 ± 0.25, n = 28; paired t test, p < 0.001). PPR recovered fully by ∼10 sec. These differences in PPR in BGs and PCs in 0.5 and 2 mm Ca2+ suggest that separate rules govern synaptic and ectopic release.
How is the biphasic PPR recovery curve of the CF-BG AMPAR response in 0.5 mm Ca2+ produced? It may be that, like the CF-PC EPSC, depression of presynaptic release is diminished greatly by low Ca2+ and that the relatively slow onset of depression is a postsynaptic phenomenon. AMPAR desensitization is not responsible, however, because CTZ (200 μm) was present in the recordings, although this does not rule out some different type of activity-dependent downregulation of AMPAR responsiveness. Two pieces of evidence, however, suggest that a decreased postsynaptic sensitivity is not responsible. First, two iontophoretic pulses of glutamate applied 150 msec apart resulted in identical responses in both BGs and PCs (Fig. 3). This suggests that AMPARs on the BG membrane are not downregulated by exposure to glutamate. However, because glutamate presented by exocytotic release will result in a different concentration transient than iontophoresis does, we turned to another excitatory pathway in the cerebellum, the PFs, which show paired-pulse facilitation (Atluri and Regehr, 1996) and release directly onto BGs (Matsui and Jahr, 2003).
Figure 3.

Responses of PCs and BGs to iontophoresis of glutamate. A, Responses of a PC and a BG to paired iontophoretic pulses (5 msec, -5 to approximately -50 nA, with the braking current of +1.2 to approximately +1.7 nA; 200 to ∼400 MΩ iontophoretic electrode) of glutamate (1 m, pH 8.0) at an ISI of 150 msec (PC, Vh = -10 mV; BG, Vh = -65 mV). Extracellular solution contained 0.5 mm Ca2+, 2.8 mm Mg2+, and 200 μm CTZ to match the condition of Figure 2. The iontophoresis electrodes were placed in the molecular layer at locations that produced large responses. Currents were blocked with 10 μm NBQX in both cell types (data not shown). In the illustrated recordings, three intensities of pulses were applied for each cell. B, Summary of the PPR of the responses to iontophoresis pulses. The open bar represents the average PC PPR (n = 4), and the filled bar represents the average BG PPR (n = 5). A very small amount of facilitation was observed in both cells, which suggests that a small amount of “tip-warming effect” occurs at the iontophoresis electrode tip, causing a slightly larger amount of glutamate to be released on the second pulse.
Short-term plasticity in PF-evoked responses
PF stimulation evoked EPSCs in PCs that showed marked paired-pulse facilitation and had a maximum PPR value of 2.48 ± 0.44 (n = 5) at an ISI of 10 msec in 2 mm Ca2+; this facilitation lasted for ∼150 msec (Fig. 4A,C) (Atluri and Regehr, 1996). Facilitation of the PF-BG response had a similar time course but was remarkably larger; the PPR was 4.95 ± 1.88 (n = 4) at an ISI of 10 msec (Fig. 4B,D) (unpaired t test, p < 0.05). Facilitation of the PF-BG response, as well as the iontophoresis results, indicates that the depression seen with CF stimulation does not result from AMPAR downregulation. The different degree of paired-pulse facilitation in the PF-PC EPSC and the PF-BG response also suggests that PC and BG monitor glutamate release from different sites of PFs as well as CFs.
Figure 4.
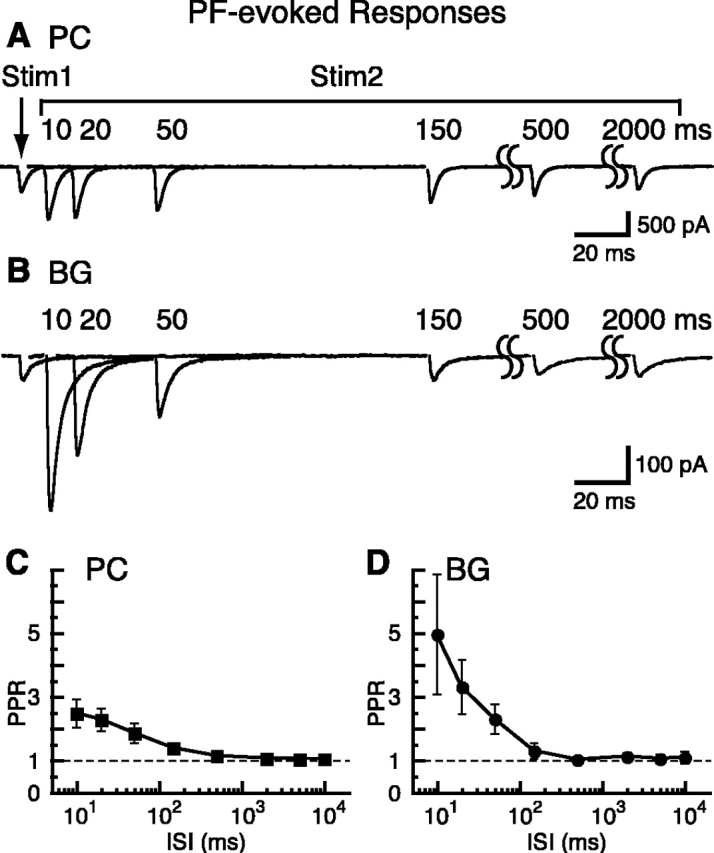
PPR recovery of PF-PC EPSCs and PF-BG responses. A, Paired PF-PC EPSCs in 2 mm Ca2+ and 1.3 mm Mg2+ (Vh = -30 mV). B, Paired PF-BG responses in 2 mm Ca2+, 1.3 mm Mg2+, and 200 μm CTZ (Vh = -65 mV). PF-BG responses were recorded in the presence of CTZ to block desensitization, augment the AMPAR response, and minimize the proportion of the PF-BG current caused by glutamate transport (Dzubay and Jahr, 1999). Therefore, in the presence of CTZ, most of the PF-BG response is mediated by AMPARs and could be blocked by 10 μm NBQX (data not shown). C, PPR of PF-PC EPSCs versus ISI (n = 3-5 cells). D, PPR of PF-BG responses versus ISI (n = 3-9 cells).
Effects of transport blockade
Glutamate transporters may alter the CF-BG AMPAR response PPR by buffering different proportions of the glutamate transient that follow the first and second stimulus (Harrison and Jahr, 2003) and thereby could contribute to the differences in PPRs recorded in PCs and BGs. The glutamate transporter blocker TBOA should eliminate this effect. However, in the presence of 0.5 mm Ca2+ and 200 μm CTZ the application of 30 μm TBOA caused an increase in the amplitudes of both CF-BG AMPAR responses but no change in PPR (Fig. 5A,B) (increase in first response, 1.70 ± 0.36 of control; PPR in control, 0.39 ± 0.20; PPR in TBOA, 0.41 ± 0.18; n = 4). The increase in both responses indicates that the BG AMPARs are protected somewhat by glutamate transporters that can compete with AMPARs for released glutamate. However, because TBOA increased both CF-BG AMPAR responses to a similar degree, the extent of shielding of the AMPARs by glutamate transporters is not different between the two stimuli in these conditions and therefore cannot account for the depression. In 2 mm Ca2+ and CTZ the shielding of BG AMPARs by glutamate transporters does affect the CF-BG AMPAR PPR (Harrison and Jahr, 2003). However, even after we inhibited the glutamate transporters with 30 μm TBOA and blocked the mGluR-mediated presynaptic inhibition that is found in TBOA with 500 μm CPPG (Harrison and Jahr, 2003), the CF-BG AMPAR PPR was still much smaller than the CF-PC EPSC PPR in γ-d-GG (at 150 msec ISI; PC PPR, 0.71 ± 0.02, n = 4; BG PPR, 0.29 ± 0.11, n = 8; unpaired t test, p < 0.001).
Figure 5.

Glutamate transporters do not cause a large paired-pulse depression in CF-BG responses. A, CF-BG responses to paired-pulse stimuli with an ISI of 150 msec in 0.5 mm Ca2+, 2.8 mm Mg2+, and 200 μm CTZ (Vh = -65 mV). The application of 30 μm TBOA (thick line) increased both the first and the second response but had no effect on the PPR. B, Summary of the PPR of CF-BG response before (open bar) and after the application of TBOA (filled bar; n = 4).
Paired recordings from PC and BG
Because postsynaptic mechanisms apparently cannot account for the different degrees of paired-pulse depression seen in PCs and BGs, presynaptic mechanisms were investigated. In the preceding recordings from PCs and BGs the membrane potential of the closely associated PC was not controlled; therefore, the PC likely fired complex spikes after CF stimulation. However, in voltage-clamp recordings of PCs the membrane potential was held constant at -10 to approximately -30 mV. If complex spikes cause the release of a substance that affects presynaptic release properties (e.g., cannabinoids or glutamate) (Kreitzer and Regehr, 2001; Duguid and Smart, 2004), this could account for the different PPRs in the two cells. We tested this possibility by recording simultaneously from pairs of PCs and BGs that share the same CF.
Cells in which responses to CF stimulation succeed or fail coincidentally were considered to share input from the same CF (Fig. 6A). In 2 mm Ca2+ the difference in PPRs in the two cell types was maintained despite the voltage-clamped PC (Fig. 6A). Similarly, when the solution was changed to 0.5 mm Ca2+ and 200 μm CTZ, the difference in PPRs of the two cells remained (Fig. 6B,C) (PC PPR, 0.83 ± 0.06; BG PPR, 0.35 ± 0.11; n = 7 cell pairs; paired t test, p < 0.001) as found in individual recordings (Fig. 2). This confirms that synaptic and ectopic release have different degrees of short-term plasticity that is not caused by retrograde transmission from PCs.
Figure 6.

PPR difference between PCs and BGs persists in paired recordings. A, Paired recording from a PC (Vh = -10 mV) and a BG (Vh = -65 mV) in 2 mm Ca2+, 1.3 mm Mg2+, and no CTZ. Paired stimuli (timing shown by arrowheads) were given at an interval of 150 msec; stimulus strength was set near threshold so that some failures of CF stimulation occurred. The CF-evoked responses either succeeded or failed at the same time in the two cells, indicating that the two cells share the same CF. B, Responses to paired-pulse stimulation from the same cells as in A, with the extracellular solution changed to 0.5 mm Ca2+, 2.8 mm Mg2+, and 200 μm CTZ. Notice that the PPR difference in the two cells persists at this condition. C, Summary of the PPR at an ISI of 150 msec in paired recordings in the same condition as in B. Open bar is for CF-PC EPSC, and filled bar is for CF-BG responses (n = 7 cell pairs; paired t test, *p < 0.001).
Subtype of Ca2+ channel responsible for synaptic and ectopic release
The different amplitudes of paired-pulse depression of synaptic and ectopic release as monitored by PCs and BGs could reflect a dependence on different proportions of Ca2+ channel subtypes. At both the CF→ PC synapse (Regehr and Mintz, 1994) and the calyx of Held (Wu et al., 1999) P/Q-type Ca2+ channels are coupled more strongly to release than are N-type Ca2+ channels. In addition, P/Q-type channels are concentrated at active zones, whereas N-type channels are distributed more evenly throughout the calyx of Held (Wu et al., 1999). If Ca2+ channel subtypes are distributed similarly in the CF terminal, N-type Ca2+ channels may have a larger role in triggering ectopic release than synaptic release.
CF-evoked synaptic and ectopic release were monitored in PC and BG recordings, respectively, in 0.5 mm Ca2+. Application of the P/Q-type Ca2+ channel-specific blocker ω-agatoxin IVA (200 nm) (Mintz et al., 1992) in large part inhibited the responses in both PCs and BGs (Fig. 7A,B) (PC, 0.17 ± 0.08 of control, n = 5; BG, 0.11 ± 0.07 of control, n = 5). However, the N-type Ca2+ channel-specific blocker ω-conotoxin GVIA (1 μm) (Fujita et al., 1993) only partially blocked the CF-PC EPSC (0.40 ± 0.10 of control; n = 4), whereas it almost completely abolished the CF-BG response (0.09 ± 0.07 of control; n = 4) (Fig. 7C,D). N-type Ca2+ channels therefore have a larger role in triggering ectopic release than synaptic release.
Figure 7.

CF-PC EPSCs and CF-BG responses are affected differentially by subtype-specific Ca2+ channel blockers. A, CF-PC EPSCs were recorded in 0.5 mm Ca2+ and 2.8 mm Mg2+ (Vh = -10 mV), and CF-BG responses were recorded in the same divalents with 200 μm CTZ (Vh = -65 mV) in the absence and presence of the P/Q-type Ca2+ channel blocker ω-agatoxin IVA (200 nm). B, Summary of the ratio of the response amplitudes in the presence and absence of ω-agatoxin IVA in A. CF-PC EPSC (n = 5); CF-BG response (n = 5). C, CF-PC EPSCs and CF-BG responses were recorded in the same conditions as in A in the absence and presence of the N-type Ca2+ channel blocker ω-conotoxin GVIA (1 μm). D, Summary of the ratio of the response amplitude in the presence and absence of ω-conotoxin GVIA in C. CF-PC EPSC (n = 4); CF-BG response (n = 4); unpaired t test, *p = 0.002. E, ω-Conotoxin GVIA (1 μm) partially blocked the CF-PC EPSC but mainly blocked the initial fast component of the CF-BG response, whereas the late slow component was blocked less (gray lines in BG recordings are double exponential fits). CF-PC EPSCs were recorded in 2 mm Ca2+, 1.3 mm Mg2+, and 2 mm γ-d-GG (Vh = -10 mV); CF-BG responses were recorded with the same divalents without γ-d-GG (Vh = -65 mV). F, Summary of the ratio of response amplitudes in the presence and absence of ω-conotoxin GVIA in E. CF-PC EPSC (n = 5); CF-BG response (n = 5); ANOVA and Fisher's PLSD post hoc test, significantly different for all combinations; *p < 0.004.
How are the CF-evoked responses in PC and BG affected by ω-conotoxin GVIA in more physiological conditions (2 mm Ca2+)? In the presence of γ-d-GG, to protect PC AMPARs from saturation, we reduced the CF-PC EPSC to 0.64 ± 0.08 of control by ω-conotoxin GVIA (n = 5) (Fig. 7E,F). The CF-BG response is composed of an AMPAR-mediated current and an STC in 2 mm Ca2+. The contribution of each component was evaluated by fitting the decay of the response with two exponential time constants, with the amplitude of the fast and slow components corresponding to the AMPAR-mediated current and STC component, respectively (τfast = 1.37 ± 0.31 msec; τslow = 10.94 ± 1.28 msec; n = 5) (Matsui and Jahr, 2003). ω-Conotoxin GVIA affected the two components differently. Although the AMPAR-mediated current was reduced to 0.17 ± 0.11 of control, the STC was reduced much less, to 0.43 ± 0.07 (n = 5). We suggest that, even in normal levels of Ca2+, the CF-BG AMPAR component mainly reflects ectopic release. Because the reduction of the STC by ω-conotoxin GVIA fell between that of the CF-PC EPSC and the CF-BG AMPAR response, we conclude that BG glutamate transporters take up glutamate released from both ectopic and synaptic sites.
Discussion
We find that the properties of synaptic transmission from CF to PC and CF to BG are significantly different. Compared with CF-PC EPSCs, CF-BG AMPAR responses exhibit larger paired-pulse depression and greater dependence on Ca2+ influx through N-type Ca2+ channels. These differences indicate that PC and BG AMPARs detect glutamate released from different sources and support the idea that ectopic release mediates rapid transmission between neurons and glia in the cerebellum.
Physiological relevance of highly depressing ectopic release
CF-BG AMPAR responses show dramatic paired-pulse depression, much larger than that of the CF-PC EPSC, indicating that ectopic release is not well suited for high-frequency transmission. However, the CF-BG response recovers fully in a few seconds and, because the in vivo firing rate of CFs is typically very low (∼1 Hz) (Armstrong and Rawson, 1979; Ito, 1984), ectopic release will not be a rare event. Although inferior olivary neurons, which give rise to CFs, can fire action potentials at a frequency of ∼10 Hz (Llinás and Yarom, 1986), such high-frequency firing likely occurs in short bursts in physiological conditions (Lang et al., 1999). High-frequency bursts may cause reliable transmission to BG only after the first action potential. This extreme form of depression essentially works as a steep low-pass filter for CF-BG transmission.
Mechanism of depression of ectopic release
What property of ectopic release makes the CF-BG AMPAR response depress so dramatically? In the case of conventional glutamatergic synaptic transmission, a low PPR generally is ascribed to high release probability, the depression resulting from the depletion of readily releasable synaptic vesicles by the first stimulus (Zucker and Regehr, 2002). However, in the case of CF-BG AMPAR responses, low PPR persists even when the extracellular Ca2+ is reduced to 0.5 mm, similar to the case reported at inhibitory synapses (Galarreta and Hestrin, 1998; Kraushaar and Jonas, 2000; Kirischuk et al., 2002). In low Ca2+ the depression is less at very short intervals (∼10 msec) than at longer intervals (∼150 msec). This unique result suggests that not all of the vesicles are depleted with the first stimulus. One could imagine that, at short stimulus intervals, residual intracellular Ca2+ would allow Ca2+ entering from the second action potential to spread further from the source of Ca2+ influx, allowing vesicles at more distant sites to be exposed to concentrations of Ca2+ sufficient for ectopic release. This partial reversal of depression lasts ∼150 msec, similar to the time course of facilitation at PF synapses that results from residual Ca2+ (Atluri and Regehr, 1996).
Alternatively, activity could regulate differentially the synaptic and ectopic release probability. For example, feedback by transmitters could be responsible for the differences in synaptic and ectopic PPRs. However, homosynaptic mGluR activation is not responsible for the depression because mGluR antagonists had no effect on the magnitude or the time course of recovery of CF-BG PPR (data not shown) (Harrison and Jahr, 2003), and a G-protein-coupled mechanism for depression seems unlikely because it starts as early as ∼10 msec, too fast for G-protein-mediated mechanisms (Hille, 2001). Endocannabinoid-mediated suppression of release is similarly unlikely because its actions occur even more slowly (Kreitzer and Regehr, 2001; Maejima et al., 2001; Wilson and Nicoll, 2001). In addition, the paired voltage-clamp recordings of PCs and BGs would have disrupted most forms of retrograde signal from PC to CF terminals, yet the low PPR of CF-BG AMPAR responses remained.
Another intriguing possibility for the mechanism of suppression of release is the inactivation of Ca2+ channels (Hille, 2001). Presynaptic Ca2+ channels can inactivate rapidly enough to explain the onset of the depression and can persist for seconds (Dobrunz et al., 1997; Forsythe et al., 1998; Kirischuk et al., 2002). The reason that synaptic release and ectopic release behave differently could be either that the Ca2+ channels responsible for ectopic release are more prone to inactivation (N-type Ca2+ channels inactivate more readily than the P/Q-type) (Patil et al., 1998) or that release machinery for ectopic release is more sensitive to small changes in Ca2+ influx (Harrison and Jahr, 2003) or both. Fluorometric Ca2+ measurements of CFs have shown that action potential-induced presynaptic Ca2+ transients do not show paired-pulse depression (Kreitzer et al., 2000). However, it is possible that the decreased Ca2+ influx resulting from inactivation of N-type Ca2+ channels is immeasurable in the context of bulk intracellular Ca2+. Selective adaptation of the Ca2+ sensor for ectopic vesicles also could account for the depression (Chapman et al., 1995; Hsu et al., 1996).
Dependence of ectopic release on Ca2+ influx
The CF-BG AMPAR response is more sensitive to the inhibition of Ca2+ influx than the CF-PC EPSC (Harrison and Jahr, 2003). In addition, increasing internal Ca2+ buffering by the application of EGTA-AM suppressed CF-BG AMPAR responses more dramatically than in the CF-PC EPSCs (Matsui and Jahr, 2003). In the current study we have shown that N-type Ca2+ channels play a larger role in triggering glutamate release at ectopic sites than at synaptic sites. If P/Q-type Ca2+ channels are concentrated in the synaptic active zone and N-type Ca2+ channels are distributed throughout the presynaptic terminal, as has been shown at the calyx of Held synapse (Wu et al., 1999), this could explain the larger role of N-type Ca2+ channels in mediating ectopic release. However, P/Q-type Ca2+ channel blockers also suppressed CF-BG responses nearly completely, indicating that Ca2+ influx triggering ectopic release is not solely through the peripheral N-type Ca2+ channels. Because ectopic release is also more sensitive to increases in Ca2+ buffering, it is possible that the distance between the Ca2+ channels and vesicles is not coupled as tightly as at the synaptic sites (Meinrenken et al., 2002). Whether the distance of ectopic fusion events from the Ca2+ channels, as well as the Ca2+ sensitivity of ectopic exocytosis machinery, differs from synaptic events remains to be determined.
Spillover depends on the detector
The size of the PPR differed dramatically between the AMPAR response and STC component of the CF-BG responses. In addition, the degree of block of the two components by the N-type Ca2+ channel blocker ω-conotoxin GVIA is different. These differences arise from the disparate affinities of the two glutamate receptors and thus their ability to detect extracellular glutamate. Low-affinity AMPARs readily detect rapid and high concentration transients of glutamate, making them suitable for detecting local ectopic release. The affinity of glutamate transporters is 10 to ∼100 times higher than that of AMPARs (Bergles et al., 1997; Danbolt, 2001), allowing them to detect lower glutamate transients as well. Whether glutamate spillover is significant depends on the type of detectors that are present as well as their distance from the site of release. The lower sensitivity of the CF-BG STC to ω-conotoxin GVIA, as well as its PPR, suggests that vesicular release from both ectopic and synaptic sites activates BG glutamate transporters and that release from synaptic sites exceeds that from ectopic sites.
BG AMPAR activation by CF stimulation is rapid and terminates with a time constant of 1 to ∼2 msec in the absence of CTZ. These Ca2+-permeable AMPARs have rapid kinetics (Bergles et al., 1997; Dzubay and Jahr, 1999) that, in aspiny dendrites of neocortical fast-spiking interneurons, results in highly localized Ca2+ signals (Goldberg et al., 2003). Because Ca2+ influx via BG AMPARs is required for the maintenance of glial wrapping of the CF→ PC synapse (Iino et al., 2001), it is likely that localized Ca2+ increases in BG (Grosche et al., 1999) provide geographical cues as to where the active synapses are located. In addition to the rapid kinetics of the AMPAR, exocytosis directly across the extracellular space from the BG membrane also is required for localized Ca2+ increases. Low concentration and prolonged glutamate transients resulting from spillover, coupled with high-affinity slowly activating receptors such as mGluRs, would allow less precise signaling in both time and space. Because a blockade of glutamate transporters increased the peak amplitude of CF-BG AMPAR responses, AMPARs and glutamate transporters likely are expressed near each other, possibly intermingling, and compete for extracellular glutamate (Tong and Jahr, 1994; Diamond and Jahr, 1997). This arrangement additionally may tune the localization and timing of BG AMPAR activation and the subsequent Ca2+ rise. Whether such temporal and spatial resolution occurs will require Ca2+ imaging from the fine processes of BG.
Footnotes
This work was supported by the Research Fellowship of the Uehara Memorial Foundation (to K.M.), Human Frontiers Science Program (Grant RG119/2000 to C.E.J.), and National Institutes of Health (Grant NS40056 to C.E.J.). We thank John Harrison, Richard Piet, and Jacques Wadiche for valuable suggestions on these experiments and comments on this manuscript.
Correspondence should be addressed to Craig E. Jahr, Vollum Institute, Oregon Health and Science University, L474, 3181 Southwest Sam Jackson Park Road, Portland, OR 97239. E-mail: jahr@ohsu.edu.
Copyright © 2004 Society for Neuroscience 0270-6474/04/248932-08$15.00/0
References
- Armstrong DM, Rawson JA (1979) Activity patterns of cerebellar cortical neurones and climbing fibre afferents in the awake cat. J Physiol (Lond) 289: 425-448. [DOI] [PMC free article] [PubMed] [Google Scholar]
- Atluri PP, Regehr WG (1996) Determinants of the time course of facilitation at the granule cell→ Purkinje cell synapse. J Neurosci 16: 5661-5671. [DOI] [PMC free article] [PubMed] [Google Scholar]
- Bergles DE, Jahr CE (1997) Synaptic activation of glutamate transporters in hippocampal astrocytes. Neuron 19: 1297-1308. [DOI] [PubMed] [Google Scholar]
- Bergles DE, Dzubay JA, Jahr CE (1997) Glutamate transporter currents in Bergmann glial cells follow the time course of extrasynaptic glutamate. Proc Natl Acad Sci USA 94: 14821-14825. [DOI] [PMC free article] [PubMed] [Google Scholar]
- Beutner D, Voets T, Neher E, Moser T (2001) Calcium dependence of exocytosis and endocytosis at the cochlear inner hair cell afferent synapse. Neuron 29: 681-690. [DOI] [PubMed] [Google Scholar]
- Burnashev N, Khodorova A, Jonas P, Helm PJ, Wisden W, Monyer H, Seeburg PH, Sakmann B (1992) Calcium-permeable AMPA-kainate receptors in fusiform cerebellar glial cells. Science 256: 1566-1570. [DOI] [PubMed] [Google Scholar]
- Ceccarelli B, Grohovaz F, Hurlbut WP (1979) Freeze-fracture studies of frog neuromuscular junctions during intense release of neurotransmitter. II. Effects of electrical stimulation and high potassium. J Cell Biol 81: 178-192. [DOI] [PMC free article] [PubMed] [Google Scholar]
- Ceccarelli B, Fesce R, Grohovaz F, Haimann C (1988) The effect of potassium on exocytosis of transmitter at the frog neuromuscular junction. J Physiol (Lond) 401: 163-183. [DOI] [PMC free article] [PubMed] [Google Scholar]
- Chapman ER, Hanson PI, An S, Jahn R (1995) Ca2+ regulates the interaction between synaptotagmin and syntaxin 1. J Biol Chem 270: 23667-23671. [DOI] [PubMed] [Google Scholar]
- Danbolt NC (2001) Glutamate uptake. Prog Neurobiol 65: 1-105. [DOI] [PubMed] [Google Scholar]
- Diamond JS, Jahr CE (1997) Transporters buffer synaptically released glutamate on a submillisecond time scale. J Neurosci 17: 4672-4687. [DOI] [PMC free article] [PubMed] [Google Scholar]
- Dittman JS, Regehr WG (1998) Calcium dependence and recovery kinetics of presynaptic depression at the climbing fiber→ Purkinje cell synapse. J Neurosci 18: 6147-6162. [DOI] [PMC free article] [PubMed] [Google Scholar]
- Dobrunz LE, Huang EP, Stevens CF (1997) Very short-term plasticity in hippocampal synapses. Proc Natl Acad Sci USA 94: 14843-14847. [DOI] [PMC free article] [PubMed] [Google Scholar]
- Duguid IC, Smart TG (2004) Retrograde activation of presynaptic NMDA receptors enhances GABA release at cerebellar interneuron-Purkinje cell synapses. Nat Neurosci 7: 525-533. [DOI] [PubMed] [Google Scholar]
- Dzubay JA, Jahr CE (1999) The concentration of synaptically released glutamate outside of the climbing fiber-Purkinje cell synaptic cleft. J Neurosci 19: 5265-5274. [DOI] [PMC free article] [PubMed] [Google Scholar]
- Eliasof S, Jahr CE (1997) Rapid AMPA receptor desensitization in catfish cone horizontal cells. Vis Neurosci 14: 13-18. [DOI] [PubMed] [Google Scholar]
- Forsythe ID, Tsujimoto T, Barnes-Davies M, Cuttle MF, Takahashi T (1998) Inactivation of presynaptic calcium current contributes to synaptic depression at a fast central synapse. Neuron 20: 797-807. [DOI] [PubMed] [Google Scholar]
- Foster KA, Kreitzer AC, Regehr WG (2002) Interaction of postsynaptic receptor saturation with presynaptic mechanisms produces a reliable synapse. Neuron 36: 1115-1126. [DOI] [PubMed] [Google Scholar]
- Fujita Y, Mynlieff M, Dirksen RT, Kim MS, Niidome T, Nakai J, Friedrich T, Iwabe N, Miyata T, Furuichi T, Furutama D, Mikoshiba K, Mori Y, Beam KG (1993) Primary structure and functional expression of the ω-conotoxin-sensitive N-type calcium channel from rabbit brain. Neuron 10: 585-598. [DOI] [PubMed] [Google Scholar]
- Galarreta M, Hestrin S (1998) Frequency-dependent synaptic depression and the balance of excitation and inhibition in the neocortex. Nat Neurosci 1: 587-594. [DOI] [PubMed] [Google Scholar]
- Goldberg JH, Tamas G, Aronov D, Yuste R (2003) Calcium microdomains in aspiny dendrites. Neuron 40: 807-821. [DOI] [PubMed] [Google Scholar]
- Grohovaz F, Fesce R, Haimann C (1989) Dual effect of potassium on transmitter exocytosis. Cell Biol Int Rep 13: 1085-1095. [DOI] [PubMed] [Google Scholar]
- Grosche J, Matyash V, Moller T, Verkhratsky A, Reichenbach A, Kettenmann H (1999) Microdomains for neuronglia interaction: parallel fiber signaling to Bergmann glial cells. Nat Neurosci 2: 139-143. [DOI] [PubMed] [Google Scholar]
- Grosche J, Kettenmann H, Reichenbach A (2002) Bergmann glial cells form distinct morphological structures to interact with cerebellar neurons. J Neurosci Res 68: 138-149. [DOI] [PubMed] [Google Scholar]
- Harrison J, Jahr CE (2003) Receptor occupancy limits synaptic depression at climbing fiber synapses. J Neurosci 23: 377-383. [DOI] [PMC free article] [PubMed] [Google Scholar]
- Hashimoto K, Kano M (1998) Presynaptic origin of paired-pulse depression at climbing fibre-Purkinje cell synapses in the rat cerebellum. J Physiol (Lond) 506: 391-405. [DOI] [PMC free article] [PubMed] [Google Scholar]
- Hille B (2001) Ionic channels of excitable membranes. Sunderland, MA: Sinauer.
- Hsu SF, Augustine GJ, Jackson MB (1996) Adaptation of Ca2+-triggered exocytosis in presynaptic terminals. Neuron 17: 501-512. [DOI] [PubMed] [Google Scholar]
- Iino M, Goto K, Kakegawa W, Okado H, Sudo M, Ishiuchi S, Miwa A, Takayasu Y, Saito I, Tsuzuki K, Ozawa S (2001) Glia-synapse interaction through Ca2+-permeable AMPA receptors in Bergmann glia. Science 292: 926-929. [DOI] [PubMed] [Google Scholar]
- Ito M (1984) The cerebellum and neural control. New York: Raven.
- Kirischuk S, Clements JD, Grantyn R (2002) Presynaptic and postsynaptic mechanisms underlie paired pulse depression at single GABAergic boutons in rat collicular cultures. J Physiol (Lond) 543: 99-116. [DOI] [PMC free article] [PubMed] [Google Scholar]
- Kraushaar U, Jonas P (2000) Efficacy and stability of quantal GABA release at a hippocampal interneuron→principal neuron synapse. J Neurosci 20: 5594-5607. [DOI] [PMC free article] [PubMed] [Google Scholar]
- Kreitzer AC, Regehr WG (2001) Retrograde inhibition of presynaptic calcium influx by endogenous cannabinoids at excitatory synapses onto Purkinje cells. Neuron 29: 717-727. [DOI] [PubMed] [Google Scholar]
- Kreitzer AC, Gee KR, Archer EA, Regehr WG (2000) Monitoring presynaptic calcium dynamics in projection fibers by in vivo loading of a novel calcium indicator. Neuron 27: 25-32. [DOI] [PubMed] [Google Scholar]
- Lang EJ, Sugihara I, Welsh JP, Llinás R (1999) Patterns of spontaneous Purkinje cell complex spike activity in the awake rat. J Neurosci 19: 2728-2739. [DOI] [PMC free article] [PubMed] [Google Scholar]
- Lenzi D, Crum J, Ellisman MH, Roberts WM (2002) Depolarization redistributes synaptic membrane and creates a gradient of vesicles on the synaptic body at a ribbon synapse. Neuron 36: 649-659. [DOI] [PubMed] [Google Scholar]
- Llinás R, Yarom Y (1986) Oscillatory properties of guinea-pig inferior olivary neurones and their pharmacological modulation: an in vitro study. J Physiol (Lond) 376: 163-182. [DOI] [PMC free article] [PubMed] [Google Scholar]
- Maejima T, Hashimoto K, Yoshida T, Aiba A, Kano M (2001) Presynaptic inhibition caused by retrograde signal from metabotropic glutamate to cannabinoid receptors. Neuron 31: 463-475. [DOI] [PubMed] [Google Scholar]
- Matsui K, Jahr CE (2003) Ectopic release of synaptic vesicles. Neuron 40: 1173-1183. [DOI] [PubMed] [Google Scholar]
- Meinrenken CJ, Borst JG, Sakmann B (2002) Calcium secretion coupling at calyx of Held governed by nonuniform channel-vesicle topography. J Neurosci 22: 1648-1667. [DOI] [PMC free article] [PubMed] [Google Scholar]
- Mintz IM, Venema VJ, Swiderek KM, Lee TD, Bean BP, Adams ME (1992) P-type calcium channels blocked by the spider toxin ω-Aga-IVA. Nature 355: 827-829. [DOI] [PubMed] [Google Scholar]
- Nielsen TA, DiGregorio DA, Silver RA (2004) Modulation of glutamate mobility reveals the mechanism underlying slow-rising AMPAR EPSCs and the diffusion coefficient in the synaptic cleft. Neuron 42: 757-771. [DOI] [PubMed] [Google Scholar]
- Palay SL, Chan-Palay V (1974) Cerebellar cortex. New York: Springer.
- Patil PG, Brody DL, Yue DT (1998) Preferential closed-state inactivation of neuronal calcium channels. Neuron 20: 1027-1038. [DOI] [PubMed] [Google Scholar]
- Raman IM, Trussell LO (1995) The mechanism of α-amino-3-hydroxy-5-methyl-4-isoxazolepropionate receptor desensitization after removal of glutamate. Biophys J 68: 137-146. [DOI] [PMC free article] [PubMed] [Google Scholar]
- Regehr WG, Mintz IM (1994) Participation of multiple calcium channel types in transmission at single climbing fiber to Purkinje cell synapses. Neuron 12: 605-613. [DOI] [PubMed] [Google Scholar]
- Silver RA, Momiyama A, Cull-Candy SG (1998) Locus of frequency-dependent depression identified with multiple-probability fluctuation analysis at rat climbing fibre-Purkinje cell synapses. J Physiol (Lond) 510: 881-902. [DOI] [PMC free article] [PubMed] [Google Scholar]
- Spacek J (1985) Three-dimensional analysis of dendritic spines. III. Glial sheath. Anat Embryol (Berl) 171: 245-252. [DOI] [PubMed] [Google Scholar]
- Tong G, Jahr CE (1994) Block of glutamate transporters potentiates postsynaptic excitation. Neuron 13: 1195-1203. [DOI] [PubMed] [Google Scholar]
- Wadiche JI, Jahr CE (2001) Multivesicular release at climbing fiber-Purkinje cell synapses. Neuron 32: 301-313. [DOI] [PubMed] [Google Scholar]
- Wilson RI, Nicoll RA (2001) Endogenous cannabinoids mediate retrograde signaling at hippocampal synapses. Nature 410: 588-592. [DOI] [PubMed] [Google Scholar]
- Wu LG, Westenbroek RE, Borst JG, Catterall WA, Sakmann B (1999) Calcium channel types with distinct presynaptic localization couple differentially to transmitter release in single calyx-type synapses. J Neurosci 19: 726-736. [DOI] [PMC free article] [PubMed] [Google Scholar]
- Xu-Friedman MA, Harris KM, Regehr WG (2001) Three-dimensional comparison of ultrastructural characteristics at depressing and facilitating synapses onto cerebellar Purkinje cells. J Neurosci 21: 6666-6672. [DOI] [PMC free article] [PubMed] [Google Scholar]
- Zenisek D, Steyer JA, Almers W (2000) Transport, capture and exocytosis of single synaptic vesicles at active zones. Nature 406: 849-854. [DOI] [PubMed] [Google Scholar]
- Zenisek D, Davila V, Wan L, Almers W (2003) Imaging calcium entry sites and ribbon structures in two presynaptic cells. J Neurosci 23: 2538-2548. [DOI] [PMC free article] [PubMed] [Google Scholar]
- Zucker RS, Regehr WG (2002) Short-term synaptic plasticity. Annu Rev Physiol 64: 355-405. [DOI] [PubMed] [Google Scholar]