

Abstract
We examined the neural encoding of synthetic and natural sounds by single neurons in the auditory system of male zebra finches by estimating the mutual information in the time-varying mean firing rate of the neuronal response. Using a novel parametric method for estimating mutual information with limited data, we tested the hypothesis that song and song-like synthetic sounds would be preferentially encoded relative to other complex, but non-song-like synthetic sounds. To test this hypothesis, we designed two synthetic stimuli: synthetic songs that matched the power of spectral-temporal modulations but lacked the modulation phase structure of zebra finch song and noise with uniform band-limited spectral-temporal modulations. By defining neural selectivity as relative mutual information, we found that the auditory system of songbirds showed selectivity for song-like sounds. This selectivity increased in a hierarchical manner along ascending processing stages in the auditory system. Midbrain neurons responded with highest information rates and efficiency to synthetic songs and thus were selective for the spectral-temporal modulations of song. Primary forebrain neurons showed increased information to zebra finch song and synthetic song equally over noise stimuli. Secondary forebrain neurons responded with the highest information to zebra finch song relative to other stimuli and thus were selective for its specific modulation phase relationships. We also assessed the relative contribution of three response properties to this selectivity: (1) spiking reliability, (2) rate distribution entropy, and (3) bandwidth. We found that rate distribution and bandwidth but not reliability were responsible for the higher average information rates found for song-like sounds.
Keywords: birdsong, field L, Mld, CM, information, complex sounds
Introduction
An animal's ability to discriminate behaviorally relevant sounds is crucial for social interaction and reproductive success (Catchpole, 1987; Ghazanfar and Hauser, 2001). Recent work has shown that auditory neurons are tuned for acoustical features found in conspecific vocalizations. Using synthetic stimuli, studies have shown that midbrain and forebrain auditory neurons exhibit tuning for specific frequency modulations (FMs) (Allon et al., 1981; Fuzessery, 1994), amplitude modulations (AMs) (Langner and Schreiner, 1988), comodulations (Nelken et al., 1999), sound durations (Casseday et al., 1994), and frequency-delay pairs (Pollak et al., 1977; Suga et al., 1978) found in animal vocalizations (Creutzfeldt et al., 1980; Narins and Capranica, 1980; Rose and Capranica, 1983), including human speech (Chi et al., 1999). Additionally, studies have shown that some neurons in the mammalian auditory cortex and the avian auditory forebrain are preferentially excited by animal vocalizations relative to acoustically similar synthetic sounds (Newman and Wollberg, 1978; Rauschecker et al., 1995; Wang et al., 1995; Grace et al., 2003). When contrasted with the simple tonotopy of peripheral auditory neurons, this suggests that natural sound selectivity may arise in a hierarchical manner within the auditory processing stream. Furthermore, recent information theoretic studies have shown that neural responses to synthetic stimuli with natural spectral content (Rieke et al., 1995) and amplitude distributions (Escabi et al., 2003; Machens et al., 2003) yield higher information rates and efficiencies than responses to non-naturalistic synthetic stimuli.
We extended previous studies by testing the neural encoding of synthetic stimuli that matched not only the power spectrum and the amplitude distributions, but also the joint spectral and temporal power in the amplitude modulations of natural sounds, known as the modulation power spectrum (MPS) (Singh and Theunissen, 2003). The MPS quantifies the AMs and FMs present in sound that, as described above, are important acoustical parameters for neural recognition. We compared the neural encoding of natural sounds with these matched synthetic sounds.
To quantify neural encoding, we implemented a novel method of estimating mutual information with limited trial data. We estimated the mutual information between sound and neural responses of single auditory neurons in the zebra finch, for which behaviorally relevant natural sounds have been well characterized (Zann, 1996) and for which there is good evidence for neural selectivity for conspecific song (Margoliash and Fortune, 1992; Theunissen and Doupe, 1998; Grace et al., 2003). We recorded from three ascending auditory regions: the midbrain area [mesencephalicus lateralis dorsalis (MLd)], the primary forebrain area (field L), and a secondary auditory forebrain area [caudal mesopallium (CM)], which has been directly implicated in the perception of learned complex sounds (MacDougall-Shackleton et al., 1998; Gentner et al., 2001; Gentner and Margoliash, 2003).
Specifically, we addressed three questions. First, do the responses of single neurons encode sounds from a natural ensemble more effectively than sounds from a synthetic ensemble? Second, is there evidence for hierarchical processing of natural sounds between the auditory midbrain and forebrain? Third, if natural sounds are preferentially encoded, what statistics of the natural sounds are necessary for this preference?
Materials and Methods
Electrophysiological recordings. All animal procedures were approved by the Animal Care and Use Committee at University of California, Berkeley. Extracellular single-unit recordings were obtained from 36 adult (>100 d old) male zebra finches (Taenopygia guttata). All birds were raised by their parents in our zebra finch colony. Two days before recording, a bird was anesthetized with modified Equithesin (0.03 ml, i.m.; consisting of 0.85 g of chloral hydrate, 0.21 g of pentobarbital, 0.42 g of MgSO4, 8.6 ml of propylene glycol, and 2.2 ml of 100% ethanol to a total volume of 20 ml with H2O). The bird was then placed in a custom stereotax with ear bars and a beak holder. Local anesthetic (2% lidocaine) was administered, and a midline incision in the scalp was made. Small (∼1 mm), stereotaxically localized holes were made in the outer skull overlying field L and CM, and a small metal pin was fixed to the skull with dental cement. The bird was then allowed to recover for 2 d.
On the day of the recording, the bird was anesthetized with three injections of 20% urethane (three intramuscular injections, 30 ml each, 30 min apart) and was placed in a custom stereotax. The bird's head was immobilized by attaching the small metal pin cemented to the bird's skull to a customized holder mounted on the stereotax. The inner skull layer and dura were then removed from the small holes made over field L and CM during the previous surgery. In the cases in which we also recorded from MLd (20 birds), lidocaine was applied to the skin on the side of the head. Then, an incision was made in the skin overlying the optic tectum. A small opening (∼1 mm) was made in the skull overlying the optic tectum, and the dura was removed from the surface of the brain.
Neural recordings were conducted in a double-walled anechoic sound-attenuated chamber (Industrial Acoustics, Bronx, NY). The bird was positioned ∼20 cm in front of a Bose 101 speaker so that the bird's beak was centered both horizontally and vertically with the center of the speaker cone. The output of the speaker was measured before each experiment with a Radio Shack electret condenser microphone to ensure a flat response (±5 dB) from 250 to 8000 Hz.
Extracellular recordings were obtained with epoxy-coated tungsten electrodes (0.5-7.0 MΩ; Frederick Haer, Bowdoinham, ME, and A-M Systems, Carlsborg, WA). The electrodes were advanced into the brain with a stepping microdrive. We typically recorded from two brain areas simultaneously. The extracellular signal was obtained with a Neuroprobe amplifier (A-M Systems model 1800; 100× gain; high-pass fc 300 Hz; low-pass fc 5 kHz), displayed on a multichannel oscilloscope (TDS 210, Tektronix, Wilsonville, OR), and monitored on an audio amplifier/loud-speaker (AM8, Grass Instruments, Quincy, MA). Single-unit spike arrival times were obtained by thresholding the extracellular recordings with a window discriminator and were logged on a Sun computer running custom software (<1 msec resolution).
Pure tones (250-8000 Hz), zebra finch songs, synthetic songs (syn-songs), modulation-limited noise (ml-noise), and white noise were used as search stimuli (these stimuli are described below). If the response to any of these stimuli was significantly different from the baseline firing rate, determined by an on-line t test, or the response was clearly time locked to some portion of the stimulus, then we acquired 10 trials of data to each of 20 zebra finch songs, 20 syn-songs, and 10 ml-noise stimuli. As explained in more detail below, song and syn-song had identical frequency spectra (and thus total power). Ml-noise was designed to have flat power spectrum between 250 and 8000 Hz, and the absolute power level was adjusted so that the peak value in the power spectrum of song (found around 3.5 kHz) matched the steady power level of the ml-noise (see Fig. 1d). Ml-noise therefore had more total power than song and syn-song. Finally, the absolute song levels of all three stimuli were adjusted so that average peak levels in song stimuli were at 75 dB sound pressure level (SPL) measured with a B&K sound level meter (rms weighting B, fast) positioned 25 cm in front of the speaker at the location of the bird's head. With the same absolute level adjustment, average peak levels were 83 dB SPL for syn-song and 81 dB SPL for ml-noise. Presentation of the stimuli was random within a trial. Two seconds of background spontaneous activity was recorded before the presentation of each stimulus. A random interstimulus interval with a uniform distribution between 4 and 6 sec was used.
Figure 1.

Modulation power spectrum of the three stimulus ensembles. The temporal and spectral structure of particular sounds can be quantified and visualized by calculating the MPS of an ensemble of the sounds. The MPS is estimated by the average modulus-squared two-dimensional Fourier transform of the sound spectrograms. Power density is indicated by color, with red showing the spectral-temporal modulations with most energy. a, The MPS of zebra finch songs (song). b, The MPS of syn-songs, which match song in the distribution of spectral and temporal modulations but do not contain the modulation phase information found in song. c, The MPS of ml-noise, which uniformly samples spectral and temporal modulations found both inside and outside the borders of the MPS of song. d, The frequency power spectrum of the three stimulus ensembles. Syn-song sounds were designed to have the same frequency power spectrum as song, whereas ml-noise was designed to have a flat frequency power spectrum.
At the end of a recording pass, one to three electrolytic lesions (100 μA for 5 sec) were made to verify the recording sites of that pass. Lesions were made well outside of any auditory areas, unless it was the last recording pass.
To test for potential hierarchical processing, we obtained single-unit recordings from three stages of auditory processing in the adult male zebra finch: the MLd, which is the avian midbrain homolog of the inferior colliculus (IC), field L, and CM. These areas were of particular interest because, as mentioned in the introduction, previous work in mammals has correlated the complex responses of neurons in IC and auditory cortex with the acoustical structure of vocalizations. The avian secondary auditory forebrain area, CM, has also been directly implicated in the perception of learned complex sounds. We obtained recordings from a total of 83 single neurons in MLd, 119 single neurons in field L, and 31 single neurons in CM. Because an estimation of mutual information is not reliable for a neuron with a low spike rate or a low reliability, we analyzed only neuronal recordings that had firing rates >0.5 spikes per second and satisfied an additional criterion of reproducibility. Reproducibility was assessed by quantifying the similarity in responses over trials to the same stimulus by estimating the expected correlation coefficient between a single spike train and its time-varying mean firing rate (Hsu et al., 2004). Only cells that showed a correlation >0.15 were analyzed. After deleting units that did not meet these two criteria, we were left with 81 cells in MLd, 109 cells in field L, and 28 cells in CM.
Histology. After the recording session, the bird was deeply anesthetized with Nembutal and transcardially perfused with 0.9% saline followed by 3.7% formalin in 0.025 m phosphate buffer. The brain was postfixed in formalin and then cryoprotected in 30% sucrose. Parasagittal sections (40 μm) were cut on a freezing microtome and divided into two series. The sections were mounted on gelatin-subbed slides, and one series was stained with cresyl violet and the other with silver stain. The electrolytic lesions, and usually the electrode tracks as well, could then be identified. We used the distance between two lesions from the same pass to calibrate our depth measurements and then reconstructed the location of our recording sites for each neuron.
Stimulus design and synthesis. To test the hypothesis that both the natural power and the natural phase of temporal and spectral amplitude modulations found in natural sounds are important for selectivity, we used adult zebra finch song (see Fig. 1a) and two synthetic sounds: syn-songs, which have the same modulation power spectra as natural sounds but random modulation phase (see Fig. 1b), and ml-noise, which has flat modulation power spectra that cover all modulations found in song (see Fig. 1c). The song stimulus set consisted of 20 adult male zebra finch songs (age >100 d). Each song (∼2 sec in duration) came from a different bird and was recorded in a sound-attenuated chamber (>30 dB).
To generate syn-song or ml-noise sounds, we first obtained the spectral-temporal log envelope function of the desired sound (i.e., its spectrogram in logarithmic units) by a sum of ripple component sounds. Ripple sounds are broad band sounds with a spectrogram that is theauditory equivalent of a sinusoidal grating. This sum of ripples sounds can be written as:
 |
where φι is the modulation phase and φt,i and φf,i are the temporal and spectral frequency modulations for the ith ripple component, and S(t,f) is the zero mean log envelope of the frequency band f. In our implementation, we used N = 100 ripple components. For both syn-song and ml-noise, the modulation phase was random and taken from a uniform distribution. The spectral and temporal modulation frequencies for syn-song were sampled randomly using the modulation spectrum of songs as a density distribution. The spectral and temporal modulation frequencies for ml-noise were sampled randomly from a uniform distribution bounded by 50 Hz and 2 cycles/kHz.
We also matched the frequency power spectrum and modulation depth of the syn-song to that of natural song. Calling A(f) the average log amplitude in each frequency band measured in an ensemble of song, σ(f) the SD in each frequency band measured in the original ensemble, and σS(f) the SD obtained from the ensemble of S(t,f) functions from the first step in the synthesis, we generate a new function for the log amplitude envelopes given by:
 |
for frequencies between 250 and 8000 Hz. The sounds generated from SNorm will now have a frequency power spectrum determined by A(f) and a modulation depth in the log amplitude envelopes given by the SD of SNorm relative to A(f). We verified that the syn-songs generated this way had the same frequency spectrum as song (see Fig. 1d).
The ml-noise was generated using a normalized log envelope given by:
 |
for frequencies between 250 and 8000 Hz. Thus, for ml-noise, the mean amplitude in each frequency band was constant and given by the peak of the log amplitude envelope in song: ml-noise had a flat power spectrum between 250 and 8000 Hz, the level of which matched the peak of the power spectrum of song found at fPeak ∼3.5 kHz (see Fig. 1d). The modulation depth (in log units) in each frequency band was also set to the average modulation depth found in song.
Finally, we obtained the sound pressure waveform by first taking the exponential of the normalized log amplitude envelope, SNorm(t,f), and then using a spectrographic inversion routine (Singh and Theunissen, 2003).
Information calculation. The mutual information quantifies the capacity of a neuronal response to encode stimuli. It can be used to measure the discrimination achieved by an ideal observer of the neural responses. Strong et al. (1998) described a direct method of estimating the mutual information that does not make any assumptions about the parameters of the stimulus that are being encoded in the neural response, nor about the nature of the neural code. The direct method is estimated as follows. The spike trains are binned into letters, which are the number of spikes in a given bin. Usually, bin sizes are chosen small enough such that there is only one spike per bin. Sequences of L letters make up words of length L. The distribution of words is then quantified using Shannon's entropy as follows:
 |
where pi(w) is the probability of finding the i'th word. Signals with more entropy have a higher capacity to transmit information. The total entropy of a spike train is the entropy of the word distribution over all trials and times. The noise entropy describes the distribution of words that occur at the same time in the stimulus measured across trials, and thus are responses to the same stimulus, as follows:
 |
The noise entropy is estimated by taking the average of word distribution entropies calculated at each time point as follows: <H(w|s(t))>t. The mutual information is the difference between the total entropy and the noise entropy:
 |
The estimation of total and noise entropies depends on both the letter size and the word length chosen. The dependence on word length occurs because words at neighboring times are often correlated with one another. Because the estimation procedure assumes that different words are independent, the information rate will be overestimated unless one adjusts for potential correlations. To adjust for correlations, both noise and total entropy can be linearly extrapolated to infinite word length as a function of 1/word length as described by Strong et al. (1998). Under the direct method, assuming a word length of L and a maximum letter value of 1 (each letter contains at most only one spike), there are 2L parameters that need to be fitted (the probability of every possible word). For the estimation of the noise entropy, each trial provides only one word sample for any given time point. Thus, a large number of trials, on the order of hundreds, are needed to obtain a reasonable estimate of the noise entropy.
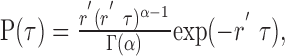
It is often difficult to collect the large number of trials needed to obtain a reasonable estimate of the noise entropy using the direct method. For example, in a case like ours for which we wanted to sample a large stimulus space and hence used a large number of stimuli, limited recording time allowed us to obtain only 10 trials in response to each stimulus. To address this general issue, we have developed a method to estimate information using a parametric model of spike responses, which requires fewer data than the direct method of information estimation. We assumed that the deterministic part of the neural response is described entirely by the time-varying mean firing rate. This assumption has been used in many models of spiking neurons (Gabbiani, 1996; Johnson, 1996; Baddeley et al., 1997; Svirskis and Rinzel, 2000; Barbieri et al., 2001) and validated with an information theoretical approach in some cases (Baker et al., 1991; Oram et al., 1999). Using this assumption, we characterized our neuronal responses with inhomogeneous Gamma point processes, the generalization of the Poisson process. The probability density function of interspike intervals (ISIs) for a homogeneous Gamma process of order α and mean rate r′/α is given by the following:
 |
where Γ(α) is the Gamma function of order α (any positive real number). The Gamma process has been used previously to model spiking neurons (Cox, 1962; Stein 1965; Gabbiani and Koch, 1998; Barbieri et al., 2001) and allowed us to better model the variability in the neural response than the Poisson process. Although an analytical solution for the information transmitted does not exist for inhomogeneous Gamma models, we were able to use our framework to generate enough model spike trains to estimate information using the direct method. By fitting the neural response with an inhomogeneous Gamma model, the number of parameters needed to estimate the probability distribution of words of length L is reduced from 2L to L + 1. These parameters are the L instantaneous mean firing rates for each time bin of the particular word and the order of the Gamma point process.
We estimated the time-varying mean firing rate of our responses as follows: each spike train was smoothed with an adaptive time-varying Gaussian window in which every spike was convolved with a window of unique width. This width was chosen such that 5 SDs was the distance to the farther of two neighboring spikes. The average over trials of smoothed spike trains was our estimate of the time-varying mean rate. To characterize the noise (variability over trials) of the neural response, the ISI distribution of the time-rescaled spike trains was used. Time rescaling (Barbieri et al., 2001) normalizes each spike train individually by the running integral of its instantaneous mean firing rate, which is assumed to be known, thereby transforming each spike train into a rescaled time representation with constant mean firing rate. Intuitively, for times with high firing rates, spikes are spread apart in time, and for times with low firing rates, spikes are moved closer together. The result is a new set of spike trains represented in a “rescaled time” in which the mean rate is constant. Rescaling works better when the estimate of the mean rate is not heavily biased by the spike train being rescaled. Thus, we rescaled each of our spike trains using a jack-knifed time-varying mean rate that was estimated from the mean of all other spike trials smoothed in the manner described above. The variations of ISIs in rescaled time now can be attributed entirely to noise. To describe this noise, we fit the ISI distribution of the rescaled spike trains to a Gamma distribution of specified order for every set of responses. A set consisted of all of the responses of a particular neuron to a particular stimulus type. Neurons with low variability are best fit by high Gamma order distributions and vice versa. The time rescaling was used only for the purpose of describing the stochastic aspect (variability over trials) of the spike response. Finally, we generated 500 trials of (unrescaled) model spike trains that were inhomogeneous Gamma processes of the appropriate order with time-varying spike rates matched to those estimated for our original spike trains. We found that the information estimation converges reasonably by 500 trials. The direct information estimation method was then performed to obtain the information rate in the time-varying mean of our neuronal responses.
Our method introduces two systemic biases in estimating information. First, our method allows for limited data analysis at the expense of the assumption that the neuronal response is adequately modeled by inhomogeneous Gamma processes. The mean rate assumption neglects any potential information that spike patterns may carry. These spike patterns would not be precisely phase locked to the stimulus (otherwise they would be represented in the time-varying mean firing rate) but would reliably encode specific stimulus features. Such spike patterns have not been found in the auditory cortex (Lu and Wang, 2004). If such spike patterns existed, we would overestimate the noise entropy and the total entropy. Because noise entropy primarily quantifies response entropy over trials, the neglect of potentially encoding spike patterns will cause larger overestimates for the noise entropy than for the total entropy. Second, in our model we estimate the time-varying mean rate of the response from the smoothed poststimulus time histogram (PSTH). Because of data size limitations, this estimated time-varying mean rate is sparser that the actual mean rate, resulting in an underestimation of the entropy. Because total entropy primarily quantifies response entropy over time, inaccurate rate estimations will cause larger underestimations of the total entropy than of the noise entropy. The combined effects of the underestimation of the total entropy caused by data size limitations and the overestimation of the noise entropy caused by the limitations of the model yields an underestimate of the mutual information (see Fig. 2 and Results for validation of our methodology).
Figure 2.

Validation of the information calculation. Two hundred trials of responses from two neurons from field L and one neuron from CM were collected to validate the parametric information calculation used in this study. Information and entropy estimates using the parametric method on 10 sets of 10 random trials (× marks) are plotted versus those calculated using the direct method on all the data. Values for all 10 sets were similar and thus the ×s overlap. “O” values are estimated using the parametric method on all 200 trials and plotted versus direct method estimates. Estimates for information (a), total entropy (b), and noise entropy (c) correlate strongly with those obtained from the direct method for these three cells that exhibited the range of information values observed in the population of cells. The parametric method results in an underestimate, as explained in Results.
Response parameters affecting the information. We used one quantifier to describe the response reliability and two quantifiers to describe deterministic aspects of the neural response. The response reliability is given by the order of the Gamma process that best fit the distribution of rescaled ISIs (see Fig. 3a). The contribution to information from the deterministic part of the neural response was characterized by the rate distribution and the rate bandwidth. The rate distribution is the distribution of the values of the time-varying mean rates. The time-varying mean firing rate was fitted directly to a Gamma distribution using a maximum-likelihood method. Note that this is different from the Gamma distribution that was used to fit the rescaled ISIs. The fit to a Gamma distribution allowed the rate distribution to be described as a continuous function and circumvented the need to choose a time bin, as would be needed if the distribution were to be estimated straight from a histogram (see Fig. 3b). The rate bandwidth is the bandwidth of the power density of the time-varying mean rate. We used the following:
 |
Figure 3.

Measures affecting information values. Three factors that affect the amount of information transmitted in the time-varying mean firing rate of a neuron are spike train reliability, mean rate distribution, and mean rate bandwidth (see Materials and Methods). We illustrated the effect of these three factors independently using model data. The condition pictured in the left panels in A, B leads to higher information values. A, Spike train reliability. Two sets of model spike trains (middle panels) with the same time-varying mean rate (top panels) with their rescaled ISI distributions fit to a Gamma process (bottom panels). The spike trains on the left are more reliable. The thick dashed line is the analytical ISI distribution of the fitted Gamma point process. B, Rate distribution entropy. Top panels show two mean rates as a function of time with their different rate distributions shown underneath: an exponential distribution (left) and a distribution that is far from exponential. Dotted line is the curve of an exponential distribution. Dashed line is the best-fit Gamma distribution. C, Top panels show two different time-varying mean rates that have the same rate distribution (data not shown). Bottom panels show their corresponding power spectral densities and bandwidths.
where psd is the normalized power spectral density as a function of frequency f, to quantify the range of dynamics, or frequencies present in the signal, which for our spike trains is the time-varying mean firing rate (see Fig. 3c).
Results
Spectral-temporal modulations of natural sounds
Behavioral and neural recognition of conspecific signals (Creutzfeldt et al., 1980; Narins and Capranica, 1980; Rose and Capranica, 1983; Theunissen and Doupe, 1998), including human speech (Drullman et al., 1994; Drullman, 1995; Shannon et al., 1995; Chi et al., 1999), depends critically on the perceptual and neural sensitivity to temporal and spectral modulations as well as the actual frequency spectrum of the signal. It can therefore be argued that an appropriate basis set of sounds for the study of sound identity perception is the space of temporal and spectral amplitude modulations. These modulations are not to be confused with the frequency spectrum, which is the Fourier decomposition of the sound-pressure wave form. The temporal and spectral modulations describe the modulations of the amplitude envelope of the sound when it is decomposed into different frequency bands (the spectrogram). These modulations are shown visually in spectrographic representations of sound, which are used extensively to study animal vocalizations. The corresponding power density function for the spectrographic representation of sounds is the modulation spectrum. The modulation spectrum is a three-dimensional plot that shows the amount of energy (color axis) of amplitude modulations of a particular temporal frequency (x-axis) and spectral frequency (y-axis) that is found in a particular sound ensemble. Previously, we showed that natural sounds, and vocalizations in particular, exhibit a characteristic joint modulation spectrum. In addition, we showed that the amplitude probability distribution of the envelopes of natural sounds has a strong exponential component. We therefore performed the modulation spectrum analysis on the log of the amplitude envelopes (Singh and Theunissen, 2003).
The goal of our project was to quantify the neural encoding of natural sounds, song (Fig. 1a), and compare it with the encoding of two synthetic sounds: syn-songs and ml-noise. Syn-songs have the same power density of spectral-temporal modulations as zebra finch song (Fig. 1b), but have random modulation phase structure. Ml-noise has uniformly sampled spectral-temporal modulations that contain the modulations found in song as well as modulations that are absent in song (Fig. 1c). More specifically, ml-noise was white noise for which we low-passed the log amplitude envelope modulations to temporal modulations <50 Hz and spectral modulations <2 cycles/kHz. Song has not only the natural modulation spectrum that we designed our syn-song to have, but also the natural modulation phase relationships of amplitude envelopes across frequency bands.
Information calculation: validation of the inhomogeneous Gamma model
To calculate the effectiveness of neural encoding, we estimated the mutual information between the sound stimulus and the neural response using a novel framework that involved modeling the neural spike patterns as an inhomogeneous Gamma process. Our parametric models assume that the information is contained in the time-varying mean firing rate of the response and allowed us to estimate the mutual information with limited data. Our method systematically underestimates the mutual information but correlates positively with estimates obtained using the direct method.
We validated our methodology on responses of two zebra finch neurons from field L and one from CM for which we collected 200 trials of responses to song. We compared the information estimated using our method on 10 random trials of responses with the information estimated using the direct method on all 200 trials. We repeated our estimation method for 10 different sets of 10 trials. Total and noise entropies calculated using PSTHs composed of different sets of 10 trials with our parametric method had SDs of <3% and therefore were similar regardless of which sets of trials we used. For the three neuronal responses that we tested, noise entropies were overestimated by 6% and total entropies were underestimated by 1% on average. Consequently, the resulting information values estimated with our parametric method using 10 trials were ∼35% lower than the information estimated for the direct method. The largest contributing factor to the bias was the overestimation of noise entropies, presumably resulting from ignoring spike pattern information and approximating the spike train as a Gamma process. Although the noise entropy is also affected by the same negative bias as the total entropy because of the inaccurate PSTH estimation, as mentioned above, this effect is smaller for noise entropy than for total entropy estimation. Information values estimated from our parametric method for our three test cells were 8.5, 12.4, and 26.5 bits per second, whereas the direct method gave 13.1, 19.6, and 37.5 bits per second, resulting in an information underestimation of 35, 36, and 30%, respectively.
We also applied our method of information estimation on a PSTH composed of all 200 trials. Counterintuitively, the underestimation increased slightly when 200 trials were used instead of 10. Because the PSTH was better modeled with 200 trials, the total entropy, which is not as sensitive to the limitations of the Gamma model, was estimated without any systemic bias. The better PSTH estimate also reduced the effect of the negative data limitation bias on the noise entropy; however, because the positive noise entropy bias that resulted from ignoring spike patterns remained, average noise entropies were underestimated by 10% on average. This is a greater underestimation than when only 10 trials were used, in which overestimation of the noise entropy was partially offset by a negative bias caused by the inaccurate PSTH. In general, the information values that we calculated using our method systematically underestimate the information; however, the relative effects of our systemic biases, and therefore the degree of underestimation, depend on the number of trials used. For constant data size, the underestimation of information was very similar across the three test neurons (Fig. 2), the information values of which spanned the range of information values measured in the population. All relative values of our information estimates correlate positively with the values obtained in the direct method and therefore serve as a useful comparative measure of neural information.
Response parameters affecting the information
Mutual information depends on spiking reliability and response dynamics. We assessed the relative contribution of these factors by calculating one metric for spike reliability, and two metrics for response dynamics, rate distribution entropy, and rate bandwidth (Fig. 3). These three metrics affect the information in the following way. (1) Increased spiking reliability increases information, (2) rate distributions that approach the exponential distribution have the highest entropy for any given mean rate (Dayan and Abbott, 2001), and thus allow maximum information, and (3) increased bandwidth of the time-varying mean rate increases information.
Reliability was quantified using the order of the Gamma distribution that best described the distribution of time-rescaled ISIs as explained above (see Materials and Methods). Distributions with higher Gamma constants are more sharply peaked, as are the distributions of ISIs for reliable spike trains. Hence, a greater Gamma constant equals greater reliability. Figure 3A illustrates this measure of reliability by comparing the responses of two model neurons with different Gamma constants but otherwise similar time-varying mean firing rates. Figure 3A (bottom panels) shows the ISI distribution of rescaled spike times. The thick dashed line is the analytical ISI distribution of the fitted Gamma point process. The spike trains on the left have Gamma order 77 (more reliable), and those on the right are Poisson, or Gamma order 1 (less reliable). The greater reliability of the Gamma order 77 model neuron would lead to higher information rates. In actuality, our spike trains were fit to Gamma processes with orders ranging from 0.3 to 5.4. The unrealistic Gamma order 77 was used for illustrative purposes.
The rate distribution was calculated by estimating the distribution of the magnitude of the time-varying mean firing rate from the smoothed PSTH. The rate distribution was then normalized to have a mean firing rate of one spike per second to quantify only the effect of the distribution on coding capacity and eliminate the effect of the overall average mean rate. The rate entropy was then calculated for this distribution. Entropy distributions that are closer to the exponential distribution have higher entropies, and therefore greater capacity to transmit information. This effect is illustrated in Figure 3B, where we calculated the entropy in the mean firing rate of two model neurons that have time-varying rates with identical average mean rates but with different amplitude distributions. The neuron depicted on the left has an exponential distribution of time-varying firing rates and therefore larger response entropy than the neuron depicted on the right. Dotted lines represent a true exponential distribution, and dashed lines are the best-fit Gamma distributions, which were used to describe the rate distributions (see Materials and Methods).
Finally, two responses can have the same mean rate distribution but have different power spectra. The response with higher bandwidth power spectra will have greater coding capacity. This effect is illustrated with two modeled neurons in Figure 3C. The two mean rates have the same rate distribution (data not shown); however, the mean rate signal on the left has greater bandwidth and therefore greater coding capacity than the signal on the right.
Sample response and information analysis
We calculated the neural discrimination of single auditory neurons to song, syn-song, and ml-noise by estimating the mutual information between the stimulus and the neural response as described above. We performed this information analysis at three levels of the avian auditory processing stream in the male zebra finch: (1) MLd (n = 81), (2) field L (n = 109), and (3) CM (n = 28).
Figure 4 shows the responses of a single neuron in MLd to sample sounds from each of the three stimulus ensembles (Fig. 4a-d, top panel) and illustrates the analysis results (Fig. 4e-g, bottom panel). This neuron responded robustly and in a phase-locked manner to all three types of sounds as shown in Figure 4b. To calculate the mutual information, these spike trains are modeled as inhomogeneous Gamma processes. The mean firing rate of the Gamma process is obtained by convolving the PSTH with a varying-width Gaussian window. This time-varying mean rate is shown in Figure 4d (top). To calculate the order of the Gamma model, the spike trains are time rescaled to obtain spike trains (Fig. 4c) with constant mean rates (Fig. 4d, bottom). The ISI histogram obtained from the rescaled spike trains is then fitted with a Gamma distribution (Fig. 4e). The Gamma order and the estimated time-varying mean rate are then used as parameters for the model Gamma neuron, and mutual information values are obtained from 500 model spike trains. In this case, the information analysis showed that although the mean rate was similar in the three cases, the spike trains carried the most information about the identity of sound segments taken from natural song over all the other stimuli. Information was also higher for syn-song over ml-noise. In this case, greater bandwidth (Fig. 4f) contributed to the higher information for natural song, and distribution entropy (Fig. 4g) contributed to the higher information rates in responses to stimuli with natural modulation power spectra. Reliability (Fig. 4e) was similar for responses from all three stimuli. Although this neuron is representative of the average trend (see results below), it should be noted that for some neurons, the reliability or firing rates were different across the three stimuli. In general, higher reliability, more exponential rate distributions, and larger response bandwidth all lead to higher information rates.
Figure 4.

Example responses to the three stimuli (top panel) and analysis results (bottom panel). a, Spectrograms of song, synthetic song, and modulation-limited noise show their frequency content over time. b, Spike train responses of a sample neuron. c, Time-rescaled spike trains show the spike trains rescaled so that the mean firing rate is constant. d, Original time-varying mean (top) and time-rescaled mean (bottom). e, Interspike interval distribution of rescaled spikes and their best-fit Gamma distribution (thick solid line). f, Power spectra and bandwidth of time-varying mean firing rate. g, Mean rate distribution and the entropy of the corresponding distribution with a mean rate of one spike per second. Solid line is the best-fit Gamma distribution to the rate distribution.
Information analysis shows a gradual selectivity for bird song
As shown in Figure 5a, the mean firing rates obtained to sounds from the three ensembles, averaged over time and over neurons, were remarkably similar. All three stimuli elicited statistically equivalent spike rates, and this was true in each of the three processing stages (all p > 0.2); however, the spike trains elicited by each type of stimulus were not equal in their ability to encode the identity of the sounds (Fig. 5b). Song and syn-songs elicited, on average, higher information rates than ml-noise. Moreover, we observed a gradual increase in selectivity in terms of information rates for responses to song relative to other stimuli with ascension in the auditory pathway. All population significance statistics were obtained using a two-tailed paired t test with the Bonferroni adjustment to compensate for multiple comparisons.
Figure 5.

Average mean rates and information values. Average rate and information values over all neurons recorded MLd (83), field L (119), and CM (31). a, Average mean rate. b, Average information value. c, Average information efficiency. error bars show ±1 SE. All statistical tests were performed using paired comparisons (paired t test), and the Bonferroni correction was used to adjust the significance level for multiple comparisons; the significance cutoff was reduced from p < 0.05 to p 0.0167; *p < 0.0167.
In the MLd, the highest information was found for the responses to syn-song over both song (p < 0.01) and ml-noise (p < 0.00005), whereas song also elicited higher information rates than ml-noise (p < 0.01). In field L, song and syn-song had similar information rates; however, syn-song elicited significantly higher information rates than ml-noise (p < 0.01), and song showed a similar trend (p < 0.05). Finally, in CM, song responses had the highest information. Song responses had significantly greater information rates than ml-noise responses (p < 0.0015), and a similar trend was seen for song over syn-song responses (p < 0.05). Our data show that at the lowest level of auditory processing that we examined, the auditory midbrain, the neural representation is already selective for statistical properties of natural sounds. By this we mean that the information that can be extracted about the sound identity is greater for natural-like sounds than for other complex but synthetic sounds. Furthermore, there is a hierarchical processing of natural sounds, during which the computations performed by successive auditory stages lead to an increase in the relative selectivity for natural sounds. In the midbrain, information rates showed selectivity for the modulation spectrum of natural sounds but not for the modulation phase relationships of natural sounds. In the secondary forebrain, information rates were affected both by the phase and the power of natural sound amplitude modulations.
Because information is expressed on a logarithmic scale, the additional ∼1 bit of information found in response to stimuli with natural spectral and temporal modulations results in a doubling of the sound features being encoded. In other words, based on the spiking patterns of single neurons, an ideal observer would be able to discriminate approximately twice as many short segments of sound from song or syn-song than from ml-noise in the midbrain and primary forebrain and twice as many short segments of sound from song than from syn-song or ml-noise in the secondary auditory forebrain. We also noted that the absolute value of average information rates for song were remarkably constant across the three stages. Thus, at the level of single neurons, we find that across multiple synaptic stages, there was no degradation in the amount of information in the response (Fig. 5).
As shown in Table 1, top, the increase of information for the natural or natural-like sound can also be quantified by counting the number of cells in each brain region that has higher information for song, syn-song, or ml-noise. An equal number of cells in MLd showed higher information to song (37) and syn-song (37), and this number was significantly greater than the number of cells that showed higher information to ml-noise (7) (p < 0.0001). In field L there was a trend for greater preference to song (44) and syn-song (39) compared with ml-noise (26) (p < 0.1). Finally, CM showed the greatest song selectivity, with 17 cells that showed higher information to song, 9 cells that showed higher information to syn-song, and 2 cells that showed higher information to ml-noise (p < 0.005). Table 1, bottom, shows that in all auditory areas, cells significantly showed higher information to natural and natural-like stimuli (song and syn-song) over ml-noise (p < 1 × 10⁻⁵ for MLd; p < 0.05 for L; p < 0.005 for CM). p values were obtained with a goodness of fit χ2 test.
Table 1.
Information rate rankings
|
|
Song |
Syn-song |
Ml-noise |
|---|---|---|---|
| MLd | 37 | 37 | 7 |
| L | 44 | 39 | 26 |
| CM |
17 |
9 |
2 |
|
|
Natural-spectrum sounds |
Ml-noise |
|---|---|---|
| MLd | 74 | 7 |
| L | 83 | 26 |
| CM |
26 |
2 |
Preference was defined by the stimulus ensemble that elicited the highest information rates. Top, For each of our three stimuli, the number of cells that showed highest information to that stimulus. Bottom, Same as top, but with song and syn-song grouped together under natural-spectrum sounds.
Because the mean firing rates were similar across sounds from the three stimulus ensembles and information rates were higher for either song or syn-song, we would expect that the information efficiency, the information per spike, would also be higher for the natural or natural-like sounds. Indeed, as shown in Figure 5c, we also found gradual selectivity for song in information efficiencies going from MLd to field L. MLd neurons showed significantly higher information efficiencies for syn-song over natural song (p < 0.0005) and ml-noise (p < 5 × 10⁻⁵). In MLd, song also elicited higher response efficiency than ml-noise (p < 0.005). Field L neurons showed significantly higher information efficiencies to song over both syn-song (p < 0.005) and ml-noise (p < 0.0005) as well as a strong trend for higher efficiencies to syn-song over ml-noise (p < 0.03). The information efficiency in CM was similar for all three sounds. The nonlinear relationship between mean rate and efficiency explains this apparently paradoxical result. Although information efficiencies averaged over all cells are similar for noise and song responses, the high-efficiency responses to noise tended to have lower average mean rates, whereas the high-efficiency responses to song usually had higher average mean rates. This resulted in a significantly greater information rate for song responses relative to ml-noise.
To understand what factors lead to higher information rates despite similar response mean rates, we evaluated three components of the neuronal response that can influence the information of a neuron: response reliability, response bandwidth, and response distribution (Fig. 6).
Figure 6.

Average measures of response reliability (a), bandwidth (b), and rate entropy (c). (See Results). These average values are obtained on the same data set as the information values shown in Figure 5. The error bars show ±1 SE. The within-area statistics are paired t test corrected for multiple comparisons. *p < 0.0167.
Reliability is greatest in MLd but not affected by stimulus types
Using the Gamma order to quantify reliability, we found that, on average, there was no difference in reliability among responses to different stimulus types (Fig. 6a); however, we did find reliability differences among regions. For responses to all stimuli, reliability was significantly greater in MLd than in field L (p < 1 × 10⁻⁴). There was also a strong trend for greater reliability in MLd than in the CM for syn-song responses (p < 0.07) as well as a similar but smaller trend for the other stimulus types (p < 0.13).
Bandwidth shows trends similar to information
Averaged response bandwidth differences among stimuli showed trends similar to that of average information rates and efficiency (Fig. 6b). In the MLd, there was a trend for higher bandwidth to syn-song over song (p < 0.033). In field L, there was a trend for higher bandwidth in responses to song relative to syn-song (p < 0.025) and ml-noise (p < 0.025). In the CM, there was a significantly higher bandwidth in responses to song over responses to ml-noise (p < 0.015). As with entropy, sounds with natural modulation power have higher response bandwidth than synthetic sounds. This result is unexpected a priori because all three stimuli span the same temporal frequencies in their amplitude modulations (Fig. 1). Moreover, the naive assumption would suggest that ml-noise responses have the greatest bandwidth, because ml-noise has more power in the higher temporal frequencies than either song or syn-song. Among areas, bandwidth in responses to song increased from MLd to field L (p < 0.005), showed a similar trend from MLd to CM (p < 0.05), but did not increase from field L to CM.
Rate distribution entropy highest for song
The actual probability distribution of responses affects information capacity in the sense that distributions that exhibit a higher number of possible symbols (different rates) will be able to encode more symbols (segments of songs). To separate the effect of mean firing rate from the effect of the shape of the distribution, we calculated the entropy with the average rate normalized to one spike per second. We found significant differences in rate distribution entropies among responses to different stimuli (Fig. 6c). In all areas, responses to song had significantly higher rate entropies than responses to ml-noise (MLd: p < 5e-5; field L: p < 5e-5; CM: p < 0.01). Furthermore, rate entropies in responses to syn-song were also significantly greater than rate entropies in responses to ml-noise for all areas (MLd: p < 0.01; field L: p < 0.0005; CM: p < 0.01). Entropies calculated for song were significantly higher than those obtained for syn-song in field L (p < 0.015), with a similar trend in MLd (p < 0.05).
In summary, the higher information and information efficiency values obtained from the song and syn-song responses are attributable principally to an increase in the entropy and bandwidth of the time-varying mean firing rate. Spike reliability (or neural noise) does not appear to play a significant role.
Discussion
We found that sounds with natural modulation power spectra and natural modulation phase could be better encoded by single neurons than synthetic sounds that covered the natural acoustical space. This result supports the hypothesis that auditory systems have evolved or developed to process natural sounds efficiently. Our results are consistent with previous data showing that vocalizations are particularly good stimuli for eliciting responses in higher auditory neurons that respond poorly to simple tones and with a significant reduction in spike rate to other non-natural complex stimuli (Rauschecker et al., 1995; Wang et al., 1995; Grace et al., 2003). Previous studies have already shown that synthetic sound ensembles with natural properties are coded more efficiently by auditory neurons in the invertebrate (Machens et al., 2001, 2003), vertebrate auditory nerve (Rieke et al., 1995), and mammalian midbrain (Escabi et al., 2003). This study is the first, however, that quantifies and compares the encoding ability of single auditory neurons with sounds from natural ensembles versus synthetic sound ensembles. In addition, our synthetic sound ensembles were carefully designed to be supersets of the natural sound ensemble. The syn-song ensemble included all possible sound features found in natural songs as well as sound features that had the same modulation power spectra as song but random modulation phase. Similarly, the ml-noise ensemble includes all the possible sound features in the song-ensemble as well as other sounds with different modulation power spectra and random modulation phase. Our analysis shows that at the highest levels of auditory processing, song, the smallest subset of sounds, was best encoded by single neurons. This is followed by syn-song, the subset of sounds with a natural-like modulation spectrum but random modulation phase. Finally, ml-noise, the ensemble of sounds that had random modulation phase and a non-natural modulation spectrum, was least well encoded.
A difference between our results and previous results is that all three of our stimulus ensembles elicited similar average spiking rates, whereas previous research had shown that natural vocalizations elicited higher rates for certain neurons or brain areas. The differences in information rates that we measured cannot be explained by differences in average spike rates but, as we showed, are caused by differences in the statistics of the time-varying response. The fact that we did not find differences in average firing rates as was found in previous work, including work from our laboratory in the same preparation (Grace et al., 2003), is likely because of our use of a novel synthetic sound ensemble that was designed to more closely match natural sounds. Our results also justify to some extent the use of ml-noise to characterize auditory neurons. Ml-noise has recently been used to obtain the spectral-temporal receptive fields (STRFs) of auditory neurons (Depireux et al., 2001; Escabi and Schreiner, 2002).
We also found a hierarchical processing of natural sounds in terms of information rates: on average, midbrain auditory neurons are not selective for the natural modulation phase of spectral-temporal amplitude modulations, whereas neurons in the auditory forebrain, secondary auditory forebrain in particular, are sensitive to this natural modulation phase. We also found that in the midbrain, single neurons, on average, have greater capacity to encode sounds from the syn-song ensemble than sounds from the song ensemble. This is likely because of the entropy difference between syn-song and song: the entropy of the syn-song ensemble is greater than that of the song ensemble. Similarly, the entropy of the ml-noise ensemble is greater than that of both the syn-song and song ensemble. Therefore, a priori, one might naively expect to observe higher information rates in responses to ml-noise, followed by syn-song and finally song. If an auditory processing stage were tuned to the modulation power spectrum but not to its phase, we would expect higher information rates for syn-song than for song, just as we observed in the midbrain.
Although the greatest information is for syn-song responses at the midbrain, there appears to be a filtering process by which higher-level (forebrain) single-neuron responses selectively encode sounds with natural modulation phase, whereas information about other sounds from the syn-song ensemble is lost. It is possible that similar information across the two ensembles would be maintained if the population neuronal response were considered. In any case, the higher information rates and efficiencies in single-cell responses suggest that the neural representation at the higher levels is more efficient for natural sounds than for other stimuli. This means that the relevant information can be extracted from a small number of neurons and fewer spikes are able to convey more information. This result is consistent with a sparse and information theoretically efficient neural representation of natural sounds.
How can we explain the depressed information rates in ml-noise responses? Because we matched the total power in the modulation spectrum of ml-noise to that of song, ml-noise had more power in the higher modulation frequencies and less power in the lower modulation frequencies relative to song. It is therefore conceivable that the increase in information could be caused by having a majority of cells tuned to the lower modulations frequencies, which have more power in song and syn-song. We have two reasons to refute this hypothesis, at least in its simple linear form. First, we found similar average firing rates in response to all three stimuli. Second, when we analyzed the linear spectral-temporal response properties of the cells in the midbrain, we found that their peak modulation tuning was found in the range of temporal frequencies between 10 and 50 Hz, with most of the cells having best temporal modulation frequencies >25 Hz (Theunissen et al., 2004). It is also at temporal frequencies >25 Hz that the modulation power in ml-noise becomes greater than song. We therefore postulate that nonlinear response properties to higher spectral-temporal modulation frequencies found in ml-noise suppress the response to lower or intermediate frequencies and disrupt the phase locking. This hypothesis would explain the similar firing rates and the increase in response bandwidth found for responses to song and syn-song relative to ml-noise, with its corresponding increase in information rates. The non-phase-locked responses in ml-noise may also correspond to a different mechanism for the encoding of high-frequency modulation in which the information is represented by average rates that are not synchronized to the stimulus at the time scales analyzed here (Langner and Schreiner, 1988; Lu and Wang, 2004).
How can we explain the increase in information rates for song responses over syn-song in the auditory forebrain? Here also, both linear and nonlinear stimulus-response properties could come into play. Although the song and the syn-song have the same modulation spectrum, because of differences in their phase spectrum, song and syn-song will have different higher order statistics. For example, the variance in the modulation spectrum of song is different both in magnitude and distribution than the variance of syn-song. It is therefore possible that the linear STRFs of a majority of neurons would be tuned to regions of the modulation spectrum that show greater variability across different segments of songs than across different segments of syn-song. For such neurons, the response strength (or mean firing rate) would be identical, but the entropy of the response distribution would then be higher for song than for syn-song. In addition, it is probable that nonlinear tuning properties play a role in the efficient coding of natural sounds. For example, it is easy to conceive of selective tuning to the temporal or spectral phase in the amplitude modulations of natural sounds. Such selective tuning would affect both the response dynamics and distribution and would not be captured by the linear STRF. By analyzing the match between the linear STRF of neurons and the modulation spectrum of song or its higher moments (Theunissen et al., 2004) and by assessing the role of the natural phase in the nonlinear fraction of the neural response, we will be able to investigate these hypothetical mechanisms.
Finally, we found that the absolute information rates for sounds in the song ensemble remain constant as one moves up the auditory processing stream; however, the reliability in the response decreases as one moves up the processing stream. Furthermore, absolute rate entropies and mean rates remain relatively constant. Thus, the auditory system apparently preserves the information in song by increasing the bandwidth of the time-varying response (Fig. 6). In addition, if we postulate that the increased variability in higher-auditory areas is caused partly by inputs that are not well controlled in these experiments, such as fluctuating input from other sensory modalities or internal states of the animal, then the information for natural sounds may be even higher than that reported here and with greater relative increases in information as one moves up the auditory processing stream.
Footnotes
This work was supported by National Institute of Mental Health and National Institute on Deafness and Other Communication Disorders grants to F.E.T. and National Research Service Award grants to S.M.N.W. and T.E.F.
Correspondence should be addressed to Frédéric E. Theunissen, Department of Psychology, University of California, Berkeley, 3210 Tolman Hall, Berkeley, CA 94720-1650. E-mail: fet@socrates.berkeley.edu.
Copyright © 2004 Society for Neuroscience 0270-6474/04/249201-11$15.00/0
References
- Allon N, Yeshurun Y, Wollberg Z (1981) Responses of single cells in the medial geniculate body of awake squirrel monkeys. Exp Brain Res 41: 222-232. [DOI] [PubMed] [Google Scholar]
- Baddeley R, Abbott LF, Booth MCA, Sengpiel F, Freeman R, Wakeman EA, Rolls ET (1997) Responses of neurons in primary and inferior temporal visual cortices to natural scenes. Proc R Soc Lond B Biol Sci 264: 1775-1783. [DOI] [PMC free article] [PubMed] [Google Scholar]
- Baker Jr CL, Friend SM, Boulton JC (1991) Optimal spatial displacement for direction selectivity in cat visual cortex neurons. Vision Res 31: 1659-1668. [DOI] [PubMed] [Google Scholar]
- Barbieri R, Quirk MC, Frank LM, Wilson MA, Brown EN (2001) Construction and analysis of non-Poisson stimulus-response models of neural spiking activity. J Neurosci Methods 105: 25-37. [DOI] [PubMed] [Google Scholar]
- Casseday JH, Ehrlich D, Covey E (1994) Neural tuning for sound duration: role of inhibitory mechanisms in the inferior colliculus. Science 264: 847-850. [DOI] [PubMed] [Google Scholar]
- Catchpole CK (1987) Bird song, sexual selection and female choice. Trends Ecol Evol 2: 94-97. [DOI] [PubMed] [Google Scholar]
- Chi T, Gao Y, Guyton MC, Ru P, Shamma S (1999) Spectro-temporal modulation transfer functions and speech intelligibility. J Acoust Soc Am 106: 2719-2732. [DOI] [PubMed] [Google Scholar]
- Cox DR (1962) Renewal theory. London: Methuen.
- Creutzfeldt O, Hellweg FC, Schreiner C (1980) Thalamocortical transformation of responses to complex auditory stimuli. Exp Brain Res 39: 87-104. [DOI] [PubMed] [Google Scholar]
- Dayan P, Abbott LF (2001) Computational and mathematical modeling of neural systems. Cambridge, MA: MIT.
- Depireux DA, Simon JZ, Klein DJ, Shamma SA (2001) Spectro-temporal response field characterization with dynamic ripples in ferret primary auditory cortex. J Neurophysiol 85: 1220-1234. [DOI] [PubMed] [Google Scholar]
- Drullman R (1995) Temporal envelope and fine structure cues for speech intelligibility. J Acoust Soc Am 97: 585-592. [DOI] [PubMed] [Google Scholar]
- Drullman R, Festen JM, Plomp R (1994) Effect of temporal envelope smearing on speech reception. J Acoust Soc Am 95: 1053-1064. [DOI] [PubMed] [Google Scholar]
- Escabi MA, Schreiner CE (2002) Nonlinear spectrotemporal sound analysis by neurons in the auditory midbrain. J Neurosci 22: 4114-4131. [DOI] [PMC free article] [PubMed] [Google Scholar]
- Escabi MA, Miller LM, Read HL, Schreiner CE (2003) Naturalistic auditory contrast improves spectrotemporal coding in the cat inferior colliculus. J Neurosci 23: 11489-11504. [DOI] [PMC free article] [PubMed] [Google Scholar]
- Fuzessery ZM (1994) Response selectivity for multiple dimensions of frequency sweeps in the pallid bat inferior colliculus. J Neurophysiol 72: 1061-1079. [DOI] [PubMed] [Google Scholar]
- Gabbiani F (1996) Coding of time-varying signals in spike trains of linear and half-wave rectifying neurons. Network Comput Neural Syst 7: 61-85. [DOI] [PubMed] [Google Scholar]
- Gabbiani F, Koch C (1998) Principles of spike train analysis. In: Methods in neuronal modeling, Ed 2 (Koch C, Segev I, eds), pp 313-359. Cambridge, MA: MIT.
- Gentner TQ, Margoliash D (2003) Neuronal populations and single cells representing learned auditory objects. Nature 424: 669-674. [DOI] [PMC free article] [PubMed] [Google Scholar]
- Gentner TQ, Hulse SH, Duffy D, Ball GF (2001) Response biases in auditory forebrain regions of female songbirds following exposure to sexually relevant variation in male song. J Neurobiol 46: 48-58. [DOI] [PubMed] [Google Scholar]
- Ghazanfar AA, Hauser MD (2001) The auditory behaviour of primates: a neuroethological perspective. Curr Opin Neurobiol 11: 712-720. [DOI] [PubMed] [Google Scholar]
- Grace JA, Amin N, Singh NC, Theunissen FE (2003) Selectivity for conspecific song in the zebra finch auditory forebrain. J Neurophysiol 89: 472-487. [DOI] [PubMed] [Google Scholar]
- Hsu A, Borst A, Theunissen FE (2004) Quantifying variability in neural responses and its application for the validation of model predictions. Network Comput Neural Syst 15: 91-109. [PubMed] [Google Scholar]
- Johnson DH (1996) Point process models of single-neuron discharges. J Comput Neurosci 3: 275-299. [DOI] [PubMed] [Google Scholar]
- Langner G, Schreiner CE (1988) Periodicity coding in the inferior colliculus of the cat. I. Neuronal mechanisms. J Neurophysiol 60: 1799-1822. [DOI] [PubMed] [Google Scholar]
- Lu T, Wang X (2004) Information content of auditory cortical responses to time-varying acoustic stimuli. J Neurophysiol 91: 301-313. [DOI] [PubMed] [Google Scholar]
- MacDougall-Shackleton SA, Hulse SH, Ball GF (1998) Neural bases of song preferences in female zebra finches (Taeniopygia guttata). NeuroReport 9: 3047-3052. [DOI] [PubMed] [Google Scholar]
- Machens CK, Stemmler MB, Prinz P, Krahe R, Ronacher B, Herz AV (2001) Representation of acoustic communication signals by insect auditory receptor neurons. J Neurosci 21: 3215-3227. [DOI] [PMC free article] [PubMed] [Google Scholar]
- Machens CK, Schutze H, Franz A, Kolesnikova O, Stemmler MB, Ronacher B, Herz AV (2003) Single auditory neurons rapidly discriminate conspecific communication signals. Nat Neurosci 6: 341-342. [DOI] [PubMed] [Google Scholar]
- Margoliash D, Fortune ES (1992) Temporal and harmonic combination-sensitive neurons in the zebra finch's HVc. J Neurosci 12: 4309-4326. [DOI] [PMC free article] [PubMed] [Google Scholar]
- Narins PM, Capranica RR (1980) Neural adaptations for processing the two-note call of the Puerto Rican tree frog, Eleutherodactylus coqui Brain Behav Evol 17: 48-66. [DOI] [PubMed] [Google Scholar]
- Nelken I, Rotman Y, Bar Yosef O (1999) Responses of auditory-cortex neurons to structural features of natural sounds. Nature 397: 154-157. [DOI] [PubMed] [Google Scholar]
- Newman J, Wollberg Z (1978) Multiple coding of species-specific vocalizations in the auditory cortex of squirrel monkeys. Brain Res 54: 287-304. [DOI] [PubMed] [Google Scholar]
- Oram MW, Wiener MC, Lestienne R, Richmond BJ (1999) Stochastic nature of precisely timed spike patterns in visual system neuronal responses. J Neurophysiol 81: 3021-3033. [DOI] [PubMed] [Google Scholar]
- Pollak G, Marsh D, Bodenhamer R, Souther A (1977) Echo-detecting characteristics of neurons in inferior colliculus of unanesthetized bats. Science 196: 675-678. [DOI] [PubMed] [Google Scholar]
- Rauschecker JP, Tian B, Hauser M (1995) Processing of complex sounds in the macaque nonprimary auditory cortex. Science 268: 111-114. [DOI] [PubMed] [Google Scholar]
- Rieke F, Bodnar DA, Bialek W (1995) Naturalistic stimuli increase the rate and efficiency of information transmission by primary auditory afferents. Proc R Soc Lond B Biol Sci 262: 259-265. [DOI] [PubMed] [Google Scholar]
- Rose G, Capranica RR (1983) Temporal selectivity in the central auditory system of the leopard frog. Science 219: 1087-1089. [DOI] [PubMed] [Google Scholar]
- Shannon RV, Zeng FG, Kamath V, Wygonski J, Ekelid M (1995) Speech recognition with primarily temporal cues. Science 270: 303-304. [DOI] [PubMed] [Google Scholar]
- Singh NC, Theunissen FE (2003) Modulation spectra of natural sounds and ethological theories of auditory processing. J Acoust Soc Am 114: 3394-3411. [DOI] [PubMed] [Google Scholar]
- Stein R (1965) A theoretical analysis of neuronal variability. Biophys J 5: 173-194. [DOI] [PMC free article] [PubMed] [Google Scholar]
- Strong SP, Koberle R, de Ruyter van Steveninck R, Bialek W (1998) Entropy and information in neural spike trains. Phys Rev Lett 80: 197-200. [Google Scholar]
- Suga N, O'Neill WE, Manabe T (1978) Cortical neurons sensitive to combinations of information-bearing elements of biosonar signals in the moustache bat. Science 200: 778-781. [DOI] [PubMed] [Google Scholar]
- Svirskis G, Rinzel J (2000) Influence of temporal correlation of synaptic input on the rate and variability of firing in neurons. Biophys J 79: 629-637. [DOI] [PMC free article] [PubMed] [Google Scholar]
- Theunissen FE, Doupe AJ (1998) Temporal and spectral sensitivity of complex auditory neurons in the nucleus HVc of male zebra finches. J Neurosci 18: 3786-3802. [DOI] [PMC free article] [PubMed] [Google Scholar]
- Theunissen FE, Woolley SM, Hsu A, Fremouw T (2004) Methods for the analysis of auditory processing in the brain. In: Behavioral neurobiology of birdsong (Zeigler P, Marler P, eds), pp 187-207. New York: New York Academy of Sciences. [DOI] [PubMed]
- Wang X, Merzenich MM, Beitel R, Schreiner CE (1995) Representation of a species-specific vocalization in the primary auditory cortex of the common marmoset: temporal and spectral characteristics. J Neurophysiol 74: 2685-2706. [DOI] [PubMed] [Google Scholar]
- Zann RA (1996) The zebra finch. Oxford, UK: Oxford UP.