

Abstract
Constraints from functional magnetic resonance imaging (fMRI) were used to identify the sources of the visual P300 event-related potential (ERP). Healthy subjects performed a visual three-stimulus oddball paradigm with a difficult discrimination task while fMRI and high-density ERP data were acquired in separate sessions. This paradigm allowed us to differentiate the P3b component of the P300, which has been implicated in the detection of rare events in general (target and distractor), from the P3a component, which is mainly evoked by distractor events. The fMRI-constrained source model explained >99% of the variance of the scalp ERP for both components. The P3b was mainly produced by parietal and inferior temporal areas, whereas frontal areas and the insula contributed mainly to the P3a. This source model reveals that both higher visual and supramodal association areas contribute to the visual P3b and that the P3a has a strong frontal contribution, which is compatible with its more anterior distribution on the scalp. The results point to the involvement of distinct attentional subsystems in target and distractor processing.
Keywords: attention, EEG, P300, parietal, prefrontal, visual
Introduction
Because of its prominent role in studies of cognition in healthy individuals and neurological and psychiatric patients (Polich and Herbst, 2000), the search for the neural generators of the P300 has attracted considerable interest. The classical P300 component or P3b, which occurs 300-600 msec after a target stimulus in oddball paradigms and has a parietal distribution on the scalp, has been linked to the cognitive processes of context updating, context closure, and event-categorization (Donchin and Coles, 1988; Verleger, 1988; Kok, 2001), whereas the slightly earlier P3a, which has a frontocentral distribution, has mainly been associated with the orienting response (Friedman et al., 2001). Yet, despite a large number of studies with different neurophysiological and imaging techniques, the identification of the brain regions responsible for the P300 remains controversial.
The human lesion (Knight et al., 1989; Yamaguchi and Knight, 1991; Verleger et al., 1994, Daffner et al., 2000) and intracranial recording studies (Baudena et al., 1995; Halgren et al., 1995a,b) provide the most direct access to the generators of the P3a-P3b potentials. Compared with intracranial recordings of P300-like signals, the source analysis of scalp electroencephalography (EEG) or magnetencephalography data has the advantage that it can be applied and replicated in large numbers of healthy subjects and potentially covers the entire brain. Several event-related potential (ERP) studies have tried to localize the sources of the P3b component in the auditory, visual, and somatosensory modalities (Mecklinger and Ullsperger, 1995; Tarkka et al., 1995, 1996; Hegerl and Frodl-Bauch, 1997; Anderer et al., 1998; Mecklinger et al., 1998, Tarkka and Stokic, 1998; Yamazaki et al., 2000, 2001; Jentzsch and Sommer, 2001; Valeriani et al., 2001; Dien et al., 2003). These studies had inconsistent results, which might be attributable to the “inverse problem” posed by the infinite number of current source distributions that can explain the scalp ERP data. Functional magnetic resonance imaging (fMRI) studies of oddball paradigms consistently identified a “target detection network” with mainly parietal and inferior frontal contributions (McCarthy et al., 1997; Linden et al., 1999; Downar et al., 2001; Ardekani et al., 2002; Horovitz et al., 2002; Kiehl and Liddle, 2003; Mulert et al., 2004).
Spatial information from task-related fMRI activity can constrain the otherwise infinite solution space in the ERP source analysis. Previously, fMRI-constrained source modeling has only been applied to the auditory P3b or P3a (novelty P3) potential (Menon et al., 1997; Opitz et al., 1999a,b). In the present study, we elicited P3a and P3b ERP responses with visual distractor and target stimuli. fMRI data were obtained in separate sessions for the entire brain (Bledowski et al., 2004). The fMRI-constrained source analysis was used to estimate the contribution of the stationary sources to the ERP waveform and approximate the time course of cortical activation in the millisecond range. The goal of this study was twofold: to localize the cortical sources of both the visual P3a and P3b ERP components with a three-stimulus oddball task and to compare the activity of the modeled generators between the two task conditions.
Materials and Methods
Subjects. Ten right-handed subjects (five females and five males; mean age, 27.3 years; SD, 3.1 years; age range, 22-30 years) were recruited from an academic environment. All subjects had no history of neurological or psychiatric disorder and gave informed consent to participate in the study. The study was approved by the local ethics committee.
Study design (stimuli and procedure). We used the same three-stimulus oddball task as in a previous study (Bledowski et al., 2004). The paradigm included two different task types (circle task and square task). Table 1 summarizes the stimulus properties of the two visual tasks. Using a task with simple geometric objects in which stimulus features were counter-balanced, we were able to control for lower-level visual attributes, which are a common confound of the classical version of the three-stimulus oddball task with novel and/or complex figures. The stimuli were solid blue shapes presented in a random series, once every 2 sec, for 75 msec. Each of the tasks was presented in two runs with 350 stimuli each and lasted ∼12 min per run. The order of the two task types was counterbalanced across participants. The stimuli were defined as target, distractor, and standard, and presented with the probabilities of 0.05, 0.05, and 0.90. The task was to respond to the target stimuli by pushing a mouse button with the right thumb as quickly as possible. For misses (absence of button press after target stimulus) and false alarms (button press after standard or distractor stimulus), the corresponding event was excluded from the analysis. Before each task, all subjects underwent a practice block of 50 stimuli (20 targets, 30 standards).
Table 1.
Stimulus characteristics
|
|
|
Task type |
||
|---|---|---|---|---|
| Stimulus |
Rate of occurrence |
Circle task |
Square task |
|
| Distractor | 5% | ▪ 1.36° | • 1.53° | |
| Target | 5% | • 1.38° | ▪ 1.21° | |
| Standard |
90% |
• 1.53° |
▪ 1.36° |
|
Rate of occurrence, shape, and visual angle of stimuli for the visual three stimulus oddball tasks. In the experiment, stimuli were presented in blue.
EEG recording and analysis. Electroencephalographic activity was recorded from 63 scalp sites using the BrainAmp amplifier (Brain Products, Munich, Germany) and Braincap electrode cap (Falk Minow Services, Munich, Germany). The electrodes were placed according to the 10-20 System (Fp1, Fp2, F7, F3, Fz, F4, F8, T7, C3, Cz, C4, T8, P7, P3, Pz, P4, P8, O1, Oz, and O2). Additional intermediate sites were AF3, AF4, AF7, AF8, AFz, F1, F2, F5, F6, F9, F10, FC1, FC2, FC5, FC6, FT7, FT8, FT9, FT10, C1, C2, C5, C6, CP1, CP2, CP3, CP4, CPz, TP7, TP8, TP9, TP10, P5, P6, P9, P10, PO3, PO4, PO9, PO10, POz, and Iz. All channels were referenced during recording to an additional reference electrode (FCz) with a forehead ground and impedance of <5 kΩ. An additional electrode was placed on the infraorbital ridge of the right eye to record the vertical electrooculogram (EOG). No filter was used during recording. The EEG and EOG were digitized with a sampling rate of 500 Hz.
ERP analysis. EEG data were recalculated off-line using average reference. The time epoch for each event was 1200 msec (200 msec prestimulus and 1000 msec poststimulus). To avoid eye movement and other artifacts, all epochs exceeding ±90 μV in any channel were excluded from additional analysis. On average, 75.9% of all epochs were retained after the artifact rejection. For each epoch, a baseline correction for the period 200 msec before stimulus onset was performed. For the calculation of the ERPs, the waveforms were averaged. The ERPs were computed separately for the target, distractor, and standard conditions. Difference waveforms were calculated by subtracting the ERP to standard stimuli from that to targets and distractors, respectively. Before the ERP analysis, the individual difference ERP waves (63 electrodes) were exported into the standardized 81 electrode configuration of the 10-10 system and averaged across subjects (grand average difference waves). ERPs were bandpass filtered at 0.03-15 Hz. The peak amplitude was measured relative to the prestimulus baseline. The P300 component was defined as the largest positive deflection within the time window between 350 and 600 msec. Peak latency was defined as the time from stimulus onset to the peak of each scalp component. For statistical analysis, the P300 amplitude data were assessed with a two-factor repeated-measure [two stimulus types (target and distractor) × three electrodes (Fz, Cz, Pz)] ANOVA. Greenhouse-Geisser correction was used, and corrected p values are reported. Spline-interpolated topographical maps of scalp voltage and current source density (CSD) were calculated at the respective peak latencies to target and distractor stimuli.
Source modeling. We performed a source analysis constrained by fMRI data using the BrainVoyager-Brain Electrical Source Analysis software platform (Brain Innovation, Maastricht, The Netherlands and MEGIS Software GmbH, Gräfelfing, Germany). The fMRI data were derived from separate sessions obtained from 13 subjects performing the identical task (Bledowski et al., 2004).
The standard spherical coordinates of the 81 electrodes and three fiducial landmarks (left and right preauricular points and nasion) were coregistered with corresponding landmarks identified on the standard Montreal Neurological Institute (MNI) template head surface (courtesy of the Montreal Neurological Institute). See Figure 3 A for the locations of the 81 electrodes and fiducial landmarks placed on the MNI template head surface.
Figure 3.
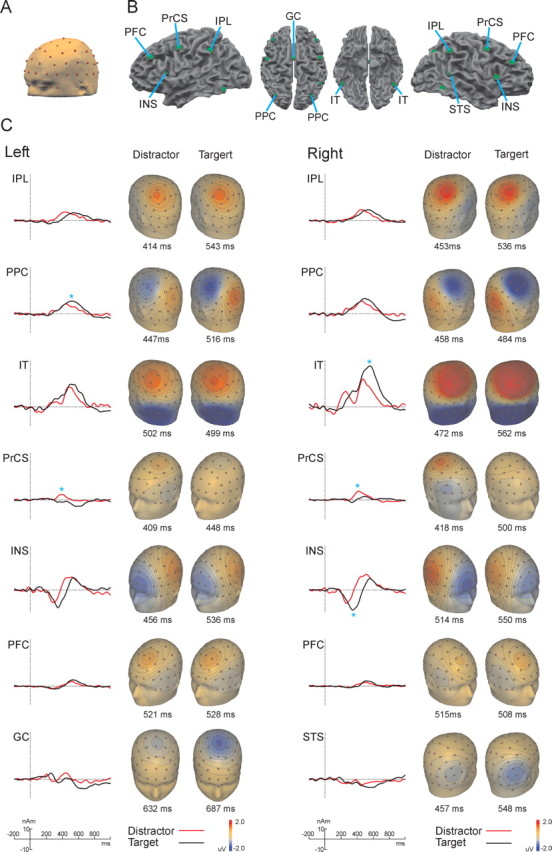
Source activity in target and distractor condition A, A surface of a standard head (MNI template) with standard 81 electrode configuration. B, Position of the RSs on a surface reconstruction of the MNI template brain. C, Source activity waves and topographical maps of scalp voltage of the main current flow direction of each RS for the target and distractor conditions. * indicates significant differences between RS peak amplitude in the target and distractor conditions.
EEG activity was modeled by discrete multiple sources (Scherg and Von Cramon, 1985; Scherg, 1990, 1992). A four-shell spherical head model was applied to compute the source activities using the BESA Software. To avoid interactions in the source activities induced by interindividual differences in the cortical folding pattern, we computed regional sources (RSs) rather than dipoles. Regional sources can model the three-dimensional current vectors in a region of cortex regardless of the orientation of the cortical folds (Scherg and Von Cramon, 1986).
It has recently been suggested that either stimulus (distractor or target) elicits a P300 ERP response with both a frontal (P3a) and a posterior (P3b) component, with contextual salience enhancing the frontal and task-relevance enhancing the posterior component (Goldstein et al., 2002; Gaeta et al., 2003). Based on these findings, we used the fMRI activity of both conditions to define a common source model, which was then applied to the grand average difference ERP waves of the target and distractor condition. This gave us the possibility to compare quantitatively the contribution of the different P300 generators to the P3a and P3b components.
The common source model was generated and processed as follows: (1) The RSs were seeded separately at the foci of the main fMRI activity clusters in the target and distractor condition [thresholded at F(1,18510) = 31; p < 0.001 (corrected); fixed effects analysis]. (2) We computed the arithmetic mean of the coordinates (Cartesian head coordinates) of the RSs that were derived from fMRI clusters that spatially overlapped in both conditions. (3) Additional RSs in right insula and cingulate gyrus were placed at foci of the fMRI activity that were only observed in the target condition. (4) The primary orientation of each regional source was set to match the direction of the maximum dipole moment (main current flow) of the combined grand average difference ERP waves (addition of the grand average difference ERP waves in both conditions) during the poststimulus epoch. See Figure 2 for anatomical locations of the RSs superimposed on the surface reconstruction of the MNI template brain and the fMRI activity in the distractor and target conditions. The averaging of the RS coordinates obtained from overlapping fMRI activity clusters is justified by the integrative nature of regional sources in a multiple discrete source model, because source waveforms are not much affected by errors in the equivalent center location of up to 1-2 cm, as long as the distances between the different sources are larger (Scherg and Picton, 1991; Scherg, 2004). The main current flow direction of the source activities was back projected to scalp voltage, and topographical maps were calculated at the respective latency of the peak source intensities in each condition.
Figure 2.

Positions of the regional sources and fMRI activation maps. Positions of the RSs resulting from the seeding procedure and group statistical maps of blood oxygenation level-dependent signal increase for the target and distractor conditions compared with baseline (standard condition) at F(1,18510) = 31; p < 0.001 (corrected), superimposed on a surface reconstruction of the MNI template brain.
To compare the brain electric activity for the target and distractor conditions statistically, the source model obtained from the grand average ERP data was applied to the individual ERP data. The individual source waveforms were then averaged over all subjects in each condition. The corresponding peak amplitudes and latencies of the grand average source waveforms were determined for both conditions in each source. To test for significant differences of these values between conditions, we applied the basic bootstrap percentile method (Efron and Tibshirani, 1993) with 999 bootstrap samples to compute the 95% confidence interval for the latency and amplitude difference. The difference was considered significant when this interval did not include zero.
Results
Behavioral data
The mean percentage hit rate and the mean reaction time were 73.7% and 635.2 msec (SD, 71.0). False positives were extremely rare with mean percentage rates of 0.6% for the distractor and 0.9% for the standard stimuli. The results indicate that behavioral effects were satisfactory and comparable with previous findings (Polich and Comerchero, 2003; Bledowski et al., 2004).
ERP results
Figure 1 presents the grand average difference ERP waves for target and distractor stimuli at 81 scalp sites from -200 msec prestimulus to 1000 msec poststimulus and the topographical maps of scalp voltage and CSD for the P300 for the target and distractor stimuli. The P300 latency for the distractor (460 msec) was significantly shorter than for the target (513 msec) condition [t(9,10) =-4.59; p < 0.05] as shown by a repeated-measurement t test. For P300 amplitude, repeated-measurement ANOVA revealed a significant main effect of the factor electrode [F(2,18) = 8.39; p < 0.05; ηp2 = 0.48]. The difference in scalp distribution between the distractor and target condition was confirmed by the significant S (stimulus) × E (electrode) interaction effect [F(2,18) = 4.68; p < 0.05; ηp2 = 0.34]. The P3b component with a posterior focus was elicited by the target and distractor stimuli, whereas the distractor stimuli additionally elicited a P3a component with a frontocentral activity focus. These effects conform to the dissociation between a posterior P3b and a frontocentral P3a component (Polich and Comerchero, 2003).
Figure 1.
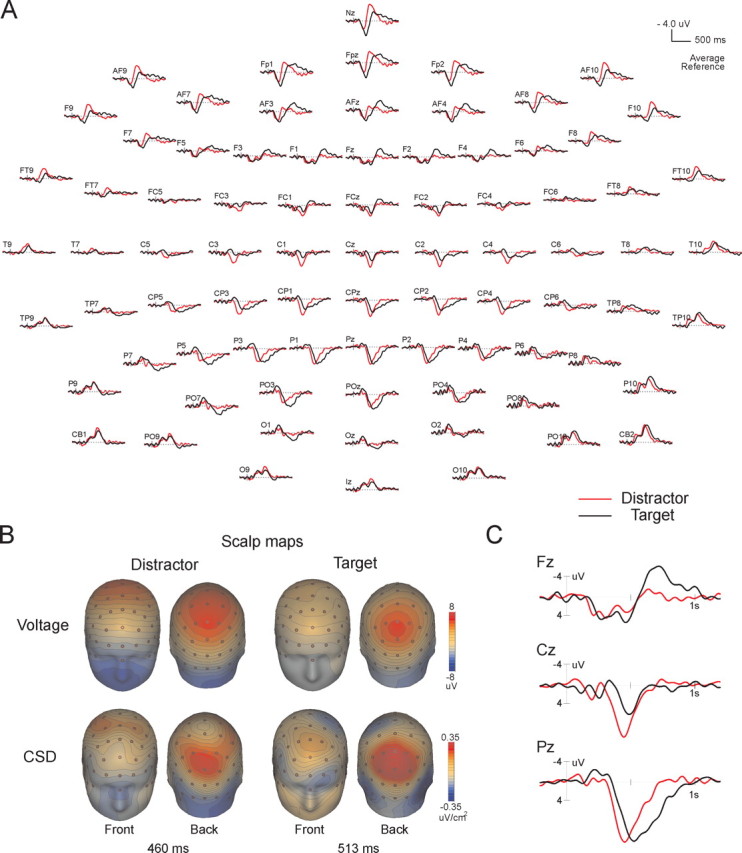
ERP responses in target and distractor condition. A, Grand average difference ERP waveforms to distractor (red line) and target (black line) stimuli at 81 standard electrodes sites exported from 63 recorded electrodes. B, Spline-interpolated topographical maps of scalp voltage and CSD calculated at the respective peak latencies in the target and distractor condition. C, Enlarged view of key midline electrodes from A.
Source localization
The fMRI-guided seeding procedure resulted in six bilateral pairs of RSs in the prefrontal cortex (PFC), precentral sulcus (PrCS), inferior parietal lobe (IPL), posterior parietal cortex (PPC), inferior temporal cortex (IT), and anterior insula (INS) and two singular RSs placed in the right superior temporal sulcus (STS) and the cingulate gyrus (GC). Figure 2 depicts the location of the sources superimposed on the surface reconstruction of the MNI template brain and the fMRI activity in both conditions. The RSs explained on average 99.4% (target condition with minimum of 95.8 and maximum of 99.7%) and 99.5% (distractor condition with minimum of 97.9 and maximum of 99.8%) of the scalp ERP potential variance in the 1000 msec poststimulus interval. Figure 3C shows the grand average source activity waveforms of each RS (main current flow direction) for the target and distractor conditions and the resulting topographical scalp voltage maps at the latency of RS peak activity. Table 2 summarizes the Talairach coordinates of the RSs and the statistics for the peak amplitudes and peak latencies of the grand average source activity in the target and distractor conditions with 95% confidence intervals.
Table 2.
Talairach coordinates and statistics for the regional sources
|
|
|
Talairach |
Amplitude (nanoamperes) |
Latency (milliseconds) |
||||||||||||
|---|---|---|---|---|---|---|---|---|---|---|---|---|---|---|---|---|
| RS |
Side |
x
|
y
|
z
|
D (min/max) |
T (min/max) |
D — T (min/max) |
D (min/max) |
T(min/max) |
D — T (min/max) |
||||||
| IPL | Left | −47 | −45 | 43 | 9.8 (7.5/13.3) | 8.6 (4.9/13.3) | 1.2 (−1.9/4.4) | 414 (404/466) | 543 (513/608) | −129 (−197/−71) | ||||||
| IPL | Right | 46 | −49 | 47 | 12.3 (9.3/16.1) | 11.5 (8.9/15.1) | 0.8 (−1.8/2.8) | 453 (442/472) | 536 (481/554) | −83 (−105/−28) | ||||||
| PPC | Left | −30 | −73 | 44 | 10.8 (8.0/14.4) | 13.7 (10.3/18.6) | −2.9 (−5.9/−0.1) | 447 (417/458) | 516 (482/562) | −69 (−118/−33) | ||||||
| PPC | Right | 30 | −74 | 44 | 13.9 (9.5/19.0) | 16.1 (11.0/21.8) | −2.2 (−5.6/1.5) | 458 (435/475) | 484 (469/523) | −26 (−68/−7) | ||||||
| IT | Left | −43 | −61 | −17 | 21.5 (17.9/29.2) | 25.5 (19.5/34.6) | −4.0 (−7.5/1.2) | 502 (454/514) | 499 (493/559) | 3 (−96/11) | ||||||
| IT | Right | 48 | −57 | −10 | 30.9 (21.8/41.0) | 44.2 (36.0/53.9) | −13.3 (−21.1/−6.2) | 472 (461/481) | 562 (528/582) | −90 (−112/−61) | ||||||
| PrCS | Left | −45 | 0 | 50 | 5.9 (4.9/8.0) | −1.7 (−4.3/1.5) | 6.7 (4.7/8.8) | 409 (360/421) | 448 (363/482) | −39 (−97/50) | ||||||
| PrCS | Right | 46 | 4 | 53 | 9.8 (7.9/11.7) | 3.8 (1.5/6.4) | 6.0 (3.7/8.3) | 418 (407/422) | 500 (462/500) | −82 (−93/−42) | ||||||
| INS | Left | −36 | 18 | 15 | −13.8 (−8.9/−21.0) | −20.9 (−16.1/−26.1) | 7.1 (13.7/−0.5) | 288 (266/346) | 343 (335/351) | −55 (−73/−16) | ||||||
| INS | Right | 38 | 21 | 12 | −16.7 (−10.4/−23.5) | −23.7 (−20.9/−27.8) | 7.1 (13.0/2.4) | 265 (261/269) | 345 (336/397) | −80 (−131/−69) | ||||||
| PFC | Left | −39 | 42 | 39 | 5.4 (3.3/7.9) | 7.2 (3.4/11.5) | −1.8 (−5.1/1.4) | 521 (512/527) | 528 (522/570) | −7 (−51/−2) | ||||||
| PFC | Right | 40 | 43 | 36 | 3.9 (2.5/5.8) | 6.4 (3.6/9.3) | −2.5 (−5.2/0.4) | 515 (448/523) | 508 (496/557) | 7 (−91/20) | ||||||
| GC | −1 | 3 | 56 | −4.2 (−2.4/−7.6) | −10.4 (−4.8/−18.1) | 6.2 (−0.4/13.7) | 632 (536/765) | 687 (608/765) | −55 (−147/20) | |||||||
| STS |
Right |
52 |
−44 |
14 |
−6.4 (−4.6/−9.1) |
−9.1 (−6.7/−12.7) |
2.8 (−0.2/6.5) |
457 (445/613) |
548 (495/612) |
−91 (−161/10) |
||||||
The table shows the Talairach coordinates of the RS positions (in millimeters) and the statistics for the main current flow direction of the RS. Statistics were computed for the mean amplitudes and peak latencies in the distractor (D) and target (T) conditions and their difference (D — T). “Min” and “max” denote the borders of the 95% confidence interval. Difference values (D — T) in bold are statistically significant (see Materials and Methods).
P3b sources
Three pairs of bilaterally placed RSs in the IPL, PPC, and IT (named in the following IPL, PPC, and IT sources) showed large positive deflections that peaked in the time window between 400 and 600 msec. The timing, strength, and orientation of the main current flow of the RS indicated that the combined activity of these RSs generated the posterior visual P3b scalp potential in the target and distractor conditions. However, these posterior RSs were differentially influenced by the task condition. Although the IPL sources showed no difference in the RS strength between conditions, higher amplitudes were found for target stimuli in the left PPC and right IT source. The comparison of the source latencies revealed that, with the exception of the left IT source, the distractor stimuli produced earlier source peaks in all P3b generators.
P3a sources
The source analysis indicated that the visual P3a scalp component was generated by a positive deflection in the PrCS and a late positive deflection in the INS sources. This late positive deflection of the INS source also accounted for the late far-frontal negativity of the ERP (Figs. 1, 3). Consistent with the ERP finding that the P3a is more pronounced in the distractor condition, the P3a generators in the PrCS produced higher amplitude of the RS strength in the distractor condition. Furthermore, the right PrCS source peaked significantly earlier in the distractor condition.
Additional sources
In addition to the broad and pronounced late positive deflection (at ∼400-600 msec), the two bilateral RSs in IT showed an early, low-amplitude positive deflection (at ∼200-250 msec). The early positive deflection contributed to the N2 scalp component at the occipitoparietal electrode sites. Although the strength of the RS was similar in both conditions, the right IT source peaked significantly earlier in the distractor condition. The left and right anterior INS sources also showed an early negative deflection (at ∼300 msec) that generated a frontally distributed P2 scalp component. Interestingly, there was a significant increase of the right INS source strength in the target condition. The singular RS in the CG showed a broad negative component that peaked at ∼650 msec and was pronounced in the target condition. The second singular source, seeded in the right STS, showed a sustained negative deflection which peaked at ∼550 msec in the target condition. However, the amplitude of both singular sources did not differ significantly between target and distractor conditions. The two bilateral RSs in the PFC had narrow positive peaks at ∼500 msec, which showed no difference between conditions. When an additional pair of regional probe sources (Scherg and Berg, 1996) was added to the model and placed into the other cortical regions at a minimum distance of 3 cm from the seeded sources, no prominent activities were observed in these regions.
Discussion
This study provides a combined model for the source localization of the P3a and P3b scalp potentials in the visual modality. However, this approach has some inherent caveats. The seeding strategy implies the fMRI clusters as potential sources of the ERP without the implication that all activated clusters must contribute to the activity seen in the ERP after averaging. An fMRI activation cluster might not be a contributing source to the scalp averaged ERP, for example when the geometry of the cortical sheet leads to an almost closed source configuration or when it reflects temporally dispersed activity that is lost by the averaging procedure. Additional analytical tools that are sensitive to the non-time-locked components of EEG activity will therefore be needed to be combined with source analysis (Hoechstetter et al., 2004). Moreover, the exact neuroanatomical localization of the sources was limited by the use of averaged fMRI and ERP data, the standard brain anatomy, and a common model constructed to compare the source contribution in target and distractor condition, which also blurred the spatial accuracy of the sources.
Relationship to previous source localization studies
Previous source localization studies of scalp electrical P300 ERP responses mainly investigated the P3b potential in the auditory modality (references listed in Introduction), whereas the visual P3b received considerably less attention and the visual P3a none at all (Okada et al., 1983; Goto et al., 1996; Yamazaki et al., 2000, 2001; Jentzsch and Sommer, 2001). The EEG source-localization studies of the visual P3b potential yielded mainly generators in deep mesial temporal structures. Yamazaki et al. (2000, 2001) reported additional sources in inferior frontal and parietal areas. However, the use of only few scalp electrodes without constraining the solution space by MRI and/or fMRI data likely explains both the differences among these studies and our partly diverging findings. Moores et al. (2003) methodologically improved the ERP source-localization approach by using 124 electrodes and constraining the solution space by the individual brain anatomy. They identified source activity bilaterally in the intraparietal sulcus and superior parietal lobule (SPL), which partly conforms to our findings. The studies that come closest to our approach to combining fMRI and ERP looked exclusively at the P300 in auditory oddball data and covered only part of the brain, and their results are thus difficult to compare with ours (Menon et al., 1997; Opitz et al., 1999a,b).
P3b and sensory modality
Although previous fMRI results suggested that the target detection network is supramodal (Linden et al., 1999), recent fMRI and source localization findings (Ardekani et al., 2002; Kiehl and Liddle, 2003; Moores et al., 2003) and our present results indicate a modality-specific component, as evidenced by the IT contribution to the visual P3b. Previous intracranial EEG (iEEG) findings (Halgren et al., 1998), topographic scalp ERP studies (Johnson, 1989b; Falkenstein et al., 1994), and lesion studies (Johnson, 1989a) also indicated different sources for the visual and auditory modality.
P3a and P3b on the scalp, in intracranial recordings, and lesion studies
In contrast to the scalp EEG studies, which used the scalp distribution as a defining attribute of the P3a and P3b potential, Halgren et al. (1998) labeled the generators according to their sensitivity to the experimental manipulation. However, as a result of the iEEG method, it remained unclear to what extent the localized generators contributed to the P3a and P3b scalp ERP. The P3a generators were located in the dorsolateral prefrontal cortex (DLPFC), IPL, and GC, whereas P3b generators were identified in ventrolateral prefrontal cortex, STS, PPC-SPL, and in medial temporal areas. Our findings converge with the iEEG results in that the source activity in the IPL and PFC was associated with rare events, regardless of whether they were task related or not. Furthermore, we also found that the PPC source activity increased with task relevance. However, in extension of the iEEG results, we show that both IPL and PPC sources contribute to the parietal scalp P3b potential, whereas the PFC, STS, and GC sources make little or no contribution.
Despite these primarily converging findings, a few differences between the present study and the iEEG studies need to be addressed. We found that sources in the PrCS and IT contributed strongly to the P3a and P3b scalp potential, respectively, which had not been found with iEEG. A potential explanation might be that the iEEG recordings obtained few or no data from these regions as a result of the limited number of depth electrodes. Another important difference regards the involvement of the mesial temporal lobe in the generation of the P3b (Halgren et al., 1995b). However, it has been questioned whether the hippocampus does make a significant contribution to the generation of the scalp P300 (Nunez, 1985; McCarthy et al., 1989), and several lesion studies (Stapleton et al., 1987; Johnson, 1989a; Scheffers et al., 1991; Polich and Squire, 1993; Knight, 1996) failed to show a reduction in P3b amplitude after mesial temporal lobectomy or damage.
Although our findings concerning the P3b sources thus correspond relatively well to the lesion literature, they diverge with respect to the generators of the P3a. Knight (1984, 1996), Yamaguchi and Knight (1991), and Daffner et al. (2000) showed a reduction of the P3a amplitude in patients with hippocampal or DLPFC damage. This apparent contradiction can be resolved if we assume that the frontal P3a response has contributions from two different neural systems, corresponding to two distinct cognitive tasks. In this model, one system is concerned with the evaluation of novel stimuli that have already captured attention (Friedman et al., 2001). This system is characterized by rapid habituation (Courchesne et al., 1975). A second, goal-directed system is activated by perceptually simple and repeated stimuli, but only when they are in the locus of attention and distract the processing of the primary task. Lesion and fMRI studies showed that the prefrontal cortex and hippocampus are involved in the novelty evaluation system (Yamaguchi and Knight, 1991; Knight, 1996; Yamaguchi et al., 2004). In contrast, the second mechanism might be ascribed to the premotor cortex (Corbetta and Shulman, 2002), which was an important generator of the P3a in our study.
Functional significance of the P3a and P3b
Our findings suggest that the interplay of parietal regions (IPL, PPC) and the inferior temporal cortex generated the visual P3b component, whereas the source activity in the PrCS and INS contributed mainly to the P3a potential. This is the first indication that higher visual areas in the inferior temporal cortex contribute to the P3b scalp potential. The other regions that contributed notably to the P3b were located in the parietal lobes. We found IPL source activity to be equally strong for target and distractor rare events, which conforms to its role in the stimulus-driven attentional system proposed by Corbetta and Shulman (2002). This is in line with findings from lesion (Knight et al., 1989; Yamaguchi and Knight, 1991; Verleger et al., 1994) and iEEG studies (Halgren et al., 1998). The second parietal source was found in the PPC and showed a sustained and more pronounced activity in the target condition, which might relate to the role of that region in goal-directed attention and visuomotor integration (Corbetta and Shulman, 2002). The involvement of IT, together with IPL and PPC, in the generation of the P3b potential can be integrated in Kok's model of the P3b potential (Kok, 2001). According to this model, the P3b amplitude reflects the cognitive capacity invested in the categorization of task-relevant or significant events, which is controlled by the joint operation of attention and working memory. On the basis of the fMRI findings, we would suggest that the IT source activity reflects the categorization process of the visual stimuli, whereas the generators in the parietal region reflect the stimulus-driven (IPL) and top-down (PPC) attentional processes that modulate and control the event categorization. The targets, which were both task relevant and difficult to distinguish from the standards, put a higher demand on the systems for categorization and directed attention than the distractors and thus resulted in higher activity in the IT and the PPC source.
The P3a had a major contribution from the PrCS. Several fMRI studies showed that areas along the PrCS (including frontal eye fields) play an important role in the goal-directed (top-down) attentional selection (Corbetta et al., 1998; Goebel et al., 1998; Huettel et al., 2001; Shulman et al., 2003). We propose that the PrCS activation observed here indicates a disengagement of attention, previously focused on the target-standard discrimination, and a subsequent allocation of attentional resources to resolve the competition between the target and the irrelevant distractor (Corbetta and Shulman, 2002).
Conclusions
fMRI-based seeding of EEG generators yielded a convincing model that explains most of the variance of scalp ERPs during a visual three-stimulus oddball task. Parietal and inferior temporal areas mainly contributed to the P3b, and precentral areas and the insula contributed to the P3a. The differential contribution of frontal and parietal areas resulted from different demand on the attentional subsystems in target and distractor processing.
Footnotes
The Brain Imaging Center is supported by the German Ministry for Education and Research and Deutsche Forschungsgemeinschaft. C.B. was supported by a grant from Alzheimer Forschung Initiative. We are grateful to Profs. Ruxandra Sireteanu and Konrad Maurer for constant support.
Correspondence should be addressed to Dr. David Linden, School of Psychology, University of Wales Bangor, Penrallt Road, Bangor LL57 2AS, UK. E-mail: d.linden@bangor.ac.uk.
Copyright © 2004 Society for Neuroscience 0270-6474/04/249353-08$15.00/0
References
- Anderer P, Pascual-Marqui RD, Semlitsch HV, Saletu B (1998) Differential effects of normal aging on sources of standard N1, target N1 and target P300 auditory event-related brain potentials revealed by low resolution electromagnetic tomography (LORETA). Electroencephalogr Clin Neurophysiol 108: 160-174. [DOI] [PubMed] [Google Scholar]
- Ardekani BA, Choi SJ, Hossein-Zadeh GA, Porjesz B, Tanabe JL, Lim KO, Bilder R, Helpern JA, Begleiter H (2002) Functional magnetic resonance imaging of brain activity in the visual oddball task. Brain Res Cogn Brain Res 14: 347-356. [DOI] [PubMed] [Google Scholar]
- Baudena P, Halgren E, Heit G, Clarke JM (1995) Intracerebral potentials to rare target and distractor auditory and visual stimuli. III. Frontal cortex. Electroencephalogr Clin Neurophysiol 94: 251-264. [DOI] [PubMed] [Google Scholar]
- Bledowski C, Prvulovic D, Goebel R, Zanella FE, Linden DE (2004) Attentional systems in target and distractor processing: a combined ERP and fMRI study. NeuroImage 22: 530-540. [DOI] [PubMed] [Google Scholar]
- Corbetta M, Shulman GL (2002) Control of goal-directed and stimulus-driven attention in the brain. Nat Rev Neurosci 3: 201-215. [DOI] [PubMed] [Google Scholar]
- Corbetta M, Akbudak E, Conturo TE, Snyder AZ, Ollinger JM, Drury HA, Linenweber MR, Petersen SE, Raichle ME, Van Essen DC, Shulman GL (1998) A common network of functional areas for attention and eye movements. Neuron 21: 761-773. [DOI] [PubMed] [Google Scholar]
- Courchesne E, Hillyard SA, Galambos R (1975) Stimulus novelty, task relevance and the visual evoked potential in man. Electroencephalogr Clin Neurophysiol 39: 131-143. [DOI] [PubMed] [Google Scholar]
- Daffner KR, Mesulam MM, Holcomb PJ, Calvo V, Acar D, Chabrerie A, Kikinis R, Jolesz FA, Rentz DM, Scinto LF (2000) Disruption of attention to novel events after frontal lobe injury in humans. J Neurol Neurosurg Psychiatry 68: 18-24. [DOI] [PMC free article] [PubMed] [Google Scholar]
- Dien J, Spencer KM, Donchin E (2003) Localization of the event-related potential novelty response as defined by principal components analysis. Brain Res Cogn Brain Res 17: 637-650. [DOI] [PubMed] [Google Scholar]
- Donchin E, Coles MG (1988) Is the P300 component a manifestation of context updating? Behav Brain Sci 11: 357-374. [Google Scholar]
- Downar J, Crawley AP, Mikulis DJ, Davis KD (2001) The effect of task relevance on the cortical response to changes in visual and auditory stimuli: an event-related fMRI study. NeuroImage 14: 1256-1267. [DOI] [PubMed] [Google Scholar]
- Efron B, Tibshirani RJ (1993) An introduction to the bootstrap. New York: Chapman and Hall.
- Falkenstein M, Hohnsbein J, Hoormann J (1994) Effects of choice complexity on different subcomponents of the late positive complex of the event-related potential. Electroencephalogr Clin Neurophysiol 92: 148-160. [DOI] [PubMed] [Google Scholar]
- Friedman D, Cycowicz YM, Gaeta H (2001) The novelty P3: an event-related brain potential (ERP) sign of the brain's evaluation of novelty. Neurosci Biobehav Rev 25: 355-373. [DOI] [PubMed] [Google Scholar]
- Gaeta H, Friedman D, Hunt G (2003) Stimulus characteristics and task category dissociate the anterior and posterior aspects of the novelty P3. Psychophysiology 40: 198-208. [DOI] [PubMed] [Google Scholar]
- Goebel R, Linden DE, Lanfermann H, Zanella FE, Singer W (1998) Functional imaging of mirror and inverse reading reveals separate coactivated networks for oculomotion and spatial transformations. NeuroReport 9: 713-719. [DOI] [PubMed] [Google Scholar]
- Goldstein A, Spencer KM, Donchin E (2002) The influence of the stimulus deviance and novelty on the P300 and novelty P3. Psychophysiology 39: 781-790. [PubMed] [Google Scholar]
- Goto Y, Brigell MG, Parmeggiani L (1996) Dipole-modeling of the visual evoked P300. J Psychosom Res 41: 71-79. [DOI] [PubMed] [Google Scholar]
- Halgren E, Baudena P, Clarke JM, Heit G, Liegeois C, Chauvel P, Musolino A (1995a) Intracerebral potentials to rare target and distractor auditory and visual stimuli. I. Superior temporal plane and parietal lobe. Electroencephalogr Clin Neurophysiol 94: 191-220. [DOI] [PubMed] [Google Scholar]
- Halgren E, Baudena P, Clarke JM, Heit G, Marinkovic K, Devaux B, Vignal JP, Biraben A (1995b) Intracerebral potentials to rare target and distractor auditory and visual stimuli. II. Medial, lateral and posterior temporal lobe. Electroencephalogr Clin Neurophysiol 94: 229-250. [DOI] [PubMed] [Google Scholar]
- Halgren E, Marinkovic K, Chauvel P (1998) Generators of the late cognitive potentials in auditory and visual oddball tasks. Electroencephalogr Clin Neurophysiol 106: 156-164. [DOI] [PubMed] [Google Scholar]
- Hegerl U, Frodl-Bauch T (1997) Dipole source analysis of P300 component of the auditory evoked potential: a methodological advance? Psychiatry Res 74: 109-118. [DOI] [PubMed] [Google Scholar]
- Hoechstetter K, Bornfleth H, Weckesser D, Ille N, Berg P, Scherg M (2004) BESA source coherence-a new method to study cortical oscillatory coupling. Brain Topogr 16: 233-238. [DOI] [PubMed] [Google Scholar]
- Horovitz SG, Skudlarski P, Gore JC (2002) Correlations and dissociations between BOLD signal and P300 amplitude in an auditory oddball task: a parametric approach to combining fMRI and ERP. Magn Reson Imaging 20: 319-325. [DOI] [PubMed] [Google Scholar]
- Huettel SA, Guzeldere G, McCarthy G (2001) Dissociating the neural mechanisms of visual attention in change detection using functional MRI. J Cogn Neurosci 13: 1006-1018. [DOI] [PubMed] [Google Scholar]
- Jentzsch I, Sommer W (2001) Sequence-sensitive subcomponents of P300: topographical analyses and dipole source localization. Psychophysiology 38: 607-621. [PubMed] [Google Scholar]
- Johnson Jr R (1989a) Auditory and visual P300s in temporal lobectomy patients: evidence for modality-dependent P300 generators. Psychophysiology 26: 633-650. [DOI] [PubMed] [Google Scholar]
- Johnson Jr R (1989b) Developmental evidence for modality-dependent P300 generators: a normative study. Psychophysiology 26: 651-667. [DOI] [PubMed] [Google Scholar]
- Kiehl KA, Liddle PF (2003) Reproducibility of the hemodynamic response to auditory oddball stimuli: a six-week test-retest study. Hum Brain Mapp 18: 42-52. [DOI] [PMC free article] [PubMed] [Google Scholar]
- Knight RT (1984) Decreased response to novel stimuli after prefrontal lesions in man. Electroencephalogr Clin Neurophysiol 59: 9-20. [DOI] [PubMed] [Google Scholar]
- Knight RT (1996) Contribution of human hippocampal region to novelty detection. Nature 383: 256-259. [DOI] [PubMed] [Google Scholar]
- Knight RT, Scabini D, Woods DL, Clayworth CC (1989) Contribution of the temporal-parietal junction to the auditory P3. Brain Res 502: 109-116. [DOI] [PubMed] [Google Scholar]
- Kok A (2001) On the utility of P3 amplitude as a measure of processing capacity. Psychophysiology 38: 557-577. [DOI] [PubMed] [Google Scholar]
- Linden DE, Prvulovic D, Formisano E, Völlinger M, Zanella FE, Goebel R, Dierks T (1999) The functional neuroanatomy of target detection: an fMRI study of visual and auditory oddball tasks. Cereb Cortex 9: 815-823. [DOI] [PubMed] [Google Scholar]
- McCarthy G, Wood CC, Williamson PD, Spencer DD (1989) Task-dependent field potentials in human hippocampal formation. J Neurosci 9: 4253-4268. [DOI] [PMC free article] [PubMed] [Google Scholar]
- McCarthy G, Luby M, Gore J, Goldman-Rakic P (1997) Infrequent events transiently activate human prefrontal and parietal cortex as measured by functional MRI. J Neurophysiol 77: 1630-1634. [DOI] [PubMed] [Google Scholar]
- Mecklinger A, Ullsperger P (1995) The P300 to novel and target events: a spatiotemporal dipole model analysis. NeuroReport 7: 241-245. [PubMed] [Google Scholar]
- Mecklinger A, Maess B, Opitz B, Pfeifer E, Cheyne D, Weinberg H (1998) A MEG analysis of the P300 in visual discrimination tasks. Electroencephalogr Clin Neurophysiol 108: 45-56. [DOI] [PubMed] [Google Scholar]
- Menon V, Ford JM, Lim KO, Glover GH, Pfefferbaum A (1997) Combined event-related fMRI and EEG evidence for temporal-parietal cortex activation during target detection. NeuroReport 8: 3029-3037. [DOI] [PubMed] [Google Scholar]
- Moores KA, Clark CR, Hadfield JL, Brown GC, Taylor DJ, Fitzgibbon SP, Lewis AC, Weber DL, Greenblatt R (2003) Investigating the generators of the scalp recorded visuo-verbal P300 using cortically constrained source localization. Hum Brain Mapp 18: 53-77. [DOI] [PMC free article] [PubMed] [Google Scholar]
- Mulert C, Jäger L, Schmitt R, Bussfeld P, Pogarell O, Möller HJ, Juckel G, Hegerl U (2004) Integration of fMRI and simultaneous EEG: towards a comprehensive understanding of localization and time-course of brain activity in target detection. NeuroImage 22: 83-94. [DOI] [PubMed] [Google Scholar]
- Nunez P (1985) Physical principles and neurophysiological mechanisms underlying event-related potentials. In: Neocortical dynamics and human EEG rhythms (Nunez P, ed), pp 19-36. New York: Oxford UP.
- Okada YC, Kaufman L, Williamson SJ (1983) The hippocampal formation as a source of the slow endogenous potentials. Electroencephalogr Clin Neurophysiol 55: 417-426. [DOI] [PubMed] [Google Scholar]
- Opitz B, Mecklinger A, Von Cramon DY, Kruggel F (1999a) Combining electrophysiological and hemodynamic measures of the auditory oddball. Psychophysiology 36: 142-147. [DOI] [PubMed] [Google Scholar]
- Opitz B, Mecklinger A, Friederici AD, Von Cramon DY (1999b) The functional neuroanatomy of novelty processing: integrating ERP and fMRI results. Cereb Cortex 9: 379-391. [DOI] [PubMed] [Google Scholar]
- Polich J, Comerchero MD (2003) P3a from visual stimuli: typicality, task, and topography. Brain Topogr 15: 141-152. [DOI] [PubMed] [Google Scholar]
- Polich J, Herbst KL (2000) P300 as a clinical assay: rationale, evaluation, and findings. Int J Psychophysiol 38: 3-19. [DOI] [PubMed] [Google Scholar]
- Polich J, Squire LR (1993) P300 from amnesic patients with bilateral hippocampal lesions. Electroencephalogr Clin Neurophysiol 86: 408-417. [DOI] [PubMed] [Google Scholar]
- Scheffers MK, Johnson Jr R, Ruchkin DS (1991) P300 in patients with uni-lateral temporal lobectomies: the effects of reduced stimulus quality. Psychophysiology 28: 274-284. [DOI] [PubMed] [Google Scholar]
- Scherg M (1990) Fundamentals of dipole source potential analysis. In: Auditory evoked magnetic fields and electric potentials (Grandori F, Hoke M, Romani GL, eds), pp 40-69. Basel: Karger.
- Scherg M (1992) Functional imaging and localization of electromagnetic brain activity. Brain Topogr 5: 103-111. [DOI] [PubMed] [Google Scholar]
- Scherg M (2004) BESA source analysis combining EEG and fMRI. E-book available at http://www.besa.de/tutorials/index_lectures_intro.htm.
- Scherg M, Berg P (1996) New concepts of brain source imaging and localization. Electroencephalogr Clin Neurophysiol [Suppl] 46: 127-137. [PubMed] [Google Scholar]
- Scherg M, Picton TW (1991) Separation and identification of event-related potential components by brain electric source analysis. Electroencephalogr Clin Neurophysiol [Suppl] 42: 24-37. [PubMed] [Google Scholar]
- Scherg M, Von Cramon D (1985) Two bilateral sources of the late AEP as identified by a spatio-temporal dipole model. Electroencephalogr Clin Neurophysiol 62: 32-44. [DOI] [PubMed] [Google Scholar]
- Scherg M, Von Cramon D (1986) Evoked dipole source potentials of the human auditory cortex. Electroencephalogr Clin Neurophysiol 65: 344-360. [DOI] [PubMed] [Google Scholar]
- Shulman GL, McAvoy MP, Cowan MC, Astafiev SV, Tansy AP, d'Avossa G, Corbetta M (2003) Quantitative analysis of attention and detection signals during visual search. J Neurophysiol 90: 3384-3397. [DOI] [PubMed] [Google Scholar]
- Stapleton JM, Halgren E, Moreno KA (1987) Endogenous potentials after anterior temporal lobectomy. Neuropsychologia 25: 549-557. [DOI] [PubMed] [Google Scholar]
- Tarkka IM, Stokic DS (1998) Source localization of P300 from oddball, single stimulus, and omitted-stimulus paradigms. Brain Topogr 11: 141-151. [DOI] [PubMed] [Google Scholar]
- Tarkka IM, Stokic DS, Basile LF, Papanicolaou AC (1995) Electric source localization of the auditory P300 agrees with magnetic source localization. Electroencephalogr Clin Neurophysiol 96: 538-545. [DOI] [PubMed] [Google Scholar]
- Tarkka IM, Micheloyannis S, Stokic DS (1996) Generators for human P300 elicited by somatosensory stimuli using multiple dipole source analysis. Neuroscience 75: 275-287. [DOI] [PubMed] [Google Scholar]
- Valeriani M, Fraioli L, Ranghi F, Giaquinto S (2001) Dipolar source modeling of the P300 event-related potential after somatosensory stimulation. Muscle Nerve 24: 1677-1686. [DOI] [PubMed] [Google Scholar]
- Verleger R (1988) Event-related potentials and cognition: a critique of context updating hypothesis and an alternative interpretation of P3. Behav Brain Sci 11: 343-356. [Google Scholar]
- Verleger R, Heide W, Butt C, Kompf D (1994) Reduction of P3b potentials in patients with temporo-parietal lesions. Cogn Brain Res 2: 103-116. [DOI] [PubMed] [Google Scholar]
- Yamaguchi S, Knight RT (1991) Anterior and posterior association cortex contributions to the somatosensory P300. J Neurosci 11: 2039-2054. [DOI] [PMC free article] [PubMed] [Google Scholar]
- Yamaguchi S, Hale LA, D'Esposito M, Knight RT (2004) Rapid prefrontal-hippocampal habituation to novel events. J Neurosci 24: 5356-5363. [DOI] [PMC free article] [PubMed] [Google Scholar]
- Yamazaki T, Kamijo K, Kenmochi A, Fukuzumi S, Kiyuna T, Takaki Y, Kuroiwa Y (2000) Multiple equivalent current dipole source localization of visual event-related potentials during oddball paradigm with motor response. Brain Topogr 12: 159-175. [DOI] [PubMed] [Google Scholar]
- Yamazaki T, Kamijo K, Kiyuna T, Takaki Y, Kuroiwa Y (2001) Multiple dipole analysis of visual event-related potentials during oddball paradigm with silent counting. Brain Topogr 13: 161-168. [DOI] [PubMed] [Google Scholar]