

Abstract
Using a dialysis probe near CA1 hippocampal recording electrodes, we infused nonspecific (scopolamine) and specific (methoctramine, pirenzepine) antagonists of muscarinic cholinergic transmission to determine their effects on the positional firing properties of place cells. Both low (0.5 mm) and high (2.0 or 3.0 mm) scopolamine significantly decreased in-field firing rate, increased the ratio of out-of-field to in-field rate, and reduced the smoothness of rate maps, while tending to increase out-of-field rate. Thus, local nonspecific muscarinic blockade mimicked the effects seen with intracerebroventricular application, suggesting that blockade of receptors local to the recorded cells plays an essential role. Unexpectedly, dialysis of scopolamine reduced locomotor activity, again duplicating the effects of intracerebroventricular administration. Most effects of methoctramine (1.0 mm), which blocks presynaptic m2 and m4 receptors, were initially strong but then diminished over hours. Methoctramine produced a significant increase only in out/in ratio and out-of-field rate, whereas it tended to increase in-field rate and monotonically decrease smoothness. Pirenzepine (3.0 mm), which blocks postsynaptic m1 receptors, produced a significant increase only in out/in ratio, whereas it tended to increase out-of-field rate and decrease in-field rate; all these effects were monotonic with respect to time. A mixture of methoctramine plus pirenzepine recapitulated the place-cell effects of scopolamine, although neither the mixture nor its separate components affected behavior. We conclude that the effects of scopolamine on place cells likely result from a combination of blockade of postsynaptic m1 receptors, leading to reduced excitability, with blockade of presynaptic m2 and m4 receptors, leading to increased out-of-field firing.
Keywords: place cell, hippocampus, muscarinic transmission, scopolamine, methoctramine, pirenzepine
Introduction
The normal operation of the hippocampus requires intact muscarinic cholinergic transmission (van der Zee and Luiten, 1999). After systemic or intracerebroventricular administration of the broad-acting muscarinic antagonists atropine or scopolamine, various changes are seen. At the behavioral level, impairments occur in learning and performance of hippocampal-dependent tasks, including the Morris swimming task (Saucier et al., 1996; Wallenstein and Vago, 2001; Rogers and Kesner, 2004). Normal avoidance of an electrical shock is affected, although signs of fear persist and escape at the time of the shock is apparently unaffected (Kramis et al., 1975); anti-muscarinic treatment also modifies the hippocampal EEG and alters the precise relationship between the state of the hippocampal EEG and behavior. At the cell and synaptic levels, nonspecific anti-muscarinic drugs tend to decrease postsynaptic excitability and response to glutamate, whereas they increase acetylcholine and glutamate release by blocking presynaptic receptors (Marchi and Raiteri, 1989; Stillman et al., 1996; Volpicelli and Levey, 2004).
Recently, work has begun on understanding the significance of muscarinic transmission for single-cell signaling in intact, freely moving rats. A major goal of this work is to understand how the cell and synaptic consequences of interfering with muscarinic transmission help explain the behavioral consequences. Two studies published to date (Ikonen et al., 2002; Brazhnik et al., 2003) focus on links between muscarinic transmission and the activity of the hippocampal “place cells” that are thought to play a key role in spatial learning and memory in rodents. Place cells are characterized by location-specific discharge such that intense activity is seen only when a rat's head is in a restricted region called the “firing field.” These fields are cell specific and stable in familiar circumstances. Immunochemical lesions of the septohippocampal cholinergic pathways do not affect the existence or stability of place cells in a familiar environment but retard or eliminate the formation of new firing fields for the same cells in a novel environment (Ikonen et al., 2002).
In previous pharmacological experiments, intracerebroventricular injections of scopolamine had several acute, reversible effects on CA1 and CA3 place cells: (1) the in-field firing rate decreased, (2) the out-of-field firing rate tended to increase, and (3) the local smoothness (“coherence”; see Materials and Methods) of firing fields decreased. These results, however, leave unanswered at least two important questions. First, the broad drug distribution produced by intracerebroventricular injections makes it unclear whether the site of action is local to the recorded cells or more distant. Second, because scopolamine acts on all (m1-m5) muscarinic receptors, it is impossible to know which subtypes must be blocked to cause the observed changes.
To begin to address these issues, we recorded CA1 place cells during local dialysis of various muscarinic antagonists. Local scopolamine dialysis reproduced the effects of intracerebroventricular injections, implying that the key muscarinic receptors are near or on the recorded cells. In addition, the effects of scopolamine could be separated into different components by dialysis of more specific antagonists of muscarinic receptor subtypes. We conclude that the constellation of effects produced by scopolamine may be caused by simultaneous action of the drug at the mainly postsynaptic m1 receptors and the mainly presynaptic m2 and m4 receptors (Dutar and Nicoll, 1988; Marchi and Raiteri, 1989; Stillman et al., 1996; Kitaichi et al., 1999; Volpicelli and Levey, 2004).
Materials and Methods
Subjects. Eighteen male Long-Evans rats (Harlan, Indianapolis, IN) weighing between 250 and 350 gm were used as subjects. They were housed one per cage in a standard colony room on a 12 hr light/dark cycle, except during experiments. Water was available ad libitum in the home cage.
Apparatus. The recording chamber was a gray cylinder 50 cm high and 76 cm in diameter. It was centered within a black cylindrical curtain 152 cm in diameter that extended from floor to ceiling to visually isolate the cylinder from the recording room. A white cue card occupied 90° of the inner cylinder wall and was centered at 3 o'clock (“east”) as viewed from overhead; the card remained on the east wall during all recording sessions. Lighting was provided by four small bulbs placed symmetrically overhead. The cylinder was placed on gray photographic backdrop paper that was renewed between recording session sequences. The recording chamber plus curtains were centered inside a 213 × 213 × 213 cm sound-attenuated box. Mounted on the top of the box were a TV camera for digitizing the rat's position, a dual syringe pump, dual two-way valve and dual liquid swivel for dialysate flow, and a commutator for electrical connections.
Behavioral task. Before surgery, hungry rats (85% of ad libitum weight) were trained to forage for 20 mg food pellets randomly scattered on the floor of the recording chamber at a mean rate of three per minute. Training lasted between 1 and 2 weeks, until the individual rat was seen to readily enter and cross the center of the recording cylinder. To maintain the deprived body weight, the rats were given 6-8 gm of standard lab chow each night in addition to the pellets that they obtained in the chamber.
Microelectrode plus microdialysis assembly. The methods for the combined microdialysis and multiwire recording system were worked out in this laboratory (Ludvig et al., 1994, 1996). We modified a drivable array of 10 nichrome microelectrodes (25 μm) (Kubie, 1984) by attaching to it, for these studies, a commercial 1 mm microdialysis probe and guide (CMA/11, CMA Microdialysis, Acton, MA). The microelectrodes were threaded through a stainless steel tube that was glued to the dialysis probe guide such that the electrode tips were ∼0.5 mm above the bottom of the dialysis membrane. The center of the electrode bundle and the outside of the dialysis probe were ∼0.6 mm apart in the horizontal plane. When implanted in the brain the microelectrode bundle was positioned anterior and medial to the probe such that a line connecting the centers made a 45° angle with the midline of the skull.
Surgery. Surgery was performed after pellet-chasing training. Rats were anesthetized with pentobarbital (40 mg/kg) and placed in a Kopf stereotaxic apparatus. Rats were also given atropine (0.1 mg/kg) to prevent respiratory distress. A midline incision was made, the bregma was marked, and the skull was leveled. Four screws were placed in the skull to anchor the headgear, one on each side in the frontal bones (one of which served as a reference electrode), one over the left cerebellum, and one toward the rear of the skull in the right lateral bone ridge. A 2 mm hole was drilled over the left hippocampus 3.8 mm posterior and 2.7 mm lateral to bregma, and the electrode assembly was lowered so that the tips were 1.5 mm below dura. A dummy stylus that took the place of the actual microdialysis probe was inserted in the dialysis guide during surgery and recovery. Sterilized petroleum jelly was applied to the shaft of the electrode and dialysis guide tubes to protect the brain from the dental cement. To complete the surgery, the exposed skull area and the drive-screw assemblies were embedded in dental cement. A 1-2 week recovery period between surgery and recordings was allowed.
Recordings. After recovery, the 10 recording electrodes were monitored once or twice daily for high-frequency ripples indicative of distant single-cell activity and for distinguishable extracellular action potentials. If all electrodes were silent, the array was advanced by 40 μm. Once extracellular waveforms >100 μV were resolved, their underlying generators were classified as pyramidal cells or theta cells according to criteria outlined by Muller et al. (1987), Kubie et al. (1990), and Ranck (1973). Generally, theta cells (interneurons) (Fox and Ranck, 1981) were seen exclusively as the electrode bundle penetrated superficial stratum oriens. With deeper penetrations, theta cells and pyramidal cells were seen simultaneously, and once in stratum pyramidale, most waveforms satisfied the criteria for pyramidal cells (Fox and Ranck, 1975).
Electrical and fluid connections. The microwires were led to a 10-pin circular (Augat) connector that mated with a headstage containing unity gain operational amplifiers. The outputs of these amplifiers were sent through a 2.5 m cable that terminated at a 25-channel commutator (Crist Instruments, Damascus, MD). Signals from the fixed side of the commutator were amplified by 5000, bandpass filtered 0.3-10 kHz, and captured with a Discovery workstation (DataWave, Longmont, CO). Discrimination of waveforms into time series produced by single cells was initially done before recording and later refined off-line. In general, we recorded between one and six cells from eight wires, the signals of which could be digitized simultaneously with an aggregate rate of 240 KHz.
The pH of the solutions for dialysis [artificial CSF (aCSF) or aCSF containing a drug] was tested and, if necessary, adjusted to 7.4 before loading the solutions into syringes. These fluids were supplied from a dual syringe pump so that one of two solutions pumped at the same rate could be directed through the dialysis probe, and the other was sent to a waste container. The type of dialysate (aCSF or drug solution) could be switched with a multichannel valve situated near the pump. The output of the pump was sent along 0.7-mm-diameter silica tubing (Polymer Technologies, Phoenix, AZ) through one channel of a two-channel fluid swivel. Silica tubing attached to the rotating side of the swivel passed through the center of the commutator and was led to the input side of the dialysis probe. Flow from the output side of the probe was sent back up through the second channel of the swivel where it was directed to a waste collector.
Dialysis probe insertion. Once electrical signals indicated that the microwires were above CA1 stratum pyramidale, the dummy stylus was removed, and the sterilized microdialysis probe was inserted carefully into the brain. Once the dialysis probe was in place, fluid and electrical connections were made and left in place for the entire 3-4 d duration of the experiment. Except during drug administration, as detailed below, the condition of the dialysis probe was maintained with a flow of aCSF of 5.0-6.5 μl/min at night and 10 μl/min during the day. The rat was allowed several hours for recovery after placement of the dialysis probe. During this time and during all overnight periods, the rat was kept in its home cage, which was set in the middle of the recording cylinder to allow the fluid and electrical connections to be continuous.
Recording protocol. After the dialysis probe was inserted and had stabilized for several hours, screening for adequate single-unit activity was resumed. Once large amplitude, well discriminated units were found, recordings were made during local dialysis of different drugs or drug mixtures. During an experimental sequence, a rat was run in a series of five 16 min recording sessions. The first two sessions were recorded during dialysis of aCSF to establish baseline properties of available cells; these sessions were separated by 0.5 hr. At the end of the second session, the dual valve was switched to send the selected drug into the dialysis probe. An interval of 1 hr was allowed before the first drug session. This interval was sufficient for the drug wave-front to reach the dialysis probe (∼20 min, as measured for our setup) and for the drug action to begin, as judged in pilot work using lidocaine to suppress activity. Finally, two more drug sessions were done at 1 hr intervals. The sequence of three drug sessions made it possible to determine the approximate time course of pharmacological effects. We required that the waveform of each cell to be included in this study should be monitored continuously for consistency and judged to be well isolated over the entire five-session sequence of two aCSF sessions and three drug sessions. This procedure helped to ensure that the same cell was recorded throughout the series of sessions.
On some occasions the standard series of five sessions was followed by additional exploratory sessions in which the drug concentration was changed, a second drug was added, a different drug was substituted in the dialysate, or the dialysate was switched back to aCSF to look for return of activity to the pre-drug baseline. Except for a few examples of recovery, results from these additional sessions are not reported here. Regardless of precise session sequence, a new standard series was never initiated until at least 24 hr had elapsed from the start of the preceding series. During this interval of between 16 and 20 hr, only aCSF was sent through the dialysis tubing, allowing any previously administered drug to be cleared from the brain. If the same cells were detectable the next day, we made additional baseline recordings to gain information about recovery before moving the electrodes. In addition to pharmacodynamic reasons for the overnight interval, it also enhanced the likelihood the rat would run freely over the entire apparatus area. The same rats were used in several series of sessions as dictated by the ability to isolate new cells. In these cases the order of drug administration was varied, and we discerned no serial effects on the properties of the recorded cells.
Pharmacological agents. All drugs were obtained from Sigma-RBI (Natick, MA). Pilot work with a wide range of concentrations was used to select the concentrations used here.
Our main interest was in the effects of antagonists of muscarinic cholinergic receptors. The following drugs were used: (1) the nonspecific antagonist scopolamine at dialysate concentrations of 0.5 mm (low dose) and 2 and 3 mm (high doses), (2) the m1 selective antagonist pirenzepine at a dialysate concentration of 3.0 mm, (3) the m2 plus m4 selective antagonist methoctramine at a dialysate concentration of 1.0 mm, and (4) a mixture in the dialysate of 3.0 mm pirenzepine plus 1.0 mm methoctramine.
The drug concentrations are for the dialysate because neither the values at the electrodes nor the steepness of the concentration gradients is known. Based on measurements using alcohol, drug concentrations at electrodes ∼0.75 mm away from the dialysis tubing are thought to be 10-30 times less than in the dialysate (Ludvig et al., 2001).
Data collection and analysis. The electrophysiological recording methods have been described previously (Muller et al. 1987, 1994; Kentros et al. 1998). To be included in the cell sample, a complex-spike cell had to be a place cell according to preliminary screening. This meant that the cell had to discharge when the rat's head was in one or sometimes two restricted portions of the recording cylinder and had to be virtually silent when the head was elsewhere. Formal recordings of place cells and theta cells were done in 16 min sessions as rats performed the pellet chasing task.
To permit automatic descriptions of positional firing patterns, we recorded the rat's position as well as spike activity. The rat was tracked at 60 Hz by detecting a red light-emitting diode (LED) mounted ∼1 cm above the midline at the back of the head. The position of the LED was digitized in a 64 × 64 grid of 2.5-cm-square regions (pixels) and sent to a computer where the coordinates were time stamped. The same clock was used to time stamp waveforms.
At the end of a recording session, the time spent by the rat in each pixel and the number of spikes generated by each cell in each pixel were accumulated into 64 × 64 arrays. For each cell, a corresponding 64 × 64 array of time-averaged firing rates was generated by dividing on a pixel by pixel basis the number of spikes in each location by the time in each location. These arrays were used to produce color-coded firing rate maps to visualize positional firing patterns. In such maps, increasing firing rates were represented in following the color order: yellow, orange, red, green, blue, purple. Yellow is used for the special case of exactly zero spikes per second. Pixels never visited by the rat are coded white. Colors in pixels with rate more than zero for the first session are assigned such that the number of pixels in a color category is 1.3 times higher than in the next higher color. In this way, the number of pixels in the lowest (orange) firing rate category is twice as great as the number in the highest (purple) category.
In addition to rate maps, positional firing patterns were characterized numerically. Several measures used for place cells depend on the fact that they discharge rapidly only when the rat's head is inside a restricted part of the environment called a “firing field”; when the head is outside of this stable, cell-specific region, the discharge rate approaches zero. Here, we define a firing field as a group of at least 36 pixels in which the firing rate is greater than zero and that share at least one edge with another pixel in the group.
For each well discriminated place cell we calculated the following: (1) the in-field rate: the firing rate averaged over the entire area of the apparatus containing the firing field(s) found in the first aCSF session; (2) the out-of-field rate: the rate averaged over the remainder of the environment; (3) the ratio of the out-of-field rate to the in-field rate; and (4) firing field size: the number of pixels in the field.
To compare these measures in sets of recording sessions, their values were found in the first baseline session. For all other sessions, the identities of in-field and out-of-field pixels were taken from their identities in the first session. Thus, if a pixel was part of the field in the first session of a series, it was potentially part of the field in all later sessions, regardless of its location relative to other pixels. Equally, if a pixel was out of the field in the first session, it was not taken as part of the field in any later session, regardless of its location relative to other pixels. This analysis is justified by the stable firing patterns of place cells under constant conditions so that deviations from constancy are taken to directly reflect the effects of drugs.
To estimate the smoothness or organization of the positional firing pattern, we also calculated “spatial coherence,” which is a nearest-neighbor two-dimensional autocorrelation. Coherence is the standard-score transform of the correlation between the firing rate in a pixel and the rate averaged over the eight nearest neighbors.
Statistical analysis. For each drug treatment we did a one-way ANOVA on each of the five place-cell properties, with session as the independent variable. Post hoc tests were performed where appropriate. All statistical tests were two-tailed, and a significance level of 0.05 was chosen. For theta cells, ANOVAs were done only on coherence and overall firing rate because theta cells discharge everywhere in the environment.
Histology. Electrode and microdialysis probe locations were verified histologically in Nissl-stained 40 μm frozen sections after rats were overdosed with Nembutal and perfused by 10% buffered formalin. In all cases the electrodes and probes were found in the CA1 cell layer.
Results
Stability of positional firing patterns during aCSF-only dialysis
From inspection of firing rate maps, infusion of aCSF over the whole 2.5 hr time course of the five session (two baseline plus three “drug”) protocol has no discernable effects on place-cell properties. In the example in Figure 1A, the firing field at 1 o'clock seen in the first baseline session persists unchanged in each of the other four sessions; only small, typical variations in the size, shape, and intensity of the field are visible.
Figure 1.
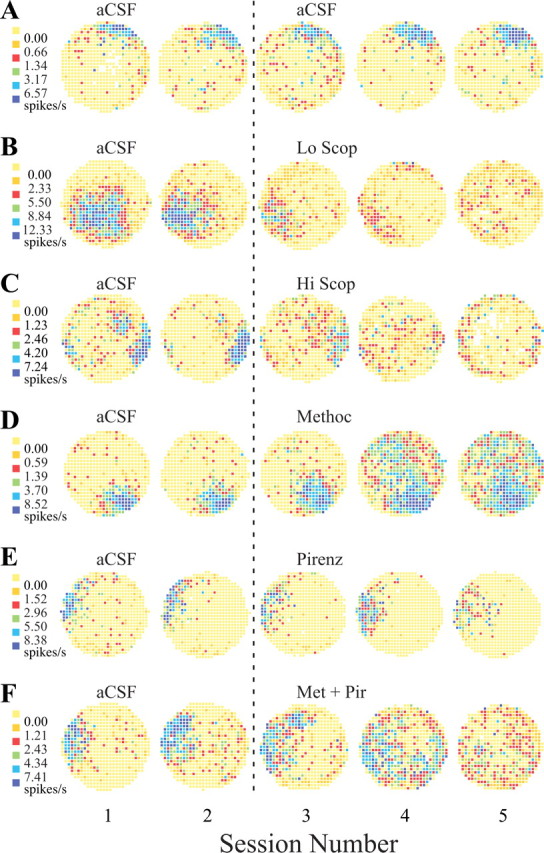
Example firing rate maps from place cells. In these maps, increasing firing rates are represented in color. Yellow represents pixels in which the firing rate was exactly zero over the entire 16 min session. To permit direct contrasts with other maps, the breakpoints between color categories (left end of each row) found for the first of each set are used for all five sessions in that row. A1, Rate map from the first control session. The firing field is against the wall at 1 o'clock. The very low density of nonzero pixels outside the field reflects the strong positional signal of this place cell. A2, The rate map for the second control session is very similar to the map from the first session, indicating that place-cell activity is strongly stationary in constant circumstances. A3-A5, In B-F, these sessions usually show the effects of dialyzing muscarinic antagonists. Here, however, the infusion of aCSF is maintained, providing a test for the stability of place-cell firing. The great similarity of each map in terms of the location of the firing field and the color coding required to represent the same breakpoints between categories indicates that this cell indeed showed constancy during the entire recording protocol. B, Dialysis of a low (0.5 mm) concentration of scopolamine. B1, In the first control (aCSF) session, this cell had a large firing field away from the cylinder wall at 7 o'clock. B2, The firing field in the second aCSF session is somewhat smaller than in the first session and is displaced slightly toward the cylinder wall. Nevertheless, the field is substantially the same in shape, size, position, and firing rate profile. B3, The first session during dialysis of 0.5 mm scopolamine. The field is now substantially smaller and considerably reduced in intensity, but its position is approximately the same as during the control recordings. B4, In the second drug session, the field weakens further but remains in about the same position. B5, In the final low-scopolamine session, the original field is gone. The cell now shows weak firing in other locations. C, Dialysis of high (2.0 or 3.0 mm) concentrations of scopolamine. C1, The firing field is against the wall at approximately 3:30 o'clock. There is a secondary patch of firing at ∼60% of the distance from the cylinder center at 1:30 o'clock. C2, The main field is constant during the second control session, whereas the secondary firing area is considerably weaker. C3, The main field is weakened during the first scopolamine session, and there is scattered firing over most of the cylinder surface. C4, A weak trace of the main field remains, and there is weak firing over the whole cylinder area. C5, Weak firing is mostly confined to the cylinder edge, in part because the rat tends to spend less time in the cylinder center. D, Dialysis of 1.0 mm methoctramine. D1, The firing field in the first control (aCSF) session is at 4:30 o'clock. D2, The firing field is essentially unchanged in the second aCSF session. D3, The field is hardly changed after the first session during dialysis of methoctramine. D4, During the second drug session, there is a very large, intense increase in out-of-field firing. D5, In the last methoctramine session, the out-of field firing persists. Increased out-of-field firing was characteristic of methoctramine administration, although the delayed onset and continued activity in the final session were atypical. E, Dialysis of 3.0 mm pirenzepine. D1-D4, The firing field at 9:30 o'clock is constant for the two aCSF sessions and the first two pirenzepine sessions. D5, In the final drug session, the firing field is considerably weaker than in the previous sessions, but it is still in the same position. F, Dialysis with 1.0 mm methoctramine plus 3.0 mm pirenzepine. F1, The firing field is at 9 o'clock in the first aCSF session. F2, The field is hardly different in the second aCSF session. F3, Although the field is substantially the same during the first session with the drug mixture, there appears to be some fragmentation with additional firing at 11:30 o'clock. F4, The positional firing pattern becomes quite fragmented, however, without much decrease in firing rate. F5, The original field is gone in the final drug session, leaving only sporadic firing that is quite spatially homogeneous. Scop, Scopolamine; Methoc, methoctramine; Pirenz, pirenzepine; Met + Pir, methoctramine plus pirenzepine.
To confirm the lack of change induced by aCSF dialysis, important place-cell properties including coherence, field size, in-field rate, out-of-field rate, and the ratio of out-of-field to in-field rates are plotted against session number in Figure 2. There appears to be a tendency for field size to decrease and for out-of-field firing and the out-rate to in-rate ratio to increase, but these trends occur mainly between the first two sessions, during which time the system may have been settling. In any case, a separate one-way ANOVA for each property indicates that no significant change took place during the five sessions, as shown in Table 1. The observed constancy of discharge properties during dialysis of a presumably inert material provides a proper starting point from which to determine the effects of drug dialysis.
Figure 2.

Plots of average parameters derived from the positional firing properties of eight place cells recorded during dialysis of only aCSF for the entire five-session protocol. Each parameter is plotted against session number. Plots show coherence, field size, in-field firing rate, out-of-field firing rate, and the ratio out-of-field rate to in-field rate. Although some apparent trends are visible, in no case did an ANOVA reveal a significant change in magnitude of the relevant variable.
Table 1.
ANOVAs for place-cell properties: aCSF dialysis
|
Property |
F ratio |
Probability |
|---|---|---|
| Coherence | 0.558 | 0.694 |
| Field size | 1.361 | 0.272 |
| In-field rate | 0.176 | 0.949 |
| Out-of-field rate | 1.443 | 0.246 |
| Out/in-rate ratio |
2.335 |
0.080 |
df = 4,32.
Effects of drug dialysis
Low doses of scopolamine
Scopolamine dialysis was done in two dose ranges. A dialysate concentration of 0.5 mm was considered to be a low dose, whereas concentrations of 2.0 or 3.0 mm were considered to be high doses. Cells recorded during exposure to both high doses were combined for analysis.
An example of how dialysis of 0.5 mm scopolamine affected place-cell firing is shown in Figure 1B. The maps of Figure 1, B1 and B2, are for pre-drug baseline sessions. The spatial firing patterns in these maps strongly resemble each other in terms of the location, size, shape, and intensity of the firing field, as expected given place-cell stability. In contrast, the first two sessions with dialysis of 0.5 mm scopolamine produced decreases of field size and intensity decrease (Fig. 1B3,B4). In the final drug session, the field of this example cell disintegrates (Fig. 1B5).
The values of the five selected place-cell properties are plotted in Figure 3 against session number before and during dialysis of the low scopolamine dose. The mean values for coherence, field size, and in-field rate decrease as dialysis proceeds, whereas out-of-field rate and the out/in rate ratio increase. ANOVAs for the selected properties show that the variations in coherence, in-field rate, and out/in rate ratio are significant (Table 2). Post hoc pairwise tests for coherence with Tukey's honest significant difference (HSD) method reveal that the two baseline sessions and the first drug session are not reliably different from each other but that each of the last two drug sessions is reliably different from the first three sessions. A similar outcome is seen for the out/in ratio increase. In the case of in-field rate where the ANOVA result was marginal, only the first baseline session and the final drug session differ reliably from each other. Overall, the effects of dialysis of 0.5 mm scopolamine resemble the effects of injecting 3.0 μg of scopolamine into each cerebrospinal ventricle, although the magnitude of the dialysis-induced changes are somewhat smaller.
Figure 3.

Plots of average parameters of 11 place cells showing effects of dialysis of a low (0.5 mm) concentration of scopolamine. The reductions in coherence and in-field rate are significant according to ANOVAs, as is the increase in out-rate to in-rate ratio.
Table 1.
ANOVAs for place-cell properties: low scopolamine
|
Property |
F ratio |
Probability |
|---|---|---|
| Coherence | 13.21 | <0.0001 |
| Field size | 1.675 | 0.170 |
| In-field rate | 3.541 | 0.013 |
| Out-of-field rate | 1.355 | 0.263 |
| Out/in-rate ratio |
5.968 |
0.0005 |
df = 4,51.
One presumed advantage of local dialysis is that cells in the vicinity of the probe can be exposed to pharmacological agents without affecting more distant cells or the overall state of the animal. In this way, the behavioral consequences of drug administration can potentially be separated from the neural consequences. In previous work, we showed that intracerebroventricular scopolamine injections had two kinds of effect, namely, weakening of location-specific firing at the cellular level and decreased running speed at the behavioral level (Brazhnik et al., 2003). These effects were dissociable, however. The degradation of location-specific firing was seen even when single-cell analysis was limited to intervals of rapid running.
We therefore asked whether local dialysis of low doses of scopolamine mimicked the behavioral as well as the neural effects of intracerebroventricular administration by calculating running speed and “still time.” Running speed was measured as the total distance covered divided by the 16 min session duration. Still time was measured as the number of 0.5 sec intervals in which the rat stayed in the same pixel, accumulated for an entire session. Figure 4A shows the mean running speed plotted against session number for all drug conditions; Figure 4B is a similar plot for mean still time. For running speed, there is a small decline between the two control sessions and a further small decline during the first drug session. In the last two drug sessions, however, running speed shows a sharp decrease. An ANOVA (Table 3) shows that the overall decline in running speed is significant, and post hoc HSD tests indicate that the last two drug sessions are reliably lower than any of the others but not different from each other. The effect on still time of dialyzing the low scopolamine dose is even stronger. Again, an ANOVA (Table 4) shows an overall significant effect, but according to HSD tests, the still time in each of the three drug sessions is reliably greater than in the control sessions.
Figure 4.

Analysis of locomotor behavior during recordings. A, Plots of running speed as a function of session number for all drug conditions. Only the curves for the low (gray filled circles, solid lines) and high (black filled circles, solid lines) scopolamine show significant variation. In both cases, this is a decline in the running speed during the three drug trials. B, Plots of still time (cumulative 0.5 sec intervals in which the rat is detected in the same pixel) as a function of session number for all drug conditions. Again, it is only the curves for low and high scopolamine concentration that show significant variations. Here, still time increases during the three drug administration trials. Thus, scopolamine reduces locomotor activity, although it is applied to only a small fraction of the hippocampus. Scop, Scopolamine; Methoc, methoctramine; Pirenz, pirenzipine; Met + Pir, methoctramine plus pirenzipine.
Table 3.
ANOVAs for each drug treatment: running speed
|
Drug treatment |
Between df |
Within df |
F ratio |
Probability |
|---|---|---|---|---|
| aCSF | 4 | 30 | 0.687 | 0.606 |
| Low scop | 4 | 30 | 3.948 | 0.011 |
| High scop | 4 | 30 | 6.041 | 0.0011 |
| Methoc | 4 | 23 | 0.0052 | 0.995 |
| Pirenz | 4 | 35 | 0.0062 | 0.993 |
| Met + Pir |
4 |
35 |
0.275 |
0.892 |
scop, Scopolamine; Methoc, methoctramine; Pirenz, pirenzepine; Met + Pir, methoctramine plus pirenzipine.
Table 4.
ANOVAs for each drug treatment: total still time
|
Drug treatment |
Between df |
Within df |
F ratio |
Probability |
|---|---|---|---|---|
| aCSF | 4 | 30 | 1.423 | 0.250 |
| Low scop | 4 | 30 | 5.006 | 0.0033 |
| High scop | 4 | 30 | 7.031 | 0.0004 |
| Methoc | 4 | 23 | 0.235 | 0.916 |
| Pirenz | 4 | 35 | 0.236 | 0.916 |
| Met + Pir |
4 |
35 |
0.682 |
0.609 |
scop, Scopolamine; Methoc, methoctramine; Pirenz, pirenzepine; Met + Pir, methoctramine plus pirenzipine.
The tendency of rats to move more slowly over time could be attributable to fatigue or satiation with food. We checked these possibilities by analyzing running speed and still time during aCSF dialysis. The plots of the mean behavioral quantities (Fig. 4A,B) for aCSF appear rather flat over all five sessions. This impression is confirmed by ANOVAs which show that the F-ratio is far lower than required for significance at the α = 0.05 level (Tables 3, 4). We conclude that dialyzed scopolamine has behavioral effects similar to those produced by intracerebroventricular administration. We consider possible explanations of this result in Discussion.
High doses of scopolamine
Local dialysis of higher doses of scopolamine increase the magnitude of the effects on place cells and behavior compared with low doses, but the overall pattern of effects is similar, as seen in Figure 1C. Plotting coherence, field size, in-field rate, out-of-field rate, and out/in ratio confirms that high scopolamine doses follow but exaggerate the pattern obtained with the lower dose (Fig. 5). ANOVAs (Table 5) reveal that coherence, in-field rate, and out/in ratio are again significant, as is the decrease in field size.
Figure 5.

Plots of average parameters of eight place cells showing effects of dialysis of high (2.0 or 3.0 mm) concentrations of scopolamine. The reductions in coherence, field size, and in-field rate are significant according to ANOVAs, as is the increase in ratio of out-rate to in-rate.
Table 5.
ANOVAs for place-cell properties: high scopolamine
|
Property |
F ratio |
Probability |
|---|---|---|
| Coherence | 18.32 | <0.0001 |
| Field size | 3.363 | 0.0209 |
| In-field rate | 3.651 | 0.0147 |
| Out-of-field rate | 1.134 | 0.358 |
| Out/in-rate ratio |
5.238 |
0.0025 |
df = 4,30.
Post hoc HSD comparisons for coherence during dialysis of high scopolamine doses show that the second baseline session is reliably different from any of the drug sessions and that the first baseline session is different from the last two drug sessions. HSD comparisons for field size show that only the first baseline session and the third drug session differ. For in-field rate and out/in ratio, significant HSD differences were found such that both baseline sessions and the first drug session differed from the last two drug sessions.
In the behavioral realm, we again saw that running speed decreased and still time increased (Fig. 4A,B) during dialysis of high scopolamine concentrations, but the effects on both quantities were greater than at the lower dose. The reliability of the change in each variable is confirmed by ANOVAs (Tables 3, 4).
Methoctramine
Dialysis with 1.0 mm of the m2 plus m4 antagonist methoctramine increases out-of-field firing, as illustrated in the firing rate maps of Figure 1D. The effects of methoctramine on spatial firing properties are summarized in the plots of Figure 6, which reveal that coherence undergoes a progressive decrease and that field size is unchanged. In-field and out-of field rates both show increases during the first methoctramine session. These increases were initially strong but then declined over hours to different extents. Specifically, the reversal of the initial increase is greater for in-field rate, so that it is lower in the final methoctramine session than during the baseline sessions. Out-of-field rate declined progressively from its peak in the first drug session to the last drug session, but it remains much higher than during the baseline sessions. As a result of these out-of-field and in-field rate changes, the out/in ratio is better maintained, although there is some decline in the last drug session.
Figure 6.

Plots of average parameters of six place cells showing effects of dialysis of 1.0 mm methoctramine. Only out-of-field rate and the ratio of out-rate to in-rate showed significant changes. The out-of-field rate increase was initially strong but then declined over hours as was the trend toward a biphasic change of in-field rate. There was also a trend for coherence to monotonically decrease during drug administration.
ANOVAs for the five place-cell properties (Table 6) show that the effects of methoctramine are significant for out-of-field rate and the out/in ratio. HSD assessment of out-of-field rate changes show no pairwise significant differences. For the out/in ratio, the baseline sessions are reliably lower than for the last two drug sessions. It is worth noting that ANOVAs for coherence and in-field firing also show trends toward drug-induced changes (Table 6). Finally, dialysis of 1.0 mm methoctramine has no effect on either running speed or still time (Fig. 4A,B, Tables 3, 4).
Table 6.
ANOVAs for place-cell properties: methoctramine
|
Property |
F ratio |
Probability |
|---|---|---|
| Coherence | 2.182 | 0.102 |
| Field size | 0.031 | 0.998 |
| In-field rate | 2.384 | 0.080 |
| Out-of-field rate | 2.958 | 0.041 |
| Out/in-rate ratio |
7.343 |
0.0006 |
df = 4,24.
Pirenzepine
The m1 muscarinic antagonist pirenzepine has rather weak effects on place cells at a dose of 3.0 mm, as seen in the example rate maps of Figure 1E and in the plots of place-cell properties against session number in Figure 7. Coherence and field size are little affected. There is a very small decrease of in-field firing rate, a somewhat larger increase of out-of-field firing rate, and therefore a more substantial increase of the out/in ratio. According to ANOVAs, the only significant effect during pirenzepine administration is the increase of out/in rate ratio (Table 7). HSD comparisons show that the only pairwise significant difference is between the first baseline session and the last drug session. Pirenzepine causes no discernable changes in either running speed or still time over the entire five session protocol (Fig. 4A,B), a result confirmed with ANOVAs (Tables 3, 4).
Figure 7.

Plots of average parameters of eight place cells showing effects of dialysis of 3.0 mm pirenzepine. Coherence, field size, and in-field rate are hardly affected by pirenzepine dialysis.
Table 7.
ANOVAs for place-cell properties: pirenzepine
|
Property |
F ratio |
Probability |
|---|---|---|
| Coherence | 0.576 | 0.682 |
| Field size | 0.081 | 0.988 |
| In-field rate | 0.767 | 0.555 |
| Out-of-field rate | 2.420 | 0.068 |
| Out/in-rate ratio |
3.955 |
0.0099 |
df = 4,33.
Methoctramine plus pirenzepine
Although pirenzepine and methoctramine dialyzed separately have effects on place-cell firing patterns that are quite different from those of scopolamine, their combination mimics the effects of high doses of scopolamine. In the example of Figure 1F, simultaneous dialysis of 3.0 mm pirenzepine plus 1.0 mm methoctramine cause the firing field near 10 o'clock to initially became somewhat weaker and more dispersed (Fig. 1F3). Continued dialysis (Fig. 1F4) greatly elevates the out-of-field rate, with the result that discharge spread over most of the cylinder. In the final 16 min session with methoctramine plus pirenzepine (Fig. 1F5), activity decreases and there is no sign of the original field.
Plots of positional firing properties for the five recording sessions (Fig. 8) show that coherence, field size, and in-field rate decrease during combined dialysis, whereas out-of-field rate and the out/in rate ratio both increase. ANOVAs for the positional rate properties reveal significant effects for coherence, in-field rate, out-of-field rate, and out/in rate ratio, as summarized in Table 8. Pairwise comparisons made with the HSD method show that coherence does not change for the two baseline sessions but that coherence is reliably higher than for the three drug dialysis sessions. In addition, coherence is higher for the first drug session than for the last. For in-field rate, the baseline sessions are reliably higher than the last two drug sessions. The only significant pairwise difference for out-of-field rate is between the first baseline session and the first drug session. These out-of-field effects of the drug mixture were larger and more consistent than those for the high dose of scopolamine. This suggests that the combination was a more potent “nonspecific” muscarinic blocker than even our “high” dose of scopolamine. The combined effects of pirenzepine and methoctramine on the out/in rate ratio are quite clear cut. Thus, the ratio is significantly lower for the first baseline session than for any of the drug sessions but not lower than for the second baseline session. The second baseline session is significantly lower than only the second drug session.
Figure 8.

Plots of average parameters of 14 place cells showing effects of dialysis of 1.0 mm methoctramine plus 3.0 mm pirenzepine. Coherence, field size, and in-field rate all show progressive decreases during the three drug sessions compared with the control sessions, although the field size decrease is not statistically reliable. Out-of-field rate undergoes a large, statistically significant increase during the first drug session and then diminishes for the final two drug sessions. The ratio of out-rate to in-rate is significantly elevated during the drug sessions relative to the control sessions.
Table 8.
ANOVAs for place-cell properties: methoctramine plus pirenzepine
|
Property |
F ratio |
Probability |
|---|---|---|
| Coherence | 24.17 | <0.0001 |
| Field size | 1.643 | 0.175 |
| In-field rate | 4.570 | 0.0027 |
| Out-of-field rate | 3.067 | 0.0230 |
| Out/in-rate ratio |
9.603 |
<0.0001 |
df = 4,60.
Although the pirenzepine plus methoctramine combination affects place cells in a manner very reminiscent of scopolamine, the effects of the combination and scopolamine on behavior strongly diverge. Thus, neither running speed nor still time show any significant variation during the baseline or dialysis sessions (Fig. 4 A, B, Tables 3, 4).
Comparing the effects of scopolamine with those of more specific muscarinic antagonists
The nonspecific muscarinic blockade caused by scopolamine provides a benchmark against which to contrast the effects of other muscarinic antagonists. We normalized each measure of place-cell activity to its value in the first control session for scopolamine and the contrasting antagonist. To further facilitate comparison, the scale of each graph for a given measure was made the same for the three comparisons (Fig. 9).
Figure 9.

The pattern of scopolamine (Scop) effects on place cells is reproduced by the methoctramine plus pirenzepine (Met + Pir) mixture but not by either drug alone. To facilitate comparisons, the five session values for the high scopolamine dose have been normalized to the value in the first such session. Similarly, the five session values for the relevant drug treatment have been normalized to the value in the first such session. After this process, the data points for the first sessions for scopolamine and for the relevant drug treatment must superimpose at 1.0. To further facilitate comparisons, the scale for all three graphs in each column have been made equal. Top row, Scopolamine versus pirenzepine (Pirenz). The relative effects are arguably similar for in-field rate but differ considerably for all of the other parameters. Middle row, Scopolamine versus methoctramine (Methoc). Although the profiles for coherence and the ratio of out-rate to in-rate are similar for both drugs, the profiles for the other parameters are quite different. Specifically, field size decreases for scopolamine but is unchanged for methoctramine, the effects on in-field rate are biphasic for methoctramine but not for scopolamine, and the magnitude of the normalized increase of out-of-field rate is much greater for methoctramine. Bottom row, Scopolamine versus methoctramine plus pirenzepine. After normalization, the similar session-by-session profiles for scopolamine and the drug mixture are evident for each of the measures of place-cell activity.
By itself, the m1 blocker pirenzepine produces weaker changes in place-cell activity than the high dose of scopolamine, as shown in Figure 9 (top row). Despite the relatively small changes, the trend of the pirenzepine and scopolamine effects are similar for coherence, in-field rate, and the ratio of out-rate to in-rate ratio. On the other hand, the clear decrease of field size induced by scopolamine is not reproduced by pirenzepine. A second major difference is the lack of a peak for out-of-field rate caused by pirenzepine, despite a clear maximum during the first drug session after scopolamine dialysis.
The m2 blocker methoctramine had strong effects on all aspects of location-specific firing except field size. Nevertheless, as shown in Figure 9 (middle row), methoctramine causes a peak of in-field firing that is not observed for scopolamine. Also of note is the considerably greater peak increase in out-of-field firing caused by methoctramine compared with scopolamine.
When viewed with the normalizations in Figure 9, clearly the combination of pirenzepine plus methoctramine mimics with considerable precision the pattern of effects caused by the high scopolamine dose, as seen in Figure 9 (bottom row). Thus, for each of the five measures, the value for the combination is parallel to the value for scopolamine. This is gratifying because it suggests that the same complement of muscarinic receptors has been blocked by scopolamine and combined m1 plus m2,4 antagonists.
Drug effects on theta cells
Theta cells (interneurons) have a very strong tendency to discharge at a rate greater than zero everywhere in small environments (Kubie et al., 1990; Wilson and McNaughton, 1993). For this reason, we abandoned firing fields to describe theta cells and focused on two properties, namely, coherence and overall firing rate. In addition, because formal sessions were done only if place cells were seen, we recorded enough theta cells to warrant analysis only during dialysis of the high scopolamine dose (n = 7) and the methoctramine plus pirenzepine mixture (n = 11).
The effects of the high scopolamine dose on theta cell properties are shown in Figure 10A. There is a trend for coherence to decrease in the last two drug sessions, but an ANOVA (Table 9) indicates that this trend is not very reliable. The high dose of scopolamine had no apparent effect on the overall firing rate of theta cells (Fig. 10A, Table 9).
Figure 10.

Effects of the high dose of scopolamine and of methoctramine plus pirenzepine on the coherence and overall firing rate of theta cells. A, Scopolamine. Left panel, Coherence decreases in the last two drug sessions (sessions 4 and 5), but the effect is not significant across all five sessions. Right panel, Overall firing rate shows no trend during scopolamine dialysis. B, Methoctramine plus pirenzepine. Left panel, The decline of coherence with administration of the drug mixture is highly significant. Right panel, Overall firing rate also shows a significant decrease during treatment with the drug mixture.
Table 9.
ANOVAs for theta cell properties: high scopolamine
|
Property |
F ratio |
Probability |
|---|---|---|
| Coherence | 1.57 | 0.209 |
| Overall rate |
0.22 |
0.924 |
df = 4,28.
In contrast to the small effects of scopolamine, the methoctramine plus pirenzepine mixture produced clear changes in theta cell firing (Fig. 10B). Thus, both coherence and overall rate underwent considerable decreases after dialysis of the drug combination. The reliability of these changes is shown by the ANOVAs in Table 10.
Table 10.
ANOVAs for theta cell properties: methoctramine plus pirenzepine
|
Property |
F ratio |
Probability |
|---|---|---|
| Coherence | 7.63 | <0.0001 |
| Overall rate |
5.83 |
0.0006 |
df = 4,50.
Discussion
To further explore the role of cholinergic muscarinic transmission in spatial firing, a microdialysis probe adjacent to the recording microwires was used to expose CA1 pyramidal cells and interneurons to muscarinic antagonists. In agreement with recordings after intracerebroventricular infusion (Brazhnik et al., 2003), the non-selective muscarinic antagonist scopolamine had a dose-dependent effect of decreasing the coherence and increasing the ratio of out-of-field to in-field firing in the positional firing patterns of hippocampal place cells. More selective muscarinic blockade by methoctramine (mainly an m2 and m4 antagonist) (Waelbroeck et al., 1990) caused a small, initial increase of in-field rate followed by a decrease and a larger initially strong increase in out-of-field firing that declined over hours. Infusion of a second selective blocker, pirenzepine (mainly an m1 antagonist) (Vickroy et al., 1984), caused a small decrease of in-field firing and a small increase of out-of-field firing so that the ratio of out-of-field to in-field firing underwent a significant increase. Simultaneous dialysis of pirenzepine plus methoctramine had an apparent nonlinear interaction such that their combined effects on place cells were quite similar to scopolamine. Running behavior was decreased and slowed by dialysis of scopolamine but not by either of the other antagonists or by their combination.
Pharmacological background
Presently, five muscarinic receptor subtypes (m1-m5) are recognized (Bonner et al., 1988). According to Volpicelli and Levey (2004), the main subtypes in CA1 of the rat hippocampus are m1 (36%), m2 (33%), and m4 (27%). m1 receptors are postsynaptic on the cell bodies and dendrites of pyramidal cells, whereas m2 and m4 receptors are presynaptic on axon terminals that contact pyramidal cells. Terminals with muscarinic receptors include cholinergic and glutamatergic endings. The distribution of subtypes on interneurons is more complex and may be specific for different interneuron classes (Rouse et al., 1999).
Interpreting changes in single-cell activity is complicated by the multiple effects of activating muscarinic receptors and by the relatively low specificity of available antagonists for the subtypes. In this paper we take methoctramine to be an antagonist of m2 and m4 receptor-mediated transmission and pirenzepine to be an m1 antagonist (Waelbroeck et al., 1990). It is nevertheless clear that methoctramine, for instance, blocks m1 receptors at higher concentrations (Melchiorre et al., 1995).
Accounting for the effects of different blockers
The nonselective antagonist scopolamine may be taken as a standard against which to compare the effects of other muscarinic blockers. In the concentration range that we used, scopolamine dialysis slowed the discharge of place cells and reduced the organization of their positional firing patterns. These effects are very similar to scopolamine action after intracerebroventricular injection (Brazhnik et al., 2003). Our current results therefore reinforce the idea that muscarinic transmission serves to sharpen and enhance location-specific firing because nonspecific blockade imitates the natural attenuation of the spatial signal seen when the hippocampal EEG is in a non-theta state and acetylcholine release is diminished (Kubie et al., 1985).
The ability of methoctramine alone to strongly increase in-field and especially out-of-field firing, followed by a decline over hours, can be explained from its ability to block presynaptic m2 and m4 receptors. Initially the presynaptic receptor blockade would increase the release of glutamate onto pyramidal cells (Valentine and Dingledine, 1981; Segal, 1989; Sheridan and Sutor, 1990). Because there is selectivity of cholinergic enhancement of glutamate release from the proximal afferents to pyramidal cells (Hasselmo and Schnell, 1994), the out-of-field firing should be particularly enhanced as a result of increased cross talk between place cells via Schaffer collaterals and commissural connections. On the other hand, there should be little or no enhancement of glutamate release directly from the entorhinal cortex afferents carrying the location-specific information driving in-field firing. The blockade of presynaptic muscarinic receptors would also initially increase the release of acetylcholine onto pyramidal cells (Nordstrom and Bartfai, 1980). Increased acetylcholine acting on unblocked postsynaptic m1 receptors would tend to increase pyramidal cell excitability, decreasing potassium currents and thereby increasing input resistance, reducing post-spike hyperpolarization, and reducing spike frequency adaptation (Ben-Ari et al., 1981; Benardo and Prince, 1982; Cole and Nicoll, 1984; Oh et al., 1999). This increased pyramidal cell excitability resulting from enhanced acetylcholine release would act synergistically with increased glutamate binding to proximal glutamate receptors, further increasing out-of-field rate, but would also lead to an increase in the effectiveness of distal glutamate receptors, leading to increased in-field firing as well. The decline of the methoctramine effect over hours might be caused by depletion of transmitter available for release.
The effects of dialyzing 3.0 mm pirenzepine alone resemble those of scopolamine, although at the concentrations used, pirenzepine caused considerably smaller changes. Thus, there were trends toward reduced coherence, reduced in-field firing, and increased out-of-field firing. The trend for an increase in out-of-field firing after pirenzepine was only about twice that for aCSF, suggesting that the statistically reliable increase of the out/in ratio resulted to a large extent from decreased in-field firing. Thus, it appears that a major effect of m1 blockade alone is a decrease in in-field firing rate. This overall pattern for pirenzepine could be a consequence of a partial blockade of m1 receptors caused by use of a relatively low dose. This is rendered less attractive, however, because the same dose combined with methoctramine caused a strong modulation of the methoctramine effect.
Dialysis of 1.0 mm methoctramine plus 3.0 mm pirenzepine closely reproduced the effects of the high scopolamine dose. It was as if interaction of the two drugs attenuated the effects of methoctramine and enhanced the effects of pirenzepine. The smaller elevation of out-of-field firing compared with methoctramine alone could be attributable to lowered cell excitability caused by concurrent m1 blockade. The decline in the effect on out-of-field firing of both the drug mixture and scopolamine over hours may directly reflect transmitter depletion caused by early excess release. Such transmitter depletion may also contribute to the late effects on in-field firing. We tentatively ascribe the larger effect of the combination (compared with pirezepine) to this, plus low-affinity binding of methoctramine to m1 receptors and a resulting synergistic antagonism of m1-based transmission.
In summary, the effects of scopolamine on place cells are likely caused by simultaneous blockade of postsynaptic m1 receptors, which leads to reduced pyramidal cell excitability, combined with blockade of presynaptic m2 and m4 receptors, which leads to an increase in out-of-field firing. This simplified explanation neglects the contributions of interneurons but is in agreement with the affinity of scopolamine for all muscarinic receptors.
Behavioral effects of muscarinic blockade
The ability of locally dialyzed scopolamine to reduce running speed and increase still time is very surprising, given the restricted region of drug action. Before this result, it was imagined that dialysis of drugs into only a small part of the hippocampus would not affect behavior, thereby eliminating changes in behavior as factors in interpreting results. It is now clear, however, that dialysis can induce behavioral changes, making it necessary to monitor the overall state of the animal.
The behavioral changes produced by dialyzed scopolamine, but not the other drugs, may be a result of greater spread from the application site. This spread could be within brain, thus mimicking intracerebroventricular application, but work with radiolabeled cAMP indicates a restricted distribution near the dialysis probe (Ludvig, 2001). More likely, greater spread would occur outside brain because scopolamine is less polar relative to the other drugs, allowing it to pass out through the blood-brain barrier to block peripheral muscarinic receptors.
Are the observed locomotor effects key factors for the single-cell changes? In a previous study, we found that intracerebroventricular scopolamine injections decreased running speed and increased still time (Brazhnik et al., 2003). We saw, however, that confining analysis of single-cell discharge to intervals of rapid movement did not eliminate the degradation of place-cell discharges after scopolamine injection. This analysis had the same outcome after scopolamine dialysis: scopolamine effects are seen even if place-cell analysis is restricted to when the rat is moving rapidly. In addition, place-cell firing was strongly affected in a single rat that did not show the behavioral effect of scopolamine microdialysis. Nevertheless, this “behavior clamping” is not foolproof. In focusing on locomotor behavior, we may not have reduced variance in some other more crucial aspect of behavior.
In addition to locomotor effects, muscarinic antagonists modify spatial learning and memory. For instance, scopolamine impairs acquisition of the hidden goal version of the Morris water maze (Saucier et al., 1996). In a study quite parallel to ours, scopolamine and pirenzepine impaired performance in delayed non-match to position task, whereas methoctramine caused a small improvement (Aura et al., 1997). A similar improvement after injection of an m2 antagonist was seen by Packard et al. (1990).
Based on the noise-like increase in out-of-field place-cell activity caused by methoctramine seen here, we would predict an impairment in the water maze. To the contrary, injection of methoctramine into the dorsal striatum improves water maze performance in aged rats, possibly because of enhanced acetylcholine release (Lazaris et al., 2003). A similar result after injection of methoctramine into the hippocampus would force a reevaluation of the signaling produced by place cells.
Summary
Dialysis appears to be a viable method of modifying the local chemical environment of neurons. The anatomic specificity of dialysis is not as precise as is possible with genetic methods (Tsien et al., 1996). Moreover, diffusion gradients make it hard to be sure of the drug concentration to which the cells are exposed. Indeed, the relatively wide spread of pyramidal-cell dendritic trees ensures that drug effects are not likely to be homogeneous, even on single cells. On the positive side, the ability to rapidly change the composition of the dialysate, the proximity of the recorded cells to the drug source, and the rapid kinetics of drug binding yield good temporal resolution. The use of dialysis therefore involves a tradeoff of spatial resolution for temporal resolution.
Subtype-specific anti-muscarinic drugs applied locally suggest that muscarinic transmission affects place-cell activity via a combination of presynaptic and postsynaptic receptors. The total effect of muscarinic transmission is to sharpen the location-specific discharge of place cells during theta and therefore during locomotion, when such sharpening is most important for the animal to determine and predict its location.
Footnotes
This work was supported by National Institutes of Health Grants NS17095 (S.E.F.) and NS20686 (R.U.M.) and a Medical Research Council Overseas Initiative grant (R.U.M.). Nandor Ludvig deserves a great deal of the credit for this work. He initiated the combined method of infusing drugs by microdialysis while recording from single cells and did extensive pilot work that tested the effects of scopolamine on place cells (Fox et al., 1996).
Correspondence should be addressed to Dr. Steven E. Fox, Department of Physiology and Pharmacology, State University of New York Downstate Medical Center, 450 Clarkson Avenue, Brooklyn, NY 11203. E-mail: steve@theta.hippo.hscbklyn.edu.
Copyright © 2004 Society for Neuroscience 0270-6474/04/249313-11$15.00/0
References
- Aura J, Sirviö J, Riekkinen Jr P (1997) Methoctramine moderately improves memory but pirenzepine disrupts performance in delayed non-matching to position test. Eur J Pharmacol 333: 129-134. [DOI] [PubMed] [Google Scholar]
- Benardo LS, Prince DA (1982) Cholinergic excitation of mammalian hippocampal pyramidal cells. Brain Res 249: 315-331. [DOI] [PubMed] [Google Scholar]
- Ben-Ari Y, Krnjevic K, Reinhardt W, Ropert N (1981) Intracellular observations on the disinhibitory action of acetylcholine in the hippocampus. Neuroscience 6: 2475-2484. [DOI] [PubMed] [Google Scholar]
- Bonner TI, Young AC, Brann MR, Buckley NJ (1988) Cloning and expression of the human and rat m5 muscarinic acetylcholine receptor genes. Neuron 1: 403-410. [DOI] [PubMed] [Google Scholar]
- Brazhnik ES, Muller RU, Fox SE (2003) Muscarinic blockade slows and degrades the location-specific firing of hippocampal pyramidal cells. J Neurosci 23: 611-621. [DOI] [PMC free article] [PubMed] [Google Scholar]
- Cole AE, Nicoll RA (1984) The pharmacology of cholinergic excitatory responses in hippocampal pyramidal cells. Brain Res 305: 283-290. [DOI] [PubMed] [Google Scholar]
- Dutar P, Nicoll RA (1988) Classification of muscarinic responses in hippocampus in terms of receptor subtypes and second messenger systems: electrophysiological studies in vitro J Neurosci 8: 4214-4224. [DOI] [PMC free article] [PubMed] [Google Scholar]
- Fox SE, Ranck Jr JB (1975) Localization and anatomical identification of theta and complex-spike cells in dorsal hippocampal formation of rats. Exp Neurol 49: 299-313. [DOI] [PubMed] [Google Scholar]
- Fox SE, Ranck Jr JB (1981) Electrophysiological characteristics of hippocampal complex-spike cells and theta cells. Exp Brain Res 41: 399-410. [DOI] [PubMed] [Google Scholar]
- Fox SE, Ludvig N, Kubie JL, Muller RU, Stead M, Fenton A (1996) The effects of scopolamine, delivered via intrahippocampal microdialysis, on the firing of local place cells. Soc Neurosci Abstr 22: 431. [Google Scholar]
- Hasselmo ME, Schnell E (1994) Laminar selectivity of the cholinergic suppression of synaptic transmission in rat hippocampal region CA1: computational modeling and brain slice physiology. J Neurosci 14: 3898-3914. [DOI] [PMC free article] [PubMed] [Google Scholar]
- Ikonen S, McMahan R, Gallagher M, Eichenbaum H, Tanila H (2002) Cholinergic system regulation of spatial representation by the hippocampus. Hippocampus 12: 386-397. [DOI] [PubMed] [Google Scholar]
- Kentros C, Hargreaves E, Hawkins RD, Kandel ER, Shapiro M, Muller RV (1998) Abolition of long-term stability of new hippocampal place cell maps by NMDA receptor blockade. Science 280: 2121-2126. [DOI] [PubMed] [Google Scholar]
- Kitaichi K, Hori T, Srivastava LK, Quirion R (1999) Antisense oligodeoxynucleotides against the m2, but not m4, receptor supports its role as autoreceptors in the rat hippocampus. Brain Res Mol Brain Res 67: 98-106. [DOI] [PubMed] [Google Scholar]
- Kramis R, Vanderwolf CH, Bland BH (1975) Two types of hippocampal rhythmical slow activity in both the rabbit and the rat: relations to behavior and effects of atropine, diethyl ether, urethane, and pentobarbital. Exp Neurol 49: 58-85. [DOI] [PubMed] [Google Scholar]
- Kubie JL (1984) A drivable bundle of microwires for collecting single-unit data from freely-moving rats. Physiol Behav 32: 115-118. [DOI] [PubMed] [Google Scholar]
- Kubie JL, Muller RU, Fox SE (1985) Firing fields of hippocampal place cells: Interim report. In: Electrical activity of the archicortex (Buzsaki G, Vanderwolf CH, eds), pp 221-231. Budapest: Hungarian Academy of Sciences.
- Kubie JL, Muller RU, Bostock E (1990) Spatial firing properties of hippocampal theta cells. J Neurophysiol 10: 1110-1123. [DOI] [PMC free article] [PubMed] [Google Scholar]
- Lazaris A, Cassel S, Stemmelin J, Cassel JC, Kelche C (2003) Intrastriatal infusions of methoctramine improve memory in cognitively impaired aged rats. Neurobiol Aging 24: 379-383. [DOI] [PubMed] [Google Scholar]
- Ludvig N (2001) Drug deliveries into the microenvironment of electrophysiologically monitored neurons in the brain of behaving rats and monkeys. In: Neural prostheses for restoration of sensory and motor function (Chapin JK, Moxon KA, eds), pp 263-283. Boca Raton, FL: CRC.
- Ludvig N, Potter PE, Fox SE (1994) Simultaneous single cell recording and microdialysis within the same brain site in freely behaving rats: a novel neurobiological method. J Neurosci Methods 55: 31-40. [DOI] [PubMed] [Google Scholar]
- Ludvig N, Chao K, Altura BT, Altura BM, Fox SE (1996) Manipulation of pyramidal cell firing in the hippocampus of freely behaving rats by local application of K+ via microdialysis. Hippocampus 6: 97-108. [DOI] [PubMed] [Google Scholar]
- Ludvig N, Magnia AG, Tang HM, Gonzales RA, Bungay PM (2001) Evidence for the ability of hippocampal neurons to develop acute tolerance to ethanol in behaving rats. Brain Res 900: 252-260. [DOI] [PubMed] [Google Scholar]
- Marchi M, Raiteri M (1989) Interaction of acetylcholine-glutamate in rat hippocampus: involvement of two subtypes of M2 muscarinic receptors. J Pharmacol Exp Ther 248: 1255-1260. [PubMed] [Google Scholar]
- Melchiorre C, Minarini A, Budriesi R, Chiarini A, Spaminato S, Tumiatti V (1995) The design of novel methoctramine-related tetraamines as muscarinic receptor subtype selective antagonists. Life Sci 56: 837-844. [DOI] [PubMed] [Google Scholar]
- Muller RU, Kubie JL, Ranck Jr JB (1987) Spatial firing pattern of hippocampal complex-spike cells in an fixed environment. J Neurosci 7: 1935-1950. [DOI] [PMC free article] [PubMed] [Google Scholar]
- Muller RU, Bostock E, Taube JS, Kubie JL (1994) On the directional firing properties of hippocampal place cells. J Neurosci 14: 7235-7251. [DOI] [PMC free article] [PubMed] [Google Scholar]
- Nordstrom O, Bartfai T (1980) Muscarinic autoreceptor regulates acetylcholine release in rat hippocampus: in vitro evidence. Acta Physiol Scand 108: 347-353. [DOI] [PubMed] [Google Scholar]
- Oh MM, Power JM, Thompson LT, Moriearty PL, Disterhoft JF (1999) Metrifonate increases neuronal excitability in CA1 pyramidal neurons from both young and aging rabbit hippocampus. J Neurosci 19: 1814-1823. [DOI] [PMC free article] [PubMed] [Google Scholar]
- Packard MG, Regenold W, Quirion R, White NM (1990) Post-training injection of the acetylcholine M2 receptor antagonist AF-DX 116 improves memory. Brain Res 524: 72-76. [DOI] [PubMed] [Google Scholar]
- Ranck Jr JB (1973) Studies on single neurons in dorsal hippocampal formation and septum in unrestrained rats, Part 1. Behavioral correlates and firing repertoires. Exp Neurol 41: 461-555. [DOI] [PubMed] [Google Scholar]
- Rogers JL, Kesner RP (2004) Cholinergic modulation of the hippocampus during encoding and retrieval of tone/shock-induced fear conditioning. Learn Mem 11: 102-107. [DOI] [PMC free article] [PubMed] [Google Scholar]
- Rouse ST, Marino MJ, Potter LT, Conn PJ, Levey AI (1999) Muscarinic receptor subtypes involved in hippocampal circuits. Life Sci 64: 501-509. [DOI] [PubMed] [Google Scholar]
- Saucier D, Hargreaves EL, Boon F, Vanderwolf CH, Cain DP (1996) Detailed behavioral analysis of water maze acquisition under systemic NMDA or muscarinic antagonism: nonspatial pretraining eliminates spatial learning deficits. Behav Neurosci 110: 103-116. [PubMed] [Google Scholar]
- Segal M (1989) Presynaptic cholinergic inhibition in hippocampal culture. Synapse 4: 305-312. [DOI] [PubMed] [Google Scholar]
- Sheridan RD, Sutor B (1990) Presynaptic M1 muscarinic cholinoreceptors mediate inhibition of excitatory synaptic transmission in the hippocampus in vitro. Neurosci Lett 108: 273-278. [DOI] [PubMed] [Google Scholar]
- Stillman MJ, Shukitt-Hale B, Galli RL, Levy A, Lieberman HR (1996) Effects of M2 antagonists on in vivo hippocampal acetylcholine levels. Brain Res Bull 41: 221-226. [DOI] [PubMed] [Google Scholar]
- Tsien JZ, Chen DF, Gerber D, Tom C, Mercer EH, Anderson DJ, Mayford M, Kandel ER, Tonegawa S (1996) Subregion- and cell type-restricted gene knockout in mouse brain. Cell 87: 1317-1326. [DOI] [PubMed] [Google Scholar]
- Valentine RJ, Dingledine R (1981) Presynaptic inhibitory effect of acetylcholine in the hippocampus. J Neurosci 1: 784-792. [DOI] [PMC free article] [PubMed] [Google Scholar]
- van der Zee EA, Luiten PG (1999) Muscarinic acetylcholine receptors in the hippocampus, neocortex and amygdala: a review of immunocytochemical localization in relation to learning and memory. Prog Neurobiol 58: 409-471. [DOI] [PubMed] [Google Scholar]
- Vickroy TW, Watson M, Yamamura HI, Roeske WR (1984) Agonist binding to multiple muscarinic receptors. Fed Proc 43: 2785-2790. [PubMed] [Google Scholar]
- Volpicelli LA, Levey AI (2004) Muscarinic acetylcholine receptor subtypes in cerebral cortex and hippocampus. Prog Brain Res 145: 59-66. [DOI] [PubMed] [Google Scholar]
- Waelbroeck M, Tastenoy M, Camus J, Christophe J (1990) Binding of selective antagonists to four muscarinic receptors (M1 to M4) in rat forebrain. Mol Pharmacol 38: 267-273. [PubMed] [Google Scholar]
- Wallenstein GV, Vago DR (2001) Intrahippocampal scopolamine impairs both acquisition and consolidation of contextual fear conditioning. Neurobiol Learn Mem 75: 245-252. [DOI] [PubMed] [Google Scholar]
- Wilson MA, McNaughton BL (1993) Dynamics of the hippocampal ensemble code for space. Science 261: 1055-1058. [DOI] [PubMed] [Google Scholar]