

Abstract
Eysenck (1981) proposed that the personality dimension of introversion- extraversion (E) reflects individual differences in a cortical arousal system modulated by reticulothalamic- cortical pathways: it is chronically more active in introverts relative to extraverts and influences cognitive performance in interaction with task parameters. A circuit with connections to this system, including the dorsolateral prefrontal cortex (DLPFC) and anterior cingulate (AC) cortex, has been identified in studies applying functional magnetic resonance imaging (fMRI) to a broad range of cognitive tasks. We examined the influence of E, assessed with the Eysenck Personality Questionnaire-Revised (Eysenck and Eysenck, 1991), in fMRI activity during an “n-back” task involving four memory loads (0-, 1-, 2-, and 3-back) and a rest condition in healthy men. To confirm the specificity of E effects, we also examined the effects of neuroticism and psychoticism (P) scores. We observed that, as predicted by Eysenck's model, the higher the E score, the greater the change in fMRI signal from rest to the 3-back condition in the DLPFC and AC. In addition, E scores were negatively associated with resting fMRI signals in the thalamus and Broca's area extending to Wernicke's area, supporting the hypothesized (negative) relationship between E and resting arousal. P scores negatively correlated with resting fMRI signal in the globus pallidus-putamen, extending previous findings of a negative relationship of schizotypy to striatal activity seen with older neuroimaging modalities to fMRI. These observations suggest that individual differences affect brain responses during cognitive activity and at rest and provide evidence for the hypothesized neurobiological basis of personality.
Keywords: arousal, thalamus, frontal, cognitive activity, fMRI, personality
Introduction
Eysenck's model of personality (Eysenck, 1967) proposes that introverts have lower response thresholds and are consequently cortically more aroused than extraverts. It postulates further an inverted U-shaped relationship between cognitive performance and “level of arousal,” jointly determined by environmental arousal potential (defined in terms of a range of environmental manipulations and task parameters) and subject arousability reflected in questionnaire-measured extraversion (E) scores. These postulates jointly predict that, at low environmental arousal potential, introverts (low E scorers) should outperform extraverts (high E scorers); as environmental arousal increases, performance should improve and extraverts should catch up with introverts, and, at high levels of environmental arousal, performance of introverts should decline and extraverts should outperform introverts until the level of arousal is high enough to evoke transmarginal inhibition (TMI) (Gray, 1964; Eysenck, 1994). With evocation of TMI, introverts may experience lower increments in arousal than extraverts. These predictions are widely supported by data from a range of cognitive paradigms (Eysenck, 1981). At the neural level, Eysenck's model postulates that the level of arousal (jointly determined by environmental arousal and subject arousability) is mediated by activity in a “cortical arousal system” modulated by reticulothalamic- cortical pathways (Eysenck, 1967, 1981).
We examined the association between E, as assessed with the Eysenck Personality Questionnaire-Revised (EPQ-R) (Eysenck and Eysenck, 1991), and brain activity during an “n-back” task with four cognitive loads and a rest condition. The n-back task activates a network of frontal [particularly the dorsolateral prefrontal cortex (DLPFC) and anterior cingulate (AC)] and parietal regions (Smith and Jonides, 1997). The DLPFC is considered specialized for noting task-relevant contents of memory (MacDonald et al., 2000), anterior cingulate for on-line monitoring, error detection, and response execution (Botvinick et al., 2001), and the parietal cortex for short-term storage (Gathercole, 1994). Of particular relevance is that DLPFC and AC may modulate cortical arousal via their connections to the midline thalamic (Barbas et al., 1991) and brainstem monoamine nuclei (Crino et al., 1993). The prefrontal cortex may be particularly sensitive to E-related influences (Lieberman, 2000), because the pontine reticular nucleus projects to this region. A positive association of E with central executive efficiency (prefrontal cortex), but not storage (parietal cortex), supports this suggestion (Lieberman and Rosenthal, 2001). Finally, the AC and DLPFC are activated by a range of cognitive tasks pointing to their prominent role in cognitive processing (Duncan and Owen, 2000), presumably impacting the same cortical arousal system theorized by Eysenck (1967, 1981) to be associated with E.
In the present experiment, we observed no differences in behavioral performance as a function of E. Performance equivalence between introverts and extraverts implies that the latter increase subject arousal to a greater extent than the former from conditions of low to high environmental arousal. This, in theory, would require extraverts to mobilize more cortical resources than introverts (who should have a relatively higher level of resting cortical arousal). Assuming that activity in DLPFC and AC reflects subjects' performance-related cognitive arousal level, we predicted that, the greater the E score, the greater the increase from resting levels.
Materials and Methods
Subjects
As part of our functional magnetic resonance imaging (fMRI) study of the cognitive effects of nicotine (fully described previously by Kumari et al., 2003), 11 medically screened, nonsmoking, right-handed healthy men, free from past or current drug abuse, completed the EPQ-R (Eysenck and Eysenck, 1991) within 1 week of the scanning session, measuring E, neuroticism (N), and psychoticism (P): mean ± SD age, 25.4 ± 1.2 years (range, 21-28 years); E, 13.36 ± 5.46 (range, 4-21 years); N, 6.63 ± 5.08 (range, 1-18 years); p = 6.64 ± 3.88 (range, 2-13 years). Norms reported by Eysenck and Eysenck (1991) for men of this age range were as follows: E, 14.50; N, 11.08; and P, 8.65.
All subjects had been in the scanner at least once previously as part of another neuroimaging study: this inclusion criterion was used to reduce confounds resulting from interactions between personality and novelty. The use of a single-session laboratory experiment limits the scope for identifying stable differences associated with E (Gale and Baker, 1981), because the first visit to a laboratory produces higher-than-average levels of arousal, with a decline over repeated visits to the laboratory in extraverts but not in introverts (Davis and Cowles, 1988).
Experimental paradigm
Methods. The parametric n-back task involved both spatial and verbal aspects of working memory. Via a prismatic mirror, subjects monitored the occurrence on a screen of the numerals 2, 4, 6, or 8 (duration, 400 msec; interstimulus interval, 1350 msec) presented in a random sequence, each at a particular location (always the same for a given numeral) within a diamond-shaped box. On each trial, they pressed one of four buttons to indicate the location of the numeral seen then (0-back) or one, two, or three trials previously (1-, 2-, and 3-back). Thus, including “rest” (no stimuli), there were five conditions in total, and each one was presented five times in 30 sec blocks (including a 3750 msec delay at the beginning of each active block to allow subjects to notice a change in task condition), ordered pseudorandomly, and controlled for order effects, with 15 stimuli in each active block. The current response requirement for a block was indicated by one of the following displayed at the bottom of the screen: Rest, 0-back, 1-back, 2-back, or 3-back. Accuracy and reaction time (RT) were determined on each trial by a button press (right thumb). Subjects were tested twice at a 2 week interval, after subcutaneous injection of 12 μg/kg nicotine or saline, double blind and counter-balanced for order across subjects. The data reported here concern only the saline sessions. The order of nicotine versus saline sessions had no influence on either behavioral or fMRI data. There were significant effects of memory load (i.e., n-back condition) on both RT and response accuracy (Kumari et al., 2003).
MRI data acquisition. Echoplanar MR brain images were acquired using a 1.5 T GE Signa system (General Electric, Milwaukee, WI) at the Maudsley Hospital (London, UK). A quadrature birdcage head coil was used for radio frequency transmission and reception. In each of 16 near-axial noncontiguous planes parallel to the intercommissural (anterior commissure-posterior commissure) plane, 250 T2⋆-weighted MR images depicting blood oxygen level-dependent (BOLD) contrast were acquired over the 12.5 min experiment with echo time (TE) of 40 msec, repetition time (TR) of 3 sec, in-plane resolution of 3.1 mm, slice thickness of 7.0 mm, and interslice gap of 0.7 mm. Head movement was limited by foam padding within the head coil and a restraining band across the forehead. In the same session, a high-resolution three-dimensional inversion recovery prepared spoiled gradient recalled echo volume dataset was acquired in the anterior commissure-posterior commissure plane with a TE of 5.3 msec, inversion time of 300 msec, TR of 12.2 sec, in-plane resolution of 0.94 mm, and slice thickness of 1.5 mm. For each subject, the 250 volume functional time series was motion corrected, transformed into stereotactic space, spatially smoothed with a 10 mm full-width at half-maximum Gaussian filter, and bandpass filtered using statistical parametric mapping (SPM) software (SPM99; http://www.fil.ion.ucl.ac.uk/spm).
Statistical procedures. The intercorrelations of E, N, and P dimensions were examined using correlational analyses (Pearson's r). To ensure that E was associated specifically with activity in the hypothesized brain regions and not with task-related activations in general, its relationship to all regions activated by the task was examined. These regions of interest (ROIs) displaying memory load-related activation were defined from the group maps using a random effects procedure and a parametric model consisting of one covariate with four levels (0-, 1-, 2-, and 3-back) and with rest as the implicit baseline. The network of areas thus identified (Kumari et al., 2003) as linearly related to load included the AC, right DLPFC, bilateral superior frontal gyrus, right superior parietal lobule (all activations significant at p < 0.05, corrected for multiple comparisons at the cluster level; cluster-level correction relates to the probability of finding a given number of adjoining activated voxels by chance) (Friston et al., 1996). Also included in our ROIs were the homologous DLPFC in the left hemisphere and in both the left and right thalamus (all significant at p < 0.0001; uncorrected), given their hypothesized participation in the cortical arousal system underlying E (see Introduction). The functional time series (after discarding the first two scans of each block) from each ROI were extracted for additional analysis using SPSS version 10 (SPSS, Chicago, IL). Following a previous report (Callicott et al., 1999), we also examined whether there were regions that showed a quadratic pattern of fMRI activity over memory loads (so that the activity peaked during the 1- or 2-back and then declined for the 3-back), but no regions were identified showing such a pattern over the group as a whole.
The influence of personality in load-related activations was examined by multiple regression using individual E scores. To test the specificity of the relationship of E to activity in hypothesized regions, two other personality dimensions measured with the EPQ-R, namely N and P, were also entered into the regression model. The multiple regression model was stepwise with probability to enter set at 0.05 and E, N, and P scores as predictors of increase in activity from rest to each of the 0-, 1-, 2-, and 3-back conditions; significant effects were confirmed with additional models (enter method) controlling P and N and response accuracy and latency at the relevant load. This was followed by additional examination of the influence of E on load-related activations in the DLPFC and AC (other regions showed no relationship with E; see Results) with ANOVA after dividing the sample into high and low E subgroups. In the ANOVA, region (right DLPFC and AC) and load (change in activation from rest to each of 0-, 1-, 2-, and 3-back) were within-subject factors, and levels of E (high, E ≥ 17, n = 4; low, E ≤ 9, n = 4; three subjects, E = 11-16, excluded) were between-subject factors.
The influence of E on the resting fMRI signal intensity (an indirect measure of resting brain activity) was examined within the limitations of fMRI (i.e., fMRI does not provide absolute quantitative data, and the intensity at each voxel depends on a number of scanner-related, nonphysiological factors). The approach we used was to collapse the scans acquired during the five blocks of the resting condition for each subject to form a mean image, adjusting for any scanner-related drifts in signal over the duration of the experiment. The mean images from each subject were then normalized for global signal intensity (the mean signal intensity of each brain voxel) to the same value, thus removing any session or subject scanner-related effects. Personality scores were then regressed on rest images within SPM in separate models for E, N, and P to identify the regions of negative or positive correlation significant at p < 0.05 (corrected at the cluster level). This analysis is not able to detect any global variations in MR signal related to personality variables (e.g., if high E subjects have a lower MR signal intensity across the whole brain), because the mean signal intensity of the images is scaled to an arbitrary value. However, the analysis can be used to detect personality-related variations in signal intensity in localized brain regions. Alpha level for all analysis conducted within SPSS was kept at p = 0.05 unless indicated otherwise.
Results
Intercorrelations of E, N, and P suggested a modest yet nonsignificant relationship of E to P (r = 0.41; p = 0.21) and N (r = 0.32; p = 0.34) but no relationship between P and N (r = 0.04; p = 0.90). Mean ± SD response accuracy across all subjects was as follows: 0-back, 94.42 ± 9.86%; 1-back, 88.96 ± 13.53%; 2-back, 84.76 ± 19.56%; and 3-back, 45.30 ± 15.91%. Mean ± SD response latency across all subjects was as follows (in msec): 0-back, 190.05 ± 74.68; 1-back, 92.84 ± 95.03; 2-back, 113.35 ± 142.20; and 3-back, 147.37 ± 166.72. The level of performance shown by our subjects was very comparable at the 2-back with that reported in a recent study of normal healthy subjects, using a task similar to ours (Glabus et al., 2003) (accuracy, 83 ± 14.30%; 3-back condition not used) and at the 3-back condition, on average, was above chance level (which was equal to 25%). E, N, or P scores were not significantly associated with response accuracy or latency at any load (p > 0.20 for all tests), except for a marginally significant negative association between N and response accuracy at the 1-back level (r = -0.595; p = 0.054).
Cognitive activations: effects of E
None of the analyses revealed associations between E and load-related activations in regions other than right DLPFC and AC (see below) or between N or P scores and load-related activation in any region.
Increasing E predicted increasing activity from rest to the 3-back condition in right DLPFC [(44, 34, 26) (x, y, z); F(1,9) = 10.26, p = 0.01; adjusted R2 = 0.48; β = 0.73, p = 0.01 (Fig. 1a); β = 0.63, p = 0.05 after controlling for P and N; β = 0.64, p = 0.04 after controlling for response accuracy and latency at the 3-back] and AC [(-6, 20, 38); F(1,9) = 8.02, p = 0.02; adjusted R2 = 0.41, β = 0.69, p < 0.02 (Fig. 1b); β = 0.85, p = 0.02 after controlling for P and N; β = 0.77, p = 0.03 after controlling for response accuracy and latency at the 3-back]. For AC, but not DLPFC, E also predicted increased activity from rest to 1-back (F(1,9) = 7.82, p = 0.02; adjusted R2 = 0.41, β = 0.68, p = 0.02; β = 0.55, p = 0.10 after controlling for P and N; β = 0.60, p = 0.06 after controlling for response accuracy and latency at the 1-back) and to 2-back (F(1,9) = 6.06, p = 0.04; adjusted R2 = 0.40, β = 0.63, p = 0.04; β = 0.57, p = 0.11 after controlling for P and N; β = 0.62, p = 0.05 after controlling for response accuracy and latency at the 2-back). These results demonstrate that, in both AC and DLPFC, E strongly determined the change from rest to the most cognitively demanding 3-back condition but did not significantly relate to the degree of change from rest to the least demanding 0-back condition (Fig. 1a,b). These data can be taken to suggest a dose-response relationship between task-induced fMRI activity and E, although the difference between the slopes for the relationship of E to change from rest to 3-back and for the change from rest to 0-, 1-, or 2-back conditions failed to attain a conventional level of significance when tested formally using Fisher's exact z tests. In the ANOVA analysis, right DLPFC and AC were similarly modulated by E (load, F(3,18) = 25.92, p = 0.001; E, F(1,6) = 8.34, p = 0.03; E × linear component of load, F(1,6) = 5.70, p = 0.05; no main or interactive effects involving region): high E subjects showed a greater fMRI signal change from rest to 3-back through 0-, 1-, and 2-back conditions (Fig. 1c,d) than low E subjects, who did not show an increase in brain activity during the low cognitive load, 0-back condition relative to rest, implying relatively higher brain activity during the rest condition itself and thus an overall lower increase with cognitive load conditions. The differential increase in response in AC and right DLPFC, but not in the parietal lobe, as a function of E scores in three representative subjects is illustrated in Figure 1e.
Figure 1.
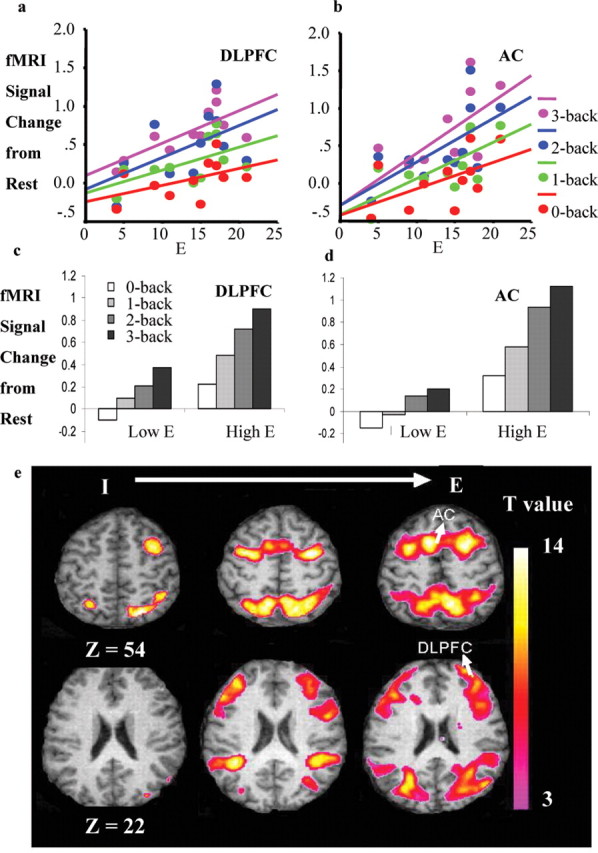
Increase in activity from rest to 0-, 1-, 2-, and 3-back in right DLPFC (a) and AC (b) as a function of individual E score. Memory load-related fMRI signal changes (increases from rest) in right DLPFC (c) and AC (d) in groups with high (≥17) and low (≤9) E scores. e, Activation, thresholded at p < 0.001 (uncorrected), in three individual subjects with E scores of 4 (left), 15 (middle), and 21 (right), superimposed on their own individual structural images. I, Introversion. Color bar shows SPM-derived T values. Task load-related activity in the DLPFC and AC, but not in superior parietal cortex, varied systematically with E. Axial view with associated z coordinates is shown; left hemisphere is shown on the left.
Resting fMRI signal intensity: effects of E, N, and P
Localized personality effects were evident in the globally normalized resting signal. The areas identified consisted of a region including both Wernicke's and Broca's areas [centered at (-40, -40, 10); Brodmann areas 22, 44, and 45] and the cuneus [(2, -70, 6); Brodmann area 17], both negatively related to E (Fig. 2a-c). At a lower threshold (p < 0.005; uncorrected), we found additional negative relationships: of E to signals in the left [(-8, -30, 10)] and right [(8, -34, 6)] thalamus (Fig. 2d,e); of P to signals in the left [(-18, -4, -4)] and right [(12, -10, -14)] globus pallidus, extending to the putamen (Fig. 3a-c); and of N to signals in the left [(-32, 58, 2)] orbitofrontal cortex (β = 0.91).
Figure 2.
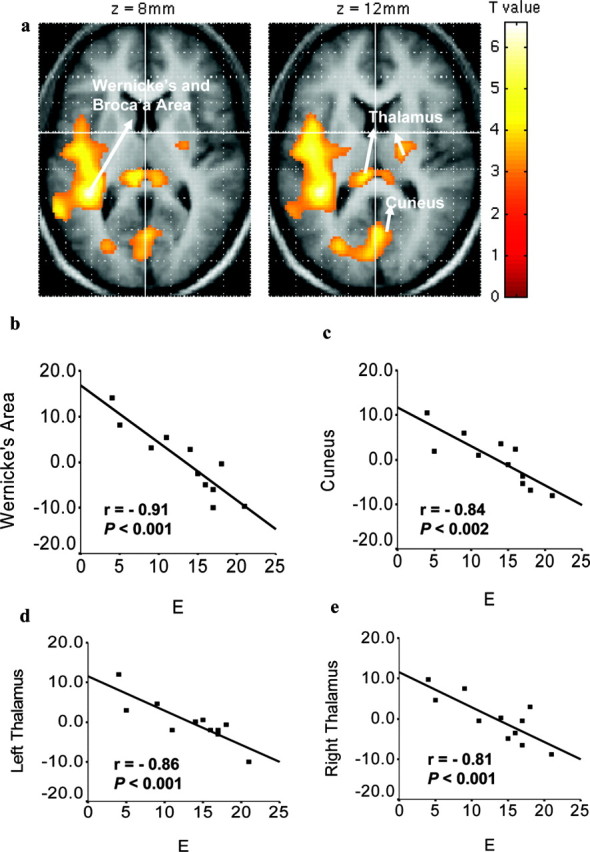
Localized personality correlates in the globally normalized resting signal intensity related to E. a, Regression map in SPM-derived T values thresholded at p < 0.005 (uncorrected) and superimposed on the average structural image. Color bar shows the strength of the correlation with E. Axial view with associated z coordinates is shown; left hemisphere is shown on the left. Localized resting fMRI signal in relation to intersubject local mean intensity (y-axis) in Wernicke's area (b), cuneus (c), and left (d) and right (e) thalamus as a function of E (x-axis). Graphs show SPSS-derived r values and probabilities.
Figure 3.

Localized personality correlates in the globally normalized resting signal intensity related to P. a, Regression map in SPM-derived T scores thresholded at p < 0.005 (uncorrected) and superimposed on the average structural image. Color bar shows the strength of the correlation with P. Axial view with associated z coordinates is shown; left hemisphere is shown on the left. Localized resting fMRI signal in relation to intersubject local mean intensity (y-axis) in left (b) and right (c) global pallidus as a function of P (x-axis). Graphs show SPSS-derived r values and probabilities.
Discussion
We demonstrated powerful effects of questionnaire-measured E on brain activity in a parametric n-back task. Eysenck's model (1981), coupled with the assumption (Duncan and Owen, 2000) that AC and DLPFC form part of a general cognitive arousal system, can predict the major relationship that we observed between task-related activity and personality: the incremental activity in these regions with increasing cognitive load (from 0- to 3-back) was itself an increasing function of E. The n-back task involves sustained attention, encoding of information into working memory, active maintenance of stimulus representations, response selection, and updating of sequential order information. Correlations between task performance and BOLD activity, considered on their own, are therefore susceptible to interpretation in terms of any of these functions. However, the relationship reported here between DLPFC-AC activity and questionnaire-measured E scores [themselves related to a diversity of other behavioral and physiological measures (Eysenck, 1981)] suggests that only a very broad functional role, such as the influence of cortical arousal in effectiveness of cognitive processing, can account for these correlations. Also, consistent with Eysenck's model, which treats N and P as independent of E, these dimensions did not influence task-related activity.
There have been three previous studies of E or related traits and brain responses during cognitive activation paradigms. The first study (Haier et al., 1987) noted a positive relationship between EPQ-R E scores in 18 patients with generalized anxiety disorder and nine healthy subjects during a continuous performance test and regional glucose uptake in the putamen, the caudate nucleus, the cingulate gyrus, and the hippocampal and parahippocampal gyrus. The effects of this study are broadly consistent with our data in showing increased cingulate activity in extraverts relative to introverts. The second study (Stenberg et al., 1993) reported marked asymmetry in data collapsed across several brain regions in introverts, but not in extraverts, during one (mental rotation) of the two cognitive activation tasks. It is not possible to relate the results of this study to ours because anatomical details were not provided. In the third study, the only one that used fMRI (Gray and Braver, 2002), the Behavioral Activation System (BAS) scores (Carver and White, 1994) correlated negatively with an increase in AC activity from rest to the 3-back memory task (0-, 1-, or 2-back conditions not used). BAS scores correlated positively with E (Elliot and Thrash, 2002); therefore, these results seemed to run counter to ours. However, there were substantial methodological differences between the two studies. Of particular importance is the fact that the Gray and Braver (2002) study took place over a much longer time period. Extraverts get bored easily and long for social interactions, and the effects of E vary as a function of time on task (Eysenck, 1982). It is possible that the relationship of E to activity in the AC will be positive for short-duration experiments (current results) (Haier et al., 1987) and negative for longer-duration experiments. The fact that Gray and Braver (2002) manipulated mood may also be relevant (Canli et al., 2001). As stated in Introduction, environmental variables are expected to influence observed relationships between personality and brain activity and should be taken into account. The direction of personality-AC activity association is likely to be situation specific rather than static.
We also observed localized effects relating to E, P, and N in the globally normalized resting signal. Each dimension showed strong negative relationships with activity in distinct brain regions: E, with Wernicke's and Broca's areas, thalamus, and cuneus; P, with the globus pallidus and putamen; and N, with the left orbitofrontal cortex. Although nonphysiological factors limit the inferences that can be drawn from resting fMRI data, the negative relationship between E and activity in Wernicke's and Broca's areas found here confirms previous findings (Johnson et al., 1999) with positron emission tomography (PET) and may reflect the tendency of introverts to engage in internal self-talk. Similarly, two previous studies using the 133Xenon inhalation technique have also reported negative associations between global (Mathew et al., 1984) or temporal lobe resting activity (Stenberg et al., 1990, 1993) with E but not N. Stenberg et al. (1993) have shown, using PET, that the anxiety-proneness aspect of introversion determines the inverse relationship between E and temporal lobe activity, as can be expected (Gray, 1987). One PET study (Ebmeier et al., 1994), however, observed a positive correlation between E and cingulate activity measured in 51 elderly subjects, of whom 33 were scanned at rest, 12 with a metronome beating in the background, and 6 during a word repetition task; the authors interpreted these effects as reflecting extraverts' superiority on attentional tasks (in line with our observations of E influences in task-related activity). The relationship between P and activity in the basal ganglia that we found using our fMRI method is also broadly consistent with the negative relationship between P and dopamine D2 receptor binding in the basal ganglia demonstrated in single-photon (Gray et al., 1994) and positron (Farde et al., 1997) emission tomography studies. The negative relationship between N and resting activity in the left orbitofrontal cortex has not been described previously but perhaps reflects the fact that activity in this region increases with positive emotion (Canli et al., 1998).
Deserving some comment is the observation that, although the average E score of our sample was representative of men in this age range, both N and P scores were slightly lower. This occurred most likely because we did not include regular cigarette smokers or subjects with past or current drug abuse (an item measuring EPQ-R P). Cigarette smoking is associated with high scores on both N and P (Eysenck and Eysenck, 1991), as well as with altered brain structure and functions (Dager and Friedman, 2000). Thus, our results can be taken as demonstrating a true effect of E, free from any confounding effects of high N or high P scores, under the conditions of the present experiment. Our results are, however, pertinent only to the sociability component of E within the context of Eysenck's theory (1967, 1981), because the items measuring impulsivity subcomponent of the E scale in the Eysenck Personality Inventory (Eysenck and Eysenck, 1964) were not included in later measures of E [i.e., the EPQ (Eysenck and Eysenck, 1975) or EPQ-R (Eysenck and Eysenck, 1991)]. Although Eysenck's theory does not make a theoretical distinction between the power of sociability and impulsivity components of E in mediating cortical arousal/arousability, there has been an impressive body of research showing that the impulsivity, but not sociability, component of E putatively influences arousal-mediated performance (Revelle et al., 1980; Smith et al., 1981). There is, however, an equally convincing body of research demonstrating that sociability, rather than impulsivity, underlies arousal-related influences (Gupta, 1990; Matthew et al., 1990a,b; Wilson, 1990; Corr et al., 1995; Corr and Kumari, 1997). We had chosen the EPQ-R for studying personality-brain relationships within the context of Eysenck's personality theory (1967, 1981) because it continued to associate cortical arousal/arousability with sociability (i.e., EPQ-R E) (Eysenck and Eysenck, 1985). EPQ-E scores also correspond well to extraversion scale scores on the NEO Personality Inventory-Revised (Costa and McCrae, 1992), which is another commonly used measure of extraversion (Zuckerman et al., 1993). Nonetheless, the contribution of sociability and impulsivity components of E in arousal-mediated effects warrants additional research to ascertain whether they affect the same or separate cortical arousal systems. It would be valuable to replicate our observations in relation to E, N, and P and extend them to examine the influence of the two subcomponents of E with a larger sample. A final methodological issue relates to the nature of our cognitive task. Instructions to subjects in our study required them to recall the location of the stimuli (numerals) presented previously (1-, 2-, or 3-back) on the screen. Although they seem to have followed the instruction to perform with spatial cues judged by the debriefing data as reported previously (Kumari et al., 2003), the effects we observed might still in some way be related to the strategy used by high and low E subjects, because the task did not constrain strategy and could be performed with either spatial or verbal cues.
In the present and previous (Gray et al., 1994; Farde et al., 1997; Canli et al., 2002; Gray and Braver, 2002) functional neuroimaging studies, the influence of personality has been strong despite small sample sizes and the absence of special subject selection. It is likely, therefore, that this influence is present in virtually all such studies. It is already mandatory to remove from fMRI analyses motion-induced variance, which at 30-50% is less than the variance attributable to personality observed here. Measurement of personality by simple questionnaire should similarly become routine in functional neuroimaging, with likely benefits in reducing apparent “error” variance within studies and increasing comparability between them.
To conclude, we report that personality predicts brain responses during cognitive tasks, supporting the model conceived by Eysenck (1967, 1981). Our findings are of interest to the neuroimaging community but perhaps are more important in confirming a biological basis of individual differences.
Footnotes
V.K. was supported by the Wellcome Trust.
Correspondence should be addressed to Dr. Veena Kumari, Department of Psychology, PO78, Institute of Psychiatry, King's College London, De Crespigny Park, London SE5 8AF, UK. E-mail: v.kumari@iop.kcl.ac.uk.
Copyright © 2004 Society for Neuroscience 0270-6474/04/2410636-06$15.00/0
Deceased.
References
- Barbas H, Henion TH, Dermon CR (1991) Diverse thalamic projections to the prefrontal cortex in the rhesus monkey. J Comp Neurol 313: 65-94. [DOI] [PubMed] [Google Scholar]
- Botvinick MM, Braver TS, Barch DM, Carter CS, Cohen JD (2001) Conflict monitoring and cognitive control. Psychol Rev 108: 624-652. [DOI] [PubMed] [Google Scholar]
- Callicott JH, Mattay VS, Bertolino A, Finn K, Coppola R, Frank JA, Goldberg TE, Weinberger DR (1999) Physiological characteristics of capacity constraints in working memory as revealed in functional MRI. Cereb Cortex 9: 20-26. [DOI] [PubMed] [Google Scholar]
- Canli T, Desmond JE, Zhao Z, Glover G, Gabrieli JD (1998) Hemispheric asymmetry for emotional stimuli detected with fMRI. NeuroReport 9: 3222-3239. [DOI] [PubMed] [Google Scholar]
- Canli T, Zhao Z, Desmond JE, Kang E, Gross J, Gabarieli JDE (2001) An fMRI study of personality influences on brain reactivity to emotional stimuli. Behav Neurosci 115: 33-42. [DOI] [PubMed] [Google Scholar]
- Canli T, Sivers H, Whitfield SL, Gotlib IH, Gabrieli JD (2002) Amygdala response to happy faces as a function of extraversion. Science 296: 2191. [DOI] [PubMed] [Google Scholar]
- Carver CS, White TL (1994) Behavioral inhibition, behavioral activation, and affective responses to impending reward and punishment: the BIS/BAS scales. J Pers Soc Psychol 67: 319-333. [Google Scholar]
- Corr PJ, Kumari V (1997) Sociability/impulsivity and attenuated dopaminergic arousal: critical flicker/fusion frequency and procedural learning. Pers Individ Dif 22: 805-815. [Google Scholar]
- Corr PJ, Pickering AD, Gray JA (1995) Sociability/impulsivity and caffeine-induced arousal: critical flicker fusion frequency and procedural learning. Pers Individ Dif 18: 713-730. [Google Scholar]
- Costa Jr PT, McCrae RR (1992) NEO personality inventory-revised (NEO PI-R) and NEO five-factor inventory (NEO-FFI) professional manual. Odessa, FL: Psychological Assessment Resources.
- Crino PB, Morrison JH, Hof PR (1993) Monoaminergic innervation of cingulate cortex. In: Neurobiology of cingulate cortex and limbic thalamus: a comprehensive handbook (Vogt B, Gabriel M, eds), pp 285-299. Boston: Birkhauser.
- Dager SR, Friedman SD (2000) Brain imaging and the effects of caffeine and nicotine. Ann Med 32: 592-599. [DOI] [PubMed] [Google Scholar]
- Davis C, Cowles M (1988) A laboratory study of temperament and arousal: a test of Gale's hypothesis. J Res Pers 22: 101-116. [Google Scholar]
- Duncan J, Owen A (2000) Common regions of the human frontal lobe recruited by diverse cognitive demands. Trends Neurosci 23: 475-483. [DOI] [PubMed] [Google Scholar]
- Ebmeier KP, Deary IJ, O'Carroll RE, Prentice N, Moffoot APR, Goodwin GM (1994) Personality associations with the uptake of the cerebral blood flow marker Tc-exametazime estimated with single photon emission tomography. Pers Individ Dif 5: 587-595. [Google Scholar]
- Elliot AJ, Thrash TM (2002) Approach-avoidance motivation in personality: approach and avoidance temperaments and goals. J Pers Soc Psychol 82: 804-818. [DOI] [PubMed] [Google Scholar]
- Eysenck HJ (1967) The biological basis of personality. Springfield, IL: Thomas.
- Eysenck HJ (1981) General features of the model. In: A model for personality, pp 1-37. Berlin: Springer.
- Eysenck HJ (1994) Personality: biological foundations. In: The neuropsychology of individual differences (Vernon PA, ed), pp 151-207. London: Academic.
- Eysenck HJ, Eysenck MW (1985) Extraversion, arousal, and performance. In: Personality and individual differences: a natural science approach, pp 237-288. London: Plenum.
- Eysenck HJ, Eysenck SBG (1964) Manual of the Eysenck personality inventory. London: University of London.
- Eysenck HJ, Eysenck SBG (1975) Manual of the Eysenck personalilty questionnaire. London: Hodder and Stoughton.
- Eysenck HJ, Eysenck SBG (1991) Manual of the Eysenck personality scales. London: Hodder and Stoughton.
- Eysenck MW (1982) Endogenous determinants of arousal. In: Attention and arousal: cognition and performance, pp 125-156. Berlin: Springer.
- Farde L, Gustavsson JP, Jonsson E (1997) D2 dopamine receptors and personality traits. Nature 385: 590. [DOI] [PubMed] [Google Scholar]
- Friston KJ, Holmes A, Poline JB, Price CJ, Frith CD (1996) Detecting activations in PET and fMRI: levels of inference and power. NeuroImage 4: 223-235. [DOI] [PubMed] [Google Scholar]
- Gale A, Baker S (1981) In vivo or in vitro? Some effects of laboratory environments with particular references to the psychophysiology experiment. In: Foundations of psychosomatics (Christie MJ, Mallet PG, eds), pp 363-384. London: Wiley.
- Gathercole J (1994) Neuropsychology and working memory: a review. Neuropsychology 8: 494-506. [Google Scholar]
- Glabus MF, Horwitz B, Holt JL, Kohn PD, Gerton BK, Callicott JH, Meyer-Lindenberg A, Berman KF (2003) Interindividual differences in functional interactions among prefrontal, parietal and parahippocampal regions during working memory. Cereb Cortex 13: 1352-1361. [DOI] [PubMed] [Google Scholar]
- Gray JA (1964) Pavlov's typology. Oxford: Pergamon.
- Gray JA (1987) The neuropsychology of emotion and personality. In: Cognitive neurochemistry (Iversen SD, Stahl SM, Goodman EC, eds), pp 171-190. Oxford: Oxford UP.
- Gray JR, Braver TS (2002) Personality predicts working-memory-related activation in the caudal anterior cingulate cortex. Cogn Affect Behav Neurosci 2: 64-75. [DOI] [PubMed] [Google Scholar]
- Gray NS, Pickering AD, Gray JA (1994) Psychoticism and dopamine D2 binding set in the basal ganglia using single photon emission tomography. Pers Individ Dif 3: 431-434. [Google Scholar]
- Gupta S (1990) Impulsivity/sociability and reinforcement in verbal operant conditioning: a replication. Pers Individ Dif 11: 585-589. [Google Scholar]
- Haier RJ, Sokolski K, Katz M, Buchsbaum MS (1987) The study of personality with positron emission tomography. In: Personality dimensions and arousal (Strelau J, Eysenck HJ, eds), pp 251-267. New York: Plenum.
- Johnson DL, Wiebe JS, Gold SM, Andreasen NC, Hitchwa RD, Watkins L, Ponto LLB (1999) Cerebral blood flow and personality: a positron emission tomography study. Am J Psychiatry 156: 252-257. [DOI] [PubMed] [Google Scholar]
- Kumari V, Gray JA, ffytche D, Mitterschiffthaler MT, Das M, Zachariah E, Vythelingum GN, Williams SCR, Simmons A, Sharma T (2003) Cognitive effects of nicotine in humans: a functional MRI investigation. NeuroImage 19: 1002-1013. [DOI] [PubMed] [Google Scholar]
- Lieberman MD (2000) Introversion and working memory: central executive differences. Pers Individ Dif 28: 479-486. [Google Scholar]
- Lieberman MD, Rosenthal R (2001) Why introverts can't always tell who likes them: multitasking and nonverbal decoding. J Pers Soc Psychol 80: 294-310. [DOI] [PubMed] [Google Scholar]
- MacDonald AW, Cohen JD, Stenger V, Carter CS (2000) Dissociating the role of the dorsolateral prefrontal cortex and anterior cingulate in cognitive control. Science 288: 1835-1836. [DOI] [PubMed] [Google Scholar]
- Mathew RJ, Weinman ML, Barr DL (1984) Personality and regional cerebral blood flow. Br J Psychiatry 144: 529-532. [DOI] [PubMed] [Google Scholar]
- Matthew G, Davies DR, Holley PJ (1990a) Extraversion, arousal and visual sustained attention: the role of resource availability. Pers Individ Dif 11: 1159-1173. [Google Scholar]
- Matthew G, Davies DR, Lees JL (1990b) Extraversion, arousal and individual differences in resource availability. J Pers Soc Psychol 59: 150-168. [Google Scholar]
- Revelle W, Humphreys MS, Simon L, Gilliland K (1980) The interactive effect of personality, time of day, and caffeine: a test of the arousal model. J Exp Psychol Gen 109: 1-31. [PubMed] [Google Scholar]
- Smith BD, Rypma CB, Wilson RJ (1981) Dishabituation and spontaneous recovery of the electrodermal orienting response: effects of extraversion, impulsivity, sociability and caffeine. J Res Pers 15: 233-240. [Google Scholar]
- Smith EE, Jonides J (1997) Working memory: a view from neuroimaging. Cognit Psychol 33: 5-42. [DOI] [PubMed] [Google Scholar]
- Stenberg G, Risberg J, Warkentin S, Rosen I (1990) Regional patterns of cortical blood flow distinguish extraverts from introverts. Pers Indiv Diff 11: 663-673. [Google Scholar]
- Stenberg G, Wendt PE, Risberg J (1993) Regional cerebral blood flow and extraversion. Pers Individ Dif 15: 547-554. [Google Scholar]
- Wilson GD (1990) Personality, time of day and arousal. Pers Individ Dif 10: 153-168. [Google Scholar]
- Zuckerman M, Kuhlman DM, Joireman J, Teta P, Kraft M (1993) A comparison of the three structural models for personality: the big three, the big five, and the alternative five. J Pers Soc Psychol 65: 757-768. [Google Scholar]