

Abstract
Neurogenesis in the developing cerebral cortex of mice occurs in the dorsal telencephalon between embryonic day 11 (E11) and E17, during which time the majority of cortical projection neurons and some glia are produced from proliferating neuroepithelial cells in the ventricular zone. The number of cells produced by this process is governed by several factors, including cell cycle kinetics and the proportion of daughter cells exiting the cell cycle after a given round of cell division. The in vivo effects of IGF-I on cell cycle kinetics were investigated in nestin/IGF-I transgenic (Tg) embryos, in which IGF-I is overexpressed in the cerebral cortex and dorsal telencephalon. These Tg mice have been shown to exhibit increased cell number in the cortical plate by E16 and increased numbers of neurons and glia in the cerebral cortex during postnatal development. Cumulative S phase labeling with 5-bromo-2′-deoxyuridine revealed a decrease in total cell cycle length (TC) in Tg embryos on E14. This decrease in TC was found to result entirely from a reduction in the length of the G1 phase of the cell cycle from 10.66 to 8.81 hr, with no significant changes in the lengths of the S, G2, and M phases. Additionally, the proportion of daughter cells reentering the cell cycle was significantly increased by 15% in Tg embryos on E14-E15 compared with littermate controls. These data demonstrate that IGF-I regulates progenitor cell division in the ventricular zone by reducing G1 phase length and decreasing TC but increases cell cycle reentry.
Keywords: insulin-like growth factor-I, IGF-I, mitosis, neurogenesis, transgenic mice, ventricular zone
Introduction
Insulin-like growth factor-I (IGF-I) promotes growth and development of the CNS (for review, see D'Ercole et al., 1996, 2002; M. F. Anderson et al., 2002). IGF-I and its cell surface receptor, IGF1R (the type 1 IGF receptor), are expressed throughout the brain during embryonic development (Bondy et al., 1990, 1992; Ayer-Le Lievre et al., 1991; Bach et al., 1991; Brooker et al., 2000). The capacity of IGF-I to promote neuron progenitor proliferation has been documented in vitro (DiCicco-Bloom and Black, 1988; Torres-Aleman et al., 1990; Drago et al., 1991; Werther et al., 1993; Zackenfels et al., 1995; Arsenijevic et al., 2001) and in vivo (Ye et al., 1996; Aberg et al., 2000; O'Kusky et al., 2000; Popken et al., 2004), but the influence of IGF-I on cell cycle kinetics in the embryonic brain has not been studied.
The present study was conducted to investigate the in vivo effects of IGF-I on the cell cycle kinetics of proliferating neuroepithelial cells in the ventricular zone (VZ) of the dorsal telencephalon during embryonic development, using a line of transgenic (Tg) mice (nestin/IGF-I transgenics) that overexpress IGF-I in the brain as early as embryonic day 13 (E13) (Popken et al., 2004). Cumulative S phase labeling with 5-bromo-2′-deoxyuridine (BrdU) was used to measure several cell cycle parameters, including the growth fraction [GF (proportion of proliferating cells)], total cell cycle duration [TC (mean length of the mitotic cycle)], and individual phase lengths [TG1, TS, TG2, and TM (lengths of the G1, S, G2, and M phases, respectively)]. In addition, single-injection BrdU labeling protocols, combined with double-labeling immunohistochemistry, were performed to measure both the proliferative fraction (proportion of daughter cells remaining in the cell cycle) and the exiting fraction (proportion of daughter cells leaving the cell cycle).
Proliferating neuroepithelial cells in the VZ of the dorsal telencephalon produce the vast majority of cortical projection neurons, although they also give rise to some cells of glial lineage (for review see, Parnavelas, 2000). In the subventricular zone (SVZ), they produce predominantly glial cells, although they also give rise to some supragranular cortical neurons (Takahashi et al., 1995b; Tarabykin et al., 2001; Noctor et al., 2004). Cortical interneurons arise predominantly from the ventral telencephalon (S. A. Anderson et al., 1997, 1999, 2002). Neocortical neurogenesis in the VZ of the normal mouse extends from E11 through E17 (Takahashi et al., 1993, 1994, 1995a,b, 1996). During this time, the mean length of the mitotic cell cycle (TC) increases approximately twofold, attributable entirely to an increase in the length of the G1 phase (Takahashi et al., 1995a). For proliferating neuroepithelial cells in the VZ, the proliferative fraction gradually decreases, whereas the exiting fraction gradually increases, indicating that initially neurons are generated slowly, and the VZ expands rapidly (Takahashi et al., 1994, 1996). Given that the transgene in nestin/IGF-I Tg embryos is expressed as early as E13 (Popken et al., 2004), these mice provide a unique opportunity to study the in vivo role of IGF-I in controlling cell cycle kinetics in the embryonic brain.
Materials and Methods
Nestin/IGF-I transgenic mice. Nestin/IGF-I Tg mice were generated at the University of North Carolina at Chapel Hill, according to a previously published protocol (Popken et al., 2004). Briefly, these mice carried a transgene composed of regulatory elements that included the second intron of the human nestin gene and the minimal promoter of herpes simplex virus immediate early gene ICP4 (infected cell protein 4), the human IGF-IA cDNA fused to a signal sequence from rat somatostatin, and a sequence containing polyadenylation signals and sites derived from the human growth hormone gene. Tg mice were generated using classical microinjection techniques using F1 hybrid eggs from C57BL/6 and C3/He mice. All subsequent breeding was with C57BL/6 mice, and all mice used in these studies were derived from 15 or more generations of matings of mice heterozygous for the transgene and C57BL/6 non-Tg normal mice. Expression of the nestin IGF-I transgene was detectable in the CNS as early as E13 and continued into postnatal life (Popken et al., 2004). On E13, transgene expression was evident in the VZ of the developing telencephalic wall, whereas at later ages, transgene expression was greatest in the cortical plate (CP) and cerebral cortex (Popken et al., 2004). Institutional review committees of the University of British Columbia and the University of North Carolina at Chapel Hill approved all procedures used.
Embryo collection and tissue processing. A total of 90 embryos derived from 20 separate litters was used in the present study. Timed-pregnant dams were generated by placing heterozygous male Tg mice with normal C57BL/6 female mice (Charles River Laboratories, Wilmington, MA) at 8:00 A.M. Vaginal plug checks were conducted 2 hr later at 10:00 A.M. The presence of a vaginal plug indicated conception had occurred, and the day of conception was taken as E0. Embryo genotype was assessed by PCR analysis of tail genomic DNA. Typically, each litter contained approximately one-half Tg and one-half non-Tg normal control embryos.
Embryos were collected from timed-pregnant dams at various gestational ages, including E11, E14, E15, E17, and E18. Individual dams were deeply anesthetized with intraperitoneal injections of ketamine (100 mg/kg) and xylazine (10 mg/kg). A hysterotomy was performed, and the uterus was removed to ice cold 0.1 m PBS, pH 7.4. In the case of dams at E11-E17, individual embryos were dissected from the uterine tissue and decapitated, and the whole heads were placed in 70% ethanol overnight at 4°C. E18 animals were decapitated, and the brain was dissected free of surrounding tissue and fixed by immersion as described above. Somatic tissue was retained for PCR analysis of embryo genotype. After fixation, embryos were embedded in paraffin and sectioned at 4 μm in the coronal plane. Sections were collected on Colorfrost Plus glass slides (Fisher Scientific, Ottawa, Ontario, Canada) and air dried.
Cumulative BrdU labeling at E14. The mean lengths of the TC and TS were determined on E14 in Tg and control embryos using a cumulative BrdU-labeling protocol. The GF, defined as the proportion of VZ cells that were actively proliferating on E14 (Takahashi et al., 1993), was also determined using this method. Details of the BrdU-labeling protocol have been published previously (Takahashi et al., 1992, 1993, 1995a). Briefly, pregnant mice were injected intraperitoneally with BrdU (50 μg/gm body weight) beginning at 9:00 A.M. on E14. Subsequent injections were administered at maximum intervals of 3 hr, with the last BrdU injection administered 0.5 hr before the dam was killed (Takahashi et al., 1993). Embryos were collected at survival time points 0.5, 2.0, 3.5, 8.0, 11.0, 12.5, and 14.0 hr after the initial BrdU injection. Four animals per group were collected at each time point, except for the 14.0 hr survival time in which three Tg and three control embryos were sampled. In total, 54 embryos from 12 litters were used in this analysis.
Embryos were fixed and processed for paraffin embedding as described above. Coronal sections (4 μm) were stained immunohistochemically for the detection of BrdU. Briefly, sections were deparaffinized, rehydrated in descending grades of ethanol, and incubated in 2N HCl for 1 hr. Sections were incubated with a mouse monoclonal anti-BrdU antibody (1:75; BD Biosciences, San Diego, CA) for 1 hr at room temperature. After incubation with the primary antibody, sections were processed using a Vectastain ABC Elite kit for mouse IgG (Vector Laboratories, Burlingame, CA), according to the protocol of the manufacturer. Slides were reacted for 3 min with diaminobenzidine, cobalt chloride, and nickel ammonium sulfate and counterstained with 0.1% aqueous basic fuchsin.
Cell counts were conducted on four nonadjacent coded histological sections selected for each embryo at each survival time point. Details of the counting methods used have been published previously (Takahashi et al., 1993, 1995a). Counts were conducted in a sector of the dorsomedial cerebral wall corresponding to the primordial primary somatosensory cortex (see Fig. 1 A). The sector measured 100 μm in its mediolateral dimension and 4 μm in its anteroposterior dimension and was positioned over a constant region of the dorsomedial cerebral wall in each embryo. It was divided into bins, 10 μm in height, that were oriented parallel to the ventricular surface. Within each bin, BrdU-labeled and unlabeled nuclei (see Fig. 1 D) were counted according to criteria established by Takahashi et al. (1993). After examining the distribution of labeled cells relative to the ventricular surface, bins 1-7 were identified as representing the VZ in both Tg and control embryos. A labeling index (LI) was determined for the VZ, defined as the proportion of BrdU-labeled cells to total cells in bins 1-7.
Figure 1.
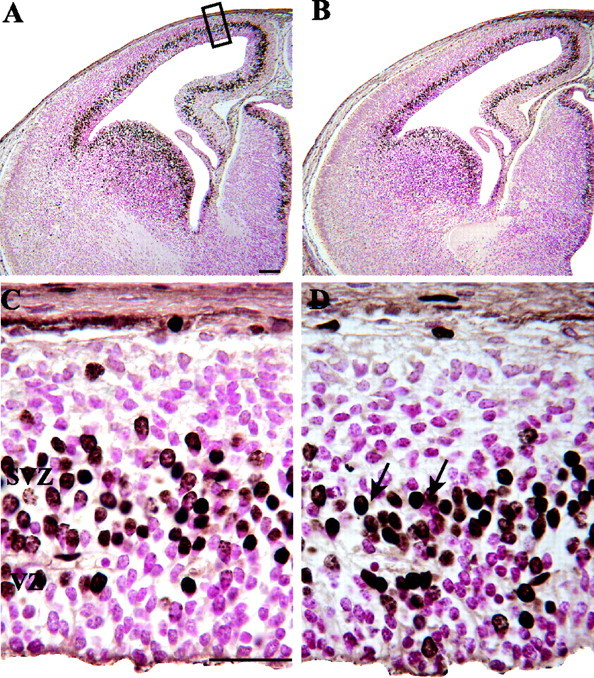
Photomicrographs illustrating BrdU labeling in E14 control (A, C) and nestin/IGF-I Tg (B, D) embryos 0.5 hr after injection of a timed-pregnant dam. Counts of BrdU-labeled and unlabeled cells were conducted over the dorsomedial cerebral wall (A, black rectangle). BrdU-labeled cells were identified by the accumulation of brown reaction product in cell bodies (D, arrows). Unlabeled cells appear pink because of the use of a basic fuchsin counterstain. As illustrated in the low-power photomicrographs, Tg embryos (B) were not visually distinguishable from controls (A) on E14. C and D illustrate the structure of the cerebral wall from the ventricular surface to the pia at 9:30 A.M. on E14. The cerebral wall consisted mainly of the VZ and SVZ in both control (C) and Tg (D) embryos at this time, and a morphologically distinguishable cortical plate was not evident in either group. The height of the VZ and the total cerebral wall were similar in Tg and control embryos. Scale bars: A, 100 μm; C, 30 μm.
Graphs of LI versus postinjection survival time were generated for Tg and control embryos (see Fig. 2). For each group, a least-squares curve fit that considered all data points from every survival time was generated using Microsoft (Seattle, WA) Excel (Nowakowski et al., 1989). The GF was determined as the maximum LI value attained for each group during the experimental period. TC and TS were determined using Equations 1 and 2: (1) y-intercept = GF × TS/TC; and (2) time to reach maximum LI = TC - TS (Takahashi et al., 1993).
Figure 2.

Plots of BrdU LIs determined by cumulative labeling with BrdU in nestin/IGF-I Tg and control embryos on E14. The cumulative injection experiments were initiated at 9:00 A.M., with the final survival time point collected 14.0 hr later. LI was determined for the VZ, which was seven bins in height for both Tg and control animals. For each group, a least-squares curve was fit to all data points from each survival time in the analysis. The plots illustrate the linear advance of LI toward maximum levels in Tg (filled squares, solid line) and control (open squares, dashed line) embryos as the number of BrdU injections administered increases over the experimental period. As maximum labeling is reached, LI values level off accordingly in each group. However, LI values plateau at an earlier time in Tg embryos, indicating that LI progresses to a maximum at a faster rate in Tg embryos and that TC - TS is reduced in Tg mice.
The statistical significance of differences among mean LI values was assessed using a 2 × 7 (groups × survival times) ANOVA of data from the 0.5-14.0 hr survival times. Post hoc analysis of the statistical significance of differences between individual pairs of means was conducted using estimated marginal means with a least significant difference adjustment for multiple comparisons.
Measurement of TG2+M on E14. To determine the lengths of the G2 and M phases of the cell cycle in Tg and control embryos on E14, a single-injection BrdU-labeling protocol was used (Takahashi et al., 1993). Single intraperitoneal injections of BrdU were administered to timed-pregnant dams at 9:00 A.M. on E14. Dams were allowed to survive 1.0, 1.5, and 2.0 hr after injection. At the specified survival times, hysterotomies were performed, and whole embryo heads were removed and fixed by immersion in 70% ethanol overnight (n = 3 per group for each survival time). Sections were processed for the detection of BrdU immunoreactivity as described previously. Cell counts were conducted on four nonadjacent coded histological sections within the dorsomedial sector of the cerebral wall equivalent to that used for the cumulative BrdU-labeling study. Within each sector, the percentage of BrdU-labeled VZ mitoses was determined. Mitotic figures were considered to belong to the VZ only if they occurred within bin 1of the sector (i.e., adjacent to the ventricular surface). The combined length of the G2 and M phases of the cell cycle was determined as the time required to label all ventricular mitoses with BrdU (Takahashi et al., 1993). The statistical significance among means was assessed using a 2 × 3 (groups × survival times) ANOVA.
Mitotic index estimates at E14. Estimates of mitotic index (MI), defined as the proportion of cells in mitosis compared with the total number of cells in the VZ, were determined in Tg and control embryos at E14. Counts of mitotic figures were conducted on mice from the 0.5, 2.0, and 3.5 hr survival times (n = 4 embryos per group for each time point) according to the method of Takahashi et al. (1993). Five sections adjacent to those used for estimating TC and TS were selected from each brain. Sections were stained with 0.1% aqueous thionine in acetate buffer, pH 3.7.
Mitotic figures were counted in the dorsomedial sector of the cerebral wall as described previously. Counts were conducted in both hemispheres of each brain. Mitotic figures falling within bin 1 were taken to represent VZ mitoses. Abventricular mitotic figures located in bins other than bin 1 (i.e., those mitotic cells not immediately adjacent to the ventricular surface) were considered separately. The total number of cells in the VZ (bins 1-7) was determined for each animal. MI was determined using Equation 3: MI = Nm/Ntot, where Nm is the number of VZ mitotic figures, and Ntot is the total number of cells in the VZ (Takahashi et al., 1993). Estimates of TM were determined using Equation 4: TM = MI × TC. The statistical significance among mean MI values, numbers of ventricular mitoses per sector, numbers of abventricular mitoses per sector, and numbers of cells in the VZ were assessed using 2 × 3 (groups × survival times) ANOVA.
Calculation of TG1. TG1 was calculated using Equation 5: TG1 = TC - (TS + TG2+M) (Takahashi et al., 1993).
Cell cycle exit at E14-E15. The proportion of cells in the cerebral wall that exit the cell cycle and the complementary proportion of cells that reenter the cell cycle were assessed in Tg and control embryos on E14-E15. A cohort of proliferating cells was labeled with a single intraperitoneal injection of BrdU (50 μg/gm body weight) given at 9:00 A.M. on E14. At 9:00 A.M. on E15, 24 hr later, embryos were collected (Chenn and Walsh, 2002). For each group, three embryos were fixed by immersion in 70% ethanol, embedded in paraffin, and sectioned at 4 μm in the coronal plane.
Five nonadjacent sections (every second section in a series of 10 serial sections) were selected from each embryo for cell counts. Slides were processed for the immunohistochemical detection of BrdU and Ki67, which is an endogenous marker of proliferating cells (Scholzen and Gerdes, 2000; Kee et al., 2002). Sections were deparaffinized, rehydrated, and heated in Antigen Unmasking Solution (Vector Laboratories) for 5 min, until the solution came to a boil. The temperature was reduced, and sections were heated for an additional 20 min. Slides were incubated in blocking solution (0.3% Triton X-100 and 5% normal goat serum in PBS) for 1 hr at room temperature. Primary antibodies were diluted in blocking solution, and slides were incubated overnight at 4°C. The primary antibodies used were mouse monoclonal anti-BrdU (1:200; BD Biosciences) and rabbit polyclonal anti-Ki67 (1:500; Novocastra Laboratories, Newcastle upon Tyne, UK). Primary antibody binding was detected using the fluorochrome-conjugated secondary antibodies Alexa Fluor 488 goat anti-rabbit IgG (1:500; Molecular Probes, Eugene, OR) and Alexa Fluor 633 goat anti-mouse IgG (1:250; Molecular Probes), which were applied to the slides for 1 hr at room temperature in the dark. Sections were mounted in ProLong Gold antifade reagent (Molecular Probes) and dried overnight.
Immunofluorescence was detected using an Olympus Optical (Tokyo, Japan) Fluoview 500 confocal laser scanning microscope. z-Axis optical sections (1 μm in thickness) were collected over the dorsomedial cerebral wall. Specimens were scanned sequentially with an argon laser and a red helium neon laser to prevent cross talk between fluorescence channels. Differential interference contrast (DIC) images of the specimens were collected with each scan. Scans were collected in sectors of both the right and left hemispheres on each section (i.e., 10 scans per brain). Images were viewed using Olympus Optical Fluoview software, and cells were counted by hand. Within the 100 × 4 μm sector of the dorsomedial cerebral wall, BrdU-labeled cells were counted and scored for the presence or absence of Ki67 immunofluorescence. The proportions of BrdU-positive/Ki67-positive (BrdU+/Ki67+) and BrdU-positive/Ki67-negative (BrdU+/Ki67-) cells were determined for each animal (Chenn and Walsh, 2002). The statistical significance of differences among means was assessed using a 2 × 2 (groups × cell types) ANOVA. Post hoc analysis of the statistical significance of differences between individual pairs of means was conducted using estimated marginal means with a least significant difference adjustment for multiple comparisons.
BrdU labeling on E11, E17, and E18. Single injections of BrdU were administered to timed-pregnant dams on E11, E17, and E18 to determine the duration of cortical neurogenesis during embryonic development in Tg and control embryos. All BrdU injections (50 μg/gm body weight) were administered at 9:00 A.M., and the dam was killed 1 hr after injection. Embryos were processed as described above. Representative sections were selected and stained immunohistochemically for the detection of BrdU with basic fuchsin as a counterstain.
Results
Cell cycle kinetics in nestin/IGF-I Tg embryos on E14
Detailed analyses of cell cycle kinetics were performed in nestin/IGF-I Tg and control embryos on E14, which represents the midpoint in the duration of neurogenesis in normal mice. Histological examination revealed no signs of gross malformation or morphological abnormalities in Tg embryos. In fact, the Tg and control groups could not be distinguished on the basis of the size or lamination pattern of the telencephalic wall at this age (Fig. 1). In both groups, the thickness of the VZ was ∼70 μm over the dorsomedial sector being analyzed, and VZ thickness did not appear to change over the 14.0 hr period of cumulative BrdU labeling.
TC is reduced in Tg embryos
To determine whether IGF-I influences overall cell cycle length during cortical neurogenesis, a cumulative BrdU-labeling protocol was used to generate LI values for the VZ on E14. Individual plots of LI versus survival time for both Tg and control embryos illustrated that LI increased linearly to a maximum value at a given survival time and then leveled off in both groups (Fig. 2). Maximum LI values, which are the equivalent of the GF, were 0.98 in both groups, indicating that virtually all VZ cells were proliferating over the experimental period. The GF values for Tg and control embryos were comparable with published values for other strains of normal mice on E14 (Takahashi et al., 1993, 1995a; Miyama et al., 1997).
The relationship between LI and survival time was compared between Tg and control embryos using a 2 × 7 ANOVA (groups × survival times). A significant main effect of groups was observed (F = 66.568; p < 0.001), indicating that LI was significantly greater in Tg mice. Evaluation for an interaction between groups and survival times was also significant (F = 6.686; p < 0.001), allowing for direct comparisons between individual mean LI values. LI values did not differ significantly between Tg and control embryos at 0.5, 12.5, or 14.0 hr. However, the LI was significantly greater in Tg embryos at 2.0 hr (16%; p < 0.001), 3.5 hr (12%; p < 0.001), 8.0 hr (13%; p < 0.001), and 11.0 hr (7%; p < 0.001) survival times. These data indicated that, although the proportion of cells in S phase at 0.5 hr after the initial BrdU injection was approximately the same in Tg and control embryos, the rate of labeling increased in Tg embryos at subsequent time points. After reaching the inflection point in the LI versus survival time graph, LI values leveled off in Tg and control embryos. Consequently, the LI values for the 12.5 and 14.0 hr survival times did not differ significantly between groups. However, the time required to reach the GF (i.e., TC - TS, according to Eq. 2) was calculated to be 10.81 hr in Tg embryos and 12.66 hr in controls, indicating that the time required to reach the GF was significantly decreased by 1.85 hr in Tg embryos.
Individual phase lengths for TC and TS were derived from the graphs of LI versus survival time and Equations 1 and 2, cited above. TS was 0.2 hr (12 min) shorter in Tg embryos, indicating that the length of S phase did not differ substantially between Tg and control embryos (Table 1). However, TC was 2.05 hr shorter in Tg mice (Table 1), indicating that the length of one or more phases of the cell cycle should be reduced in Tg embryos.
Table 1.
Cell cycle parameters for nestin/IGF-I transgenic and normal littermate control mice at E14
|
Cell cycle parameter |
Nestin/IGF-I transgenic (hr) |
Control (hr) |
|---|---|---|
| Time required to reach maximum LI | 10.81 | 12.66 |
| TC | 15.87 | 17.92 |
| TS | 5.06 | 5.26 |
| TG2+M | 2.0 | 2.0 |
| TM | 0.61 | 0.56 |
| TG2 | 1.39 | 1.45 |
| TG1
|
8.81 |
10.66 |
Mean lengths for cell cycle phases were measured using cumulative and single injection BrdU-labeling protocols. The maximum LI attained is equivalent to the GF, which represents the proportion of actively dividing cells in the ventricular zone.
TG2+M is normal in Tg embryos
The combined length of the G2 and M phases of the cell cycle was determined from single-injection BrdU experiments conducted on E14. At postinjection survival times of 1.0, 1.5, and 2.0 hr, the percentage of mitotic figures labeled with BrdU was determined in Tg and control embryos (Fig. 3). A 2 × 3 ANOVA comparison of the percentage of BrdU-labeled figures showed that the proportion of labeled mitoses did not differ significantly between groups (F = 0.065; p > 0.05). The percentage of labeled figures was approximately the same in both groups at each survival time, with ∼25% of figures labeled at 1.0 hr and 55% of figures labeled at 1.5 hr after injection (Fig. 3). By 2.0 hr after injection, nearly 100% of mitotic figures were BrdU labeled in both Tg and control embryos (Fig. 3). TG2+M was estimated from the time required to label all mitotic figures with BrdU, which was 2.0 hr in both groups. Therefore, TG2+M was invariant at 2.0 hr in both Tg and control embryos. These values are consistent with previously published reports for the value of TG2+M (Takahashi et al., 1993, 1995a; Miyama et al., 1997).
Figure 3.

Graph of the percentage of labeled mitotic figures over the dorsomedial sector of the cerebral wall at 1.0, 1.5, and 2.0 hr after a single injection of BrdU was administered to a timed-pregnant dam on E14 (Tg, open bars; control, filled bars). Error bars represent the SEM. The graph shows that the percentage of labeled mitotic figures does not differ significantly between groups at any of the times examined. By 2.0 hr after injection, essentially all mitotic figures are labeled in Tg and control embryos. Therefore, the combined length of the G2 and M phases is 2.0 hr in both groups.
Increased mitotic index in Tg embryos
MI, the proportion of mitotic figures compared with total VZ cells, was determined on Nissl-stained sections from the 0.5, 2.0, and 3.5 hr cumulative BrdU-labeling survival times (Eq. 3). The mean number of cells in the VZ did not differ significantly between Tg (139.42 ± 4.98; mean ± SEM) and control (151.50 ± 6.89) embryos, indicating that cellular density in the VZ was similar in both groups. The mean number of ventricular mitotic figures per sector did not differ significantly between groups (Tg, 5.208 ± 0.242; control, 4.667 ± 0.319; p > 0.05). Similarly, the mean number of abventricular mitotic figures per sector was not significantly different in Tg and control embryos (Tg, 1.125 ± 0.118; control, 1.117 ± 0.108; p > 0.05). However, analysis of the MI data using a 2 × 3 ANOVA (groups × survival times) showed a significant main effect for groups (F = 7.287; p = 0.015), indicating that MI was significantly increased by 21% in Tg embryos (0.382 ± 0.003) compared with controls (0.314 ± 0.003). The interaction (groups × survival times) was not significant, so individual paired comparisons of mean values were not warranted.
MI data were used to calculate an estimate of TM for each group (Eq. 4). TM values were similar in Tg and control embryos (36.60 and 32.87 min, respectively), indicating that TM did not differ substantially between groups. Individual estimates of TG2, determined by subtracting TM values from 2.0 hr (TG2+M), also did not differ greatly between groups (Table 1). These data confirm the findings of the cumulative and single-injection BrdU experiments. Individual estimates of TM and TG2 were not substantially different in Tg and controls, verifying the estimate of a 2.0 hr TG2+M in both groups.
Reduced G1 phase length accounts for decreased TC in Tg embryos
Data from the cumulative and single-injection BrdU experiments demonstrated that TC was reduced in Tg embryos on E14, whereas TS and TG2+M were invariant. Using Equation 5, TG1 was calculated in control and Tg embryos. TG1 was 1.85 hr shorter in Tg embryos compared with controls (Table 1). This reduction in TG1 accounts for the observed decrease in TC in Tg embryos. Therefore, cell cycle length is reduced in Tg embryos attributable entirely to a reduction in the length of the G1 phase of the cell cycle.
Our control values for TC, TS, and TG1 vary slightly from previous studies using the cumulative BrdU-labeling method (Takahashi et al., 1993, 1995a). These variations are likely to result from the use of different strains of mice (C57BL/6 vs CD1). However, our control data more closely resemble the values for individual cell cycle parameters measured in CD1 mice on E15 (Takahashi et al., 1995). The value for TS calculated in this report is longer than the value for CD1 mice determined using cumulative BrdU labeling. However, our TS value is consistent with other reports of S phase length in the rodent cortex (Atlas and Bond, 1965; Kauffman 1966, 1968; Shimada and Langman, 1970). Nonetheless, our data clearly indicate a reduction in cell cycle length in Tg embryos on E14.
IGF-I promotes cell cycle reentry on E14-E15
During cortical neurogenesis, daughter cells produced by the division of progenitors within the VZ may either exit the cell cycle and migrate from the VZ or reenter the cycle and undergo additional rounds of mitosis. One of the key factors influencing total neuron output from the VZ is the fraction of cells that exit the cell cycle after a given round of cell division. To better elucidate the role of IGF-I in the decision to proliferate versus exit the cell cycle, we determined the proportion of cells that exit the cell cycle and the complimentary proportion that reenter the cell cycle on E14-E15.
Examination of single-channel images, from histological sections double stained for BrdU and Ki67 (Fig. 4), showed that BrdU+ cells (red fluorescence) were located in several different zones within the dorsomedial cerebral wall in both Tg and control embryos (Fig. 4C). BrdU+ cells were found within the VZ, SVZ, and intermediate zone (IZ). Additionally, there were BrdU+ cells present in the CP. Ki67+ cells (Fig. 4B, green fluorescence) were located predominantly within the VZ and SVZ, and a small number of cells were found in the IZ and CP. Within the VZ, Ki67 immunostaining was detected in the vast majority of cells (Fig. 4B) in both Tg and control embryos. On rare instances, a small number of Ki67- cells were observed in the VZ of some sections; these cells likely represented newly postmitotic neurons that had not yet completed their migrations away from the VZ. DIC images were examined along with fluorescence images to ensure that immunostaining was localized within cells. Individual cell bodies were readily distinguishable on the DIC images (Fig. 4). Double-labeled cells were identified on merged images of the red, green, and DIC channels. These cells were characterized by the presence of yellow punctate staining in cell bodies (Fig. 4E). Similar BrdU and Ki67 staining patterns were observed in Tg and control embryos, and the two groups could not be easily distinguished by visual examination alone. On each scanned image, the proportions of BrdU+/Ki67- and BrdU+/Ki67+ cells were determined.
Figure 4.
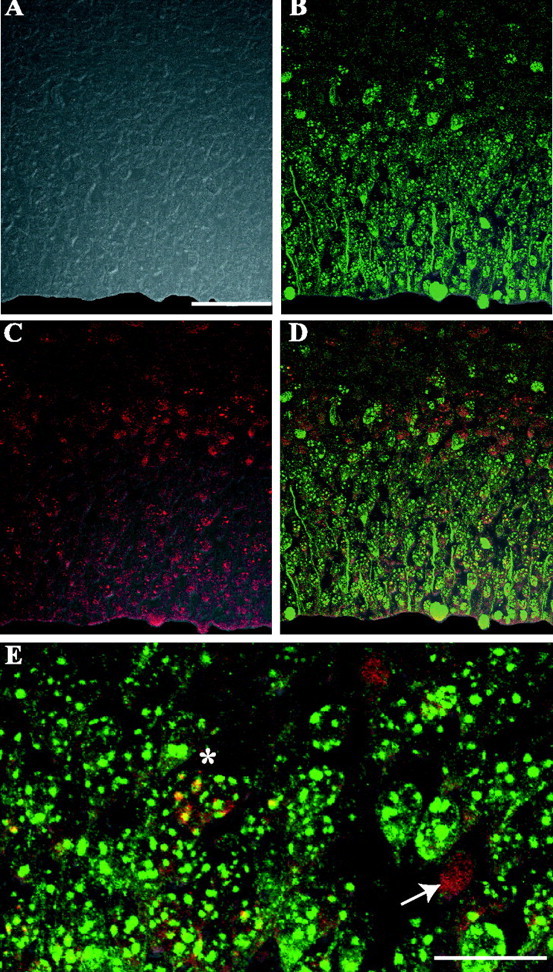
Confocal microscope immunofluorescence scans of the dorsomedial cerebral wall of a nestin/IGF-I Tg embryo at E15. Embryos were labeled with BrdU on E14 and examined 24 hr later on E15 for the presence of BrdU (red; C-E) and Ki67 (green; B, D, E) immunostaining. DIC images were collected with each scan to ensure that immunostaining was localized to cell bodies (A). All images are presented as fluorescence channels merged with corresponding DIC images. Ki67-stained proliferating cells localized within the VZ and SVZ, as well as occasional cells in the IZ (B). Nearly all VZ cells were immunoreactive for Ki67. BrdU-labeled cells were found in the VZ, SVZ/IZ, and CP (C). Counts of BrdU+/Ki67- cells (red; D, E, white arrow) and BrdU+/Ki67+ cells (yellow; D, E, white asterisk) were conducted on merged images of the green, red, and DIC channels. Scale bars: (in A) A-D, 50 μm; E, 20 μm.
The mean proportions of BrdU+/Ki67+ and BrdU+/Ki67- cells within the dorsomedial cerebral wall were compared in Tg and control animals using a 2 × 2 (groups × cell types) ANOVA. The analysis revealed a significant main effect for cell types (F = 395.137; p < 0.001). The interaction term (groups × cell types) was also significant (F = 273.600; p < 0.001), which warranted comparisons of individual mean values. Individual paired comparisons showed that the mean proportion of BrdU+/Ki67- cells was significantly lower by 15% (p < 0.001) in Tg embryos (0.416 ± 0.004) compared with controls (0.492 ± 0.005). The mean proportion of BrdU+/Ki67+ cells was 15% greater (p < 0.001) in Tg animals (0.584 ± 0.004) than in controls (0.508 ± 0.004). The control values for BrdU+/Ki67- and BrdU+/Ki67+ proportions were similar to those obtained in previous studies using these methods (Chenn and Walsh, 2002) and to previously published cell cycle exit values, determined using alternate methods (Takahashi et al., 1996; Haydar et al., 2000).
The data obtained in the above experiments showed that the proportion of cells returning to the cell cycle on E14-E15 was significantly greater in Tg embryos. Conversely, the proportion of cells that exited the cell cycle to become postmitotic was significantly reduced in Tg embryos, indicating that IGF-I promotes cell cycle reentry during cortical neurogenesis on E14-E15.
The duration of neurogenesis is normal in Tg embryos
Neurogenesis in the VZ of the developing cerebral wall typically begins on E11 and is essentially completed by E17 in normal mice (Takahashi et al., 1995). Embryos were collected on E11, E17, and E18 to determine whether the duration of neurogenesis differed between nestin/IGF-I Tg mice and controls.
On E11, the dorsomedial cerebral wall was, on average, 70 μm in thickness in both groups, measured from the ventricular surface to the pia. The cerebral wall primarily consisted of a VZ and the beginnings of a primitive plexiform zone. The VZ was ∼60 μm thick in both Tg and control embryos (Fig. 5A,B). The density of cells in the VZ, measured as the number of profiles within a 100-μm-wide sector, did not differ significantly between Tg embryos (119.5 ± 9.5) and controls (125.5 ± 6.5). Similarly, the number of cells in the primitive plexiform zone did not differ noticeably between groups (Fig. 5A, arrow). Ki67 immunostaining revealed that these cells in the primitive plexiform zone were not immunoreactive for Ki67 and, therefore, were assumed to be postmitotic. BrdU labeling showed a distinct S phase zone of cells in the VZ, which did not differ between Tg and control embryos (Fig. 5A,B). The presence of postmitotic cells in the primitive plexiform zone and a zone of S phase cells in the VZ indicated that neurogenesis had begun in both groups on E11.
Figure 5.
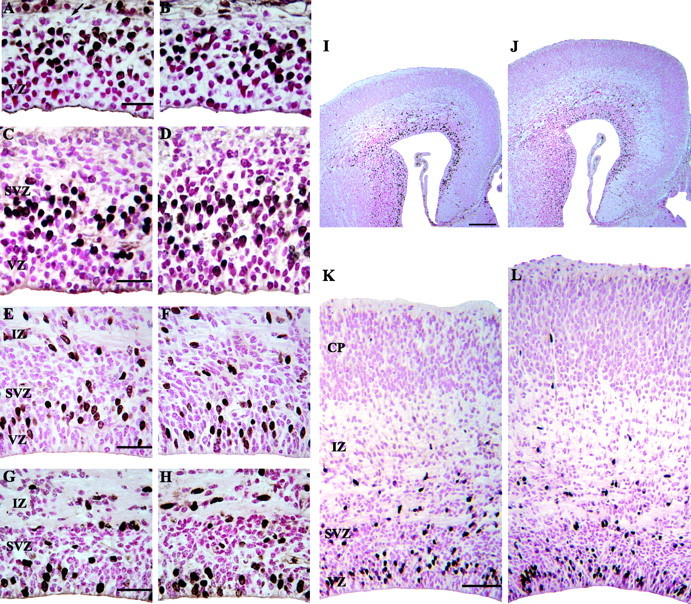
Representative photomicrographs of the dorsomedial cerebral wall at E11, E14, E17, and E18 in control (A, C, E, G) and nestin/IGF-I Tg (B, D, F, H) embryos. Embryos were labeled with BrdU and killed at 1 hr after injection. At E11, the cerebral wall consisted of the VZ and an adjacent zone of postmitotic cells (A, arrow). By E14, the SVZ was apparent adjacent to the VZ (C, D). The height of the VZ did not differ between Tg (D) and control (C) embryos. A distinct zone of BrdU-labeled cells was apparent in the VZ, indicating that progenitors were actively proliferating. At E17, the VZ was reduced in height compared with E14 embryos in both control (E) and Tg (F) embryos, but a zone of BrdU-labeled cells in S phase was still evident. Therefore, neurogenesis was still occurring at E17, but the reduced height of the VZ suggested that this process was nearing completion. Increased neuron output from the VZ was apparent in control (I, K) and Tg (J, L) embryos at E17, because the IZ and CP were increased in size by this age. By E18, a distinct VZ was not apparent in either control (G) or Tg (H) embryos. BrdU labeling showed random staining in the cells adjacent to the ventricular surface, which were likely ependymal cells. Nestin/IGF-I Tg embryos were visibly larger than control embryos by E17 (I, control; J, Tg). Closer examination of histological sections showed that the cortical plate was much larger in Tg embryos (L) compared with controls (K). Scale bars: A, C, E, G, 20 μm; I, 100 μm; K, 70 μm.
At 9:30 A.M. on E14, the mean radial thickness of the dorsomedial cerebral wall, measured from ventricular surface to pia, was ∼130 μm in both Tg and control embryos. It consisted of a prominent VZ, which did not differ noticeably between groups (Fig. 5C,D). At this time, there was no evidence for a cortical plate in either Tg or control embryos (Fig. 1C,D). By 11:00 P.M. on E14, the average thickness of the dorsomedial cerebral wall had increased to 230 μm in Tg embryos and to 220 μm in controls. A cortical plate was evident in both groups, which did not appear to differ between Tg and control embryos.
By E17, the area and thickness of the VZ were reduced in both Tg and control embryos, indicating that the VZ progenitor population was becoming depleted and cortical neurogenesis was nearing its endpoint (Fig. 5E,F). The height of the VZ in the dorsomedial cerebral wall had decreased to ∼50 μm in both groups. BrdU labeling showed a small band of S phase cells at the superficial margin of the VZ in both groups, as well as a very thin band of unlabeled cells deep to this S phase band and adjacent to the ventricular surface. These unlabeled cells had the characteristic radially aligned appearance of VZ cells, indicating that some neuron production was still occurring at this age (Fig. 5E,F). The CP was visibly larger in Tg embryos on E17 (Fig. 5I-L), with no appreciable differences in the thickness of the VZ, SVZ, or IZ.
By E18, a morphologically distinct VZ was not readily apparent in Tg and control embryos (Fig. 5G,H). BrdU-immunoreactive cells were observed immediately adjacent to the ventricular surface, but a definite S phase band of cells was not distinguishable in either group (Fig. 5G,H). The VZ appeared to be essentially replaced by randomly oriented neuroepithelial cells, characteristic of the SVZ, and by cuboidal ependymal cells, adjacent to the ventricular surface. These observations indicate that neuron production from the VZ was essentially completed some time between E17 and E18 in both groups. Therefore, the overall duration of neurogenesis in the VZ during embryonic development did not change appreciably in Tg embryos.
Discussion
The in vivo role of IGF-I in governing the dynamics of proliferation during cortical neurogenesis has not been investigated previously. In a previous report, we showed that increased expression of IGF-I in the telencephalic wall during embryonic development and in the cerebral cortex during early postnatal development produced increases in cortical plate volume (52%) and total cell number (54%) in Tg embryos by E16, as well as increases in total cortical volume (31%) and neuron number (27%) in Tg mice by postnatal day 12 (Popken et al., 2004). However, given that IGF-I is well documented to inhibit apoptosis in vitro (Bozyczko-Coyne et al., 1993; Hughes et al., 1993; Neff et al., 1993; Mathews and Feldman, 1996; Dudek et al., 1998; Blair et al., 1999; Yamada et al., 2001) and postnatally in vivo (Baker et al., 1999; Chrysis et al., 2001), it was not clear to what extent, if any, this increased cell number resulted from an IGF-I-mediated enhancement of proliferation. Parameters that regulate neurogenesis and influence neuron output include cell cycle kinetics, progenitor cell number, and the proportion of cells exiting the cell cycle after any given division (Caviness et al., 1995; Takahashi et al., 1996, 1997; Haydar et al., 2000; Chenn and Walsh, 2002). The results of the present study clearly demonstrate that increased expression of IGF-I reduces cell cycle length and augments progenitor cell reentry into the cell cycle during an otherwise normal duration of cortical neurogenesis.
Our data indicate that IGF-I regulates proliferation in the VZ corresponding to the cerebral cortex by decreasing total cell cycle length. In general, these findings are in agreement with in vitro studies showing that IGF-I promotes neuron proliferation (DiCicco-Bloom and Black, 1988; Drago et al., 1991; Ye et al., 1996; Arsenijevic et al., 2001). We also shown that IGF-I acts specifically to reduce G1 phase length during cortical neurogenesis, without affecting the lengths of the G2, M, and S phases of the cell cycle. Early studies of IGF-I proliferative action performed with cultured fibroblasts (BALB/c-3T3) indicate that IGF-I acts to stimulate progression through G1 or the G0/G1 transition (Stiles et al., 1979; Clemmons et al., 1980; Wharton et al., 1981; Russell et al., 1984; Olashaw et al., 1987). More recent studies in both myocytes (Reiss et al., 1997; Chakravarthy et al., 2000) and mammary epithelial cells (Stull et al., 2002) reached the same conclusion: that is, IGF-I promotes progression through G1 phase of the cell cycle. However, studies of estradiol-induced mitosis in the endometrium, suggest that IGF-I regulates progression through G2 phase (Adesanya et al., 1999). It may be that IGF-I affects proliferation differentially in specific tissues or when its actions are coordinated with those of other agents, such as estrogens.
The G1 phase of the cell cycle has been identified as a key regulatory point during neurogenesis in the mouse cortex (Takahashi et al., 1995a; Caviness et al., 1999). In the course of normal cortical neurogenesis, the length of G1 increases significantly from E11 to E17 as progenitors undergo successive cell cycles, whereas the lengths of other phases are constant. Consequently, TC increases over the period of neurogenesis (Takahashi et al., 1995a).
The observed increase in MI (the proportion of mitotic figures in the VZ) in Tg embryos on E14 resulted from the reduction in TC with no corresponding decrease in TM. The number of cells in M phase at any given time is proportional to TM/TC. Because TC is reduced in Tg embryos and TM is invariant, TM accounts for a greater fraction of total cell cycle length. Thus, at any given point in time the probability of detecting mitotic figures is increased in Tg embryos, and the MI increases accordingly. The shortened cell cycle in Tg embryos, therefore, explains the observed increase in MI on E14.
From cumulative BrdU-labeling experiments, we were able to measure GF, which represents the proportion of actively proliferating cells within the VZ on E14. Neuron output from the VZ may be influenced by alterations in GF. For example, a reduction in GF may result in diminished neuron production because fewer progenitor cells are actively proliferating (Haydar et al., 2000). Consistent with previously published observations (Takahashi et al., 1993, 1995; Miyama et al., 1997), we have shown that, on E14, essentially all cells in the VZ are proliferating in Tg and control embryos.
Neuron output from the proliferative zones of the developing cerebral wall is primarily dependent on the proportion of cells that exits the mitotic cycle after any given cell division (Takahashi et al., 1994, 1996, 1997; Caviness et al., 1995, 1999). Early in neurogenesis, relatively few cells exit the cell cycle as postmitotic neurons, which results in expansion of the VZ progenitor population. As neurogenesis progresses, the fraction of cells leaving the cycle exceeds 0.5, and the progenitor population becomes depleted as neuron output increases (Takahashi et al., 1996). Our data indicate that progression to the critical value of 0.5 that signals the shift from progenitor expansion to depletion is delayed in Tg embryos as more cells reenter the proliferative cycle on E14-E15. These data support the results from our previous study showing that the combined volume of VZ and SVZ was significantly increased by 26% in Tg embryos at E16 (Popken et al., 2004). Together, these data suggest that cells are retained in the cell cycle during cortical neurogenesis in Tg embryos. As more cells reenter the cycle in Tg embryos, the progenitor population expands and the potential for the production of greater numbers of neurons is increased.
Mathematical models of neurogenesis in the mouse cerebral cortex predict that decreases in the exiting fraction of cells lead to increased tangential expansion of the VZ, which results in greater total neuron output from this zone (Caviness et al., 1995, 1999, 2003; Takahashi et al., 1997). Consequently, increases in cortical thickness and total neuron number are predicted in the adult (Caviness et al., 2003). Our findings of increased cell cycle reentry at E14-E15, greater VZ/SVZ volume at E16, and increased cortical thickness (10%) and neuron number (27%) postnatally in Tg mice (Popken et al., 2004) closely match and are further supported by these mathematical models.
There was no evidence of alterations in the duration of neurogenesis in Tg embryos. Proliferating cells in the VZ appeared at approximately E11 and disappeared by E17-E18 in both Tg and control embryos. Our finding that neurogenesis in Tg embryos is of normal duration indicates that IGF-I overexpression does not override intrinsic factors governing the developmental length of this interval or increase the lifespan of progenitors in the VZ. Recently, it has been suggested that a proportion of radial glial progenitor cells from the VZ are retained at the ventricular surface into postnatal life, acting as neural stem cells (Tramontin et al., 2003). Unfortunately, the methods used in the present study did not permit an investigation of the effects of IGF-I on radial glial transformation and stem cell survival in the adult.
Neocortical neurogenesis in the VZ of the normal mouse extends from E11 through E17 and involves an average of 11 cell cycles (Takahashi et al.,1995a). The increase in neuron number in the cerebral cortex of nestin/IGF-I Tg mice (Popken et al., 2004) most likely results from an increase in the number of cell cycles completed by progenitors during neurogenesis and/or from the observed reduction in cell cycle exit. Although we have not measured cell cycle number experimentally, an increase in the number of cycles beyond the normal 11 in mice (Takahashi et al., 1995a) is theoretically possible given the 2.05 hr reduction in TC and the retention of progenitors in the cell cycle in Tg embryos. For example, Haydar et al. (2000) have shown that delayed neurogenesis and microencephaly in embryos with trisomy 16 resulted from only 10 cell cycles, attributable to lengthening of TS by 1.0 hr from E11 to E17. Therefore, increased cell cycle number may act in conjunction with reduced cell cycle exit to produce the increases in cortical neuron number documented in these Tg mice (Popken et al., 2004).
During CNS development, IGF-I is known to act as an anti-apoptotic factor in addition to its pro-mitotic function (Chrysis et al., 2001; Popken et al., 2004). The incidence of apoptosis in progenitor cells of the cerebral wall is estimated to be as low as 0.14% per day in normal mice (Haydar et al., 2000). The majority of neuronal apoptosis in the cerebral cortex occurs during early postnatal development (Spreafico et al., 1995; Thomaidou et al., 1997; Verney et al., 2000). Therefore, inhibition of apoptosis by IGF-I likely makes a relatively small contribution to neuron output from the proliferative zones of the cerebral wall.
In conclusion, we found that IGF-I accelerates the cell cycle in the developing VZ underlying the cerebral cortex by decreasing TC and enhancing progenitor cell reentry into the mitotic cycle. As a result of these effects, measurable increases in cell number are apparent in the cortical plate and cerebral cortex of Tg mice during embryonic and postnatal development.
Footnotes
This study was supported by Grant MOP37536 from the Canadian Institutes of Health Research/Canadian Neurotrauma Research Program (J.R.O.) and Grant HD08299 from the National Institute of Child Health and Human Development (A.J.D. and J.R.O.). We thank Stephen Smith for his technical assistance.
Correspondence should be addressed to John R. O'Kusky, British Columbia Research Institute for Children's and Women's Health, 950 West 28th Avenue, Vancouver, British Columbia, Canada, V5Z 4H4. E-mail: jrokusky@interchange.ubc.ca.
Copyright © 2004 Society for Neuroscience 0270-6474/04/2410201-10$15.00/0
References
- Aberg MAI, Aberg ND, Hedbacker H, Oscarsson J, Eriksson PS (2000) Peripheral infusion of IGF-I selectively induces neurogenesis in the adult rat hippocampus. J Neurosci 20: 2896-2903. [DOI] [PMC free article] [PubMed] [Google Scholar]
- Adesanya OO, Zhou J, Samathanam C, Powell-Braxton L, Bondy CA (1999) Insulin-like growth factor 1 is required for G2 progression in the estradiol-induced mitotic cycle. Proc Natl Acad Sci USA 96: 3287-3291. [DOI] [PMC free article] [PubMed] [Google Scholar]
- Anderson MF, Aberg MA, Nilsson M, Eriksson PS (2002) Insulin-like growth factor-I and neurogenesis in the adult mammalian brain. Dev Brain Res 134: 115-122. [DOI] [PubMed] [Google Scholar]
- Anderson S, Mione M, Yun K, Rubenstein JLR (1999) Differential origins of neocortical projection and local circuit neurons: role of Dlx genes in neocortical interneuronogenesis. Cereb Cortex 9: 646-654. [DOI] [PubMed] [Google Scholar]
- Anderson SA, Eisenstat DD, Shi L, Rubenstein JLR (1997) Interneuron migration from basal forebrain to neocortex: dependence on Dlx genes. Science 278: 474-476. [DOI] [PubMed] [Google Scholar]
- Anderson SA, Kaznowski CE, Horn C, Rubenstein JLR, McConnell SK (2002) Distinct origins of neocortical projection neurons and interneurons in vivo. Cereb Cortex 12: 702-709. [DOI] [PubMed] [Google Scholar]
- Arsenijevic Y, Weiss S, Schneider B, Aebischer P (2001) Insulin-like growth factor-I is necessary for neural stem cell proliferation and demonstrates distinct actions of epidermal growth factor and fibroblast growth factor-2. J Neurosci 21: 7194-7202. [DOI] [PMC free article] [PubMed] [Google Scholar]
- Atlas M, Bond VP (1965) The cell generation cycle of the eleven-day mouse embryo. J Cell Biol 26: 19-24. [DOI] [PMC free article] [PubMed] [Google Scholar]
- Ayer-Le Lievre C, Stahlbom PA, Sara VR (1991) Expression of IGF-I and -II mRNA in the brain and craniofacial region of the rat fetus. Development 111: 105-115. [DOI] [PubMed] [Google Scholar]
- Bach MA, Shen-Orr Z, Lower WL, Roberts CT, LeRoith D (1991) Insulin-like growth factor-I mRNA levels are developmentally regulated in specific regions of the brain. Mol Brain Res 10: 43-48. [DOI] [PubMed] [Google Scholar]
- Baker NL, Russo VC, Bernard O, D'Ercole AJ, Werther GA (1999) Interactions between Bcl-2 and the IGF system control apoptosis in the developing mouse brain. Dev Brain Res 118: 109-118. [DOI] [PubMed] [Google Scholar]
- Blair LAC, Bence Hanulec KK, Mehta S, Franke T, Kaplan D, Marshall J (1999) Akt-dependent potentiation of L channels by insulin-like growth factor-I is required for neuronal survival. J Neurosci 19: 1940-1951. [DOI] [PMC free article] [PubMed] [Google Scholar]
- Bondy CA, Werner H, Roberts Jr CT, LeRoith D (1990) Cellular pattern of insulin-like growth factor-I (IGF-I) and type 1 IGF receptor gene expression in early organogenesis: comparison with IGF-II gene expression. Mol Endocrinol 4: 1386-1398. [DOI] [PubMed] [Google Scholar]
- Bondy C, Werner H, Roberts Jr CT, LeRoith D (1992) Cellular pattern of type-I insulin-like growth factor receptor gene expression during maturation of the rat brain: comparison with insulin-like growth factors I and II. Neuroscience 46: 909-923. [DOI] [PubMed] [Google Scholar]
- Bozyczko-Coyne D, Glicksman MA, Prantner JE, McKenna B, Connors T, Friedman C, Dasgupta M, Neff T (1993) IGF-I supports the survival and/or differentiation of multiple types of central nervous system neurons. Ann NY Acad Sci 692: 311-313. [DOI] [PubMed] [Google Scholar]
- Brooker GJF, Kalloniatis M, Russo VC, Murphy M, Werther GA, Bartlett PF (2000) Endogenous IGF-I regulates the neuronal differentiation of adult stem cells. J Neurosci Res 59: 332-341. [DOI] [PubMed] [Google Scholar]
- Caviness Jr VS, Takahashi T, Nowakowski RS (1995) Numbers, time and neocortical neuronogenesis: a general developmental and evolutionary model. Trends Neurosci 18: 379-383. [DOI] [PubMed] [Google Scholar]
- Caviness Jr VS, Takahashi T, Nowakowski RS (1999) The G1 restriction point as critical regulator of neocortical neuronogenesis. Neurochem Res 24: 497-506. [DOI] [PubMed] [Google Scholar]
- Caviness Jr VS, Goto T, Tarui T, Takahashi T, Bhide PG, Nowakowski RS (2003) Cell output, cell cycle duration and neuronal specification: a model of integrated mechanisms of the neocortical proliferative process. Cereb Cortex 13: 592-598. [DOI] [PubMed] [Google Scholar]
- Chakravarthy MV, Abraha TW, Schwartz RJ, Fiorotto ML, Booth FW (2000) Insulin-like growth factor-I extends in vitro replicative life span of skeletal muscle cells by enhancing G1/S cell cycle progression via the activation of phosphatidylinositol 3′-kinase/Akt signaling pathway. J Biol Chem 275: 35942-35952. [DOI] [PubMed] [Google Scholar]
- Chenn A, Walsh CA (2002) Regulation of cerebral cortical size by control of cell cycle exit in neural precursors. Science 297: 365-369. [DOI] [PubMed] [Google Scholar]
- Chrysis D, Calikoglu AS, Ye P, D'Ercole AJ (2001) Insulin-like growth factor-I overexpression attenuates cerebellar apoptosis by altering the expression of Bcl family proteins in a developmentally specific manner. J Neurosci 21: 1481-1489. [DOI] [PMC free article] [PubMed] [Google Scholar]
- Clemmons DR, Van Wyk JJ, Pledger WJ (1980) Sequential addition of platelet factor and plasma to BALB/c 3T3 fibroblast cultures stimulates somatomedin-C binding early in cell cycle. Proc Natl Acad Sci USA 77: 6644-6648. [DOI] [PMC free article] [PubMed] [Google Scholar]
- D'Ercole AJ, Ye P, Calikoglu AS, Gutierrez-Ospina G (1996) The role of insulin-like growth factors in the central nervous system. Mol Neurobiol 13: 227-255. [DOI] [PubMed] [Google Scholar]
- D'Ercole AJ, Ye P, O'Kusky JR (2002) Mutant mouse models of insulin-like growth factor actions in the central nervous system. Neuropeptides 36: 209-220. [DOI] [PubMed] [Google Scholar]
- DiCicco-Bloom E, Black IB (1988) Insulin growth factors regulate the mitotic cycle in cultured rat sympathetic neuroblasts. Proc Natl Acad Sci USA 85: 4066-4070. [DOI] [PMC free article] [PubMed] [Google Scholar]
- Drago J, Murphy M, Carroll SM, Harvey RP, Bartlett PF (1991) Fibroblast growth factor-mediated proliferation of central nervous system precursors depends on endogenous production of insulin-like growth factor I. Proc Natl Acad Sci USA 88: 2199-2203. [DOI] [PMC free article] [PubMed] [Google Scholar]
- Dudek H, Datta SR, Franke TF, Birnbaum MJ, Yao R, Cooper GM, Segal RA, Kaplan DR, Greenberg ME (1998) Regulation of neuronal survival by the serine-threonine protein kinase Akt. Science 275: 661-665. [DOI] [PubMed] [Google Scholar]
- Haydar TF, Nowakowski RS, Yarowsky PJ, Krueger BK (2000) Role of founder cell deficit and delayed neuronogenesis in microencephaly of the trisomy 16 mouse. J Neurosci 20: 4156-4164. [DOI] [PMC free article] [PubMed] [Google Scholar]
- Hughes RA, Sendtner M, Thoenen H (1993) Members of several gene families influence survival of rat motoneurons in vitro and in vivo. J Neurosci Res 36: 663-671. [DOI] [PubMed] [Google Scholar]
- Kauffman SL (1966) An autoradiographic study of the generation cycle in the ten-day mouse embryo neural tube. Exp Cell Res 42: 67-73. [DOI] [PubMed] [Google Scholar]
- Kauffman SL (1968) Lengthening of the generation cycle during embryonic differentiation of the mouse neural tube. Exp Cell Res 49: 420-424. [DOI] [PubMed] [Google Scholar]
- Kee N, Sivalingam S, Boonstra R, Wojtowicz JM (2002) The utility of Ki-67 and BrdU as proliferative markers of adult neurogenesis. J Neurosci Methods 115: 97-105. [DOI] [PubMed] [Google Scholar]
- Mathews CC, Feldman EL (1996) Insulin-like growth factor-I rescues SH SY5Y human neuroblastoma cells from hyperosmotic induced programmed cell death. J Cell Physiol 166: 323-331. [DOI] [PubMed] [Google Scholar]
- Miyama S, Takahashi T, Nowakowski RS, Caviness Jr VS (1997) A gradient in the duration of the G1 phase in the murine neocortical proliferative epithelium. Cereb Cortex 7: 678-689. [DOI] [PubMed] [Google Scholar]
- Neff NT, Prevette D, Houenou JL, Lewis ME, Glicksman MA, Yin QW, Oppenheim RW (1993) Insulin-like growth factors: putative muscle-derived trophic agents that promote neuron survival. J Neurobiol 24: 1578-1588. [DOI] [PubMed] [Google Scholar]
- Noctor SC, Martinez-Cerdeno V, Ivic L, Kriegstein AR (2004) Cortical neurons arise in symmetric and asymmetric division zones and migrate through specific phases. Nat Neurosci 7: 136-144. [DOI] [PubMed] [Google Scholar]
- Nowakowski RS, Lewin SB, Miller MW (1989) Bromodeoxyuridine immunohistochemical determination of the lengths of the cell cycle and the DNA-synthetic phase for an anatomically defined population. J Neurocytol 18: 311-318. [DOI] [PubMed] [Google Scholar]
- O'Kusky JR, Ye P, D'Ercole AJ (2000) Insulin-like growth factor-I promotes neurogenesis and synaptogenesis in the hippocampal dentate gyrus during postnatal development. J Neurosci 20: 8435-8442. [DOI] [PMC free article] [PubMed] [Google Scholar]
- Olashaw NE, Van Wyk JJ, Pledger WJ (1987) Control of late G0/G1 progression and protein modification by SmC/IGF I. Am J Physiol 253: C575-C579. [DOI] [PubMed] [Google Scholar]
- Parnavelas JG (2000) The origin and migration of cortical neurones: new vistas. Trends Neurosci 23: 126-131. [DOI] [PubMed] [Google Scholar]
- Popken GJ, Hodge RD, Ye P, Zhang J, Ng W, O'Kusky JR, D'Ercole AJ (2004) In vivo effects of insulin-like growth factor-I (IGF-I) on prenatal and early postnatal development of the central nervous system. Eur J Neurosci 19: 2056-2068. [DOI] [PubMed] [Google Scholar]
- Reiss K, Cheng W, Pierzchalski P, Kodali S, Li B, Wang S, Liu Y, Anversa P (1997) Insulin-like growth factor-1 receptor and its ligand regulate the reentry of adult ventricular myocytes into the cell cycle. Exp Cell Res 235: 198-209. [DOI] [PubMed] [Google Scholar]
- Russell WE, Van Wyk JJ, Pledger WJ (1984) Inhibition of the mitogenic effects of plasma by a monoclonal antibody to somatomedin C. Proc Natl Acad Sci USA 81: 2389-2392. [DOI] [PMC free article] [PubMed] [Google Scholar]
- Scholzen T, Gerdes J (2000) The Ki-67 protein: from the known and the unknown. J Cell Physiol 182: 311-322. [DOI] [PubMed] [Google Scholar]
- Shimada M, Langman J (1970) Cell proliferation, migration and differentiation in the cerebral cortex of the golden hamster. J Comp Neurol 139: 227-244. [DOI] [PubMed] [Google Scholar]
- Spreafico R, Frassoni C, Arcelli P, Selvaggio M, De Biasi S (1995) In situ labeling of apoptotic cell death in the cerebral cortex and thalamus of rats during development. J Comp Neurol 363: 281-295. [DOI] [PubMed] [Google Scholar]
- Stiles CD, Capone GT, Scher CD, Antoniades HN, Van Wyk JJ, Pledger WJ (1979) Dual control of cell growth by somatomedins and platelet-derived growth factor. Proc Natl Acad Sci USA 76: 1279-1283. [DOI] [PMC free article] [PubMed] [Google Scholar]
- Stull MA, Richert MM, Loladze AV, Wood TL (2002) Requirement for IGF-I in epidermal growth factor-mediated cell cycle progression of mammary epithelial cells. Endocrinology 143: 1872-1879. [DOI] [PubMed] [Google Scholar]
- Takahashi T, Nowakowski RS, Caviness Jr VS (1992) BUdR as an S-phase marker for quantitative studies of cytokinetic behaviour in the murine cerebral ventricular zone. J Neurocytol 21: 185-197. [DOI] [PubMed] [Google Scholar]
- Takahashi T, Nowakowski RS, Caviness Jr VS (1993) Cell cycle parameters and patterns of nuclear movement in the neocortical proliferative zone of the fetal mouse. J Neurosci 13: 820-833. [DOI] [PMC free article] [PubMed] [Google Scholar]
- Takahashi T, Nowakowski RS, Caviness Jr VS (1994) Mode of cell proliferation in the developing mouse neocortex. Proc Natl Acad Sci USA 91: 375-379. [DOI] [PMC free article] [PubMed] [Google Scholar]
- Takahashi T, Nowakowski RS, Caviness Jr VS (1995a) The cell cycle of the pseudostratified ventricular epithelium of the embryonic murine cerebral wall. J Neurosci 15: 6046-6057. [DOI] [PMC free article] [PubMed] [Google Scholar]
- Takahashi T, Nowakowski RS, Caviness Jr VS (1995b) Early ontogeny of the secondary proliferative population of the embryonic murine cerebral wall. J Neurosci 15: 6058-6068. [DOI] [PMC free article] [PubMed] [Google Scholar]
- Takahashi T, Nowakowski RS, Caviness Jr VS (1996) The leaving or Q fraction of the murine cerebral proliferative epithelium: a general model of neocortical neuronogenesis. J Neurosci 16: 6183-6196. [DOI] [PMC free article] [PubMed] [Google Scholar]
- Takahashi T, Nowakowski RS, Caviness Jr VS (1997) The mathematics of neocortical neuronogenesis. Dev Neurosci 19: 17-22. [DOI] [PubMed] [Google Scholar]
- Tarabykin V, Stoykova A, Usman N, Gruss P (2001) Cortical upper layer neurons derive from the subventricular zone as indicated by Svet1 gene expression. Development 128: 1983-1993. [DOI] [PubMed] [Google Scholar]
- Thomaidou D, Mione MC, Cavanagh JF, Parnavelas JG (1997) Apoptosis and its relation to the cell cycle in the developing cerebral cortex. J Neurosci 17: 1075-1085. [DOI] [PMC free article] [PubMed] [Google Scholar]
- Torres-Aleman I, Naftolin F, Robbins RJ (1990) Trophic effects of insulin-like growth factor-I on fetal rat hypothalamic cells in culture. Neuroscience 35: 601-608. [DOI] [PubMed] [Google Scholar]
- Tramontin AD, Garcia-Verdugo JM, Lim DA, Alvarez-Buylla A (2003) Postnatal development of radial glia and the ventricular zone (VZ): a continuum of the neural stem cell compartment. Cereb Cortex 13: 580-587. [DOI] [PubMed] [Google Scholar]
- Verney C, Takahashi T, Bhide PG, Nowakowski RS, Caviness Jr VS (2000) Independent controls for neocortical neuron production and histogenetic cell death. Dev Neurosci 22: 125-138. [DOI] [PubMed] [Google Scholar]
- Werther GA, Cheesman H, Russo V (1993) Olfactory bulb organ culture is supported by combined insulin-like growth factor-I and basic fibroblast growth factor. Brain Res 617: 339-342. [DOI] [PubMed] [Google Scholar]
- Wharton W, Van Wyk JJ, Pledger WJ (1981) Inhibition of BALB/c-3T3 cells in late G1: commitment to DNA synthesis controlled by somatomedin C. J Cell Physiol 107: 31-39. [DOI] [PubMed] [Google Scholar]
- Yamada M, Tanabe K, Wada K, Shimoke K, Ishikawa Y, Ikeuchi T, Koizumi S, Hatanaka H (2001) Differences in survival-promoting effects and intracellular signaling properties of BDNF and IGF-1 in cultured cerebral cortical neurons. J Neurochem 78: 940-951. [DOI] [PubMed] [Google Scholar]
- Ye P, Xing Y, Dai Z, D'Ercole AJ (1996) In vivo actions of insulin-like growth factor-I (IGF-) on cerebellum development in transgenic mice: evidence that IGF-I increases proliferation of granule cell progenitors. Brain Res Dev Brain Res 95: 44-54. [DOI] [PubMed] [Google Scholar]
- Zackenfels K, Oppenheim RW, Rohrer H (1995) Evidence for an important role of IGF-I and IGF-II for the early development of chick sympathetic neurons. Neuron 14: 731-741. [DOI] [PubMed] [Google Scholar]