

Abstract
Mutations of the gene coding for PAK3 (p21-activated kinase 3) are associated with X-linked, nonsyndromic forms of mental retardation (MRX) in which the only distinctive clinical feature is the cognitive deficit. The mechanisms through which PAK3 mutation produces the mental handicap remain unclear, although an involvement in the mechanisms that regulate the formation or plasticity of synaptic networks has been proposed. Here we show, using a transient transfection approach, that antisense and small interfering RNA-mediated suppression of PAK3 or expression of a dominant-negative PAK3 carrying the human MRX30 mutation in rat hippocampal organotypic slice cultures results in the formation of abnormally elongated dendritic spines and filopodia-like protrusions and a decrease in mature spine synapses. Ultrastructural analysis of the changes induced by expression of PAK3 carrying the MRX30 mutation reveals that many elongated spines fail to express postsynaptic densities or contact presynaptic terminals. These defects are associated with a reduced spontaneous activity, altered expression of AMPA-type glutamate receptors, and defective long-term potentiation. Together, these data identify PAK3 as a key regulator of synapse formation and plasticity in the hippocampus and support interpretations that these defects might contribute to the cognitive deficits underlying this form of mental retardation.
Keywords: rat, dendritic spines, Rho signaling, cognitive mechanisms, synaptogenesis, transfection
Introduction
Mental retardation is a frequent cause of cognitive disability that includes a substantial genetic component (Chelly and Mandel, 2001; Ramakers, 2002). The repertoire of X-linked genes implicated in mental retardation has expanded very rapidly in the past years (Ropers et al., 2003). Thirteen different genes have been identified until now, and their contribution to the mental handicap has been revealed by mutation detection. Among these is the gene coding for PAK3 (p21-activated kinase 3), which is mutated in several affected families (Allen et al., 1998; Bienvenu et al., 2000; Chelly and Mandel, 2001; Gedeon et al., 2003). For PAK3 as for the other X-linked mental retardation (MRX) genes, the mechanisms responsible for the cognitive disability remain unknown, although several recent studies point to possible defects in the development, formation, or properties of synaptic networks (Zhang et al., 2003; Govek et al., 2004; Hayashi et al., 2004).
PAK3 belongs to a family of proteins that are highly expressed in the brain and particularly in the hippocampus, in which they show a diffuse distribution throughout the soma and proximal dendrites (Allen et al., 1998). PAK proteins are activated by binding of Rac and Cdc42 (cell division cycle 42), two small GTPases of the Rho family (Bagrodia et al., 1995; Hall, 1998; Luo, 2000). Rac and Cdc42 are highly conserved regulators of the actin cytoskeleton and function as molecular switches integrating extracellular and intracellular signals to control actin rearrangement. They participate in various physiological mechanisms, such as cell adhesion and migration, dendritic development, and spine morphogenesis (Hall, 1998; Luo, 2000; Nakayama et al., 2000; Ridley, 2001; Sin et al., 2002). The evidence linking some MRX genes and PAK proteins to Rho-GTPase signaling has therefore promoted the idea that cases of mental retardation could result from abnormalities in the regulation of the actin cytoskeleton and development of synaptic networks (Ramakers, 2002). Evidence from analyses of human brains indeed indicates that nonspecific mental retardation is associated with an increased proportion of long, tortuous, thin spines (Purpura, 1974). Furthermore, recent studies of the role of GIT1 (GRK-interacting protein) and oligophrenin-1, two other proteins involved in mental retardation, as well as studies of the fragile X model of mental retardation, show abnormalities of dendrites and dendritic spines and defects in glutamatergic transmission and plasticity (Comery et al., 1997; Kaufmann and Moser, 2000; Zhang et al., 2003; Govek et al., 2004). More recently, analysis of a mouse expressing a dominant-negative peptide for PAK proteins further demonstrated that this family of kinases is involved in the regulation of spine morphology, plasticity, and long-term memory (Hayashi et al., 2004).
However, the specific role of PAK3 remains unclear, as well as the mechanisms through which human mutations of PAK3 alter synaptic development. To address this question, we investigated here, using an in vitro expression system, whether and how PAK3 protein affected the morphological and functional properties of dendritic spines and synapses in hippocampal slice cultures. We show that antisense or small interfering RNA (siRNA)-mediated suppression of PAK3 or expression of dominant-negative PAK3 gene carrying the human MRX30 mutation affect spine morphogenesis and synapse formation in the hippocampus, reproducing the phenotype described in human cases of mental retardation.
Materials and Methods
Constructs and siRNAs. pcDNA3.1 plasmids were used to code for EGFP (enhanced green fluorescent protein) and for different mouse PAK3 constructs kindly provided by C. A. Walsh (Harvard Medical School, Boston, MA). The PAK3 constructs included wild-type (WT) PAK3 (Bagrodia et al., 1995), PAK3 carrying the human MRX30 mutation created by site-directed mutagenesis (Allen et al., 1998), and a PAK3 kinase dead mutant [K297R, Kdead (Bagrodia et al., 1995)]. Full-length mouse PAK3 was subcloned in reverse into pcDNA3.1 to generate the antisense construct. Wild-type mouse PAK3 was inserted into a pEGFP-C1 fusion vector (Clontech, Cambridge, UK) to localize PAK3 protein in neurons. pDsRed1-N1 was used as control in cotransfection experiments. siRNAs were obtained from Qiagen (Hilden, Germany) (HiPerformance 2-For-Silencing duplexes). Target sequences for PAK3 were 5′ TAGCAGCACATCAGTCGAATA 3′ (si-PAK3-1) and 5′ CCCAATATTGTCAATTATTTA 3′ (si-PAK3-2). Both sequences resulted in a similar phenotype, but only data obtained with si-PAK3-1 are shown here. The sequence used as nonsilencing control was 5′ AATTCTCCGAACGTGTCACGT 3′. For the experiments in fibroblasts, we used pSUPER-siGFP as control vector for PAK3 (gift from F. Iseni, Department of Microbiology, University of Geneva School of Medicine, Geneva, Switzerland).
Cultures and transfection. Mouse NIH 3T3 fibroblasts were maintained in DMEM supplemented with 10% fetal calf serum and penicillin-streptomycin. Cells were cotransfected with pEGFP-C1-PAK3 and empty vector or PAK3 antisense construct or pSUPER-siGFP at 90% confluence by Lipofectamine 2000 (Invitrogen, San Diego, CA) according to the instructions of the manufacturer.
Rat organotypic hippocampal slice cultures were prepared as described previously (Stoppini et al., 1991). Cultures were maintained 11-12 d in vitro and transfected using the gene gun (Bio-Rad, Hercules, CA) technique according to the instructions of the manufacturer. Plasmid DNAs at a ratio of 25 μg of pcDNA3.1-EGFP to 45 μg of pcDNA3.1-PAKs were precipitated onto 10 mg 1.6 μm gold microcarriers. Transfection of 10-30 cells per slice culture was reproducibly obtained, and expression was transient between 24 and 96 hr, with a peak at 48 hr. Control experiments showed that cells cotransfected with EGFP and pDsRed constructs expressed green and red fluorescence in all cases (n = 7). siRNAs were cotransfected with an EGFP plasmid: 40 μg of siRNA duplex with 20 μg of plasmid were coated onto 10 mg gold particles.
Flow cytometry, reverse transcription-PCR, and immunofluorescence. NIH 3T3 fibroblasts were harvested 2 d after transfection, washed with PBS, and fixed with 2% paraformaldehyde in PBS. Ten thousand healthy cells were counted from each dish with FACScan machine (Becton Dickinson, Mountain View, CA), and the percentage of GFP-positive cells was analyzed.
Real-time quantitative reverse transcription (RT)-PCR for PAK1, PAK2, and PAK3 were performed using the SYBR Green approach (Bio-Rad) according to the instructions of the manufacturer on Neuro2A neuroblastoma cell lines transfected with either EGFP or EGFP and siRNA of PAK3 or EGFP and PAK3 antisense construct. Transfected cells were sorted with a fluorescence-activated cell sorter (FACS) 2 d after the transfection, and RNA was extracted by Trizol. For quantification, ribosomal protein S9 was used as standard gene. Data are presented as percentage of the levels obtained in control, EGFP-transfected cells.
For immunocytochemistry, slice cultures were fixed 2 d after transfection with 4% paraformaldehyde in PBS, pH 7.4, at 4°C for 30 min. Slices were washed three times with PBS and permeabilized with methanol at -20°C for 10 min. Slices were blocked with 3% bovine serum albumin (BSA) in PBS and 0.2% Tween 20 for 1 hr at room temperature, incubated with a primary polyclonal goat anti-PAK3 antibody (N-19; dilution, 1:100 in PBS, 3% BSA, and 0.2% Tween 20) (Santa Cruz Biotechnology, Santa Cruz, CA), and kept overnight at 4°C. The following day, cultures were rinsed three times in PBS and incubated with rabbit anti-goat fluorescein-conjugated secondary antibody (Jackson ImmunoResearch, West Grove, PA) in PBS and 0.2% Tween 20 (1:100) for 2 hr at room temperature. After three washes, slices were mounted on glass slides with FluorSave medium (Calbiochem, La Jolla, CA) and imaged with an LSM510 confocal microscope (Zeiss, Oberkochen, Germany). Quantitative analyses were performed using MetaMorph software (Universal Imaging Corporation, West Chester, PA). The average intensity measured in the soma of transfected cells was compared with the mean values obtained from three nontransfected neighbor cells at fixed contrast and were corrected for nonspecific, background immunostaining.
Image acquisition and analysis. Two days after transfection, hippocampal organotypic cultures were submerged in a chamber perfused with an extracellular medium containing the following (in mm): 124 NaCl, 1.6 KCl, 2.5 CaCl2, 1.5 MgCl2, 24 NaHCO3, 1.2 KH2PO4, 10 glucose, and 2 ascorbic acid, pH 7.4 (saturated with 95% O2 and 5% CO2; temperature of 33°C). Imaging of dendritic and axonal segments was performed through a 60× water immersion objective using a Bio-Rad MRC1024 confocal scanning system or a Visitron (Puchheim, Germany) spinning-disk confocal system and a two-line excitation laser (488 and 514 nm). Control experiments showed that repetitive imaging under those conditions did not affect the morphology or viability of transfected cells. Z-stacks of 50- to 200-μm-long dendritic segments were taken on secondary and tertiary dendrites of CA1 pyramidal neurons, and the characteristics of dendritic protrusions were measured using NIH Image or MetaMorph software. The parameters analyzed included protrusion density and length (measured from the limit of the dendrite to the tip of the protrusion), size of spine head (taken as the larger diameter), as well as varicosity density on axonal segments. All spine measurements were made on individual Z-stack images of CA1 dendritic segments without corrections for z-axis projection and without introducing any threshold. Dendritic protrusions were defined as spines when they exhibited a characteristic enlargement at the tip. Thin protrusions without enlargement were defined as filopodia-like protrusions.
Electrophysiology. Transfected, EGFP-expressing CA1 pyramidal cells were recorded 2 d after transfection using whole-cell patch-clamp techniques. Slice cultures were transferred to a submerged recording chamber, and the connections between the CA3 and CA1 regions were sectioned to prevent epileptiform discharges during application of GABA receptor antagonists. Slices were continuously perfused with extracellular medium (see above) supplemented with 50 μm picrotoxin or 20 μm bicuculline methochloride and 3 μm 2,3-dihydroxy-6-nitro-7-sulfonyl-benzo[f]quinoxaline (NBQX). Recordings were performed on CA1 pyramidal cells, identified by fluorescence and video microscopy. As controls, we used pyramidal cells located in the vicinity of transfected neurons within the same cultures. Other control experiments showed that EGFP or WT PAK3 transfection did not affect the electrophysiological properties of pyramidal neurons (data not shown).
Whole-cell recordings were performed using patch electrodes filled with a solution containing the following (in mm): 120 Cs methanesulfonate, 10 CsCl, 10 HEPES, 0.1 BAPTA, 4 MgCl2, 14 phosphocreatine, 2 Na2-ATP, 0.4 Na2-GTP, and 5 QX-314 [2(triethylamino)-N-(2,6-dimethylphenyl) acetamine], pH 7.2-7.3 adjusted with CsOH (osmolarity, 295-310 mOsm). In current-clamp experiments, Cs methanesulfonate was replaced with 120 mm K+ gluconate. Paired-pulse facilitation of synaptic responses was induced by delivering paired stimulations to Schaffer collaterals at interstimulus intervals of 20-500 msec. AMPA EPSCs were obtained at -70 mV under voltage-clamp conditions. Outward NMDA EPSCs were recorded at +40mV in the presence of NBQX (20 μm) and bicuculline (20 μm). Long-term potentiation (LTP) was induced using a pairing protocol: five times, four stimulations at 100 Hz every 200 msec with concomitant postsynaptic cell depolarization at -40 mV. All recordings were obtained using an Axopatch 200B amplifier (Axon Instruments, Foster City, CA), filtered at 2 kHz, and digitized at 5-10 kHz. Data acquisition and analyses were performed using a homemade analog-to-digital converter and software.
Electron microscopy. The morphology of transfected cells was studied at the EM level using a photoconversion approach. Fluorescent-transfected cells were injected live with Lucifer yellow using whole-cell patch-clamp electrodes. Slices were fixed with 4% paraformaldehyde and 2% glutaraldehyde, washed in phosphate buffer, and processed for photo-oxidation under a fluorescence microscope (Axioskop 2; Zeiss). For this, slices were preincubated in DAB solution (1.5 mg/ml, 10 min) and put in a drop of fresh DAB solution on the stage of a microscope, and the selected place was illuminated at 450-490 nm excitation wavelength using a 25× objective. After 7-10 min, fluorescence staining was replaced by a dark DAB precipitate, and the reaction was stopped by washing in 0.1 m Tris buffer, pH 8.2. After additional fixation with 3% glutaraldehyde overnight, the slices were postfixed with 1% osmium tetroxide, dehydrated, and embedded in Epon. For serial EM studies, ribbons of up to 80 sections (50-70 nm thick) were cut with an Ultracut-E microtome (Leica, Deer-field, IL), collected on Formvar-coated single-slotted copper grids, and stained with aqueous uranyl acetate and lead citrate. The sections were analyzed on a Philips CM 10 electron microscope at 80 kV, and photos were taken at magnifications of 8900-21,000×.
Results
Modifications of PAK3 expression in hippocampal neurons
To investigate the role of PAK3 in synaptic mechanisms, we used an expression system based on the transfection of hippocampal slice cultures, a good model for studies of synaptic development and plasticity. Transfections were performed using a biolistic approach and vectors expressing EGFP and various PAK3 constructs: wild-type PAK3, PAK3 antisense, PAK3 RNAi oligos, PAK3 carrying the human MRX30 mutation, and PAK3 carrying a second mutation (K297R) (Fig. 1A). The MRX30 mutation was produced by a C-to-T transition, which changes an arginine codon to a stop codon, thus truncating the protein in a region essential for its kinase activity. The Kdead mutation also resulted in a dysfunctional kinase domain. With both mutations, the regulatory domain remained unaffected. They were therefore expected to produce dominant-negative effects in transfected cells.
Figure 1.

Modulation of PAK3 expression by transfection in hippocampal slice cultures. A, Organization of PAK3 protein and structure of PAK3 constructs inserted in a pcDNA3.1 vector under the control of a cytomegalovirus promoter. MRX30 and Kdead mutations resulted in a nonfunctional kinase domain. AS, Antisense; CRIB, Cdc42/Rac-interactive binding site; Ctrl, control. B, Illustration of pyramidal cells transfected with EGFP and PAK3 antisense constructs. Scale bar, 20 μm. C, Expression of an EGFP-PAK3 fusion protein in CA1 cells reveals a diffuse localization of PAK3 in dendrites and dendritic spines. Scale bar, 2 μm. D, Cotransfection of a pyramidal cell with EGFP and wild-type PAK3 (left) and revealed using a specific anti-PAK3 antibody (right). Note the increased immunostaining in the transfected cell compared with other cells in the same focal plane. Scale bar, 20 μm. E, Cotransfection with EGFP and PAK3 antisense (left) analyzed using anti-PAK3 immunostaining (right). Note the reduced level of immunostaining in the antisense-transfected cell. Scale bar, 20 μm. F, Reduced expression of PAK3 in two cells cotransfected with EGFP and PAK3 siRNA oligos (left) and analyzed using anti-PAK3 immunostaining (right). Scale bar, 20 μm. G, Quantitative analysis of the level of anti-PAK3 immunostaining measured under the indicated conditions in 10-13 different cells obtained from four to six different slice cultures. *p < 0.05.
Slice cultures were transfected after 11-13 d in vitro (Fig. 1B), and the efficiency of transfection was verified using different fluorescent reporter constructs and/or PAK3 immunocytochemistry. PAK3 is a soluble protein that is preferentially expressed in neurons, particularly in the hippocampus. Immunocytochemical analysis of PAK3 expression in slice cultures showed, as reported previously (Allen et al., 1998), that the protein is present throughout the soma and dendritic arborization of pyramidal cells. Generation of an EGFP-PAK3 fusion construct further indicated that tagged PAK3 is also expressed in dendritic spines of CA1 cells (Fig. 1C).
To investigate the role of PAK3 in spine morphogenesis, we then analyzed the effects produced by transient overexpression of wild-type PAK3 or by PAK3 suppression through an antisense or siRNA strategy. Figure 1D illustrates the increased level of expression of PAK3 immunostaining observed in a cell cotransfected with EGFP (left panel) and wild-type PAK3 gene (right panel). As estimated by comparing the level of immunofluorescence expressed in the soma of control cells and cells expressing WT PAK3, transfected neurons expressed a 2.2 ± 0.3-fold increase in PAK3 protein (n = 10; p < 0.05). To assess the efficacy of PAK3 antisense transfection, we first cotransfected NIH 3T3 cells, which are devoid of endogenous PAK3 protein, with an EGFP-tagged PAK3 construct together with or without PAK3 antisense and assessed the level of EGFP fluorescence expressed in these cells with an FACS. These experiments revealed a 34.5 ± 5% reduction (n = 7; p < 0.01) in the overall level of EGFP fluorescence expressed by cells cotransfected with the antisense construct, thus indicating interference with expression of the EGFP-PAK3 fusion protein (data not shown). To further verify this in slice cultures, we then directly analyzed the level of PAK3 immunostaining observed in pyramidal neurons transfected with an empty vector or with PAK3 antisense. Figure 1E shows the example of two closely apposed pyramidal neurons cotransfected with EGFP and PAK3 antisense (left panel) and expressing a markedly reduced PAK3 immunostaining (right panel) compared with nontransfected cells present in the focal plane in the same slice. Quantitative assessment of the level of PAK3 immunostaining present in the soma of antisense transfected cells versus control pyramidal neurons showed a marked and significant reduction in the level of PAK3 expression in transfected cells (43 ± 6.6% reduction; n = 10; p < 0.01). We then used the same approach to test the effect of transfection with PAK3 siRNA oligos. Figure 1F shows two cells transfected with EGFP and siRNA that also expressed a markedly reduced level of PAK3 immunostaining. Quantitative comparison of the level of immunostaining obtained in control and siRNA-transfected neurons revealed a 60 ± 4.4% reduction (n = 13; p < 0.01) in staining intensity. The changes in level of immunostaining are summarized in Figure 1G.
To verify the specificity of the antisense and siRNA approaches with regard to PAK3, we analyzed their effects on the level of expression of PAK1 and PAK2 measured using quantitative RT-PCR in transfected neuroblastoma cells (Fig. 2A). The results show that, although siRNA transfection markedly reduced the level of PAK3 messenger compared with EGFP-transfected cells (80% reduction; n = 3; p < 0.05), no detectable changes with regard to PAK1 or PAK2 expression levels could be detected [97 ± 9% (PAK1 with PAK3 siRNA); 106 ± 16% (PAK2 with PAK3 siRNA); 107 ± 5% (PAK1 with PAK3 antisense); 97 ± 10% (PAK2 with PAK3 antisense); n = 3]. To verify this further in slice cultures, we also compared the levels of immunostaining for PAK1 and PAK2 observed in PAK3 siRNA-transfected CA1 neurons. These analyses (Fig. 2B,C) showed that the levels of immunostaining observed in transfected cells did not differ from those of neighboring control cells [96 ± 6% (PAK1 siRNA) and 106 ± 3% (PAK2 siRNA); n = 9-12]. Western blot analyses made on transfected fibroblasts further confirmed that siRNA transfection reduced PAK3 expression without altering PAK1 protein levels (data not shown). We conclude therefore that the transfection approaches used here specifically targeted PAK3 without interfering with PAK1 and/or PAK2 protein levels.
Figure 2.

Specific alteration of PAK3 expression by PAK3 siRNA transfection. A, Level of expression of PAK1, PAK2, and PAK3 mRNA in neuroblastoma cells transfected with either EGFP or EGFP and a PAK3 siRNA oligo (n = 3; *p < 0.05). B, C, Immunostaining analysis of PAK1 and PAK2 expression in pyramidal cells transfected with an EGFP-PAK3 siRNA construct. The left panels illustrate the EGFP-transfected cells, and the right panels show the levels of PAK1 (B) and PAK2 (C) immunoreactivity in the same cells. Quantitative analyses of immunostaining levels (expressed as percentage of the control levels obtained in neighboring cells) show no modifications in PAK3 siRNA-transfected neurons (ratio of 96 ± 6% for PAK1, n = 12; 106 ± 3% for PAK2, n = 9). Scale bars, 20 μm.
PAK3 contributes to spine morphogenesis
We then investigated the effects of these constructs on cell morphology by analyzing fluorescent, transfected cells 2 d after transfection, using live confocal imaging. Although these experiments revealed no detectable changes in the organization of the dendritic arbors of transfected cells, important differences could be observed at the level of dendritic spines. As illustrated in Figure 3A, cells transfected with PAK3 antisense exhibited many elongated, tortuous dendritic spines as well as numerous thin, filopodia-like protrusions instead of the stubby or mushroom-type spines usually observed in EGFP-transfected, control cells. A very comparable phenotype was also obtained by transfection with PAK3 siRNA oligos (Fig. 3A). To quantitatively analyze the phenotype produced by PAK3 suppression, we measured the length of all protrusions and defined three main protrusion categories: filopodia, defined as long, thin protrusions without enlargements at the tip; elongated spines, characterized by a small head and a length of >2 μm; and regular spines (< 2 μm), which essentially included stubby or mushroom-type spines. A blind morphometric analysis of cells transfected with PAK3 antisense revealed a clear increase in the proportion of filopodia [4.5 ± 1.3% (PAK3 antisense), n = 7 vs 0.5 ± 0.3% (EGFP control), n = 9; p < 0.005] and of elongated spines (9.1 ± 2.9 vs 3.5 ± 1%; p < 0.05) associated with a decrease in regular spines (86.3 ± 3.8 vs 96 ± 1.4%; p < 0.05; total protrusions analyzed, 538 EGFP control and 630 PAK3 antisense) (Fig. 3B-D). A similar effect was observed after siRNA transfection: the proportion of filopodia increased markedly (8.9 ± 1.8%, siRNA, n = 11 vs 0.8 ± 0.35%, control nonsense siRNA, n = 8; p < 0.01), as well as that of elongated spines (14.2 ± 2.6 vs 4.65 ± 0.9%; p < 0.01), whereas the proportion of regular spines decreased (77 ± 3.6 vs 94.5 ± 0.8%; p < 0.01; total protrusions analyzed, 612 control nonsense siRNA and 891 PAK3 siRNA). These effects were observed with two different PAK3 siRNA oligos, although only the data obtained with one of them are shown. In contrast, the spine morphology observed in cells overexpressing wild-type PAK3 did not differ from that of control, EGFP-transfected neurons (total protrusions analyzed, 538 EGFP control and 260 wild-type PAK3 overexpression) (Fig. 3B-D). Also, the overall protrusion density was not found to be different between the conditions tested (93 ± 7 protrusions/100 μm, control; 97 ± 10, si-control; 94 ± 6, WT; 101 ± 5, siRNA; 90 ± 5, antisense), indicating that the increase in filopodia and elongated spines occurred mainly at the expense of regular, stubby, or mushroom-type spines. Thus, PAK3 overexpression produced no apparent phenotype, whereas PAK3 suppression obtained through transfection of either PAK3 antisense or PAK3 siRNA oligos was associated with the formation of elongated spines and filopodia-like protrusions and a reduction in stubby or mushroom-type spines.
Figure 3.

Changes in spine morphology induced by antisense or siRNA downregulation of PAK3 expression. A, Illustration of the spine morphology obtained from cells cotransfected with EGFP and an empty vector (Ctrl), a control, nonsense siRNA oligo (siCtrl), wild-type PAK3 (WT), PAK3 siRNA oligo (siRNA), or PAK3 antisense (AS). Scale bars. 2 μm. Note the numerous elongated spines (arrows) and filopodia-like protrusions (asterisks) present in siRNA- and antisense-transfected cells. B, Changes in the proportion of regular spines (<2 μm in length), corresponding mainly to stubby and mushroom-type spines, observed under the indicated conditions. Data are mean ± SEM of measurements obtained from 7-11 experiments (260-891 protrusions analyzed). *p < 0.05. C, Changes in the proportion of filopodia observed in the same group of experiments). *p < 0.05. D, Changes in the proportion of elongated spines (>2 μm in length) observed in the same group of experiments. *p < 0.05.
To further confirm these results, we then also transfected pyramidal neurons with PAK3 gene expressing the human MRX30 or Kdead mutations that were expected to produce dominant-negative effects. As illustrated in Figure 4A, transfection of pyramidal cells with PAK3 gene expressing either of these two mutations reproduced qualitatively the phenotype observed with PAK3 antisense and PAK3 siRNA oligos. Quantitative measurements (Fig. 4B-E) confirmed this, showing a marked increase in the proportion of elongated spines (9.4 ± 1% for MRX, n = 7, p < 0.01; 9.4 ± 2.5% for Kdead, n = 7, p < 0.05) and of filopodia-like protrusions (15 ± 3.5% for MRX, p < 0.01; 9.4 ± 2.8% for Kdead, p < 0.01) and a reduction of stubby or mushroom-type spines (75.6 ± 4.3% for MRX, p < 0.01; 81.2 ± 2.5% for Kdead, p < 0.01; total protrusions analyzed, 344 MRX and 244 Kdead). Overall, the mean length of all dendritic spines observed in PAK3 antisense-, PAK3 siRNA-, PAK3 MRX30-, or PAK3 Kdead-transfected neurons was found to be significantly longer than that observed in EGFP- or WT-transfected cells (antisense, 1.34 ± 0.06 μm, p < 0.05; PAK3 siRNA, 1.46 ± 0.06, p < 0.01; MRX30, 1.46 ± 0.06, p < 0.05; Kdead, 1.33 ± 0.07, p < 0.05; vs EGFP, 1.12 ± 0.07 μm or WT PAK3, 1.17 ± 0.05, p < 0.05). The cumulative distribution of spine lengths illustrated in Figure 4E shows accordingly a shift to the right of the distribution, confirming the homogeneity of the phenotype observed with these different constructs. Together, these results point to a requirement of PAK3 activity to maintain spine morphology.
Figure 4.

Changes in spine morphology produced by expression of dominant-negative PAK3 constructs carrying the human MRX30 mutation or Kdead mutation. A, Illustration of the spine morphology observed in cells cotransfected with EGFP and an empty vector (Ctrl), PAK3 MRX30 gene (MRX), or PAK3 carrying the Kdead mutation (Kdead). Arrows point to elongated spines, and asterisks indicate filopodia-like protrusions. Scale bars, 2 μm. B, Changes in the proportion of regular spines (<2 μm in length), observed under the indicated conditions. Data are mean ± SEM of measurements obtained from seven experiments per condition (244-344 protrusions analyzed). *p < 0.05. C, Changes in the proportion of filopodia observed in the same group of experiments. *p < 0.05. D, Changes in the proportion of elongated spines (>2 μm in length) observed in the same group of experiments. *p < 0.05. E, Cumulative plots of the distribution of spine lengths observed under the indicated conditions. Note the shift to the right observed in conditions of reduced PAK3 expression or expression of dominant-negative PAK3 (black symbols).
PAK3 MRX30 mutation affects the formation of the PSD and establishment of a synaptic contact
Because PAK3 mutation is associated with mental retardation, we went on by investigating the possible functional consequences of these morphological defects focusing on cells transfected with dominant-negative PAK3 carrying the human MRX30 mutation. In a first group of experiments, we undertook to examine the fine structural organization of abnormal spines. For this, we injected transfected cells with Lucifer yellow and through photoconversion proceeded with EM analyzes, serial sectioning, and three-dimensional (3D) reconstruction of dendritic protrusions. Figure 5A illustrates images observed with an EGFP-transfected and Lucifer yellow-injected control cell. It shows a single section of a stained dendritic spine with its PSD (postsynaptic density) and the 3D reconstruction exhibiting a piece of dendrite and two distinct spines. The red parts in the 3D reconstruction represent the PSDs. Figure 5B illustrates a typical example of images obtained from cells transfected with PAK3 gene carrying the MRX30 mutation. The single section shows a long, filopodia-like protrusion, and the 3D reconstruction illustrates two spines (asterisks) and three filopodia-like protrusions (arrows) present on the same dendritic segment. Note that the filopodia-like protrusions are devoid of PSDs. The proportion of elongated spines or filopodia-like structures in these dominant-negative PAK3 MRX30-transfected cells was markedly increased (36.1 ± 3.6%, n = 7, 190 protrusions analyzed vs 6.3 ± 3.1%, n = 3, 83 protrusions analyzed; p < 0.01) when compared with control cells, thus confirming the confocal data. Also, the same analysis showed a significant increase in the length of dendritic protrusions when comparing PAK3 MRX30-transfected and control, EGFP-transfected cells (1.36 ± 0.04 vs 0.92 ± 0.03 μm; n = 3-7; p < 0.05).
Figure 5.
3D reconstruction of spines and filopodia-like protrusions of EGFP- and MRX30-transfected cells. A, Left, Single-section electron micrograph of a dendritic spine and its PSD obtained after photoconversion of a control, EGFP-transfected cell. Right, 3D reconstruction of a dendritic segment with two spine synapses. B, Left, Single-section electron micrographs of a filopodia-like protrusion devoid of PSD and presynaptic partner and obtained by photoconversion of an MRX30-transfected neuron. Right, 3D reconstruction of a dendritic segment obtained from an MRX30-transfected neuron showing two small spine synapses (asterisks) and three unconnected filopodia-like protrusions lacking PSDs (arrows). Scale bars, 0.5 μm.
Interestingly, the elongated protrusions reconstructed from PAK3 MRX30-transfected cells exhibited characteristics of both filopodia and dendritic spines. In some cases, the protrusions had enlargements at the tip that mimicked a spine head, but the necks were considerably longer and the spine heads were in fact devoid of PSD and lacked the presence of a presynaptic structure with docked vesicles facing them (Fig. 6A). They probably therefore represented growing spines unable to form a synaptic contact. In other cases, the protrusions clearly resembled dendritic filopodia, with no spine head-like enlargement of the tip, but some of these nevertheless expressed a small PSD at the tip and were facing a presynaptic terminal with a few docked vesicles (Fig. 6B). These structures could therefore represent growing filopodia in the process of forming a spine. Together, the accumulation of these structures after PAK3 MRX30 transfection suggests a defect in the capacity of establishing mature spine synapses.
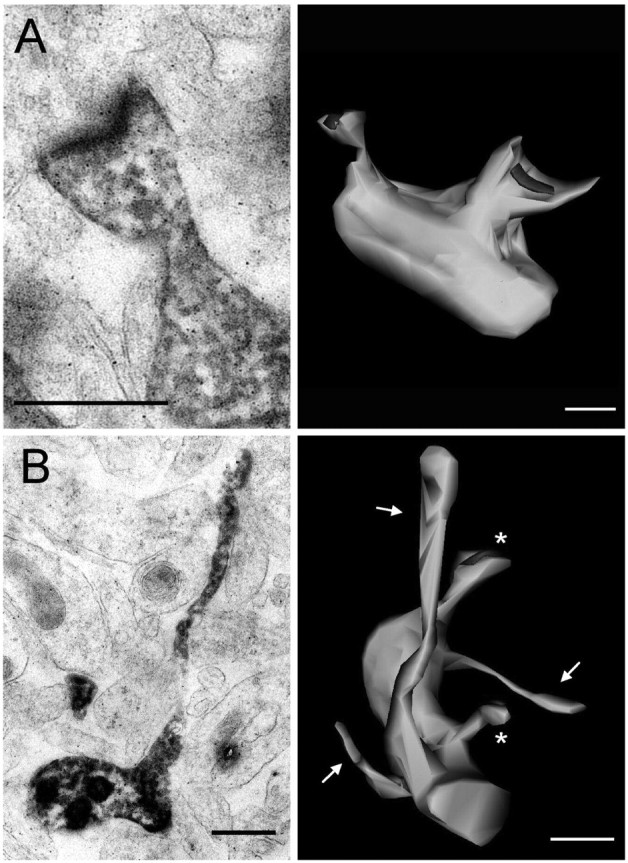
Figure 6.

Morphological characteristics of elongated spine protrusions observed in MRX30-transfected cells. A, Single-section electron micrograph (left) and 3D reconstruction (right) of a thin, elongated spine protrusion devoid of PSD and synaptic contact and obtained by photoconversion of an MRX30-transfected neuron. B, Single-section electron micrograph (left) and 3D reconstruction (right) of a thin, elongated spine protrusion exhibiting a very small head and small PSD, obtained by photoconversion of an MRX30-transfected neuron. Scale bar, 0.5 μm. C, Proportion of unconnected dendritic protrusions devoid of PSDs or presynaptic partner (black columns) and proportion of mature spine synapses (gray columns) in control (Ctrl) and PAK3 MRX30-transfected neurons (n = 3-7; 83-190 protrusions analyzed). *p < 0.01. D, PSD length of spine synapses measured on single sections in control (gray column) and PAK3 MRX30-transfected (black column) neurons (n = 3-7; 42-86 PSDs analyzed). *p < 0.05.
To analyze this process quantitatively, we assessed the proportion of dendritic protrusions that were unconnected and also measured the mean length of PSDs observed on single sections. As shown on Figure 6C, the proportion of unconnected structures averaged 6.3 ± 3.1% in control cells but increased to 42.6 ± 3.5% in PAK3 MRX30-transfected neurons (n = 3-7; p < 0.01). As a result, the proportion of morphologically mature spine synapses (with a spine head, PSD, and presynaptic partner) was markedly reduced (Fig. 6C). Measurements of the PSD length of all protrusions further showed a significant reduction in PAK3 MRX30-transfected versus control cells (n = 3-7; 42-86 PSDs analyzed; p < 0.05) (Fig. 6D). This difference was mainly attributable to an increase in the proportion of spines with very small heads and small PSDs [PSD length <0.20 μm (Fig. 6B); 22% in control cells vs 42% in PAK3 MRX30-transfected neurons]. Thus, expression of mutated, dominant-negative PAK3 resulted in the growth of elongated dendritic protrusions but also interfered with the formation of the PSD and of mature synaptic contacts.
PAK3 MRX30 mutation results in alteration of synaptic transmission and plasticity
To examine the possible functional consequences of this defect, we proceeded to whole-cell patch-clamp recordings of fluorescent, transfected CA1 pyramidal cells. Analysis of the electrophysiological characteristics of PAK3 MRX30-transfected and control neurons showed no differences in basal physiological properties (input resistance, 175 ± 9 vs 170 ± 9 MΩ, n = 6; action potential amplitude and duration, 69 ± 1.3 mV, 1.7 ± 0.2 msec vs 71 ± 1.5 mV, 1.6 ± 0.1 msec; n = 6). In contrast, recordings of spontaneous miniature excitatory synaptic currents in the presence of TTX and a GABAA receptor antagonist (picrotoxin, 50 μm) showed that their frequency was reduced by ∼30% in PAK3 MRX30 versus control cells (0.8 ± 0.1 vs 1.2 ± 0.1 Hz; n = 6; p < 0.05) (Fig. 7A,B). The amplitude of miniature currents did not, however, differ significantly between the two groups of neurons (Fig. 7C). Because the decrease in frequency of spontaneous events could result from a reduced presynaptic release probability, we also measured paired-pulse facilitation, another presynaptic property that varies as a function of release characteristics. As shown on Figure 8A, paired-pulse facilitation, measured as the ratio of slopes of the second versus first EPSCs evoked by paired stimulation, did not change at any of the stimulation intervals tested. In contrast, the ratio of AMPA/NMDA types of glutamate receptors contributing to evoked excitatory responses significantly differed (Fig. 8B,C). This ratio varies as a function of synapse maturation and is altered by induction of synaptic plasticity (Isaac et al., 1995; Liao et al., 1995). Comparison of evoked AMPA receptor-mediated EPSCs recorded at -70 mV with NMDA receptor-dependent responses obtained in the same cell at +40 mV (in the presence of 20 μm NBQX and 20 μm bicuculline) shows a significant reduction of the AMPA/NMDA ratio in cells expressing the mutated PAK3 gene compared with control cells (0.67 ± 0.03 vs 0.8 ± 0.04; n = 6; p < 0.05). However, the size of evoked NMDA currents did not differ between control and PAK3 MRX30-transfected neurons (72.5 ± 6.7 vs 71.6 ± 5.9 pA; n = 6). Thus, expression of mutated PAK3 interfered with expression of AMPA receptors at the synapse.
Figure 7.

PAK3 MRX30-transfected cells show reduced spontaneous miniature activity. A, Illustration of spontaneous miniature EPSCs recorded in control and PAK3 MRX30-transfected CA1 neurons. B, Mean frequency of miniature EPSCs recorded in six control (Ctrl) and six PAK3 MRX30-transfected neurons. *p < 0.05. C, The mean amplitude of spontaneous miniature EPSCs does not significantly differ in control and PAK3 MRX30-transfected cells (n = 6).
Figure 8.

PAK3 MRX30 mutation is associated with altered postsynaptic properties and defects in synaptic plasticity. A, Paired-pulse facilitation does not differ between control (Ctrl) and PAK3 MRX30-transfected cells (n = 6). B, Illustration of AMPA and NMDA EPSCs evoked by the same stimulation pulses in control and PAK3 MRX30-transfected cells. C, Quantitative assessment of AMPA/NMDA ratio measured in six control (gray column) and six PAK3 MRX30-transfected (black column) neurons. *p < 0.05. D, PAK3 MRX30-transfected cells show alterations of synaptic plasticity. Changes in EPSP slope induced by a pairing protocol in five control and seven PAK3 MRX30-transfected neurons. Data are mean ± SEM. Differences are statistically significant (p < 0.01).
Because these mechanisms are likely to contribute to properties of synaptic plasticity (Malinow and Malenka, 2002), we then also assessed the capacity of these cells to express LTP. LTP was induced by pairing theta burst stimulation and depolarization in five control and seven PAK3 MRX30-transfected cells. The results illustrated in Figure 8D indicate that LTP, measured at 30 min after stimulation, was markedly impaired in cells expressing the PAK3 MRX30 gene compared with control cells (115.6 ± 4%, n = 7 vs 146.5 ± 2%, n = 5; p < 0.01). Note that the effect was predominant on the late phases of the potentiation. Thus, expression of dominant-negative MRX30 PAK3 gene prevented expression of stable LTP.
Discussion
Together, these results provide evidence that PAK3 is an important regulator of spine synapse formation in developing networks. They show that transient suppression of PAK3 or transient expression of dominant-negative forms of PAK3, such as PAK3 carrying the human MRX30 mutation, in hippocampal pyramidal cells results in alterations of spine shape, reduction in the number of mushroom-type or stubby spines, growth of protrusions that are unable to form mature synaptic contacts, and impaired synaptic transmission and plasticity.
The morphological abnormalities observed here resemble the changes reported after brain examination of mentally retarded infants (Purpura, 1974). As reported in Purpura's studies, we found a marked increase in the proportion of elongated, thin, and tortuous dendritic spines, as well as a great proportion of filopodia-like protrusions. These changes were consistently observed after both antisense- and siRNA-mediated suppression of PAK3, as well as by expression of dominant-negative forms of PAK3, such as PAK3 carrying the human MRX30 mutation or the Kdead mutation, which both affect the catalytic domain of the kinase. In contrast expression of various control constructs or wild-type PAK3 gene did not reproduce the phenotype, clearly demonstrating the specificity of the effect. These results thus point to a key role of PAK3 in the regulation of spine formation and suggest that PAK3 phosphorylation activity is required for spine morphogenesis.
Curiously, however, the phenotype observed here with PAK3 suppression or dominant-negative forms of PAK3 is at variance with the phenotype reported recently in a transgenic mouse model expressing a dominant-negative peptide for PAK proteins (Hayashi et al. 2004). In these transgenic animals, no phenotype could be detected in the hippocampus, although PAK3 is highly expressed in this structure. In contrast, changes were reported in the frontal cortex and included spine enlargements and increased LTP. These differences in phenotype can probably be accounted for by the differences in genetic approach used. We selected here constructs (antisense, siRNA, MRX30, and Kdead) that specifically targeted PAK3, whereas the dominant-negative peptide overexpressed in the transgenic mouse model affected all PAK proteins. Several PAK proteins contribute to the regulation of Rho-GTPase signaling, and they might be involved at different levels of these cascades. For example, PAK1 is usually considered to act downstream of Rac, whereas PAK3 has also been proposed to act either upstream or independently of Rac (Obermeier et al., 1998; Bokoch, 2003; Loo et al., 2004). Differences in regulatory or effector molecules, but also in subcellular distribution or activation, of these PAK proteins might account for differential effects. A second reason might have to do with the level of expression of the transgenes. We obtained here strong expression and a reproducible phenotype with all four PAK3 targeted constructs used, although the absence of changes observed in the hippocampus of the transgenic mice raises the possibility of insufficient dominant-negative effect, at least on PAK3. It remains that both studies reached the conclusion that PAK proteins are involved in spine morphogenesis, with the present results clearly pointing to a key involvement of PAK3 in the hippocampus.
The mechanisms through which PAK3 produces these effects remain an intriguing question. PAK1 has been proposed to work downstream of Rac1 and Cdc42, regulating actin filament assembly, and LIM (the three gene products Lin-11, Isl-1, and Mec-3) kinase and cofilin signalization (Edwards et al., 1999). The role and functions of PAK3 are much less understood, but an involvement in Rac signaling is also postulated. Consistent with this interpretation, interference with expression or activity of different components of Rho or Rac signaling has been shown to affect the shape or density of dendritic spines. Enhanced Rac1 activity was reported to induce the formation of multiple dendritic protrusions similar to the phenotype observed here (Nakayama et al., 2000; Zhang et al., 2003), whereas dominant-negative Rac1 was associated with a reduced spine density (Luo et al., 1996). LIM kinase knock-out mice also show abnormalities in spine morphology and PSDs (Meng et al., 2002). More recently, it was found that ephrinB receptors, through translocation of kalirin and activation of Rac1 and PAK1, markedly promoted dendritic spine morphogenesis during development (Penzes et al., 2003), whereas, conversely, reduced expression of kalirin decreased spine density (Ma et al., 2003). Interestingly, the phenotype observed here with PAK3 suppression or dominant-negative PAK3 resembles very much the phenotype associated with expression of a dominant-negative mutant of GIT1 that results in mislocalized activation of Rac1 (Zhang et al., 2003). GITs can interact with PIX, a PAK-interacting exchange factor, and may serve as a link between PAK3 and PIX, regulating in this way the subcellular localization of PAK3 activity (Loo et al., 2004). As proposed for dominant-negative GIT1 (Zhang et al., 2003), the effect of PAK3 suppression could result in mislocalized activation of Rac1. Interestingly, a mutation of PIX has also been reported to be associated with mental retardation (Kutsche et al., 2000). Together, these data support the interpretation that interactions between PAK3, GIT1, and PIX could be important in regulating the mechanisms that control spine and synapse formation. With oligophrenin-1 (Govek et al., 2004), they provide thus an additional example of a gene responsible for X-linked, nonsyndromic mental retardation that directly participates in the control of spine morphogenesis. They are also consistent with and support the hypothesis that abnormalities in Rho-GTPase signaling are a prominent cause of MRX diseases (Ramakers, 2002).
Although the present data provide clear evidence that interference with PAK3 activity affects spine shape and number, they further suggest that the kinase could also be implicated in the formation of a functional synaptic contact. Many of the filopodia-like protrusions induced by PAK3 dominant-negative mutation were devoid of postsynaptic densities or expressed only very small PSDs and/or lacked presynaptic partners. It is interesting in this respect that Rac1 signaling has also been implicated in receptor aggregation at inhibitory interneurons (Meyer et al., 2000) and that reduced kalirin expression was associated with a redistribution of PSD markers, as well as elimination of presynaptic endings (Ma et al., 2003). Furthermore, in Drosophila, PIX mutation is associated with defects in the stabilization of postsynaptic structures, an effect that involves a PAK homolog (Parnas et al., 2001). It might be therefore that PAK3 signaling also contributes to the regulation of PSD formation, a step that is probably critical for the establishment of a synaptic contact.
Another important piece of information provided by these results is that the alterations of spine morphology observed with expression of the dominant-negative PAK3 MRX30 mutant have clear functional consequences. We found a reduced spontaneous activity that is consistent with the observed reduction in the number of stubby or mushroom-type spines and the marked increase in unconnected protrusions, a result consistent with the idea of a reduced number of functional synapses. Similarly, the changes in glutamate receptor ratios could reflect the existence of numerous immature spines with small heads and no or only small PSDs. There is evidence that these structures are more likely to exclusively express NMDA type of receptors and thus be silent (Ganeshina et al., 2004) and that actin-dependent mechanisms participate in the regulation of AMPA receptor expression (Kim and Lisman, 2002; Fukazawa et al., 2003). Alteration of these mechanisms and of the recycling of AMPA receptors could eventually account for the defects observed at the level of PSDs. The same alterations could also be involved in the disability to express synaptic plasticity and particularly long-term potentiation. Much evidence indicates that AMPA receptor recycling is a critical event responsible for the changes in synaptic efficacy. Alternatively, PAK3-mediated signaling might be required for structural plasticity and the spine enlargements, remodeling of PSDs, or even spine formation mechanisms believed to be associated with induction of long-term potentiation. The blockade of LTP was indeed predominant in the late phases of the potentiation, a period during which spine and synapse formation have been reported (Engert and Bonhoeffer, 1999; Maletic-Savatic et al., 1999; Toni et al., 1999). Transient PAK3 suppression might thus preferentially affect spine synapses undergoing turnover or involved in plasticity-induced remodeling (Luscher et al., 2000; Trachtenberg et al., 2002). The proportion of such synapses, as estimated in the somatosensory cortex, could be compatible with the number of elongated, filopodia-like protrusions observed here (Trachtenberg et al., 2002). Accordingly, an important consequence of PAK3 suppression could be to alter the capacity of activity-dependent remodeling of synaptic networks, a mechanism that is likely to play a major role during development for the refinement of synaptic connections and for information processing.
In summary, the present data provide evidence that PAK3 is involved in the signaling cascades regulating synapse formation and function in the hippocampus. Reduced expression of PAK3 or expression of dominant-negative PAK3 carrying the human MRX30 mutation markedly affected spine morphogenesis, prevented the formation of stable, mature synapses, and disrupted expression of synaptic plasticity. These defects are likely to alter the capacity of signal integration by synaptic networks and could contribute to the cognitive disabilities associated with PAK3 mutations in humans.
Footnotes
This work was supported by Swiss Science Foundation Grant 31-56852.99, the Desirée and Nils Yde's Foundation, the Jérôme Lejeune Foundation, the Jules Thorn Charitable Trust, the Swiss Telethon Foundation, and a European Synscaff project. We thank Dr. C. Mas for thoughtful discussion, Prof. C. A. Walsh and A. Chenn for providing the PAK3 constructs, and P. Corrèges for statistical support.
Correspondence should be addressed to D. Muller, Department of Basic Neuroscience, Centre Medical Universitaire, 1211 Geneva 4, Switzerland. E-mail: dominique.muller@medecine.unige.ch.
Copyright © 2004 Society for Neuroscience 0270-6474/04/2410816-10$15.00/0
References
- Allen KM, Gleeson JG, Bagrodia S, Partington MW, MacMillan JC, Cerione RA, Mulley JC, Walsh CA (1998) PAK3 mutation in nonsyndromic X-linked mental retardation. Nat Genet 20: 25-30. [DOI] [PubMed] [Google Scholar]
- Bagrodia S, Taylor SJ, Creasy CL, Chernoff J, Cerione RA (1995) Identification of a mouse p21Cdc42/Rac activated kinase. J Biol Chem 270: 22731-22737. [DOI] [PubMed] [Google Scholar]
- Bienvenu T, des Portes V, McDonell N, Carrie A, Zemni R, Couvert P, Ropers HH, Moraine C, van Bokhoven H, Fryns JP, Allen K, Walsh CA, Boue J, Kahn A, Chelly J, Beldjord C (2000) Missense mutation in PAK3, R67C, causes X-linked nonspecific mental retardation. Am J Med Genet 93: 294-298. [DOI] [PubMed] [Google Scholar]
- Bokoch GM (2003) Biology of the p21-activated kinases. Annu Rev Biochem 72: 743-781. [DOI] [PubMed] [Google Scholar]
- Chelly J, Mandel JL (2001) Monogenic causes of X-linked mental retardation. Nat Rev Genet 2: 669-680. [DOI] [PubMed] [Google Scholar]
- Comery TA, Harris JB, Willems PJ, Oostra BA, Irwin SA, Weiler IJ, Greenough WT (1997) Abnormal dendritic spines in fragile X knockout mice: maturation and pruning deficits. Proc Natl Acad Sci USA 94: 5401-5404. [DOI] [PMC free article] [PubMed] [Google Scholar]
- Edwards DC, Sanders LC, Bokoch GM, Gill GN (1999) Activation of LIM-kinase by Pak1 couples Rac/Cdc42 GTPase signalling to actin cytoskeletal dynamics. Nat Cell Biol 1: 253-259. [DOI] [PubMed] [Google Scholar]
- Engert F, Bonhoeffer T (1999) Dendritic spine changes associated with hippocampal long-term synaptic plasticity. Nature 399: 66-70. [DOI] [PubMed] [Google Scholar]
- Fukazawa Y, Saitoh Y, Ozawa F, Ohta Y, Mizuno K, Inokuchi K (2003) Hippocampal LTP is accompanied by enhanced F-actin content within the dendritic spine that is essential for late LTP maintenance in vivo. Neuron 38: 447-460. [DOI] [PubMed] [Google Scholar]
- Ganeshina O, Berry RW, Petralia RS, Nicholson DA, Geinisman Y (2004) Differences in the expression of AMPA and NMDA receptors between axospinous perforated and nonperforated synapses are related to the configuration and size of postsynaptic densities. J Comp Neurol 468: 86-95. [DOI] [PubMed] [Google Scholar]
- Gedeon AK, Nelson J, Gecz J, Mulley JC (2003) X-linked mild nonsyndromic mental retardation with neuropsychiatric problems and the missense mutation A365E in PAK3. Am J Med Genet 120A: 509-517. [DOI] [PubMed] [Google Scholar]
- Govek EE, Newey SE, Akerman CJ, Cross JR, Van der Veken L, Van Aelst L (2004) The X-linked mental retardation protein oligophrenin-1 is required for dendritic spine morphogenesis. Nat Neurosci 7: 364-372. [DOI] [PubMed] [Google Scholar]
- Hall A (1998) Rho GTPases and the actin cytoskeleton. Science 279: 509-514. [DOI] [PubMed] [Google Scholar]
- Hayashi ML, Choi SY, Rao BS, Jung HY, Lee HK, Zhang D, Chattarji S, Kirkwood A, Tonegawa S (2004) Altered cortical synaptic morphology and impaired memory consolidation in forebrain-specific dominant-negative PAK transgenic mice. Neuron 42: 773-787. [DOI] [PubMed] [Google Scholar]
- Isaac JT, Nicoll RA, Malenka RC (1995) Evidence for silent synapses: implications for the expression of LTP. Neuron 15: 427-434. [DOI] [PubMed] [Google Scholar]
- Kaufmann WE, Moser HW (2000) Dendritic anomalies in disorders associated with mental retardation. Cereb Cortex 10: 981-991. [DOI] [PubMed] [Google Scholar]
- Kim CH, Lisman JE (2002) A labile component of AMPA receptor-mediated synaptic transmission is dependent on microtubule motors, actin, and N-ethylmaleimide-sensitive factor. J Neurosci 21: 4188-4194. [DOI] [PMC free article] [PubMed] [Google Scholar]
- Kutsche K, Yntema H, Brandt A, Jantke I, Nothwang HG, Orth U, Boavida MG, David D, Chelly J, Fryns JP, Moraine C, Ropers HH, Hamel BC, van Bokhoven H, Gal A (2000) Mutations in ARHGEF6, encoding a guanine nucleotide exchange factor for Rho GTPases, in patients with X-linked mental retardation. Nat Genet 26: 247-250. [DOI] [PubMed] [Google Scholar]
- Liao D, Hessler NA, Malinow R (1995) Activation of postsynaptically silent synapses during pairing-induced LTP in CA1 region of hippocampal slice. Nature 375: 400-404. [DOI] [PubMed] [Google Scholar]
- Loo TH, Ng YW, Lim L, Manser E (2004) GIT1 activates p21-activated kinase through a mechanism independent of p21 binding. Mol Cell Biol 24: 3849-3859. [DOI] [PMC free article] [PubMed] [Google Scholar]
- Luo L (2000) Rho GTPases in neuronal morphogenesis. Nat Rev Neurosci 1: 173-180. [DOI] [PubMed] [Google Scholar]
- Luo L, Hensch TK, Ackerman L, Barbel S, Jan LY, Jan YN (1996) Differential effects of the Rac GTPase on Purkinje cell axons and dendritic trunks and spines. Nature 379: 837-840. [DOI] [PubMed] [Google Scholar]
- Luscher C, Nicoll RA, Malenka RC, Muller D (2000) Synaptic plasticity and dynamic modulation of the postsynaptic membrane. Nat Neurosci 3: 545-550. [DOI] [PubMed] [Google Scholar]
- Ma XM, Huang J, Wang Y, Eipper BA, Mains RE (2003) Kalirin, a multi-functional Rho guanine nucleotide exchange factor, is necessary for maintenance of hippocampal pyramidal neuron dendrites and dendritic spines. J Neurosci 23: 10593-10603. [DOI] [PMC free article] [PubMed] [Google Scholar]
- Maletic-Savatic M, Malinow R, Svoboda K (1999) Rapid dendritic morphogenesis in CA1 hippocampal dendrites induced by synaptic activity. Science 283: 1923-1927. [DOI] [PubMed] [Google Scholar]
- Malinow R, Malenka RC (2002) AMPA receptor trafficking and synaptic plasticity. Annu Rev Neurosci 25: 103-126. [DOI] [PubMed] [Google Scholar]
- Meng YH, Zhang Y, Tregoubov V, Janus C, Cruz L, Jackson M, Lu WY, MacDonald JF, Wang JY, Falls DL, Jial ZP (2002) Abnormal spine morphology and enhanced LTP in LIMK-1 knockout mice. Neuron 35: 121-133. [DOI] [PubMed] [Google Scholar]
- Meyer DK, Olenik C, Hofmann F, Barth H, Leemhuis J, Brunig I, Aktories K, Norenberg W (2000) Regulation of somatodendritic GABAA receptor channels in rat hippocampal neurons: evidence for a role of the small GTPase Rac1. J Neurosci 20: 6743-6751. [DOI] [PMC free article] [PubMed] [Google Scholar]
- Nakayama AY, Harms MB, Luo L (2000) Small GTPases Rac and Rho in the maintenance of dendritic spines and branches in hippocampal pyramidal neurons. J Neurosci 20: 5329-5338. [DOI] [PMC free article] [PubMed] [Google Scholar]
- Obermeier A, Ahmed S, Manser E, Yen SC, Hall C, Lim L (1998) PAK promotes morphological changes by acting upstream of Rac. EMBO J 17: 4328-4339. [DOI] [PMC free article] [PubMed] [Google Scholar]
- Parnas D, Haghighi AP, Fetter RD, Kim SW, Goodman CS (2001) Regulation of postsynaptic structure and protein localization by the Rho-type guanine nucleotide exchange factor dPix. Neuron 32: 415-424. [DOI] [PubMed] [Google Scholar]
- Penzes P, Beeser A, Chernoff J, Schiller MR, Eipper BA, Mains RE, Huganir RL (2003) Rapid induction of dendritic spine morphogenesis by trans-synaptic ephrinB-EphB receptor activation of the Rho-GEF kalirin. Neuron 37: 263-274. [DOI] [PubMed] [Google Scholar]
- Purpura DP (1974) Dendritic spine “dysgenesis” and mental retardation. Science 186: 1126-1128. [DOI] [PubMed] [Google Scholar]
- Ramakers GJ (2002) Rho proteins, mental retardation and the cellular basis of cognition. Trends Neurosci 25: 191-199. [DOI] [PubMed] [Google Scholar]
- Ridley AJ (2001) Rho family proteins: coordinating cell responses. Trends Cell Biol 11: 471-477. [DOI] [PubMed] [Google Scholar]
- Ropers HH, Hoeltzenbein M, Kalscheuer V, Yntema H, Hamel B, Fryns JP, Chelly J, Partington M, Gecz J, Moraine C (2003) Nonsyndromic X-linked mental retardation: where are the missing mutations? Trends Genet 19: 316-320. [DOI] [PubMed] [Google Scholar]
- Sin WC, Haas K, Ruthazer ES, Cline HT (2002) Dendrite growth increased by visual activity requires NMDA receptor and Rho GTPases. Nature 419: 475-480. [DOI] [PubMed] [Google Scholar]
- Stoppini L, Buchs PA, Muller D (1991) A simple method for organotypic cultures of nervous tissue. J Neurosci Methods 37: 173-182. [DOI] [PubMed] [Google Scholar]
- Toni N, Buchs PA, Nikonenko I, Bron CR, Muller D (1999) LTP promotes formation of multiple spine synapses between a single axon terminal and a dendrite. Nature 402: 421-425. [DOI] [PubMed] [Google Scholar]
- Trachtenberg JT, Chen BE, Knott GW, Feng G, Sanes JR, Welker E, Svoboda K (2002) Long-term in vivo imaging of experience-dependent synaptic plasticity in adult cortex. Nature 420: 788-794. [DOI] [PubMed] [Google Scholar]
- Zhang H, Webb DJ, Asmussen H, Horwitz AF (2003) Synapse formation is regulated by the signaling adaptor GIT1. J Cell Biol 161: 131-142. [DOI] [PMC free article] [PubMed] [Google Scholar]