

Abstract
In mammals, the pontine nucleus locus ceruleus (LC) is the sole source of norepinephrine (NE) projections to the forebrain. Increasing tonic discharge of LC neurons elevates extracellular levels of NE in the cortex and thalamus. Tonic LC discharge is linked to the level of wakefulness and behavioral performance, demonstrating an optimal firing rate during sustained attention tasks. Iontophoretic application of NE to target neurons in the forebrain has been shown to produce a diverse set of neuromodulatory actions, including augmentation of synaptically evoked discharge as well as suppression of spontaneous and stimulus-evoked firing patterns. Iontophoretic studies cataloged potential NE effects; however, the context in which such actions could occur in awake behaving animals remained controversial. To address this issue, the current study examined the effects of increasing tonic LC output on spontaneous and stimulus-evoked discharge of neurons within the ventroposterior medial (VPM) thalamus and barrel field (BF) somatosensory cortex of awake animals using multichannel extracellular recording strategies. The present findings indicate two primary outcomes that result from increasing frequencies of LC stimulation, either an inverted-U facilitating response profile or monotonic suppression of sensory-evoked neuronal responses. Increased tonic LC output generally decreased neuronal response latency measures for both BF cortical and VPM thalamic cells. LC-mediated effects on target VPM and BF cortical neuron sensory processing are consistent with previous demonstrations of NE modulatory actions on central neurons but indicate that such actions are cell specific. Moreover, clear differences were observed between the modulation of VPM and BF cortical cells. These data suggest that sensory signal processing is continually altered over the range of tonic LC discharge frequencies that occur in the waking animal. Such changes may account for LC-mediated shifts in sensory network performance across multiple stages of arousal and attention.
Keywords: locus ceruleus, norepinephrine, dose-response relationship, somatosensory cortex, somatosensory thalamus, single-unit recording
Introduction
Projections from the pontine nucleus locus ceruleus (LC) innervate the thalamus and cerebral cortex (Foote et al., 1983) and are capable of simultaneously releasing norepinephrine (NE) in thalamic and cortical circuits that sequentially process like-modality sensory information (e.g., the rodent trigeminal somatosensory pathway). LC neurons exhibit a range of low tonic firing rates that are linearly related to NE efflux in target tissue across the range of LC firing rates typically observed during the sleep-wake cycle (Florin-Lechner et al., 1996; Berridge and Abercrombie, 1999). Increasing LC discharge rates are correlated with forebrain EEG activation (Berridge and Foote, 1991), transitions from slow wave sleep to waking (Aston-Jones and Bloom, 1981), and progression from drowsy, low arousal states to alert, highly vigilant states (Rajkowski et al., 1994; Usher et al., 1999). The highest rates of tonic LC discharge are correlated with distractibility or labile attentiveness and associated with active waking and exploration (Foote et al., 1980). Thus, increases in tonic LC output and subsequent NE release are implicated in the regulation of behavioral state and state-dependent cognitive processes.
Exogenous application of NE onto single cells within the cerebellum, cerebral cortex, hippocampus, hypothalamus, and thalamus has been shown to modulate neuronal responses to non-monoaminergic synaptic inputs. These actions include the following: (1) general suppression of neuronal firing; (2) selective reduction of spontaneous versus stimulus-evoked discharge yielding “signal/noise” ratio increases; (3) augmentation of stimulus-induced inhibition of spontaneous firing rate; (4) absolute potentiation of stimulus-evoked excitatory discharge; and (5) “gating” of responses to otherwise subthreshold synaptic inputs (for review, see Berridge and Waterhouse, 2003). Additional effects of NE on the temporal structure of neuronal responses to synaptic stimuli have also been demonstrated (Kossl and Vater, 1989; McCormick et al., 1991; George, 1992; Holdefer and Jacobs, 1994). However, local application techniques in vivo do not insure delivery of NE at all noradrenergic synapses on a cell nor allow for the fact that LC efferent fibers distribute to multiple sites within a local circuit and along the neural pathway in which that circuit operates. The widespread distribution of noradrenergic fibers along neural pathways within the forebrain implies that NE release can have multiplicative effects on serially processed information, yet the net influence of the LC/NE system on signal processing through sequentially organized neural networks has not been studied intensively. Furthermore, the limited ability to link the above observations to normal modes of LC discharge and NE efflux and, likewise, extend these studies to the waking condition has made it difficult to draw firm conclusions about how fluctuating LC activity states would impact the ability of cells, circuits, and neuronal networks to process incoming signals in a behaving animal.
Given these considerations, the purpose of the current study was to determine whether NE-like-mediated effects on stimulus-evoked responses of sensory neurons could be demonstrated within the awake, freely moving animal during periods of increased output from the LC efferent pathway. An additional goal was to characterize LC-mediated effects on thalamic and cortical cells over a range of tonic LC stimulation frequencies that mimic physiological firing rates.
Materials and Methods
Extracellular recordings of multiple single units were taken from six adult male Long-Evans hooded rats (Charles River Laboratories, Wilmington, MA) weighing 250-450 gm. Animals were housed in a light (12 hr on and 12 hr off)-, temperature-, and humidity-controlled environment with food and water available ad libitum. Neuronal recordings were obtained during daylight hours (i.e., when the lights were normally on). All procedures were done in accordance with National Institutes of Health guidelines on research and animal care and were approved by the Institutional Animal Care and Use Committee of Drexel University College of Medicine.
Animals and surgical procedures. All animals received microwire implants in the barrel field (BF) somatosensory cortex, the ipsilateral ventroposterior medial (VPM) thalamus, and the ipsilateral LC. Additionally, a stimulation electrode was passed under the skin and anchored at the base of a single whisker in the whisker pad. Detailed methods for surgical preparation, recording strategies, and data analysis have been described previously (Nicolelis and Chapin, 1994; Nicolelis et al., 1997; Devilbiss and Waterhouse, 2002). Briefly, anesthesia was induced intraperitoneally as a mixture of 390 mg/kg chloral hydrate (Sigma, St. Louis, MO) and 25 mg/kg pentobarbital sodium (Abbott Laboratories, North Chicago, IL) solution and supplemented with additional injections of 100 mg/kg chloral hydrate-10 mg/kg pentobarbital solution to maintain a surgical plane of anesthesia. With the head placed at a 15° angle (nose down) within a stereotaxic frame, a small craniotomy was performed at 1.2 mm lateral and 3.6 mm caudal to the intersection of the midline and lambda to allow the vertical placement of a microwire bundle into the LC. After careful removal of the dura to avoid damage to the sagittal sinus, the electrode bundle was slowly lowered (∼50 μm/min) to an approximate depth of 6.0 mm. The electrode bundle (SB103; NB Labs, Dennison, TX) contained eight 50 μm Teflon-coated, stainless steel microwires bound together with a silk suture. During placement of the electrode bundle, neuronal electrical activity was monitored to guide accurate placement within the LC. The characteristic spontaneous discharge rate (∼0.1-5 Hz) and the biphasic response to tail pinch (Akaike, 1982) were two criteria used to identify putative LC neurons. The skull opening was then sealed with Gelfoam, and the probe was attached to the skull with dental acrylic.
After realignment of the head to flat skull position, additional openings were made at -3.3 anteroposterior (A/P) and -2.8 mediolateral (M/L) and at -2.5 A/P and -5.8 M/L (with respect to bregma) for placement of the VPM and BF cortex microwire recording probes based on coordinates from the atlas of Paxinos and Watson (1986) as well as Waite (1973). The VPM electrode array (SB103; NB Labs) was cut (approximate length, 10 mm) with a sharp pair of scissors on a diagonal to correspond to the anatomical structure of the VPM barreloids (Van der Loos, 1976) and bound with a silk suture. The dura was removed, and the microwire bundle was slowly lowered to an approximate depth of 5.5 mm. Neuronal electrical activity was monitored to guide placement of the electrode to the representation of C3 vibrissas within the VPM thalamus. The BF cortical microwire array (S103; NB Labs) was slowly lowered into the BF cortex to an approximate depth of 1.2 mm. Again, neuronal activity was monitored during probe insertion to evaluate the position of the microwire bundle as it approached a final target in layer II/III, IV, or V of the C3 whisker representation in the BF cortex. The dura was covered with Gelfoam, and each probe was secured to the skull with dental cement. Before the skull screws were encapsulated with dental acrylic, the grounding wires from each of the electrode assemblies were wrapped around the exposed screws for electrical grounding.
After successful implantation of the microwire electrode bundles, a whisker stimulating electrode was prepared by placing a twisted pair of seven-stranded stainless steel wires inside a 20 gauge needle cut blunt and polished. The needle was used to burrow under the skin from the initial site of the skull incision to the rat's whisker pad. By carefully removing the needle, the twisted pair of wires was left hooked at the base of the C3 whisker follicle. Placement of the electrode could be verified by gently tugging on the free end of the pair and noting which of the vibrissas were moved. The free ends of the twisted pair of wires were threaded through a 15 mm section of SILASTIC tubing (602-231; Dow Corning) to protect the wires from rubbing against the dental acrylic. The free ends of the wire were crimped into a connector and attached to the skull with dental acrylic. The skin was loosely sealed around the dental cement, and the animal was allowed to recover for 5-10 d.
Recording sessions. Before experimentation, the animals were habituated to the testing chamber, the experimenter, and the experimental procedure (whisker pad stimulation). Throughout the recording session, animals were able to move freely within the testing chamber. During this habituation period, multiple single units were discriminated (Devilbiss and Waterhouse, 2002) as uniform electrical stimuli were delivered repetitively through the whisker pad electrode. Briefly, a Multichannel Acquisition Processor hardware and Realtime Acquisition System Programs for Unit Timing In Neuroscience (Plexon, Dallas, TX) was used to amplify, discriminate, and record neuronal electrical activity from putative single neurons or “units” of the VPM thalamus, BF cortex, and LC. Individual units were discriminated from on-line neural activity using a template-matching algorithm. After the experimental session, waveforms for each discriminated unit were reexamined with respect to pre-established criteria to verify that individual waveforms originated from a single neuron. These off-line criteria included characterization of unit waveform properties and spike train discharge patterns, e.g., (1) peak voltage of the waveform, (2) waveform slope(s), (3) scattergram of the waveform's first two principal components (PCs), and (4) spike train auto-correlegram. These combined on-line and off-line discrimination procedures provided a high level of assurance that recorded waveforms represented spike train discharges from individual thalamic and cortical cells (Table 1, Fig. 1).
Table 1.
Characterization of the efficiency of multiunit recordings during experiments with tonic LC stimulation
|
Subject |
LC stimulation-current range tested |
Waveform count |
Verified single neurons |
Thalamus |
Initially responsive to whisker stimuli |
Cortex |
Initially responsive to whisker stimuli |
|---|---|---|---|---|---|---|---|
| CLC22 | 3, 10, 30 μA | 38 | 23 | 13 | 4 | 10 | 0 |
| CLC28 | 3, 10, 30 μA | 43 | 11 | 5 | 1 | 6 | 4 |
| 10, 30, 100 μA | 33 | 17 | 7 | 7 | 10 | 5 | |
| CLC29 | 3, 10, 30 μA | 26 | 0 | ||||
| 10, 30, 100 μA | 26 | 0 | |||||
| CLC30 | 3, 10, 30 μA | 39 | 16 | 4 | 3 | 12 | 7 |
| 10, 30, 100 μA | 40 | 13 | 4 | 3 | 9 | 2 | |
| 30, 100, 300 μA | 44 | 21 | 7 | 5 | 14 | 5 | |
| CLC32 | 10, 30, 100 μA | 39 | 23 | 11 | 6 | 12 | 9 |
| 30, 100, 300 μA | 42 | 18 | 4 | 2 | 14 | 8 | |
| CLC34 | 3, 10, 30 μA | 55 | 32 | 13 | 8 | 19 | 12 |
| 30, 100, 300 μA | 53 | 17 | 6 | 1 | 11 | 2 | |
| Total |
|
478 |
191 |
74 |
40 |
117 |
54 |
Each subject received a range of LC stimulation currents and three frequency parameters (0.5, 1.0, and 5.0 Hz) on a given session. Only one session was administered per day. Putative units were isolated from cortical and thalamic waveform activity (Waveform count) and subsequently verified as originating from a single neuron with off-line criteria. Each cell was classified as thalamic or cortical, and the associated spike train discharge was examined by PSTH analysis to determine whether these neurons responded to whisker pad stimulation during control periods (Initially responsive to whisker stimuli).
Figure 1.

Responses of individual neurons within the thalamus or cortex to whisker pad stimulation before and during LC stimulation. A, Off-line verification that unit waveforms originated from a single neuron. Recorded electrical activity (AI) from a single microwire electrode was discriminated as four unit waveforms (AII-AV) and represented in a scatter plot (PC1 vs PC2; AVI). Using our off-line criteria, Units II and III were verified as originating from a single neuron. B, The PSTHs illustrate spontaneous and somatosensory stimulus-evoked discharge of four simultaneously recorded neurons (1 per each row), before (left) and during (right) 1.0 Hz LC stimulation. Each histogram sums unit activity during an equal number of stimulus presentations. Bi and Bii are cortical neurons (BFC); Biii and Biv are thalamic neurons (VPM). During periods of LC activation, sensory-evoked excitation was suppressed (Bi, Biii) or facilitated (Bii, Biv) in cortical and thalamic neurons, respectively. Inset numbers represent the summed probability that the neuron will discharge in response to whisker pad stimulation. C, D, LC activation (5.0 Hz) also elicited an enhancement of postexcitatory- and stimulus-bound (Ci, Cii, D) inhibition in cortical (Ci, Cii) and thalamic (D) neurons, respectively. Inset numbers in C and D represent the summed probability that the neuron would discharge during the period indicated by the horizontal bar. In each histogram, the y-axis represents the probability that the neuron discharged for a given 1 msec bin (x-axis). Whisker pad stimuli were presented at 0.0 sec.
Peristimulus time histograms (PSTH) were generated on-line after the discrimination procedure to confirm that individual recorded units were responsive to low level (non-noxious) whisker pad stimulation. Stimuli were sufficient to routinely elicit thalamic and cortical neuronal responses and occasionally were strong enough to evoke small, single whisker twitches before thalamic and cortical neuron-evoked discharges.
After single-unit discrimination and confirmation that units were responsive to sensory pathway activation, animals were presented with 10 psuedo-randomized experimental conditions (animals received each condition in a random order). The first condition presented was always a control; animals received 90 whisker pad stimulations presented at ∼0.5 Hz. Exact timing of sensory stimulus presentation was generated randomly within a Gaussian distribution (mean interstimulus interval, 2 sec; range, 1.5-2.5 sec) to prevent habituation. The nine remaining experimental conditions included three additional control periods and six periods of tonic LC stimulation. Of these periods of LC stimulation, three included parametric testing increasing current levels versus fixed frequency (3 μA at 1.0 Hz, 10 μA at 1.0 Hz, 30 μA at 1.0 Hz) and three included variations of stimulus frequency at fixed current (0.5 Hz at 10 μA, 1.0 Hz at 10 μA, 5.0 Hz at 10 μA). In several animals, the current was increased by a factor of 10 or 100 to determine the full range of effects for this parameter. During each period of LC activation, whisker pad stimuli were presented in the same manner as control conditions; however, stimulus pulses to the LC and whisker-pad were never allowed to occur simultaneously. The multiple control periods and repetitive tests with LC stimulation at 1.0 Hz/10 μA served as internal controls in this experimental design. Monopolar current pulses were delivered to the LC across two of the eight wires of the microwire bundle implant. A custom head-stage was built to permit electrical activation of the LC concurrent with LC neural activity recordings.
Potential behavioral-related changes in LC discharge or target neuron response properties were controlled by confirming, via videotape analysis, that the animal remained in a state of quiet rest throughout the experiment. This was accomplished by videotaping the entire experimental session with a video counter timer providing time stamps (resolution, 0.1 sec) synchronized to the multiunit recording and stimulus control systems.
Analysis of multiunit electrophysiological data. The effects of LC stimulation on sensory-evoked responses were quantified in several different ways to account for changes in the magnitude and timing of stimulus-evoked discharges (Devilbiss and Waterhouse, 2002). Measures of stimulus-evoked firing were calculated from PSTHs collected during periods of quiet resting for either control or LC stimulation conditions. Each PSTH was generated from randomly selected stimulus presentations during the control or LC stimulation period, a procedure that corrected for minor state changes within each condition. From each PSTH, the mean probability of discharge during the whisker stimulus-evoked response was calculated; the response window was defined by Gaussian 99% confidence intervals that determined the beginning and end of the response window. The calculations involving increases or decreases in response latency were quantified by three measures. First, on a trial-by-trial basis the average latency of the first action potential of the stimulus-evoked response was calculated. Hereafter, this measure will be referred to as the “mean latency.” Decreases in mean latency indicate that cells respond more quickly to sensory stimulus presentation. Second, the variability of the mean latency (i.e., SD of the mean) was calculated and will be referred to henceforth as the “latency variance.” Decreases in the latency variance indicate more consistent onset of the stimulus-evoked response from trial to trial as measured by the mean latency. Third, the latency to the statistical mode of the stimulus-evoked response, or the latency to the peak response discharge was calculated and will be referred to subsequently as the “modal latency.” Decreases in this measure indicate a concentrated burst of activity near the onset of the stimulus-evoked response or a more focused discharge per unit time. Moreover, LC-mediated changes in the magnitude of stimulus-evoked discharge or changes in response latency measures were determined by comparing values obtained during LC simulation conditions to control conditions with Student's t tests for each neuron (with Bonferroni corrections). Cells demonstrating increases, decreases, or no change in response parameters were then categorized, and effects on stimulus-evoked response properties were plotted. Segmentation of the bimodal distribution of neuromodulatory effects (i.e., increases or decreases in sensory-evoked discharge) was defined according to a >10% change in response property.
Histology. At the conclusion of each study, placement of the LC stimulating electrodes and the recording electrode bundles within the thalamus and cortex was verified histologically. After induction of pentobarbital anesthesia, 60 μA of current was passed across two microwires within a bundle for 45 sec, after which the rat was perfused with 0.9% saline, followed by a 10% formalin solution containing 5% potassium ferrocyanide. This procedure produced a Prussian blue reaction product at the electrode tip. The brains were then removed and stored in phosphate buffer containing 15% sucrose. Coronal 80 μm sections were cut on a freezing microtome, mounted, and coverslipped for histological examination.
Results
Electrical activity was recorded simultaneously from multiple sites within the whisker representation of the VPM thalamus and corresponding ipsilateral BF cortex in awake, unrestrained rats. Only neuronal spike train data extracted from recordings made during quietly resting behaviors (as defined by video record analysis) were used for these analyses. Recording sites in the thalamus and cortex were verified at the time of surgery by increases in electrical activity after mechanical displacement of the contralateral vibrissa and postmortem by visualization of a Prussian blue reaction product within each of the anatomical structures targeted. Postmortem examination of coronal tissue sections revealed consistent placement of recording electrodes within the VPM thalamus or within layers II/III-V of the BF cortex. In six animals, 191 individual neurons were discriminated from 478 recorded waveforms (Table 1, Fig. 1) (mean, 31 cells per animal). Of these 191 single units, 74 were VPM thalamic neurons and 117 were BF cortical neurons. Under control conditions, 93 of the 191 discriminated neurons (40 VPM, 54 BF cortex) responded to non-noxious electrical stimulation of the contralateral whisker pad. The remaining 97 cells that were initially unresponsive to whisker pad stimulation were reexamined for sensory responsiveness during periods of LC activation.
Effects of tonic LC activation on synaptically driven responses in the thalamus and cortex
To test the possibility that the LC efferent pathway could produce heterogeneous modulatory effects in target neurons, the actions of tonic, low-level electrical activation of the LC on thalamic and cortical neurons were cataloged. LC stimulation elicited multiple effects on whisker pad stimulus-related discharge in the thalamus and cortex of awake, quietly resting rats. As illustrated by the examples shown in Figure 1, these LC-mediated modulatory actions in thalamic and cortical target regions included the following: (1) suppression of stimulus-evoked excitatory responses (Fig. 1Bi,Biii); (2) facilitation of stimulus-evoked excitatory discharge (Fig. 1Bii,Biv); (3) increase of the postexcitatory inhibition (Fig. 1Ci); and (4) increase of the stimulus-evoked inhibition (Fig. 1Cii,1D). These coincident but opposing actions of LC stimulation were observed frequently across simultaneously recorded neurons. Furthermore, this heterogeneous neuromodulation was evident within BF cortical and VPM thalamic circuitry as shown in Figure 1B. For the cortical pair (Fig. 1B, top), the whisker pad stimulus-evoked response of the neuron in Figure 1Bi was suppressed 29% from control levels (probability of response decreased from 3.75 to 2.68), whereas the response of the cortical cell in Figure 1Bii was facilitated by 19% (probability of response increased from 3.75 to 4.47). Likewise, whisker pad stimulus-evoked responses of the representative thalamic neurons (Fig. 1B, bottom) were differentially modulated [67% suppression (Fig. 1Biii) and 23% facilitation (Fig. 1Biv)].
The effects of tonic LC stimulation on sensory stimulus-evoked inhibition in both cortical and thalamic neurons are illustrated in Figure 1, C and D. The postexcitatory inhibition (Fig. 1Ci, bar) in the first cortical neuron was enhanced twofold during 5 Hz LC stimulation. At the same time, the stimulus-evoked excitation in Figure 1Ci was increased 1.88-fold from control. Direct stimulus-evoked inhibition was increased substantially during LC activation in both cortical (92% from 11.66 to 0.99) (Fig. 1Cii) and thalamic (100% from 2.99 to 0.0) (Fig. 1D) neurons. Taken together, these data indicate that low-level, tonic activation of the LC efferent pathway can simultaneously produce different modulatory effects on responses of neighboring neurons in target areas of the CNS. Thus, at a given level of LC output, NE release produces heterogeneous modulatory effects on excitatory and inhibitory components of neural responses to sensory stimuli. These heterogeneous actions occur simultaneously within ensembles of cortical and thalamic neurons.
To determine whether there was a pattern to these effects, the likelihood of observing these actions was expressed as a percentage of initially responsive cells (n = 40 thalamus; n = 54 cortex) (Table 2). Depending on the stimulus parameters used (i.e., increasing frequencies or increasing stimulation currents), LC stimulation facilitated excitatory responses in 65.0-80.0% of the single units recorded in the VPM thalamus. In contrast, whisker pad-evoked excitation was suppressed in 10.0-30.0% of the recorded thalamic cells. In the BF cortex, LC activation produced a more even distribution of modulatory effects. Facilitation of stimulus-evoked discharge occurred in 31.5-33.0% of the recorded neurons, whereas suppression was observed in 63.0% of BF cortical neurons. On average, activation of the LC had no effect in 6.1% of the cells recorded in the VPM thalamus and BF cortex. Finally, the patterns of facilitation and suppression of cortical or thalamic excitatory responses described above were observed across all animals tested. These differences in neuromodulatory patterns in the thalamus and cortex suggest that LC output differentially impacts sensory response properties in these distinct terminal fields.
Table 2.
Summary of tonic LC stimulation effects on response probability of VPM thalamic and BF cortical neurons
|
|
Thalamus |
Cortex |
|---|---|---|
| Frequency | ||
| Facilitation | 26/40 (65.0%) | 17/54 (31.5%) |
| Suppression | 12/40 (30.0%) | 34/54 (63.0%) |
| No effect | 2/40 (5.0%) | 3/54 (5.6%) |
| Gating | 9/34 (26.5%) | 21/63 (33.3%) |
| Current | ||
| Facilitation | 32/40 (80.0%) | 18/54 (33.3%) |
| Suppression | 4/40 (10.0%) | 34/54 (63.0%) |
| No effect | 4/40 (10.0%) | 2/54 (3.7%) |
| Gating |
13/34 (38.2%) |
26/63 (41.3%) |
Thalamic and cortical cell responses were categorized according to the nature of the neuromodulatory effect observed during LC stimulation. Facilitation or suppression was declared if a significant increase or decrease in the probability of response was observed at any frequency or current of LC stimulation, respectively. For those neurons that were not initially responsive to whisker pad stimulation, gating was declared if a significant response emerged during tonic LC stimulation.
A subset of recorded cells (n = 34 thalamus; n = 63 cortex) was initially unresponsive to whisker pad stimulation; however, during tonic activation of the LC (increasing frequencies or increasing stimulation currents), 26.5-38.2% of the thalamic cells and 33.3-41.3% of the cortical cells exhibited statistically significant patterns of stimulus-evoked discharge (Fig. 2, Table 2). This phenomenon of gating has been characterized previously as a direct effect of NE on target neurons (Waterhouse et al., 1988). No differences in the likelihood of gating were evident for the thalamus versus cortex.
Figure 2.
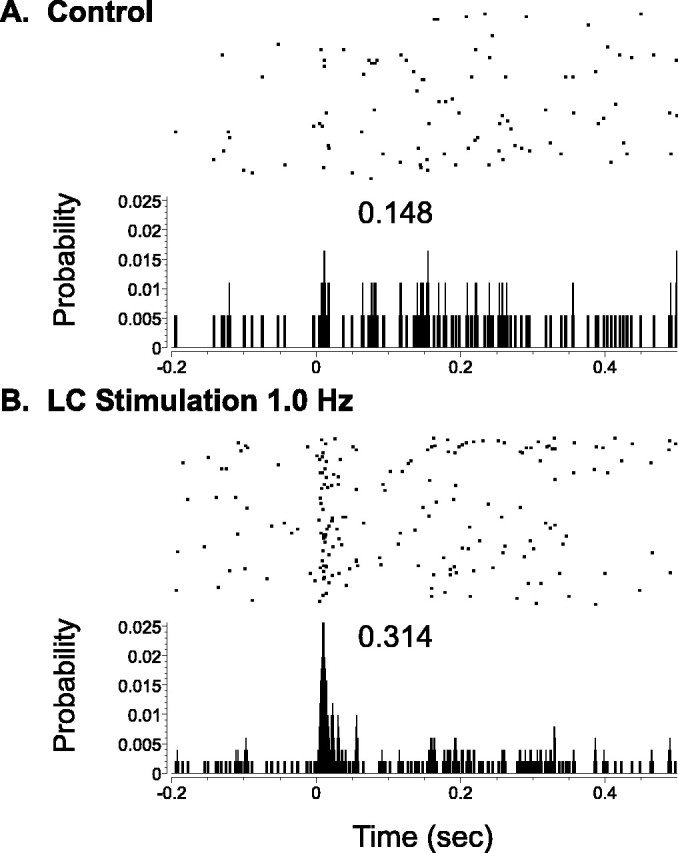
Effects of LC stimulation on otherwise subthreshold responses of a thalamic neuron to somatosensory stimuli. Cumulative raster and associated PSTH indicates the activity of a VPM thalamic neuron before and after whisker pad stimulus presentation (0.0 sec). During the control period (A), no discernable or statistical increase in the probability of discharge was observed after stimulus presentation; however, during the period of 1.0 Hz LC stimulation (B), a significant increase in stimulus-evoked activity was revealed. The raster y-axis references trial number (top row, first trial), whereas the histogram y-axis indicates the probability of discharge in a given time bin. Other labeling conventions are the same as in Figure 1.
Effects of different frequency-current pairings of tonic LC electrical stimulation on stimulus-evoked discharge of thalamic and cortical neurons
To investigate the spectrum of LC neuromodulatory effects on thalamic and cortical neuron responsiveness, the actions of LC output were further characterized across a physiological range of increasing levels of tonic LC stimulation. As illustrated by the cortical examples in Figure 3, with increasing frequencies or currents of LC stimulation, excitatory responses to whisker pad stimulation were either facilitated in a biphasic or “inverted-U” modulatory profile or monotonically suppressed. Neuronal responses that were initially facilitated during periods of low-level LC output were further enhanced to a peak value with increasing levels of stimulation (Fig. 3A,B, top rows). Additional increases in LC stimulation produced a reduction in evoked discharge from the peak value yielding a biphasic or inverted-U LC-mediated modulatory response relationship. LC-mediated suppression of neuronal responsiveness across increasing frequencies (Fig. 3A, bottom row) or increasing currents of LC electrical stimulation (Fig. 3B, bottom row) was also observed in simultaneously recorded neurons of the BF cortex or VPM thalamus. Recovery toward control levels of responding was observed immediately after cessation of LC stimulation in most cells (note that one example of delayed recovery is shown here) (Fig. 3A, bottom row).
Figure 3.

Effects of increasing tonic LC stimulation on somatosensory-evoked responses of simultaneously recorded cortical neurons. PSTHs illustrate responses of four individual cells to whisker pad stimulation during control conditions or periods of tonic LC electrical stimulation (A, fixed intensity, variable frequency; B, variable intensity, fixed frequency). A, The excitatory response of the top neuron was progressively facilitated by increasing frequencies of LC stimulation. At 1.0 Hz LC stimulation, the response to sensory stimuli was maximally facilitated (0.137 summed probability). Additional increases in LC activation (5.0 Hz) reduced the evoked response toward control levels. In contrast, the response of the neuron below was progressively suppressed by increasing frequencies of LC stimulation. B, A second simultaneously recorded pair of neurons from the same animal. Increasing intensity (current) of LC stimulation facilitated the stimulus-evoked discharge of the first neuron (above) to a peak value of 0.137 (summed probability). At higher currents of LC stimulation, the evoked response was reduced toward control levels. The second neuron (below) displayed a decrease in the evoked discharge at all currents tested. For each histogram, the y-axis represents the probability of discharge for a given 1 msec bin. In each case (except A, bottom), recovery toward the control level of responding was observed in the time period immediately after cessation of LC stimulation. The x-axis represents time before and after the onset of the stimulus presentation (0 sec). Each inset numerical value represents the probability of response to whisker pad stimulation.
The interaction between incremental currents and increasing frequencies of tonic LC stimulation was tested for every verified single neuron (n = 191). In each case, an optimal frequency-current pairing was established for producing maximal stimulus-evoked discharge in target neurons. Figure 4A illustrates the response of a VPM thalamic neuron to whisker pad stimulation across the range of frequency-current pairings tested. The stimulus-evoked discharge for this sample cell was maximally facilitated at low frequencies (0.5-1.0 Hz) of LC activation. By increasing the frequency and holding the current constant, this peak evoked discharge was reduced toward control levels according to an inverted-U relationship (Fig. 4A, horizontal array of histograms). A similar relationship was observed when the stimulus frequency was fixed and stimulus current was varied from 3 to 30 μA (Fig. 4A, vertical array of histograms). Using these data, the evoked discharge observed with each LC stimulus parameter can be plotted as a contour graph to predict the outcome of a continuum of frequency-current pairings (Fig. 4B). For this animal, the contour plot of this spline-fit model predicts that low-frequency (∼1.0 Hz) tonic LC stimulation is optimal over a limited range of currents. As current is reduced, greater frequencies (∼3.0 Hz) of LC stimulation are needed to produce facilitation of the evoked discharge (light pink), albeit the magnitude of facilitation was less than those observed during optimal stimulation currents. Note that at high frequencies and current intensities, the model predicts a suppression of stimulus-evoked responses below control levels (progression through blue-yellow-red regions of the graph). Overall, the histograms in Fig. 4A and the plot in Fig. 4B illustrate that LC-mediated enhancement of single-cell stimulus-evoked discharge is predicted for a limited range of frequency-current pairings. In the present study, these plots were used to determine the LC stimulus current that was optimal for revealing the maximum peak facilitation of neuronal responsiveness over a range of LC stimulus test frequencies.
Figure 4.
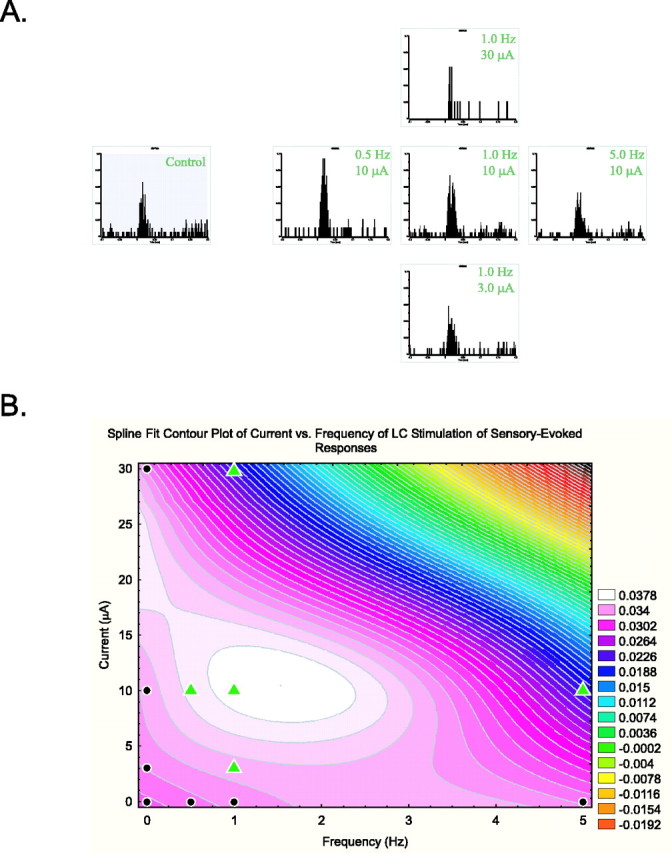
Variable modulatory influences of LC activation on a single neuron. A, PSTHs contrast the effects of varying current intensity versus frequency of LC stimulation on response properties of a single thalamic neuron. Cell responses to whisker pad stimulation were collected during periods when the LC was activated with different frequencies (0.5, 1.0, and 5.0 Hz at 10 μA) or intensities (3.0, 10, and 30 μA at 1.0 Hz) of electrical current. Each histogram sums unit discharge during ∼30 stimulus presentations (stimulus onset, 0 msec) but normalized by using discharge probability as the y-axis. The control response to whisker pad stimulation (left; blue) was facilitated during periods of low-frequency (0.5 Hz) LC stimulation. As LC stimulus frequency was increased and approached a physiological maximum for tonic discharge, responses to whisker pad stimulation were suppressed below control levels (horizontal panels). Increases in LC stimulus intensity (vertical panels) also produced facilitation of evoked responses according to a similar biphasic modulatory profile (peak at 10 μA). B, A contour plot of the neuronal response to whisker pad stimulation as a function of LC stimulus frequency and current intensity. Responses of the neuron illustrated in A were quantified and plotted against LC stimulus frequency and intensity and smoothed with a spline model. Control levels of whisker pad-evoked response fall on the x- and y-axes are coded in purple (black circles). Increases from the control response proceed to white, whereas decreases from the control response step to blue-yellow-red. Note there is a finite range (current intensity vs frequency) at which control responses can be facilitated. The color scale bar represents the neuronal discharge probability. Data points from A are represented as green triangles.
Effects of increasing frequencies of tonic LC stimulation on thalamic and cortical neuron response probabililty
Previous and more recent evidence (Aston-Jones and Bloom, 1981; Ishimatsu and Williams, 1996) suggests that the LC nucleus alters its NE output by increasing or decreasing firing rates of its constituent cells as opposed to altering the number of discharging neurons. Thus, in the remaining analyses of LC-mediated modulation of neuronal responsiveness, we limited our investigation to the effects of different tonic LC stimulation frequencies. To test the hypothesis that increasing levels of tonic LC output may have different neuromodulatory effects on sensory responses of VPM thalamic versus BF cortical neurons, the effect of increasing LC stimulation on all the cells recorded within an anatomical region were plotted as a function of LC stimulus frequency (Fig. 5). Increasing frequencies of LC stimulation were found to have no generalized effect across the recorded population of BF cortical neurons (Fig. 5A) (ANOVA: F(3,75) = 0.719, p = 0.541); however, a clear inverted-U modulation of the evoked discharge of VPM thalamic neurons was observed for increasing frequencies of LC stimulation (Fig. 5B) (ANOVA: F(3,49) = 4.54, p = 0.0046).
Figure 5.

Modulation of BF cortical (A) and VPM thalamic (B) cell responses to synaptic input over the range of tonic LC stimulation (0.5-5.0 Hz). Neuronal responses to whisker pad stimulation (represented as a percentage of control; ±SEM) were quantified for each cell during control conditions and for periods during presentations of increasing frequencies of LC stimulation. Over the range of tonic LC frequencies tested, individual BF cortical cells (n = 51 + 21 gated) demonstrated both LC-mediated facilitation and suppression of neuronal responsiveness to whisker pad stimulation, but collectively (mean value) the group demonstrated no significant difference from control levels (A). The population of VPM thalamic cells (n = 38 + 9 gated), however, demonstrated a significant increase in the averaged response to whisker pad stimulation during periods of LC activation, with a peak at 1.0 Hz (B). *p < 0.05.
Cells demonstrating responses of each neuromodulatory classification, facilitation, or suppression, were then grouped. Neurons that demonstrated LC-mediated facilitation of their evoked response were further grouped according to anatomical location and plotted to determine whether differences existed between the sample populations in the VPM thalamus and BF cortex (Fig. 6). Neurons from the BF cortex (Fig. 6A) were maximally facilitated at 0.5 Hz LC stimulation (ANOVA: F(3,37) = 5.10, p = 0.0025), whereas VPM thalamic cells (Fig. 6B) demonstrated maximal sensitivity at 1.0 Hz (ANOVA: F(3,34) = 5.50, p = 0.0016).
Figure 6.

Average facilitating effects of increasing tonic LC stimulation on BF cortical (A) and VPM thalamic (B) responses to whisker pad activation. Those cells that demonstrated a facilitation of neuronal responsiveness at any level of tonic LC stimulation frequencies (0.5-5.0 Hz; fixed intensity) were plotted. BF cortical cells (n = 17 + 21 gated) demonstrated a peak of maximal facilitation of neuronal response magnitude from control conditions at the lowest (0.5 Hz) levels of tonic LC stimulation tested. VPM thalamic cells (n = 26 + 9 gated) demonstrated the peak of facilitation at slightly higher frequencies (1.0 Hz) of LC stimulation. *p < 0.05.
Within each neuromodulatory classification, the effects of tonic LC activation on BF cortical and VPM thalamic neuronal responses to whisker pad stimulation were significant across the range of LC stimulation frequencies tested. However, as indicated by the data in Figures 3, 4, 5, 6, sensitivity to increasing LC stimulation frequencies was variable between cells. To compare differences between maximal LC modulation of VPM thalamic or BF cortical neuron responses, the LC stimulus frequency-response curves were shifted to align peak facilitation or suppression for individual neurons. This shifting produced an average effect of LC stimulation, relative to the maximal modulatory effect, without confounds inherent across simultaneously recorded neuronal assemblies (e.g., differences in baseline firing rate, etc.). The average maximal facilitation of the magnitude of somatosensory-evoked responses (Fig. 7A) for thalamic neurons was 217% of control (ANOVA: F(5,34) = 4.16, p = 0.002), whereas cortical cells were facilitated to a maximum of 198% of control (ANOVA: F(5,37) = 8.79, p < 0.0001). Comparison of these values demonstrated no difference in facilitation of evoked discharge for neurons in the VPM thalamus versus BF cortex (ANOVA: F(1,71) = 0.470, p = 0.50). Furthermore, maximal LC-induced suppression (Fig. 7B) of whisker pad stimulus-evoked discharge for VPM thalamic neurons (33% of control) was significant (ANOVA: F(4,11) = 13.3, p < 0.0001), as was the suppression of BF cortical neuron responses (40% of control; ANOVA: F(5,33) = 49.0, p < 0.0001). Again, there was no statistical difference in LC-mediated suppression of stimulus-evoked responses between cells of the thalamus and cortex (ANOVA: F(1,44) = 0.58, p = 0.449).
Figure 7.

Normalized effects of LC activation on responses of thalamic and cortical cells to whisker pad stimulation. Cell-specific modulatory response profiles were normalized by aligning the maximal modulatory effect produced by LC activation for each cell. After alignment, the average change in response relative to control was calculated and plotted independent of cell-specific differences in sensitivity to LC stimulation parameters. Tonic activation of the LC induced either facilitation (A) or suppression (B) of BF cortical (circles) or VPM thalamic (squares) neuron responses to synaptic input. Maximal facilitation of evoked discharge in both the BF cortex (n = 17 + 21 gated) and VPM thalamus (n = 26 + 9 gated) was significantly different from control levels during periods of LC activation. Maximal suppression of evoked discharge in the BF cortex (n = 34) and VPM thalamus (n = 12) was also significantly different from control levels during periods of LC stimulation. *p < 0.05.
These data indicate a fundamentally different net effect of increasing tonic LC output on the BF cortex versus VPM thalamus at the circuit level. This difference in overall neuromodulatory action is most likely attributable to the ratio of neurons in these cortical and thalamic circuits that respond via a monotonic suppression or an inverted-U facilitatory profile over increasing LC discharge frequencies. Differences in the frequency at which VPM or BF cortical neurons were maximally facilitated were slight; however, such differences may be biologically relevant (see Discussion). Within a neuromodulatory classification (i.e., facilitation or suppression), these data indicate that at the cellular level the magnitude effects of LC output on sensory-evoked discharge was similar for neurons in the BF cortex and VPM thalamus.
Effects of tonic LC stimulation on thalamic and cortical neuron response latency
To test the hypothesis that tonic LC output modulates other dimensions of sensory signal coding, the effect of LC activation on sensory-response latencies was examined. As illustrated by perievent rasters shown in Figure 8, the temporal properties of neuronal responses were altered during periods of increasing frequency of tonic LC stimulation. The sample responses from individual thalamic (Fig. 8A) and cortical (Fig. 8B) cells reveal a decrease in the variability of response onset over multiple stimulus trials in addition to a reduction in the latency-to-peak discharge during periods of LC activation. To quantify LC-mediated changes in mean latency, the average latency of the first spike to occur after stimulus presentation was calculated. Additionally, the latency variance as well as the modal latency were computed. Calculations of latency measures from illustrative cases for the thalamus (Fig. 8A) and cortex (Fig. 8B) reveal a statistically significant reduction of the mean latency (p < 0.05) to evoked discharge. Tonic LC stimulation (1.0 Hz) decreased the mean latency of thalamic neuron discharge (Fig. 8A) from 14.5 msec (6.1 msec latency variance) to 11.2 msec (4.8 msec latency variance). The mean latency of cortical neuron discharge (Fig. 8B) was also significantly reduced from 11.1 msec (3.2 msec latency variance) to 10.2 msec (2.6 msec latency variance). Furthermore, a reduction in the latency-to-peak discharge was also observed for both cells during tonic LC stimulation. The modal latency for the thalamic neuron response was reduced from 13.8 to 10.0 msec, whereas the modal latency for the cortical neuron response was decreased from 10.0 to 9.4 msec.
Figure 8.
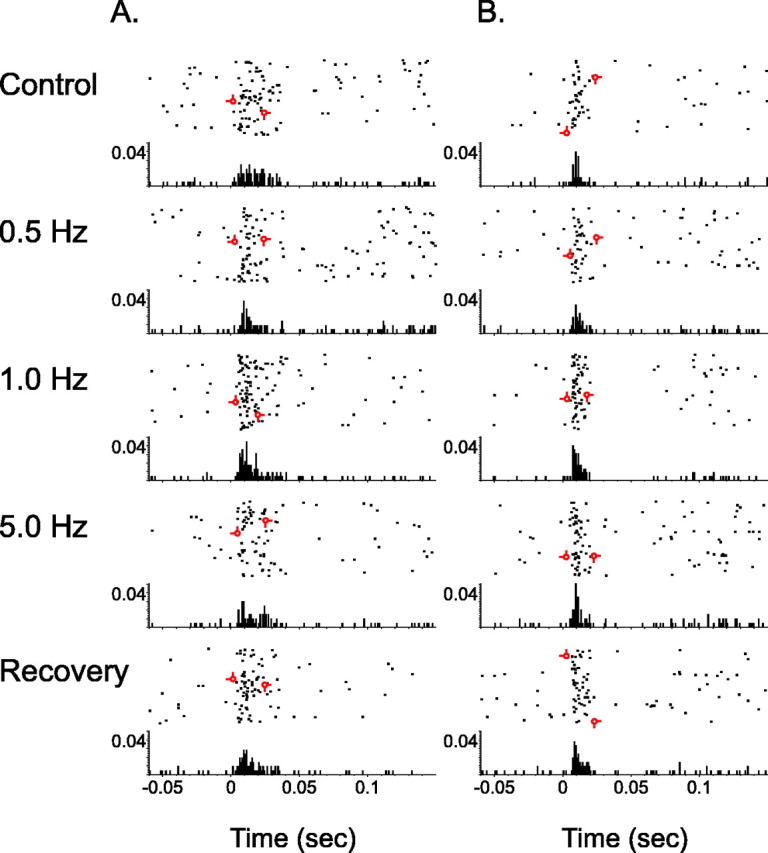
Effects of LC activation on temporal aspects of sensory-evoked neuronal discharge in the thalamus and cortex. Perievent rasters and associated histograms illustrate the stimulus-evoked discharge patterns for a single VPM thalamic neuron (A) or BF cortical neuron (B) during control, tonic LC stimulation intervals, and recovery. These cells were recorded simultaneously. The x-axis for both the raster and underlying PSTHs depicts time before and after whisker pad stimulus presentation (occurring at 0 sec.). The raster y-axis references trial number (top row, first trial), whereas the histogram y-axis indicates the probability of discharge in a given time bin (1 msec). Each cumulative raster/PSTH illustrates unit activity during an equal number of sensory stimulus presentations. As LC stimulation frequency was increased (i.e., up to 1.0 Hz), the duration of the whisker-evoked response was reduced. Additionally, modal latency and latency variance decreased with increasing frequencies of LC stimulation (i.e., up to 1.0 Hz). An additional increase in the frequency of LC stimulation suppressed the magnitude of neuronal response. Barbed open circles indicate the earliest and latest evoked first spike within the response window for each experimental condition. Note that variability in the onset of the evoked response as well as the time between first and last spike were reduced during the tonic 1.0 Hz LC stimulation condition.
The latency of an excitatory response to sensory stimuli, in part, indicates the number of synapses between the sensory afferent and the recorded cell. For example, a VPM thalamic neuron with a receptive field centered on the manipulated whisker responds in a range of 3-12 msec (Armstrong-James and Callahan, 1991). Longer response latencies are associated with neurons that have the manipulated whisker in their surround (for a given cortical layer). For this particular thalamic cell (Fig. 8A), calculations of mean latency, latency variance, and modal latency suggest that the whisker-pad stimulation was not within the receptive field center of this neuron. However, no trend was observed when the data were examined for interactions between short versus long latency responses and the neuromodulatory actions of LC output.
For all recorded cells (Table 3), increasing frequencies of tonic LC stimulation produced a greater proportion of cortical cells exhibiting a decrease in the average latency [41 of 54 (75.9%)] than thalamic neurons [23 of 40 (57.5%)]. Furthermore, increasing tonic LC stimulation also reduced the variability (latency variance) of response latencies for a larger proportion of cells in the cortex [42 of 54 (77.8%)] than in the thalamus [21 of 40 (52.5%)]. Finally, the modal latency was decreased for approximately equivalent proportions of cells in the cortex and thalamus [37 of 54 (68.5%) vs 27 of 40 (67.5%)] during periods of tonic LC stimulation.
Table 3.
Summary of tonic LC-mediated effects on stimulus-evoked latencies of VPM thalamic and BF cortical neurons
|
|
Thalamus |
Cortex |
|---|---|---|
| Mean latency | ||
| Increased | 15/40 (37.5%) | 10/54 (18.2%) |
| Decreased | 23/40 (57.5%) | 41/54 (75.9%) |
| No effect | 2/40 (5.0%) | 3/54 (5.6%) |
| Latency variance | ||
| Increased | 16/40 (40.0%) | 10/54 (18.5%) |
| Decreased | 21/40 (52.5%) | 42/54 (77.8%) |
| No effect | 3/40 (7.5%) | 2/54 (3.7%) |
| Modal latency | ||
| Increased | 12/40 (30.0%) | 14/54 (25.9%) |
| Decreased | 27/40 (67.5%) | 37/54 (68.5%) |
| No effect |
1/40 (2.5%) |
3/54 (5.6%) |
Responses of thalamic and cortical cells were examined to determine whether changes in temporal properties of the whisker pad stimulus-evoked discharge were observed during periods of tonic LC stimulation. As described in Materials and Methods, mean latency and latency variance indicate the average latency of the first spike of the response and its variance over multiple stimulus presentations. Modal latency is the latency of the statistical mode of the stimulus-evoked response. Response latencies of thalamic or cortical neurons were classified as increased or decreased if a significant change in these measures was observed at any frequency or current of LC stimulation.
Data from cells in the VPM thalamus and BF cortex were further analyzed to determine the magnitude of latency shifts during periods of tonic LC pathway activation (Fig. 9). As expected from the distributions of latency effects, the population of thalamic cells as a whole exhibited no significant shift in the mean latency or latency variance (Fig. 9A). The modal latency of VPM thalamic neurons was decreased during LC stimulation (from 8.0 to 6.5 msec); however, this change also did not reach significance. In contrast, the mean latency of cortical neuron responses (Fig. 9B) was significantly reduced (from 9.8 to 8.5 msec; p < 0.01) during tonic activation of the LC efferent pathway. Likewise, a significant reduction in latency variance was also evident (from 2.9 to 2.2 msec; p < 0.05) for BF cortical neurons. However, no LC-mediated effect was evident for modal latency. In summary, tonic activation of the LC tended to reduce the modal latency of thalamic neuron stimulus-evoked discharge yielding a more concentrated burst of activity near the response onset. Simultaneously, as a population, BF cortical neurons responded more quickly and with less variability to sensory stimuli during tonic activation of the LC efferent pathway. Differences in the net actions of tonic LC stimulation on temporal properties of sensory-driven neuronal responses in the BF cortex versus VPM thalamus suggests that the LC exerts a unique impact on signal processing in these regions.
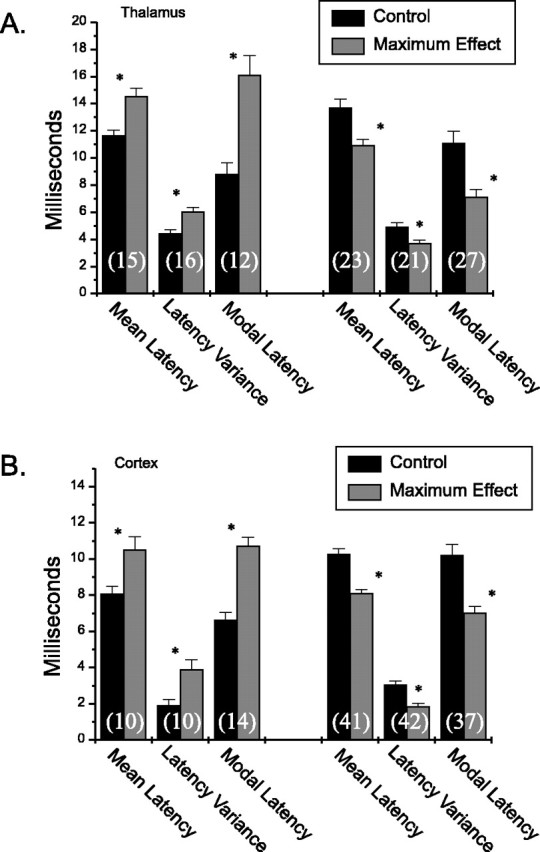
Figure 9.
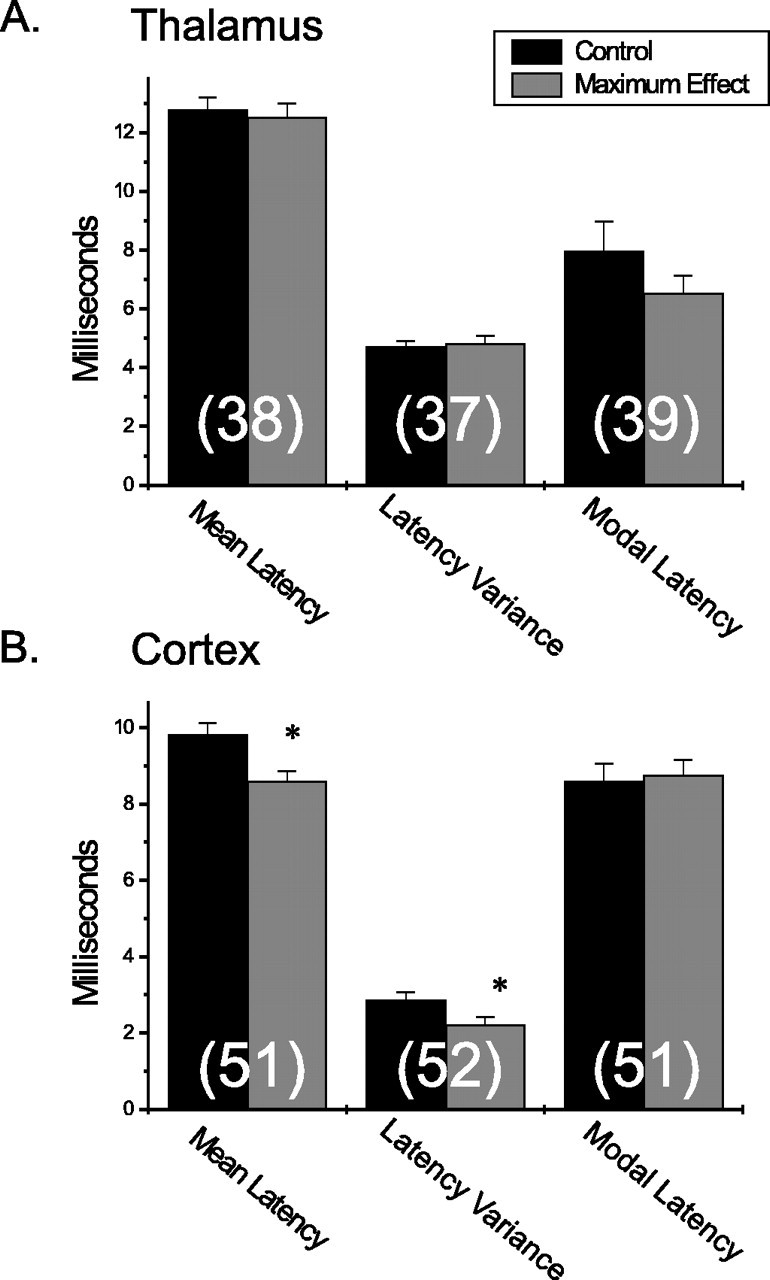
Net impact of LC activation on temporal response properties of individual thalamic and cortical sensory neurons. Bar graphs illustrate the effects of tonic LC stimulation on measures of mean latency, latency variance, and modal latency for the entire population of initially responsive VPM thalamic (n = 40) and BF cortical (n = 54) cells. A, The mean latency, latency variance, and modal latency are plotted during control conditions and the maximal effect of tonic LC stimulation for all VPM cells. No significant changes in temporal response properties were observed for any category, although there was a trend toward reduced modal latency. The numbers of cells in each category are indicated in parentheses. B, The same plot as in A; however, each bar represents data from BF cortical neurons. A significant reduction (*p < 0.05) in mean latency and latency variance was observed after tonic LC stimulation, although as with the VPM thalamus, no significant change was seen for modal latency.
The population of cortical or thalamic cells was subsequently divided into three groups (i.e., those showing increases vs decreases in mean latency or no effects) to further characterize the LC-mediated effects on response latency (Fig. 10). Over the range of increasing LC stimulation frequencies tested, thalamic neurons demonstrated either a significant increase (from 11.6 to 14.5 msec; p < 0.001) or decrease (from 13.7 to 10.9 msec; p < 0.001) in the mean latency after stimulus presentation (Fig. 10A). Accordingly, these cells also demonstrated significant increases (from 4.4 to 6.0 msec; p < 0.001) and decreases (from 4.9 to 3.7 msec; p < 0.001) in latency variance. For cortical neurons (Fig. 10B), increasing tonic LC stimulation also produced significant increases (from 8.0 to 10.5 msec; p < 0.005) and decreases (from 10.2 to 8.1 msec; p < 0.001) for the mean latency. Likewise, the latency variance was increased (from 1.9 to 3.9 msec; p < 0.005) or decreased (from 3.1 to 1.8 msec; p < 0.001) significantly over the range of LC stimulus frequencies tested. These results indicate that increasing LC output modulates the timing of the first spike of a sensory response. Within each classification (increased or decreased latency), the effects of tonic LC activation on BF cortical and VPM thalamic response latency measures were significant across the range of LC stimulation frequencies tested.
Figure 10.
Selective influences of LC output on temporal response properties of thalamic and cortical sensory neurons. Bar graphs illustrating the magnitude of shifts in the mean latency, latency variance, and modal latency for VPM thalamic cells (A) and BF cortical cells (B) are shown. A, The mean latency, latency variance, and modal latency are plotted during control conditions, and the maximal effect of tonic LC stimulation for VPM cells demonstrating increases (first 3 pairs) and decreases (second 3 pairs) in temporal coding. Significant effects were seen for all categories. The numbers of cells in each category are shown at the bottom of the bars. B, The same plots as in A; however, each bar represents data from BF cortical neurons. As with thalamic neurons, a significant effect was demonstrated for each classification (*p < 0.05).
Although the LC-mediated modulatory actions on individual neuronal responses were variable between cells, general effects on modal latency in the thalamus and general effects on mean latency and latency variance in the cortex were observed. These general effects in the cortex coupled with the trend of decreased sensory-response modal latency in the thalamus indicate potential biologically relevant changes in temporal coding of sensory signals.
Discussion
These results demonstrate that stimulation of the LC within its physiological range of tonic discharge frequencies can elicit multiple modulatory actions on the probability of sensory-evoked discharges in VPM thalamic and BF cortical neurons of awake, freely moving animals. These effects mimic the spectrum of neuromodulatory actions observed during continuous, local iontophoretic administration of NE (Foote et al., 1975; Rogawski and Aghajanian, 1980; Waterhouse and Woodward, 1980; Armstrong-James and Fox, 1983; Videen et al., 1984; Kossl and Vater, 1989; Waterhouse et al., 1990; McCormick et al., 1991; George, 1992; Holdefer and Jacobs, 1994; Devilbiss and Waterhouse, 2000). Recorded cells expressed either an inverted-U facilitating response profile or monotonic suppression of sensory responsiveness with increasing LC stimulation frequencies. Cell-specific sensitivity to increasing LC stimulation resulted in subsets of neurons that were maximally facilitated (or suppressed) at specific LC stimulation frequencies. Thus, as LC output increased, the network of cells that demonstrated maximal responsiveness to sensory stimuli was continually altered as new cells were recruited into the facilitated ensemble replacing others that were progressively suppressed and eliminated from the response pool.
Latency measures of sensory-evoked neuronal responses were also modulated in both the cortex and thalamus during periods of tonic electrical stimulation of the LC efferent pathway. Although subsets of VPM thalamic and BF cortical neurons demonstrated increases or decreases in response latencies that were dependent on the frequency of LC stimulation, cells in the thalamus tended to exhibit LC-mediated reduction in all latency measures. In the BF cortex, the mean latency and latency variance were significantly reduced during periods of LC activation. Thus as tonic LC stimulation increased, VPM thalamic neurons tended to discharge in a concentrated burst of activity near the response onset. Concomitantly, BF cortical neurons began responding to sensory stimuli earlier and with less variability during tonic activation of the LC efferent pathway.
Despite certain similarities, it is worth noting that the effects of LC activation on cortical neurons were qualitatively and quantitatively different than those produced on target cells of the thalamus. Thus, it appears that tonic activation of the LC efferent pathway simultaneously affects thalamic and cortical circuits differently with respect to probability and latency of whisker pad stimulus-evoked discharge. Over the range of tonic LC output, the facilitation and suppression of response probability observed in simultaneously recorded cells in conjunction with differences in the timing of stimulus-dependent action potentials may represent mechanisms whereby the rat somatosensory system modulates its function to address tactile stimulus processing needs over different behavioral contingencies.
Technical considerations
Direct electrical stimulation of the LC with frequencies used in the current study has been shown to linearly increase NE levels in the cortex (Florin-Lechner et al., 1996). Others have argued that direct electrical activation of the LC has several disadvantages (Foote et al., 1991; Berridge and Abercrombie, 1999). Accurate placement of the stimulating electrode in or within 250 μm of the LC nucleus was confirmed by histological analysis. The potential for current spread to nearby nuclei and fibers of passage was limited by using stimulation currents 10- to 100-fold lower than those used previously in LC stimulation studies (Florin-Lechner et al., 1996; Waterhouse et al., 1998). Moreover, no differences were observed in the modulatory profiles of target cells when the stimulating electrodes were placed within the LC compared with those placed immediately adjacent to the LC (Fig. 11). Thus, tissue activation in our study was limited to LC and peri-LC regions with no evidence that the stimulating electrode disrupted normal LC efferent functions.
Figure 11.

Schematic representation of the placement of stimulating electrodes within and adjacent to the LC. The drawings of coronal sections through the pons at the level of the LC are arranged from most rostral (top left) to most caudal (bottom right). Asterisks denote the location of the central electrode of the recording/stimulating bundle as determined from histological examination of brainstem tissue sections at the conclusion of experiments in each animal. 4V, Fourth ventricle; 7n, facial nerve; 8vn, vestibulocochlear nerve; Bar, Barrington's nucleus; g7, genu of the facial nerve; me5, mesencephalic trigeminal nucleus; mlf, medial longitudinal fasciculus; scp, superior cerebellar peduncle; scpd, superior cerebellar peduncle descending limb; unc, uncinate fasciculus; veme, vestibulomesencephalic tract; vsc, ventral spinocerebellar tract.
The effects reported here for LC stimulation are similar to those reported previously for locally administered NE; however, in the absence of pharmacological evidence, we have been careful in our discussion to draw parallels between LC-mediated actions and NE effects without making the outright claim that the effects reported here were, in fact, noradrenergic. Local application of counterbalanced combinations of antagonist compounds in the LC or LC terminal fields would confirm that the LC was sufficient and necessary to mediate these actions but requires a different experimental design and technique than the one used here.
To control for interactions between LC stimulation-dependent discharge rates and basal LC discharge rates, three indices of LC function were measured. First, electrophysiological recordings in the LC (Fig. 12) suggest that LC stimulation increased the average discharge of LC neurons in at least an additive manner (e.g., from 1.5 to 3.0 Hz). Second, the range of stimuli delivered to the LC produced approximately linear increases in extracellular NE in the thalamus (our unpublished data). Third, the effects of LC stimulation on target neuron responses to whisker pad stimulation were only tested during equivalent behavioral states. In addition to the relationship between baseline LC discharge and state of arousal (Aston-Jones and Bloom, 1981), sensory responses of BF cortical and thalamic neurons are suppressed as the rat actively explores the environment with its facial whiskers (Fanselow and Nicolelis, 1999). However, as verified by high-resolution video recordings, the present analysis was limited to baseline conditions when the animal was awake but quietly resting and not engaged in whisking behavior.
Figure 12.

Rate histograms of LC neuronal activity before and during tonic electrical stimulation of LC. For each histogram, the y-axis represents the frequency of discharge for a single neuron, and the x-axis represents experimental time in seconds. Histograms A and C are two simultaneously recorded cells within the LC of the same animal during quietly resting control conditions (no LC stimulation). Histograms B and D are the same two units during quiet resting behaviors with 1.0 Hz stimulation of the LC. The average discharge rate of the first unit increases from 1.49 Hz (A) to 3.12 Hz (B). The average rate of the second unit increases from 0.59 Hz (C) to 2.46 Hz (D). These increases suggest that electrical stimulation of the LC is added to the underlying tonic discharge rate of individual neurons.
Present and previous findings
The present findings demonstrate that tonic activation of the LC efferent pathway is capable of producing an array of NE-like modulatory effects (Foote et al., 1975; Reader et al., 1979; Waterhouse et al., 1980, 1988; Armstrong-James and Fox, 1983; Ciombor et al., 1999) on target sensory neurons in the intact, awake animal. As such, this study extends the idea that LC-mediated tonic release of NE can regulate postsynaptic neuronal responsiveness to synaptic inputs by revealing the inherent variability of these effects on individual cells, neighboring neurons, and local circuits along a sensory pathway. Evidence that LC output can simultaneously facilitate and suppress responses of individual neurons to somatosensory input and that modulatory effects are related to one another as a function of the level of LC efferent output begins to integrate discordant findings and opposing viewpoints regarding LC/NE suppression (Foote et al., 1975; Manunta and Edeline, 1997) versus absolute potentiation (Waterhouse and Woodward, 1980; Waterhouse et al., 1982, 1990, 1998, 2000) of stimulus-evoked discharge.
These data further suggest that modulatory effects produced by the LC efferent system are not static with respect to the probability of individual cellular responses. As output from the LC increases, individual cells are suppressed and functionally removed from the pool of responsive neurons, while other neighboring neurons experience facilitation (and are functionally added to the responsive ensemble) over the same dynamic range of LC output. Such facilitation (Nawrot et al., 1999) and suppression (Manunta and Edeline, 1997) of sensory-responsive neurons in the functional ensemble may produce subtle, but important, changes in the sensory representation distributed across local populations of neurons.
The timing of neural signals within sensory networks plays an important role during sensory signal processing (Ahissar et al., 2000). Reductions in stimulus-evoked response latencies have been associated with direct NE application (Kossl and Vater, 1989). Our studies extend these findings to include simultaneous increases and decreases in the mean latency of stimulus-evoked discharge after activation of the LC within its physiological range. Moreover, concurrent increases and decreases in the variability of trial-to-trial latencies were also observed. Such improvements in neural timing may be relevant for target localization and spatiotemporal coding of sensory stimuli (Kossl and Vater, 1989). In summary, postsynaptic changes in stimulus-evoked spike timing represent another means by which LC output can regulate coding schemes used by thalamic and cortical neurons in sensory information processing.
Summary and conclusions
Our data demonstrate that tonic LC output can produce several different neuromodulatory actions simultaneously on many single neurons within the VPM thalamus and BF cortex that are dependent on LC output levels in a cell-specific manner. Differences in modulatory actions between the thalamus and cortex suggest that LC output has unique consequences on signal processing operations at each level of an ascending sensory network. Differences in the level of LC activation needed to obtain maximal enhancement of individual neuronal responsiveness and the optimization of local sensory network function occurs at different points over the physiological range of LC tonic output. The observed effects on probability of neuronal responsiveness and response timing suggest that sensory signal processing is continually altered over the range of tonic LC discharge frequencies. We hypothesize that low frequencies of LC discharge (e.g., during sleep and appetitive behaviors) maintain target neuronal function within a range of readiness to respond robustly to salient sensory stimuli, whereas higher frequencies of LC output (e.g., during active waking, exploration, and focused attention) regulate target neurons across a wide dynamic range of responsiveness to maintain the greatest flexibility in processing environmental signals that are relevant to ongoing behaviors. At the highest tonic levels of LC discharge (e.g., during stressful situations), target neurons elicit blunted (i.e., suppressed) responses to synaptic stimuli as part of an organism-wide strategy to suppress high-intensity inputs that may be maladaptive (e.g., pain during threatening events). Overall, these findings prompt us to suggest that over the range of tonic LC output frequencies, target cell networks continuously self-organize (i.e., regulate the impact of individual cellular contributions to sensory stimulus coding) to optimize performance in ongoing behavioral tasks.
Footnotes
This work was supported by National Institutes of Health Grant NS32461 to B.D.W. We thank Drs. Craig Berridge, John Chapin, and Rita Valentino for timely discussions and helpful comments throughout various stages of this work and Ron Markowitz for help with electrophysiological data collection.
Correspondence should be addressed to Dr. David M. Devilbiss, Department of Psychology, University of Wisconsin, 1202 West Johnson Street, Room 523, Madison, WI 53706. E-mail: ddevilbiss@wisc.edu.
Copyright © 2004 Society for Neuroscience 0270-6474/04/2410773-13$15.00/0
References
- Ahissar E, Sosnik R, Haidarliu S (2000) Transformation from temporal to rate coding in a somatosensory thalamocortical pathway. Nature 406: 302-306. [DOI] [PubMed] [Google Scholar]
- Akaike T (1982) Periodic bursting activities of locus coerulleus neurons in the rat. Brain Res 239: 629-633. [DOI] [PubMed] [Google Scholar]
- Armstrong-James M, Callahan CA (1991) Thalamo-cortical processing of vibrissal information in the rat. II. Spatiotemporal convergence in the thalamic ventroposterior medial nucleus (VPm) and its relevance to generation of receptive fields of S1 cortical “barrel” neurons. J Comp Neurol 303: 211-224. [DOI] [PubMed] [Google Scholar]
- Armstrong-James M, Fox K (1983) Effects of ionophoresed noradrenaline on the spontaneous activity of neurones in rat primary somatosensory cortex. J Physiol (Lond) 335: 427-447. [DOI] [PMC free article] [PubMed] [Google Scholar]
- Aston-Jones G, Bloom FE (1981) Activity of norepinephrine-containing locus coeruleus neurons in behaving rats anticipates fluctuations in the sleep-waking cycle. J Neurosci 1: 876-886. [DOI] [PMC free article] [PubMed] [Google Scholar]
- Berridge CW, Abercrombie ED (1999) Relationship between locus coeruleus discharge rates and rates of norepinephrine release within neocortex as assessed by in vivo microdialysis. Neuroscience 93: 1263-1270. [DOI] [PubMed] [Google Scholar]
- Berridge CW, Foote SL (1991) Effects of locus coeruleus activation on electroencephalographic activity in neocortex and hippocampus. J Neurosci 11: 3135-3145. [DOI] [PMC free article] [PubMed] [Google Scholar]
- Berridge CW, Waterhouse BD (2003) The locus coeruleus-noradrenergic system: modulation of behavioral state and state-dependent cognitive processes. Brain Res Brain Res Rev 42: 33-84. [DOI] [PubMed] [Google Scholar]
- Ciombor KJ, Ennis M, Shipley MT (1999) Norepinephrine increases rat mitral cell excitatory responses to weak olfactory nerve input via alpha-1 receptors in vitro. Neuroscience 90: 595-606. [DOI] [PubMed] [Google Scholar]
- Devilbiss DM, Waterhouse BD (2000) Norepinephrine exhibits two distinct profiles of action on sensory cortical neuron responses to excitatory synaptic stimuli. Synapse 37: 273-282. [DOI] [PubMed] [Google Scholar]
- Devilbiss DM, Waterhouse BD (2002) Determination and quantification of pharmacological, physiological, or behavioral manipulations on ensembles of simultaneously recorded neurons in functionally related neural circuits. J Neurosci Methods 121: 181-198. [DOI] [PubMed] [Google Scholar]
- Fanselow EE, Nicolelis MA (1999) Behavioral modulation of tactile responses in the rat somatosensory system. J Neurosci 19: 7603-7616. [DOI] [PMC free article] [PubMed] [Google Scholar]
- Florin-Lechner SM, Druhan JP, Aston-Jones G, Valentino RJ (1996) Enhanced norepinephrine release in prefrontal cortex with burst stimulation of the locus coeruleus. Brain Res 742: 89-97. [DOI] [PubMed] [Google Scholar]
- Foote SL, Freedman R, Oliver AP (1975) Effects of putative neurotransmitters on neuronal activity in monkey auditory cortex. Brain Res 86: 229-242. [DOI] [PubMed] [Google Scholar]
- Foote SL, Aston-Jones G, Bloom FE (1980) Impulse activity of locus coeruleus neurons in awake rats and monkeys is a function of sensory stimulation and arousal. Proc Natl Acad Sci USA 77: 3033-3037. [DOI] [PMC free article] [PubMed] [Google Scholar]
- Foote SL, Bloom FE, Aston-Jones G (1983) Nucleus locus ceruleus: new evidence of anatomical and physiological specificity. Physiol Rev 63: 844-914. [DOI] [PubMed] [Google Scholar]
- Foote SL, Berridge CW, Adams LM, Pineda JA (1991) Electrophysiological evidence for the involvement of the locus coeruleus in alerting, orienting, and attending. Prog Brain Res 88: 521-532. [DOI] [PubMed] [Google Scholar]
- George MJ (1992) Modification of receptive fields of posteriomedial barrel subfield neocortical single units by known concentrations of iontophoresed noradrenaline in the rat. Int J Neurosci 65: 69-81. [DOI] [PubMed] [Google Scholar]
- Holdefer RN, Jacobs BL (1994) Phasic stimulation of the locus coeruleus: effects on activity in the lateral geniculate nucleus. Exp Brain Res 100: 444-452. [DOI] [PubMed] [Google Scholar]
- Ishimatsu M, Williams JT (1996) Synchronous activity in locus coeruleus results from dendritic interactions in pericoerulear regions. J Neurosci 16: 5196-5204. [DOI] [PMC free article] [PubMed] [Google Scholar]
- Kossl M, Vater M (1989) Noradrenaline enhances temporal auditory contrast and neuronal timing precision in the cochlear nucleus of the mustached bat. J Neurosci 9: 4169-4178. [DOI] [PMC free article] [PubMed] [Google Scholar]
- Manunta Y, Edeline JM (1997) Effects of noradrenaline on frequency tuning of rat auditory cortex neurons. Eur J Neurosci 9: 833-847. [DOI] [PubMed] [Google Scholar]
- McCormick DA, Pape HC, Williamson A (1991) Actions of norepinephrine in the cerebral cortex and thalamus: implications for function of the central noradrenergic system. Prog Brain Res 88: 293-305. [DOI] [PubMed] [Google Scholar]
- Nawrot M, Aertsen A, Rotter S (1999) Single-trial estimation of neuronal firing rates: from single-neuron spike trains to population activity. J Neurosci Methods 94: 81-92. [DOI] [PubMed] [Google Scholar]
- Nicolelis MA, Ghazanfar AA, Faggin BM, Votaw S, Oliveira LM (1997) Reconstructing the engram: simultaneous, multisite, many single neuron recordings. Neuron 18: 529-537. [DOI] [PubMed] [Google Scholar]
- Nicolelis MAL, Chapin JK (1994) Spatiotemporal structure of somatosensory responses of many-neuron ensembles in the rat ventral posterior medial nucleus of the thalamus. J Neurosci 14: 3511-3532. [DOI] [PMC free article] [PubMed] [Google Scholar]
- Paxinos G, Watson C (1986) The rat brain in stereotaxic coordinates. San Diego: Academic.
- Rajkowski J, Kubiak P, Aston-Jones G (1994) Locus coeruleus activity in monkey: phasic and tonic changes are associated with altered vigilance. Brain Res Bull 35: 607-616. [DOI] [PubMed] [Google Scholar]
- Reader TA, Ferron A, Descarries L, Jasper HH (1979) Modulatory role for biogenic amines in the cerebral cortex. Microiontophoretic studies. Brain Res 160: 217-229. [DOI] [PubMed] [Google Scholar]
- Rogawski MA, Aghajanian GK (1980) Norepinephrine and serotonin: op posite effects on the activity of lateral geniculate neurons evoked by optic pathway stimulation. Exp Neurol 69: 678-694. [DOI] [PubMed] [Google Scholar]
- Usher M, Cohen JD, Servan-Schreiber D, Rajkowski J, Aston-Jones G (1999) The role of locus coeruleus in the regulation of cognitive performance. Science 283: 549-554. [DOI] [PubMed] [Google Scholar]
- Van der Loos H (1976) Barreloids in mouse somatosensory thalamus. Neurosci Lett 2: 1-6. [DOI] [PubMed] [Google Scholar]
- Videen TO, Daw NW, Rader RK (1984) The effect of norepinephrine on visual cortical neurons in kittens and adult cats. J Neurosci 4: 1607-1617. [DOI] [PMC free article] [PubMed] [Google Scholar]
- Waite PM (1973) Somatotopic organization of vibrissal responses in the ventro-basal complex of the rat thalamus. J Physiol (Lond) 228: 527-540. [DOI] [PMC free article] [PubMed] [Google Scholar]
- Waterhouse BD, Woodward DJ (1980) Interaction of norepinephrine with cerebrocortical activity evoked by stimulation of somatosensory afferent pathways in the rat. Exp Neurol 67: 11-34. [DOI] [PubMed] [Google Scholar]
- Waterhouse BD, Moises HC, Woodward DJ (1980) Noradrenergic modlation of somatosensory cortical neuronal responses to iontophoretically applied putative neurotransmitters. Exp Neurol 69: 30-49. [DOI] [PubMed] [Google Scholar]
- Waterhouse BD, Moises HC, Yeh HH, Woodward DJ (1982) Norepinephrine enhancement of inhibitory synaptic mechanisms in cerebellum and cerebral cortex: mediation by beta adrenergic receptors. J Pharmacol Exp Ther 221: 495-506. [PubMed] [Google Scholar]
- Waterhouse BD, Sessler FM, Cheng JT, Woodward DJ, Azizi SA, Moises HC (1988) New evidence for a gating action of norepinephrine in central neuronal circuits of mammalian brain. Brain Res Bull 21: 425-432. [DOI] [PubMed] [Google Scholar]
- Waterhouse BD, Azizi SA, Burne RA, Woodward DJ (1990) Modulation of rat cortical area 17 neuronal responses to moving visual stimuli during norepinephrine and serotonin microiontophoresis. Brain Res 514: 276-292. [DOI] [PubMed] [Google Scholar]
- Waterhouse BD, Moises HC, Woodward DJ (1998) Phasic activation of the locus coeruleus enhances responses of primary sensory cortical neurons to peripheral receptive field stimulation. Brain Res 790: 33-44. [DOI] [PubMed] [Google Scholar]
- Waterhouse BD, Mouradian R, Sessler FM, Lin RC (2000) Differential modulatory effects of norepinephrine on synaptically driven responses of layer V barrel field cortical neurons. Brain Res 868: 39-47. [DOI] [PubMed] [Google Scholar]