

Abstract
ATP is an important cell-to-cell signaling molecule mediating the interactions between astrocytes and neurons in the CNS. In the hippocampal slices, ATP suppresses excitatory transmission mostly through activation of adenosine A1 receptors, because the ectoenzyme activity for the extracellular breakdown of ATP to adenosine is high in slice preparations in contrast to culture environments. Because the hippocampus is also rich in the expression of P2 receptors activated specifically by ATP, we examined whether ATP modulates neuronal excitability in the acute slice preparations independently of adenosine receptors. Although ATP decreased the frequency of spontaneously occurring EPSCs in the CA3 pyramidal neurons through activation of adenosine A1 receptors, ATP concurrently increased the frequency of IPSCs in a manner dependent on action potential generation. This effect was mediated by P2Y1 receptors because (1) 2-methylthio-ATP (2meSATP) was the most potent agonist, (2) 2′-deoxy-N6-methyladenosine-3′,5′-bisphosphate diammonium (MRS2179) abolished this effect, and (3) this increase in IPSC frequency was not observed in the transgenic mice lacking P2Y1 receptor proteins. Application of 2meSATP elicited MRS2179-sensitive time- and voltage-dependent inward currents in the interneurons, which depolarized the cell to firing threshold. Also, it increased [Ca2+]i in both astrocytes and interneurons, but, unlike the former effect, the latter was entirely dependent on Ca2+ entry. Thus, in hippocampal slices, in addition to activating A1 receptors of the excitatory terminals after being converted to adenosine, ATP activates P2Y1 receptors in the interneurons, which is linked to activation of unidentified excitatory conductance, through mechanisms distinct from those in the astrocytes.
Keywords: A1 receptor, adenosine, CA3, EPSC, IPSC, calcium imaging, patch clamp, purinoceptors, ecto-nucleotidase, brain slice
Introduction
ATP functions as a cell-to-cell signaling molecule between hippocampal cells. ATP is released from hippocampal neurons (Pankratov et al., 1998; Mori et al., 2001; Khakh et al., 2003) and astrocytes (Koizumi et al., 2003; Zhang et al., 2003) through various mechanisms. Endogenously released or exogenously applied ATP is sensed directly by P2 receptors, i.e., the ionotropic P2X receptor channels (Khakh, 2001; North, 2002) and metabotropic G-protein-coupled P2Y receptors (von Kügelgen and Wetter, 2000), or indirectly by G-protein-coupled adenosine receptors (Dunwiddie and Masino, 2001) after a rapid conversion by ectonucleotidases (Dunwiddie et al., 1997; Braun et al., 1998). Activating these receptors produces various cellular responses, including the modulation of synaptic transmission.
The mechanism underlying the synaptic modulation by ATP in the hippocampal network is still a topic of debate. This issue mostly arises from the conflicting results of ATP effects on the neuronal excitability between the culture and the acute slice preparations. For example, in the acute hippocampal slice, the inhibitory effect of ATP on the excitatory synaptic transmission requires extracellular conversion of ATP to adenosine (Cunha et al., 1998) and activation of adenosine receptors (Dunwiddie et al., 1997) and does not occur in mice lacking A1 receptors (Masino et al., 2002). On the other hand, in cultured hippocampal cells, a similar inhibition by ATP arises through P2Y receptor activation independently of adenosine receptors (Koizumi et al., 2003). Recently, Zhang et al. (2003) demonstrated that endogenous ATP released from astrocytes attenuates excitatory synaptic transmission by activating P2Y receptors in the cultured synapses but through adenosine A1 receptors in the acute slice. This difference was attributed to the higher degree of extracellular breakdown of ATP in the acute slices (Zhang et al., 2003). These conflicting results might suggest that direct effects of ATP on P2 receptors, which are predominant in the culture preparations, play only a minor role or come into effect in the control of excitatory synaptic transmission only when the prevailing ecto-nucleotidase activity and adenosine receptor pathways are attenuated (Khakh et al., 2003; Zhang et al., 2003) in the slice.
Hippocampal neurons receive not only excitatory inputs but also inhibitory ones from interneurons (McBain and Fisahn, 2001). Those studies in slices shown above measured only the excitatory transmission. Kato and Shigetomi (2001) recently demonstrated in the brainstem slice that ATP affects the transmitter release from distinct terminals in distinct manners: in a subset of synapses, release is facilitated through activation of presynaptic P2X receptors, and, in another subset, release is reduced through activation of presynaptic adenosine A1 receptors after extracellular conversion of ATP to adenosine. A similar situation may take place in the hippocampal network for excitatory and inhibitory inputs (Khakh et al., 2003).
Here we show that, in acute hippocampal slices from rats and mice, exogenously applied ATP promotes spontaneously occurring inhibitory transmission by direct activation of P2Y receptors expressed at CA3 interneurons but inhibits the excitatory transmission through the activation of A1 receptors by adenosine produced from ATP, resulting in the synergic suppression of the pyramidal cell excitability.
Materials and Methods
Slice preparation. All experiments were performed in accordance with the Guiding Principles for the Care and Use of Animals in the Field of Physiological Sciences of the Physiological Society of Japan and approved by the local animal experiment committee. Wistar rats or mice (C57BL/6 strain or those lacking P2Y1 receptors; for details, see below) aged 7-15 d of either sex were anesthetized with ketamine (100-150 mg/kg, i.p.) and decapitated. Two to three coronal hippocampal slices of 400 μm thickness were made with a vibrating slice cutter (DTK-1000; Dosaka, Kyoto, Japan) in ice-cold low-calcium artificial CSF (ACSF) containing the following (in mm): 125 NaCl, 2.5 KCl, 0.1 CaCl2, 5 MgCl2, 1.25 NaH2PO4, 12.5 d-glucose, 0.4 l-ascorbic acid, and 25 NaHCO3 (osmolarity, 320 mOsm; pH 7.4 when saturated with 95% O2-5% CO2). The slices were incubated in standard ACSF (in mm: 125 NaCl, 2.5 KCl, 2 CaCl2, 1.3 MgCl2, 1.25 NaH2PO4, 12.5 d-glucose, 0.4 l-ascorbic acid, and 25 NaHCO3) saturated with 95% O2-5% CO2 for 30-40 min at 37°C and then kept at room temperature until the recording. The slice was fixed in a recording chamber (∼0.2 ml volume; RC-26GLP; Warner Instruments, Hamden, CT) under nylon strings attached to a U-shaped platinum frame and then submerged in and continuously perfused with ACSF at a flow rate of 2-3 ml/min. The CA3 pyramidal cells and interneurons were visually identified with an infrared-differential interference contrast (IR-DIC) video microscope [BX-50WI and BX-51WI (Olympus Optical, Tokyo, Japan); IR-1000 (Dage-MTI, Michigan City, IN)] and captured with an LG-3 frame grabber (Scion, Frederick, MD).
Whole-cell transmembrane current recordings: whole-cell recording. Patch electrodes were fabricated from borosilicate glass capillaries of 1.2 mm outer diameter (1B120F-4; World Precision Instruments, Sarasota, FL) with a programmable puller (P-87 or P-97; Sutter Instruments, Novato, CA). The following four types of internal solution were used. (1) “Low-Cl” internal solution contained (in mm) 135 gluconic acid potassium, 0.1 CaCl2, 2 MgCl2, 2 ATP magnesium, 0.3 GTP sodium, 1 EGTA, and 10 HEPES, pH 7.3 with KOH. Estimated ECl with this internal solution was -90 mV. This internal solution was used to record PSCs from the CA3 pyramidal neurons. The membrane potential was held at -60 mV (to analyze EPSCs and IPSCs simultaneously) or 0 mV (to analyze IPSCs only). (2) “CsCl-based” internal solution contained (in mm) 140 CsCl, 1 CaCl2, 2 ATP magnesium, 1 EGTA, and 10 HEPES, pH 7.3 with CsOH. Estimated ECl with this internal solution was 0 mV. This solution was used to analyze only the effects of 2-methylthio-ATP (2meSATP) on IPSCs to facilitate the automatic detection and visual identification of IPSCs. The IPSCs are presented as downward inflections in the traces for the recordings with this solution. IPSCs were recorded at a holding potential of -70 mV in the presence or absence of kynureic acid (1 mm). In the results obtained in the absence of kynureic acid, a smaller number (<0.5 Hz) of EPSC events might have been detected. In these cases, the term “PSC” was used to express those events. This recording condition was only used for the recordings made simultaneously with the [Ca2+]i imaging and did not essentially affect the result of 2meSATP effect on IPSC frequency because EPSC frequency was much smaller than that of IPSC (supplemental Fig. 1, available at www.jneurosci.org as supplemental material) and because 2meSATP (100 μm) did not affect EPSC frequency (before, 0.5 ± 0.2 Hz; with 2meSATP, 0.5 ± 0.2 Hz; n = 12; p = 0.99; ANOVA) (supplemental Fig. 2, available at www.jneurosci.org as supplemental material). (3) “K-gluconate” internal solution contained (in mm) 120 gluconic acid potassium, 0.5 CaCl2, 2 MgCl2, 0.5 EGTA, and 10 HEPES, pH 7.4 with KOH. This solution was used for the whole-cell recordings from interneurons. To visually identify the interneurons, AlexaFluor 568 (Molecular Probes, Eugene, OR) was included in the internal patch solution (0.0125%) and visualized by excitation with a 543 nm helium-neon laser with a confocal scanning laser microscope (Fluoview-300 and BX-51WI; Olympus Optical). This solution was also used to record the resting membrane potential immediately after patchmembrane rupture in interneurons, astrocytes, and pyramidal cells. The tip resistance of the electrodes filled with solutions 1-3 was 5-7 MΩ. (4) “Perforated-patch” solution contained 250 μg/ml amphotericin B (Sigma, St. Louis, MO), 115 mm gluconic acid potassium, 15 mm KCl, 0.5 mm EGTA, and 10 mm HEPES, pH 7.3 with KOH. This solution was used to record from a portion of interneurons and pyramidal cells (see Results). This solution was backfilled into the pipette, and the conventional perforated-patch configuration was established. The final series resistance was <40 MΩ.
The whole-cell recording mode was established with a brief negative current and pressure pulses after obtaining a cell-attached configuration (1-10 GΩ seal resistance). Recording started at least 10-15 min after the rupture of the patch membrane to allow stabilization of the intracellular milieu. Neurons showing unstable or large (more than ∼50 pA) holding currents were rejected. The series resistance (<30 MΩ) and membrane capacitance were compensated and checked regularly during the recording. If there was an apparent change in the series resistance (>20%) during the recording, the neuron was discarded. The transmembrane current and potential were recorded with an Axopatch 200B amplifier (Axon Instruments, Foster City, CA) with the high-cut filter at 2 kHz. The membrane current was sampled on-line at 4 kHz (PowerLab; AD-Instruments, Castle Hill, Australia) and stored on hard disk of a computer (Macintosh G4; Apple Computers, Cupertino, CA). All recordings were made at room temperature, except in four experiments in which the effect of ATP was examined in slices submerged in 31-32°C ACSF using an in-line heater controlled by a temperature controller (TC-324B and SH-27B; Warner Instruments).
Patch-clamp recordings from P2Y1-deficient mice. Coronal hippocampal slices of 400 μm thickness from homozygous P2Y1-deficient mice (Léon et al., 1999) aged 7-9 d were prepared according to the method described above. As described in the report by Léon et al. (1999), the P2Y1-deficient mice were generated by introducing targeted embryonic stem cells to C57BL/6 mice and intercrossed with this strain. Therefore, C57BL/6 mice were used as the wild-type control. Whole-cell patch recordings of IPSCs from CA3 pyramidal cells were performed with the CsCl-based internal solution (see above) in the presence of kynureic acid (1 mm). To compare the effects in rats and mice, the effect of 2meSATP on the IPSCs was examined also in Wistar rats using this internal solution (see Fig. 4).
Figure 4.
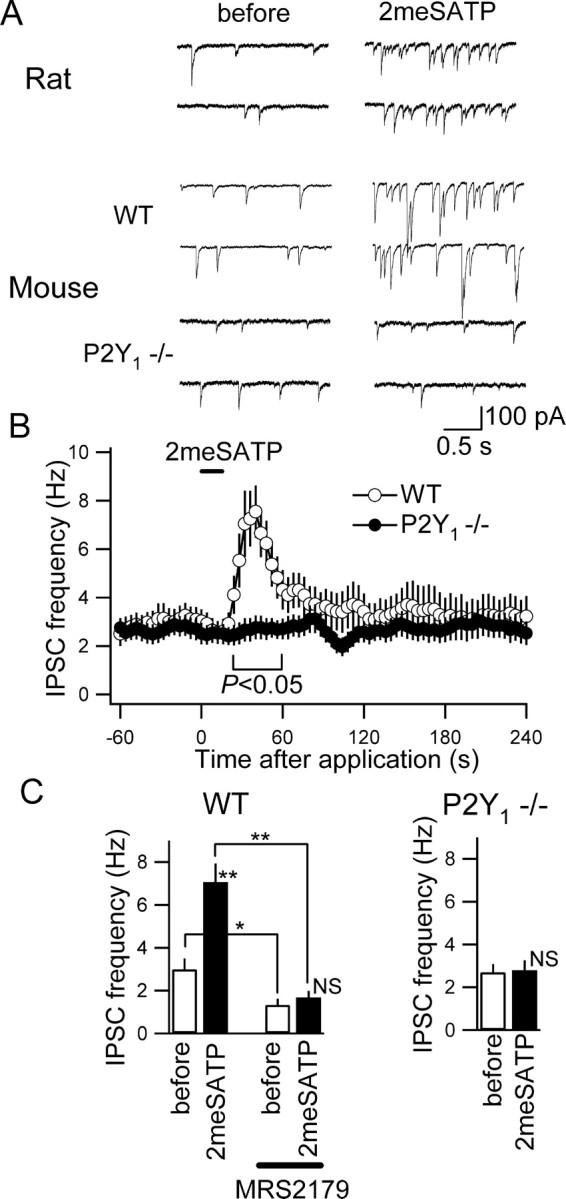
2meSATP did not increase IPSC frequency in CA3 pyramidal neurons from the P2Y1-deficient mice. A, Membrane current traces recorded with CsCl-based internal solution in the presence of kynureic acid (1 mm) from a CA3 pyramidal neuron from a rat (top traces), a wild-type mouse (WT; middle traces), and a P2Y1-deficient mouse (P2Y1-/-; bottom traces). Traces obtained before (left) and after (right) 2meSATP (100 μm) application. The holding potential was -70 mV. B, The time course of the changes in IPSC frequency with 2meSATP application. Mean and SE of nine neurons from eight slices from four wild-type mice (open circles) and 14 neurons from eight slices from four P2Y1-deficient mice (filled circles). IPSC frequency became significantly different (p < 0.05; ANOVA) between in the wild-type and in the P2Y1-deficient mice during the period indicated by the horizontal bar below the plots. C, Left, Summary of the effects of 2meSATP on IPSC frequency from wild-type mice in the absence and presence of MRS2179 (30 μm). *p < 0.05; **p < 0.01; NS, not significantly different (ANOVA); n = 8 from four wild-type mice. Right, Summary of the effects of 2meSATP on IPSC frequency recorded in P2Y1-deficient mice. NS, Not significantly different (ANOVA); n = 14 from four P2Y1-deficient mice.
Simultaneous measurement of intracellular calcium concentration and synaptic currents. Coronal hippocampal slices of 300 μm thickness from Wistar rats aged 7-8 d were incubated in ACSF containing Fluo-4 AM (8 μm; Molecular Probes) and cremophor EL (0.01%; Sigma) for 70-90 min at room temperature. Fluorescence of intracellular Fluo-4 was activated with a 488 nm argon laser and captured with a confocal scanning laser microscope (Fluoview 300 and BX-51WI; Olympus Optical). Images of two to three sequential focal planes separated by 5-10 μm were captured every 10 sec. Time courses of the fluorescence level of particular regions of interest are expressed as the change in fluorescence from the baseline level (ΔF) normalized by the baseline level fluorescence (F0). Simultaneous recording of IPSCs from CA3 pyramidal cells located within the confocal scanning frame was performed with CsCl-based internal solutions at a holding potential of -70 mV. In experiments in which the effect of extracellular Ca2+ deprivation was examined, we confirmed the abolishment of the PSC evoked by mossy fiber stimulation (100 μsec; 0.05-1 mA; 0.1 Hz) delivered through a stainless steel concentric bipolar electrode placed on the hilus (data not shown). The “Ca2+-free ACSF” solution contained 0 mm CaCl2, 3.3 mm MgCl2, and 0.2 mm EGTA. The “20 mm K+” solution contained 20 mm KCl and 107.5 mm NaCl.
Drugs and their application. ATP disodium, α,β-methylene ATP lithium (α,βmeATP), α,β-methylene ADP sodium (α,βmeADP), ATP 5′-O-(3-thiotriphosphate) tetralithium (ATPγS), 2meSATP tetrasodium, 2-methylthio ADP trisodium (2meSADP), 2′-3′-O-(4-benzoylbenzoyl) ATP triethylammonium (BzATP), adenosine, ADP sodium, 8-cyclopentyl-1,3-dipropylxanthine (DPCPX), pyridoxal-phosphate-6-azophenyl-2′,4′-disulphonic acid tetrasodium (PPADS), 2′-deoxy-N6-methyladenosine-3′,5′-bisphosphate diammonium (MRS2179), (S)-amethyl-4-carboxyphenylglycine (MCPG), 6-cyano-7-nitroquinoxaline-2,3-dione disodium (CNQX), kynureic acid, and bicuculline methiodide were purchased from Sigma. Tetrodotoxin citrate (TTX) was from Alomone Labs (Jerusalem, Israel). 2′,3′-O-(2,4,6-Trinitrophenyl)-ATP trisodium (TNP-ATP) was from Molecular Probes. 1-[6-[[17 β-3-Methoxyestra-1,3,5(10)-trien-17-yl]amino]hexyl]-1H-pyrrole-2,5-dione (U-73122) was from Calbiochem (San Diego, CA). All drugs were stored as frozen stock solutions at 200 to 20,000 times the desired final concentration and dissolved in ACSF just before the application. The stock solutions of DPCPX were made with 99.5% ethanol, and the stock solutions of U-73122 were made with DMSO. MRS2179, PPADS, DPCPX, TNP-ATP, U-73122, α,βmeADP, kynureic acid, MCPG, and TTX were bath applied. ATP, α,βmeATP, ATPγS, 2meSATP, 2meSADP, ADP, and adenosine were applied locally to the slice with a glass pipette (inner diameter, 0.7 mm) whose tip was placed ∼2-5 mm upstream of the tip of the recording electrode. The position of this application pipette was constant throughout the recordings. The application through this pipette was remote controlled by an electromagnetic valve-based application system (VC-6; Warner Instruments). At least a 10 min interval was allowed between repeated applications of all agonists, even if there was no detectable effect. The ACSF with MRS2179, PPADS, DPCPX, TNP-ATP, α,βmeADP, kynureic acid, MCPG, or TTX was perfused at least for 10 min and U-73122 for 30 min before testing the effects of agonists. After blocker application, no additional neurons were recorded in the same slice.
Data analysis. The recorded membrane current was analyzed off-line with an Igor Pro 5 (WaveMetrics, Lake Oswego, OR) program with the Igor Pro procedures written by F. Kato. Each event of spontaneous EPSC or spontaneous IPSC was detected, and its amplitude and occurrence timing were measured with an Igor Pro procedure. Amplitude was calculated by subtraction of the pre-event mean of the membrane current from the event current. All detected events were monitored and checked visually to ensure that all detected events had typical PSC waveforms. The detected events with peak amplitude smaller than 95% of the basal noise level were rejected. To compare the event frequency before and after agonist application, the mean event frequency over a 1 min period before the application was taken to be the “control” value, and the mean event frequency over a 20 sec period starting from the time at which the maximal effect was attained was taken as the “after agonist” value. When the effect of an agonist was tested in the presence of an antagonist, which often blocked the responses to the agonist, this 20 sec time window was chosen at the same moment in time after agonist application as that in the absence of the antagonist.
Statistical analysis. The values are expressed as mean ± SEM values. Differences were compared with the nonparametric Mann-Whitney's U test for normalized values. Differences in the spontaneous PSC frequencies before and after drug treatment were compared with a one-way ANOVA. The difference between the value at each time point and that of preapplication was examined using a paired t test (see Fig. 1 B). The difference between the value at each time point of IPSC frequency from wild-type and P2Y1-deficient mice was examined using a one-way ANOVA (see Fig. 4 B). Differences with p < 0.05 were considered significant.
Figure 1.

ATP increased IPSC frequency and decreased EPSC frequency. A, Simultaneous recording of EPSCs and IPSCs from a CA3 pyramidal neuron. ATP (1 mm) was applied at the horizontal bar. a-c are the time-extended traces taken at the points a-c in the trace in A. IPSCs and EPSCs (outward and inward events, respectively) are marked with open circles above the trace and filled circles below the trace, respectively. B, The time course of the changes in frequencies of IPSC and EPSC (top and bottom, respectively) with ATP application. Each point and vertical bar represents mean and SE of 22 neurons, onto which ATP (1 mm) was applied. The frequency became significantly different (p < 0.05; paired t test) from the preapplication value at the times marked with * at the bottom of plots. C, Summary of the effects of ATP on the frequencies of IPSC (left) and EPSC (right). **p < 0.01 (ANOVA); n = 22.
Results
ATP increases IPSC frequency and decreases EPSC frequency
First, we analyzed the effect of ATP on simultaneously recorded spontaneous EPSCs and IPSCs from the pyramidal neurons in the CA3 region. Using the internal solution containing 4.2 mm Cl-, (estimated ECl of -90 mV), the spontaneous postsynaptic currents were recorded at a holding potential of -60 mV, at which EPSCs and IPSCs were seen as inward and outward postsynaptic events, respectively (Fig. 1A). The inward currents showed faster decay kinetics (time constant, 8.9 ± 0.8 msec; mean ± SE of 100 randomly chosen events recorded in five neurons), reversed at ∼0 mV, and were abolished by CNQX (10 μm), suggesting that they are EPSCs mediated by non-NMDA receptors (data not shown) (supplemental Fig. 1B,C, available at www.jneurosci.org as supplemental material). In contrast, the outward currents had slower decay kinetics (time constant, 18.2 ± 2.5 msec), were not observed at a holding potential of -90 mV, and were abolished by bicuculline (10 μm; data not shown) (supplemental Fig. 1B,C, available at www.jneurosci.org as supplemental material), suggesting that they are GABAA receptor-mediated IPSCs. The amplitude distribution of postsynaptic events and basal noise levels indicated that these EPSCs and IPSCs were clearly distinguishable from the noise and from each other under the present recording conditions (supplemental Fig. 1D, available at www.jneurosci.org as supplemental material).
Figure 1 depicts typical responses of EPSCs and IPSCs to ATP in a CA3 pyramidal neuron. After a 15 sec application of ATP (1 mm), the frequency of IPSCs was increased (Fig. 1A, open circles), whereas that of EPSCs was decreased (Fig. 1A, filled circles). Similar frequency responses were observed in all 22 CA3 pyramidal neurons onto which 1 mm ATP was applied. Figure 1B shows the time course of the changes in the IPSC frequency (top) and the EPSC frequency (bottom) after ATP application. The IPSC frequency started to increase during or immediately after ATP application and became highest within ∼25 sec (24.1 ± 1.8 sec; n = 22) and then rapidly recovered to a value similar to that before ATP application within ∼1 min during washout (Fig. 1B, top). The duration of this increase in IPSC frequency was likely to be limited by an intrinsic mechanism because the durations were not significantly different between those with 15 and 90 sec application examined in the same neurons (the periods during which the IPSC frequency remained higher than the 20% of the maximal effect were 31.8 ± 2.7 and 33.4 ± 2.0 sec for 15 and 90 sec applications, respectively; n = 5; p = 0.65). Even when ATP was applied for 90 sec, the time-to-peak of the IPSC frequency increase (23.4 ± 2.3 sec; n = 5) was not significantly different from that with 15 sec application (p = 0.65; ANOVA). These observations indicate that the IPSC frequency was increased to its maximal value in response to 15 sec application of agonists. The following analyses were therefore made with the data with 15 sec applications.
In contrast, the frequency of simultaneously recorded EPSCs gradually decreased after ATP application (Fig. 1B, bottom). The maximal decrease was attained at 77.6 ± 8.5 sec (n = 22) after ATP application, a latency significantly larger than that for the increase in IPSC frequency (p < 0.01), indicating that the decrease in EPSC frequency is not a direct consequence of the IPSC increase. This decrease in EPSC frequency slowly recovered to the preapplication value within 3-5 min (Fig. 1B, bottom).
In contrast to these changes in the frequency, the amplitudes of IPSC and EPSC were not significantly affected by ATP application. The average amplitudes of the EPSCs and IPSCs appearing during a 60 sec period (before ATP application) and a 20 sec period (during the effect of ATP) were changed from 14.8 ± 1.2 pA (range, 7.7-24.7 pA) to 16.3 ± 1.9 pA (7.6-47.8 pA) and from -21.3 ± 1.7 pA (-10.3 to -35.6 pA) to -19.7 ± 1.7 pA (-8.5 to -34.3 pA), respectively (n = 22; p = 0.48 and p = 0.51, respectively; ANOVA), suggesting that there were no apparent postsynaptic effects of ATP. IPSC and EPSC frequency responses could be reproduced when ATP was applied two to three times with intervals of 10-50 min (data not shown; the maximal trial time was three). The maximal effects of ATP on IPSC and EPSC frequency observed in each neuron are summarized in Figure 1C. ATP significantly increased IPSC frequency from 1.4 ± 0.2 to 4.3 ± 0.6 Hz (n = 22; p < 0.01) (Fig. 1C, left) and significantly decreased EPSC frequency from 0.64 ± 0.09 to 0.14 ± 0.03 Hz (n = 22; p < 0.01) (Fig. 1C, right). This increase in IPSC frequency and decrease in EPSC frequency were consistently observed in all 22 neurons analyzed. These results were obtained in the recordings made at room temperature. Also, at a more physiological temperature (32°C), ATP (1 mm) elicited similar changes in IPSC and EPSC frequencies in the recordings made. IPSC frequency was significantly (p < 0.01) increased from 1.0 ± 0.3 to 3.9 ± 0.1 Hz, and EPSC frequency was significantly (p < 0.05) decreased from 0.2 ± 0.1 to 0.02 ± 0.02 Hz (n = 4; ANOVA), suggesting that these effects of ATP occur at a physiological temperature.
ATP (1 mm) did not activate apparent inward currents (shift in holding current after ATP application was 0.4 ± 0.5 pA; mean of absolute value was 1.9 ± 0.3 pA; range, -4.5 to +4 pA). The cellular mechanisms underlying these opposite effects on EPSC and IPSC frequency are analyzed in detail below.
Pharmacological analysis of the IPSC frequency increase by ATP points to an involvement of P2Y1 receptors
We sought to pharmacologically identify the purinoceptor mediating the increase in IPSC frequency by ATP. Among the agonists examined, 2meSATP and 2meSADP were most potent in increasing the IPSC frequency (Fig. 2). On average, 100 μm 2meSATP significantly increased IPSC frequency to 284.5 ± 62.2% (n = 12; p < 0.01). ATP, ADP, ATPγS, and α,βmeATP had moderate effects and significantly increased the IPSC frequency at a concentration of 300 μm or 1 mm (Fig. 2B). Adenosine, however, decreased the IPSC frequency (Fig. 2B). BzATP (100 μm) did not significantly affect the IPSC frequency (before BzATP, 2.0 ± 0.8 Hz; after BzATP, 1.8 ± 0.8 Hz; p = 0.89), ruling out a possible involvement of P2X7 receptor channels (Armstrong et al., 2002; Sim et al., 2004). Although the effect was not statistically significant when all data were pooled, ATP increased the IPSC frequency even at a concentration of 100 μm in 7 of 12 neurons and 300 μm in 5 of 7 neurons.
Figure 2.

Effects of purinoceptor agonists on IPSC frequency. A, The membrane current traces recorded before (left) and near the peak of the effect after agonist application (right). ATP (1 mm), 2meSATP (100 μm), and 2meSADP (100 μm), but not adenosine (1 mm), increased the IPSC frequency (recorded as outward events). B, Summary of the effects of the purinoceptor agonists ATP (100 μm, n = 12; 300 μm, n = 7; 1 mm, n = 22), 2meSATP (100 μm, n = 12; 300 μm, n = 5), 2meSADP (100 μm, n = 4), ATPγS (100 μm, n = 5; 300 μm, n = 5), ADP (100 μm, n = 4; 300 μm, n = 4; 1 mm, n = 5), α, β-meATP (100 μm, n = 6; 300 μm, n = 5; 1 mm, n = 8), and adenosine (100 μm, n = 10; 300 μm, n = 5; 1 mm, n = 6) on IPSC frequency. Ordinate, Changes in the IPSC frequency expressed as the percentage of the preapplication value; they are from the same set of neurons shown in supplemental Figure 2 A (available at www.jneurosci.org as supplemental material). *p < 0.05; **p < 0.01 (Mann-Whitney U test).
We next examined the effects of P2 receptor antagonists on the IPSC frequency increase. To this purpose and based on the results shown above, we used 2meSATP (100 μm) as the principal agonist. Among the antagonists examined, MRS2179, a selective antagonist of the P2Y1 receptor (von Kügelgen and Wetter, 2000), was most potent in inhibiting the effect of 2meSATP (Fig. 3A1,A2). In the presence of MRS2179 (30 μm), 2meSATP no longer increased the IPSC frequency (Fig. 3A1), an effect that recovered almost entirely after 30 min of washout (Fig. 3A). Interestingly, addition of MRS2179 to the perfusate itself significantly reduced the frequency of spontaneously occurring IPSCs (Fig. 3A2), a result suggestive of activation of P2Y1 receptors by spontaneously released endogenous ATP. PPADS at 40 μm, but less potently at 10 μm, significantly inhibited the potentiating effect of 2meSATP on the IPSC frequency (Fig. 3B). TNP-ATP (10 μm), an antagonist of P2X receptors with no reported antagonism to P2Y receptors, and DPCPX (1 μm) did not significantly affect the increase in IPSC frequency induced by 2meSATP (Fig. 3C,D). These results indicate that the purinoceptor most likely underlying the increase in IPSC frequency is the P2Y1 receptor.
Figure 3.

Effects of purinoceptor antagonists on the increase in IPSC frequency. A1, The time course of the changes in PSC frequency with 2meSATP (100 μm) in the absence of MRS2179 (open circles), in the presence of MRS 2179 (30 μm; filled triangles), and after 30 min of washout (open squares). Each point and vertical bar represent mean and SE of four neurons. A2, Summary of the effect of MRS2179 on the increase in PSC frequency with 2meSATP. *p < 0.05; **p < 0.01; NS, not significantly different (ANOVA); n = 4. B, The summary of the effect of PPADS (40 μm) on the increase in IPSC frequency with 2meSATP. *p < 0.05; NS, not significantly different (ANOVA); n = 5. C, Summary of the effect of TNP-ATP (10 μm) on the effect of 2meSATP on the IPSC frequency. *p < 0.05; NS, not significantly different (ANOVA); n = 5. D, The summary of the effect of DPCPX on the effects of ATP (1 mm) on IPSC frequency; they are from the same set of neurons shown in supplemental Figure 2B (available at www.jneurosci.org as supplemental material). *p < 0.05; **p < 0.01; NS, not significantly different (ANOVA); n = 6.
Decrease in EPSC frequency is mediated by adenosine A1 receptor activation
Four pieces of evidence argue in favor that the decrease in EPSC frequency stems from the activation of adenosine A1 receptors by adenosine produced from applied ATP (described in detail in the supplemental information, available at www.jneurosci.org as supplemental material). First, not only ATP but also adenosine, ATPγS, and ADP significantly decreased the EPSC frequency. Second, a selective antagonist of A1 receptors, DPCPX (1 μm), but not PPADS, an antagonist of P2 receptors, significantly reduced the effect of ATP on EPSC frequency. Third, α,βmeADP (100 μm), an inhibitor of the 5′-ecto-nucleotidase, which is primarily responsible for the ATP-to-adenosine conversion in the hippocampus (Braun et al., 1998; Cunha et al., 1998), significantly reduced the effect of ATP on EPSC frequency but not that on IPSC frequency. Fourth, ATP required a longer time to attain the maximal effect than adenosine. These results indicate that extracellular conversion of ATP to adenosine and the subsequent activation of A1 receptors, not P2 receptors, were necessary for the inhibitory effect of ATP on the EPSC frequency. This is consistent with previous reports indicating that the inhibitory effect of ATP on excitatory synaptic transmission requires the conversion of ATP to adenosine in the acute slice (Cunha et al., 1998; Masino et al., 2002).
IPSC frequency is not increased by 2meSATP in mice lacking P2Y1 receptors
If P2Y1 receptors mediate the effect of 2meSATP on IPSC frequency, this effect should not be observed in the hippocampus devoid of P2Y1 receptor proteins. We directly examined this by using mice in which the P2Y1 receptor gene is knocked-out (P2Y1-/-) (Léon et al., 1999). In this series of experiments, we used the CsCl-based internal patch solution to facilitate the detection of IPSCs in the presence of kynureic acid. First, we verified that the effect of 2meSATP was similarly observed with this patch solution to that observed with the low-Cl solution described above in the CA3 pyramidal neurons of the rats. 2meSATP (100 μm) significantly increased IPSC frequency from 2.4 ± 0.6 to 7.2 ± 1.0 Hz (n = 4; p < 0.01; ANOVA) in the rat CA3 (Fig. 4A, Rat). In wild-type mice (C57BL/6), 2meSATP (100 μm) significantly increased the IPSC frequency in a manner highly similar to what has been observed in the rats (from 3.0 ± 0.5 to 7.0 ± 0.9 Hz; n = 9; p < 0.01) (Fig. 4A,B), whereas in P2Y1-/- mice, it did not significantly affect IPSC frequency (Fig. 4A, bottom traces; B, filled circles). In wild-type animals, the significant increase in IPSC frequency induced by 2meSATP was significantly attenuated by MRS2179 (30 μm), suggesting that in mice, as in rats, this effect is mediated by P2Y1 receptors (Fig. 4C, left). Similarly, in mice, MRS2179 alone significantly reduced spontaneous IPSC frequency. In contrast, 2meSATP exerted no significant effect on the IPSC frequency in the P2Y1-/- mice (Fig. 4C, right). Together, these observations strongly argue that the purinoceptors involved in the potentiating effects of ATP analogs on IPSC frequency are P2Y1 receptors.
Activation of P2Y1 receptors activates inward currents in interneurons and brings them to firing threshold
The increase in IPSC frequency might result from (1) increase in the probability of GABA release from the interneuron termini (Khakh et al., 2003; Shigetomi and Kato, 2004) or (2) increase in the number of action potentials generated in interneurons excited by P2Y1 receptor agonists (Molliver et al., 2002; Brockhaus et al., 2004). We examined these possibilities by observing the effect of 2meSATP in the presence of TTX in the rat hippocampus. TTX (1 μm) significantly decreased the frequency of spontaneous IPSC from 1.06 ± 0.24 to 0.04 ± 0.01 Hz (n = 5; p < 0.01), indicating that a large portion of spontaneous IPSCs resulted from action potential-dependent release. Before the addition of TTX, 2meSATP significantly increased IPSC frequency to 3.54 ± 0.59 Hz (441.7 ± 128.1% of control), whereas in the presence of TTX, IPSC frequency was not significantly affected by 2meSATP (changed to 0.04 ± 0.02 Hz; 80.5 ± 45.7% of control). These results indicate that the effect of 2meSATP on pyramidal IPSC is dependent on action potentials in the inhibitory interneurons. In other words, 2meSATP increased the occurrence frequency of action potential-“evoked” IPSCs in pyramidal neurons.
To directly confirm that the activation of P2Y1 receptors leads to action potentials in the interneurons, we recorded the membrane current and membrane potential of morphologically and electrophysiologically identified interneurons in the CA3 region (Fig. 5A,B). During the same time period that 2meSATP increased the IPSC frequency in the pyramidal neurons (Fig. 5C, top, PYR), 2meSATP depolarized the interneurons from the resting potential to values more positive than the action potential threshold (Fig. 5C, middle, IN1) and generated an inward current when interneurons were voltage clamped at -70 mV (Fig. 5C, bottom, IN2). It is likely that this 2meSATP-induced inward current in interneurons underlies the IPSC frequency increase by ATP observed in the pyramidal cells.
Figure 5.
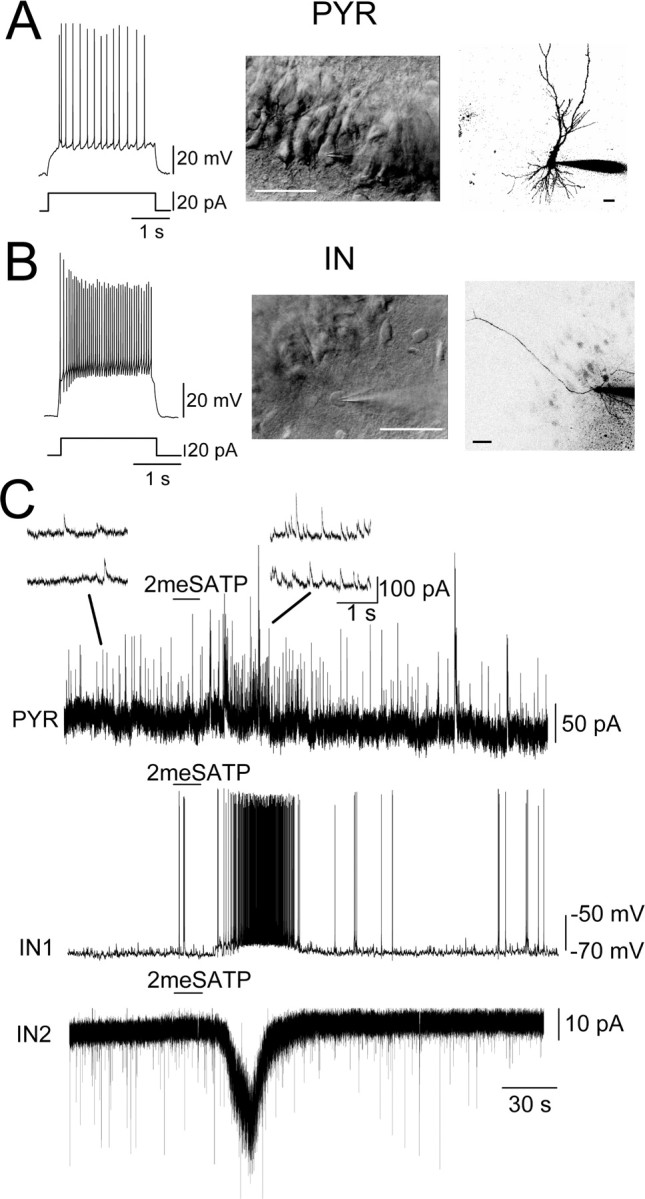
2meSATP excited interneurons in the stratum oriens in the CA3. A, An example of a pyramidal (PYR) neuron. Left trace, The membrane potential response to a 20 pA depolarizing current injection. Middle, An IR-DIC image of the CA3 region, from which the pyramidal neuron (PYR) showing the responses in A and C was recorded (the cell with the patch pipette tip). Scale bar, 50 μm. Right, A confocal image of the pyramidal neuron and the tip of a patch pipette filled with AlexaFluor 568. Scale bar, 50 μm. B, Left trace, Membrane potential response to a 40 pA depolarizing current injection. Middle, An IR-DIC image showing the interneuron (IN) recorded in the stratum oriens (the cell with the patch pipette tip). Scale bar, 50 μm. Right, A confocal image of the interneuron and the tip of a patch pipette filled with AlexaFluor 568. Scale bar, 50 μm. C, PYR, Membrane currents of the CA3 pyramidal neuron recorded with low-Cl internal solution at a holding potential of 0 mV. 2meSATP (100 μm) was applied at the horizontal bar. Consecutive time-extended versions of the membrane current are shown as insets above. IN1, The membrane potential of the interneuron shown in B. IN2, The membrane current of the interneuron in the stratum oriens. The holding potential was -70 mV. Note that the increase in IPSC frequency (PYR), the action potential generation (IN1), and the inward current (IN2) in response to 2meSATP were of highly similar time course.
The membrane currents of the interneurons were recorded in two distinct configurations. Approximately 17% of the interneurons (6 of 35) located in the stratum oriens (S.O.) (Fig. 5B) and recorded with the conventional whole-cell configuration showed clear detectable inward current in response to 2meSATP application (12.0 ± 2.4 pA; range, 7.1-23.1 pA; n = 6). The resulting depolarization recorded under current-clamp conditions was 9.2 ± 1.0 mV (range, 7.2-11.7 mV; n = 4), which brought all cells examined to fire action potentials. The firing frequency increased from 0 Hz (i.e., no action potential) to 4.8 ± 1.7 Hz (n = 4; p < 0.05) with 2meSATP. Approximately 40% of the interneurons (21 of 50) recorded with the perforated-patch configuration displayed inward currents in response to 2meSATP (15.5 ± 2.2 pA; range, 3-39.8 pA; n = 21). Even with the perforated-patch configuration, 2meSATP did not produce any detectable current in the pyramidal neurons (mean absolute amplitude, 0.4 ± 0.1 pA; range, -0.6 to +1.1 pA; n = 15). Application of 2meSATP did not significantly change the EPSC frequency recorded from interneurons showing 2meSATP-evoked inward currents (control, 0.51 ± 0.22 Hz; with 2meSATP, 0.52 ± 0.26 Hz; n = 6; p = 0.96).
The properties of this 2meSATP-induced inward current were further analyzed. First, this current was abolished by MRS2179 in a reversible manner (Fig. 6A), strongly reinforcing the idea that this inward current is downstream to the activation of P2Y1 receptors. Second, despite the similar degree of activation of this inward current with both the whole-cell and perforated-patch configurations as shown above, the 2meSATP-activated current exhibited a strong rundown effect with the whole-cell recording but not with the perforated-patch configuration. With the whole-cell patch, the inward current amplitude in response to the second application of 2meSATP (time interval, 10-15 min) was 16.8 ± 7.2% (n = 3) of that observed with the first application, whereas with the perforated-patch configuration, the amplitude of second response was 96.4 ± 8.4% (n = 4) of the first response. This result indicates that a sustained level of soluble intracellular messengers is required to maintain the P2Y1 receptor-activated inward current and is in accordance with the result described above: namely, that the increase in IPSC frequency could be repeatedly observed in a slice. Third, even when 2meSATP was applied for a longer period, the inward current was inactivated with a similar time course to that observed with 15 sec application. The inward current larger than 10% of the maximal current was observed for 23.1 ± 3.3 and 25.3 ± 4.0 sec with 15 and 90 sec, respectively, applications (p = 0.68; n = 4), suggesting that there is a time- or influx-dependent inactivation mechanism that limits the duration of activation of this current. This result is in good accordance with the results described above of the duration of IPSC increase in response to ATP recorded in the pyramidal neurons. Fourth, this inward current reversed at approximately -10 mV and showed slight outward rectification when the I-V relationship was determined by ramp clamp (Fig. 6B). In three interneurons in the S.O. showing inward currents or depolarization in response to 2meSATP, we analyzed their projection patterns (Fig. 5B). The axons of these responding cells had few collaterals and extended beyond the pyramidal layer to the stratum radiatum (S.R.), suggesting that these cells are the stratum oriens-lacunosum-molecular cells or basket cells. However, as indicated below in the Ca2+ imaging, interneurons responding to 2meSATP could be found also in S.R., suggesting that expression of P2Y1 receptor is not restricted to a specific class of interneurons as with many other interneuron-specific proteins (McBain and Fisahn, 2001).
Figure 6.

2meSATP elicited MRS2179-sensitive and voltage-dependent inward currents in the interneurons. A1, Effect of MRS2179 (30 μm) on the inward current generated by 2meSATP (100 μm; horizontal bar). A whole-cell perforated-patch recorded from an interneuron in the absence (control) and presence (+MRS2179) of MRS2179 and after 30 min of washout. The holding potential was -70 mV. A2, Summary of the effect of MRS2179 (30 μm). **p < 0.01 (ANOVA); n = 4. B, Current-voltage relationship of the current generated in response to 2meSATP application (I2meSATP) in the presence of TTX (1 μm). B1, Top, Original traces showing the membrane current in response to a ramp command (shown as inset) before (1) and during (2) 2meSATP application. The cells were first kept at +30 mV and hyperpolarized to -120 mV at a velocity of 150 mV/sec. Bottom, Membrane current during the ramp command before (solid curve, 1) and during (broken curve, 2) 2meSATP. The two curves crossed each other at the potential indicated with an arrow. B2, Summary of the current-voltage relationship of I2meSATP as measured by subtracting the ramp-command responses. Mean and SE of three interneurons.
The interneuron excitation by P2Y1 receptor activation occurred independently of astrocytic P2Y1 receptor activation
These data described above point to a possibility that ATP directly excites CA3 interneurons. This is a surprising conclusion because the functional P2Y1 receptors ever described to date in the hippocampus is only those expressed in the astrocytes, which are coupled to phospholipase activation, inositol-1,4,5-triphosphate (Ins3P) production, and subsequent increase in [Ca2+]i resulting from Ca2+ release from the intracellular stores (Idestrup and Salter, 1998). Evidence indicates that these mechanisms underlie ATP-mediated Ca2+ waves between astrocytes (Koizumi et al., 2003). To further confirm that the P2Y1 receptor-mediated responses of the interneurons occur independently of activation of astrocytic P2Y1 receptors through different mechanisms, we performed the following three series of experiments.
First, we examined the effect of inhibiting the downstream events to the P2Y1 receptor activation. In astrocytes, Ins3P production is mediated by phospholipase C activated after P2Y1 receptor activation (Troadec et al., 1999). However, in the CA3 interneurons, U-73122, an inhibitor of phospholipase C, did not significantly affect the IPSC frequency increase by 2meSATP at a larger concentration (10 μm) than that completely abolishes [Ca2+]i changes in the astrocytes (0.5-1 μm) (Idestrup and Salter, 1998; Troadec et al., 1999; Koizumi et al., 2002). In the absence and presence of U-73122, IPSC frequency increased from 3.0 ± 1.3 to 8.1 ± 0.7 Hz and from 2.8 ± 1.3 to 8.5 ± 0.9 Hz, respectively (n = 4; p = 0.72), suggesting that increase in IPSC frequency does not involve phospholipase pathways, in a similar manner to that reported for recombinant P2Y1 receptors expressed in the oocytes, which is linked to unidentified cation conductance (O'Grady et al., 1996).
Second, we examined the effect of blocking glutamate receptors. It has been reported that stimulation of astrocytes with P2 receptor agonists results in Ca2+ waves (Koizumi et al., 2002) and glutamate release from astrocytes (Zhang et al., 2004) and that interneurons express ionotropic and metabotropic glutamate receptors, the activation of which results in membrane depolarization (Woodhall et al., 1999; Mori and Gerber, 2002; Khakh et al., 2003). To examine whether the glutamate released from excited astrocytes could underlie interneuron excitation, we examined whether the IPSC frequency increase by 2meSATP is inhibited by ionotropic and metabotropic glutamate receptor antagonists (Fig. 7). The significant increase in IPSC frequency was unaffected by the presence of kynureic acid (1 mm), an antagonist of the ionotropic glutamate receptors, or MCPG (500 μm), an antagonist of the metabotropic glutamate receptors. These results rule out the possible involvement of ATP-induced glutamate release from astrocytes in the 2meSATP effect. It is likely that 2meSATP directly activates P2Y1 receptors present on interneurons.
Figure 7.

Increases in IPSC frequency by 2meSATP did not involve ionotropic and metabotropic glutamate receptors. A, Summary of the effect of ionotropic glutamate receptor antagonist kynureic acid (1 mm) on the increase in IPSC frequency with 2meSATP (100 μm). **p < 0.01; NS, not significantly different (ANOVA); n = 5. B, Summary of the effect of metabotropic glutamate receptor antagonist MCPG (500 μm) on the effects of 2meSATP on IPSC frequency. **p < 0.01; NS, not significantly different (ANOVA); n = 5.
Third, we measured changes in [Ca2+]i in response to 2meSATP in different types of cells in the hippocampal slice. It is known that [Ca2+]i increase in the astrocytes after P2Y1 receptor activation remains in the absence of extracellular Ca2+, an indication of intracellular Ca2+ mobilization (Zhu and Kimelberg, 2001). If P2Y1 receptors in the interneurons are linked exclusively to the excitatory conductance activation, [Ca2+]i increase by their activation would result entirely from Ca2+ entry through this conductance and/or voltage-dependent Ca2+ channels. In addition, visualization of [Ca2+]i changes enables to analyze the location of neurons excited by 2meSATP, which is otherwise difficult to estimate on the basis of patch-clamp recording from individual cells.
It has been shown that 20 mm K+ does not elicit [Ca2+]i changes in astrocytes (Duffy and MacVicar, 1994). The membrane potential of astrocytes at a [K+]o of 20 mm, estimated according to the Goldman equation and measured resting potential (-88.3 mV; n = 5) in the present experimental condition, is -46.0 mV, which is below the activation threshold of astrocytic Ca2+ channels (D'Ascenzo et al., 2004). In contrast, pyramidal neurons and interneurons will be depolarized to -39.8 and -40.9 mV, respectively, at a [K+]o of 20 mm (estimated based on measured resting potentials of -65.2 and -68.2 mV, respectively; n = 5). These estimated values exceed the firing threshold. Therefore, in combination with morphological verification by IR-DIC images (Fig. 8A2) (Kang et al., 1998; Lüscher et al., 1998), effects of 20 mm K+ on [Ca2+]i was used to distinguish astrocytes from neurons.
Figure 8.
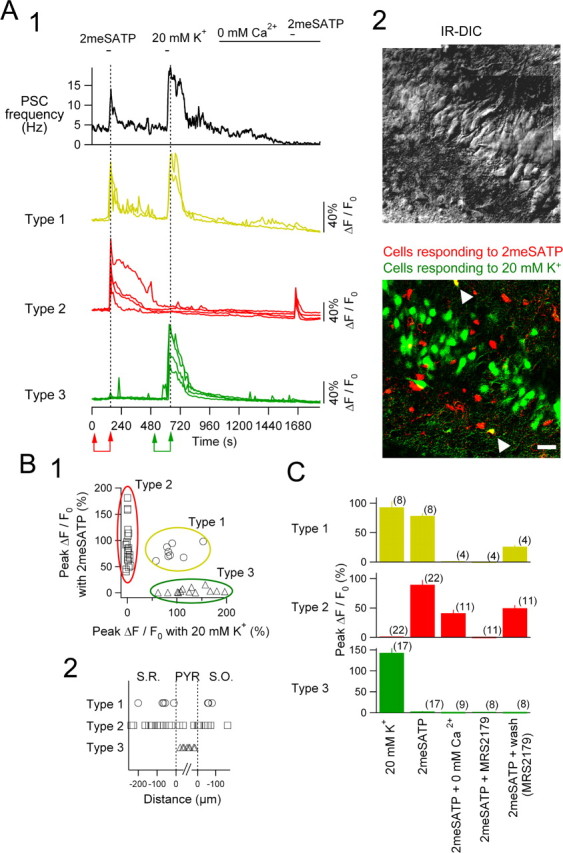
Imaging of [Ca2+]i in the CA3 slice with simultaneous recording of the postsynaptic current of a pyramidal cell. A1, Top trace, PSC frequency of a CA3 pyramidal neuron recorded with CsCl-based internal solution at a holding potential of -70 mV; bottom traces, relative changes in Fluo-4 fluorescence of 10 representing cells shown at the bottom of A2. For the classification of types 1-3, see Results. 2meSATP (100 μm) and 20 mm K+ solution were applied at the respective horizontal bars. The ACSF was replaced by the Ca2+-free ACSF during the period indicated with the horizontal bar denoted 0 mm Ca2+. A2, Top, An IR-DIC image showing the location of the CA3 peri-pyramidal layer in which [Ca2+]i imaging was made. Note a patch pipette on a pyramidal neuron in the center. Bottom, A merged image of two images: one showing cells responding to 2meSATP in red and another showing cells responding to 20 mm K+ in green. This projected confocal image indicates the same region as in the IR-DIC image of the top panel. Images of the cells responding to each solution were obtained by subtracting the fluorescence intensity of each pixel acquired before the application from that at the peak of the PSC effect (pairs of arrows in red and green at the bottom of A1). Note that two cells in the merged image in A2 are in yellow (white arrowheads), indicating that they responded to both 2meSATP and 20 mm K+ (type 1 cells in A1). Scale bar, 50 μm. B1, Relationship between changes in the fluorescence intensity (ΔF/F0) in response to 20 mm K+ (abscissa) and 2meSATP (ordinate). Three ovals in different colors indicate groups of neurons classified according to the responses to two solutions (see Results). B2, The relative location of cells analyzed. Abscissa indicates the distance of the cells from the borders of the pyramidal layers. The vertical dashed line in the left and right indicate the border between the pyramidal layer and the S.R. and S.O., respectively. C, The summary of changes in Fluo-4 fluorescence (ΔF/F0) of types 1-3 cells in response to 20 mm K+ and 2meSATP in the absence of extracellular Ca2+, in the presence of MRS2179 (30 μm), and its washout. Numbers in parentheses indicate the number of cells from six CA3 slices. Bars and vertical lines indicate mean and SE, respectively.
There were three distinct types of responses of Fluo-4 fluorescence: type 1 cells, responding to both 2meSATP (100 μm) and 20 mm K+; type 2 cells, responding only to 2mSATP; and type 3 cells, responding only to 20 mm K+ (Fig. 8A1, traces in yellow, red, and green, respectively). These responses occurred concurrently with the increase in PSC frequency simultaneously recorded from a pyramidal neuron (Fig. 8A1, top trace). When responses of 47 cells from six slices were pooled, these three types of responses were not overlapped and clearly separated (Fig. 8B1). Type 1 cells, responding to both 2meSATP and 20 mm K+, were located outside of the pyramidal layer both in S.R. and S.O. (Fig. 8A2, bottom, B1, cells in yellow with white arrowheads), suggesting that they are interneurons expressing P2Y1 receptors. In contrast, type 2 cells responding to 2meSATP but not to 20 mm K+ are likely to be astrocytes.
The [Ca2+]i increase in response to 2meSATP was completely abolished by extracellular Ca2+ deprivation in type 1 cells (Fig. 8A1, 0 mm Ca2+) but not in type 2 cells. This result strongly suggests that activation of P2Y1 receptors in interneurons elicits only depolarizing responses leading to Ca2+ entry, whereas that in astrocytes elicits [Ca2+]i increase essentially independent of Ca2+ entry. Effects of 2meSATP in both type 1 and type 2 cells were reversibly abolished by MRS2179 (30 μm), suggesting that both [Ca2+]i responses were mediated by P2Y1 receptors (Fig. 8C). Type 3 cells, responding only to 20 mm K+ (Fig. 8A2,B1,C) and located in the pyramidal layer (Fig. 8B2), did not show any detectable changes in [Ca2+]i in response to 2meSATP, suggesting again that pyramidal neurons do not express functional P2Y1 receptors. These results indicate that the mechanisms and targets of the responses of interneurons, widely distributed in S.R. and S.O., to P2Y1 receptor activation are distinct from those of astrocytes.
Discussion
We show here that, in the acute hippocampal slice, in addition to inhibiting excitatory transmission through activation of adenosine A1 receptors after extracellular conversion, ATP promotes inhibitory transmission by activating P2Y1 receptors directly coupled to depolarization in interneurons. These distinct effects of ATP on distinct types of neurons occurred simultaneously, indicating that extracellular ATP could play a dual role, one as a ligand for P2 receptors and another as a precursor of adenosine, in modulating neuronal excitability in the hippocampal network.
Activation of both P1 and P2 receptors expressed in distinct neurons in acute hippocampal slice
This study provides evidence that activation of neuronal P2 receptors by ATP, not through the intermediary of extracellular breakdown, could occur even in the acute slices in the absence of adenosine receptor blockers (Khakh et al., 2003) and inhibitors of ecto-nucleotidases (Zhang et al., 2003). This implies that the lack of P2 receptor-mediated ATP effects on synaptic transmission in many studies using the acute slice preparations (Dunwiddie et al., 1997; Cunha et al., 1998; Masino et al., 2002; Zhang et al., 2003) (but see Mendoza-Fernandez et al., 2000; Nikbakht and Stone, 2000) is not only a simple consequence of inherently high ecto-nucleotidase activity in these slices (Zhang et al., 2003, their Discussion) but rather also results from the cell type-specific expression of P2 receptors. It should be noted that most of these previous reports analyzed excitatory synaptic transmission. An effect of P2 receptor agonists on inhibitory interneurons in the hippocampal slice has been described by Khakh et al. (2003) in the CA1 region and suggested by Aihara et al. (2002) in the dentate gyrus. Khakh et al. (2003) demonstrated a facilitation of glutamate release through activation of presynaptic P2X2 receptor channels in the CA1 interneurons. In the present study, however, the PSC frequency recorded from CA3 interneurons showing 2meSATP-activated inward currents was not affected by 2meSATP, which is also a potent full agonist to recombinant P2X2 receptors (North and Surprenant, 2000). In addition, increases in IPSC frequency with 2meSATP were observed even in the presence of kynureic acid, indicating that increased glutamate release is not involved in this effect. These results suggest that the inward current evoked by P2Y1 receptor activation and facilitated glutamate release by presynaptic P2X2 receptor channel activation occur in distinct subsets of interneurons in the CA1 and CA3. Indeed, 2 of 29 CA3 S.O. interneurons not showing 2meSATP-activated inward current showed an increase in PSC frequency after 2meSATP application in this study (data not shown and not analyzed in detail). Likewise, Khakh et al. (2003) reported an ATP-activated inward current in a subset of CA1 S.O. neurons. More advanced understanding of the interneuron subclasses (McBain and Fisahn, 2001) and the difference in presynaptic properties between mossy fiber and Schaffer collateral inputs to interneurons (Khakh et al., 2003) will help to understand the significance of these different mechanisms of interneuron excitation.
Cell type-dependent P2Y receptor signal transduction
This study demonstrates that metabotropic P2Y receptors, which are widely expressed in pyramidal neurons, interneurons, and astroglial cells in the hippocampus (Moore et al., 2000; Morán-Jiménez and Matute, 2000), are coupled to different signaling pathways depending on the cell type. Accumulated evidence indicates that cultured hippocampal astrocytes express functional P2Y receptors, the activation of which by endogenous and exogenous ATP triggers intracellular Ca2+ mobilization (Zhu and Kimelberg, 2001; Koizumi et al., 2003). In contrast, there has been no report directly demonstrating the effect of P2Y receptor activation of identified pyramidal neurons in slices (but see Mendoza-Fernandez et al., 2000) and, until today, of interneurons. This is the first study demonstrating a direct modulation of hippocampal neuron excitability in the slice, which is distinct from that of astrocytes that involves phospholipase C activation and Ca2+ mobilization. The molecular mechanisms downstream to interneuronal P2Y1 receptor activation (e.g., the ionic conductance activation and neuronal excitation) are of particular interest and discussed in the following.
Inward current coupled to P2Y1 receptors
We demonstrate for the first time that activation of P2Y1 receptors in the CA3 interneurons is coupled to an inward current, which depolarizes the cell to action potential threshold, resulting in IPSC frequency increase in pyramidal neurons. The agonist and antagonist pharmacology and the absence of the 2meSATP effects in mice lacking P2Y1 receptors strongly argues for the P2Y1 receptor involvement.
This P2Y1 receptor signaling pathway is novel for the hippocampus but has already been described in other systems. For example, O'Grady et al. (1996) reported an inwardly rectifying cation conductance in Xenopus oocytes expressing human and turkey recombinant P2Y1 receptors, the activation of which does not involve G-proteins (Lee et al., 2003). In the guinea pig enteric nervous system, P2Y1 receptors mediate a component of the evoked slow EPSCs (Hu et al., 2003). In cultured dorsal root ganglion neurons and basket cells in the cerebellum slice, ATP elicits a slow depolarization, which leads to action potential generation (Molliver et al., 2002; Brockhaus et al., 2004). This is however, likely to involve P2Y2 receptors, not P2Y1 receptors, because UTP, a very weak agonist to P2Y1 receptors, is a potent agonist and ADP, a potent agonist to P2Y1 receptors, is ineffective. Therefore, the inward current described in this study is the only excitatory conductance directly activated by P2Y1 receptors in the CNS known to date. The mechanism linking P2Y1 receptors and this conductance, its molecular identity, and the signaling pathway of this conductance such as cAMP response element-binding protein phosphorylation (Molliver et al., 2002) and nitric oxide synthase activation (Kittner et al., 2003) after P2Y receptor activation are important subjects to be studied in the future.
How are interneuronal P2Y1 receptors activated physiologically?
To understand the physiological role of P2Y1 receptor-mediated signaling in the hippocampus, an important but yet not fully answered issue is how and when these receptors are activated.
In this study, application of MRS2179 alone significantly decreased the IPSC frequency of the pyramidal neurons (Figs. 3A2, 4C). Because MRS2179 is a selective antagonist to P2Y1 receptors, this result suggest that interneuronal P2Y1 receptors might have been activated by the ATP spontaneously released from neurons or astrocytes during their Ca2+ waves, as described in neuron-astrocyte coculture studies (Koizumi et al., 2003). In the developing hippocampus, it has been shown that the interneurons show spontaneous and synchronized rhythmic network activity (Khazipov et al., 1997). We found recently that this spontaneous interneuronal activity and related bursting activity are inhibited by MRS2179 at the same concentration as used to block 2meSATP effect in this study (Yamaoka, Bono, Kawamura and Kato, unpublished observations), suggesting that the release of ATP and subsequent activation of interneuronal P2Y1 receptors might play a role in generation and propagation of the intrinsic rhythmic activity of the hippocampal network.
The source of ATP in the CNS is not yet fully determined. It is known that ATP is released in the hippocampus as a consequence of neuronal activity (Pankratov et al., 1998; Mori et al., 2001; Khakh et al., 2003), suggesting that, under excessive excitation of the hippocampus, such as those occurring in the temporal epilepsies, or under specific physiological states, such as those with spontaneous hippocampal oscillations (Khakh et al., 2003), extracellular concentration of ATP should increase. In addition, a global and synchronized cell death in the hippocampus after brain ischemia or stroke might result in an aberrant rise in the extracellular ATP concentration (Inoue, 1998). Astrocytes also release ATP in response to ATP through various mechanisms (Koizumi et al., 2003). Increased ATP concentration in the extracellular milieu in the hippocampus under these physiological and pathophysiological situations might simultaneously trigger Ca2+ waves in astrocytes and induce membrane depolarization in interneurons. Considering the high ecto-nucleotidase activity in the vicinity of the excitatory synapses on pyramidal neurons (Dunwiddie et al., 1997; Cunha et al., 1998; Masino et al., 2002), it is more likely that interneuron P2Y1 receptors are the primary direct neuronal targets of the ATP that is released from the surrounding astrocytes.
Functional implications
The present demonstration is the second example showing ATP and its metabolite adenosine cooperating to regulate synaptic transmission in a distinct manner at distinct synapses on single neurons. The first example of this phenomenon is in the nucleus of the solitary tract (Kato and Shigetomi, 2001; Shigetomi and Kato, 2004). The increase in GABAergic inputs from interneurons to pyramidal cells in response to increased [ATP]o might decrease EPSP amplitude through postsynaptic shunting, the frequency of which is also attenuated by adenosine, resulting in synergistic reduction of the excitability of CA3 pyramidal neurons. Also, the present results predict a novel form of glioneuronal interaction in the brain network, in which ATP released from astrocytes not only affects the pyramidal neuron excitability but also triggers various intracellular responses by increasing [Ca2+]i in interneurons in a manner dependent on their activities (Molliver et al., 2002; Kittner et al., 2003).
Footnotes
This work was supported by Ministry of Education, Culture, Sports, Science and Technology, Japan Grants-in-Aid 13680902 and 15650071 (F.K.) and Research on Health Sciences focusing on Drug Innovation from The Japan Health Sciences Foundation Grants KH21014 and KH21006 (F.K.). Scientific and linguistic comments on this manuscript by H. A. McLean (Centre National de la Recherche Scientifique, Gif-sur-Yvette, France) are acknowledged. We thank Dr. J. Tanaka and M. Yamaoka for their participation and invaluable help during these experiments and Dr. M. Tominaga (National Institute of Physiological Sciences, Okazaki, Japan) for his scientific advice on the transgenic mice. The expert assistance of T. Matsuo in these experiments and during preparation of this manuscript is acknowledged.
Correspondence should be addressed to Fusao Kato, Laboratory of Neurophysiology, Department of Neuroscience, Jikei University School of Medicine, 3-24-8 Nishi-shimbashi, Minato, Tokyo 105-8461, Japan. E-mail: fusao@jikei.ac.jp.
Copyright © 2004 Society for Neuroscience 0270-6474/04/2410835-11$15.00/0
References
- Aihara H, Fujiwara S, Mizuta I, Tada H, Kanno T, Tozaki H, Nagai K, Yajima Y, Inoue K, Kondoh T, Motooka Y, Nishizaki T (2002) Adenosine triphosphate accelerates recovery from hypoxic/hypoglycemic perturbation of guinea pig hippocampal neurotransmission via a P2 receptor. Brain Res 952: 31-37. [DOI] [PubMed] [Google Scholar]
- Armstrong JN, Brust TB, Lewis RG, MacVicar BA (2002) Activation of presynaptic P2X7-like receptors depresses mossy fiber-CA3 synaptic transmission through p38 mitogen-activated protein kinase. J Neurosci 22: 5938-5945. [DOI] [PMC free article] [PubMed] [Google Scholar]
- Braun N, Zhu Y, Krieglstein J, Culmsee C, Zimmermann H (1998) Upregulation of the enzyme chain hydrolyzing extracellular ATP after transient forebrain ischemia in the rat. J Neurosci 18: 4891-4900. [DOI] [PMC free article] [PubMed] [Google Scholar]
- Brockhaus J, Dressel D, Herold S, Deitmer JW (2004) Purinergic modulation of synaptic input to Purkinje neurons in rat cerebellar brain slices. Eur J Neurosci 19: 2221-2230. [DOI] [PubMed] [Google Scholar]
- Cunha RA, Sebastião AM, Ribeiro JA (1998) Inhibition by ATP of hippocampal synaptic transmission requires localized extracellular catabolism by ecto-nucleotidases into adenosine and channeling to adenosine A1 receptors. J Neurosci 18: 1987-1995. [DOI] [PMC free article] [PubMed] [Google Scholar]
- D'Ascenzo M, Vairano M, Andreassi C, Navarra P, Azzena GB, Grassi C (2004) Electrophysiological and molecular evidence of L-(Cav1), N-(Cav2.2), and R-(Cav2.3) type Ca2+ channels in rat cortical astrocytes. Glia 45: 354-363. [DOI] [PubMed] [Google Scholar]
- Duffy S, MacVicar BA (1994) Potassium-dependent calcium influx in acutely isolated hippocampal astrocytes. Neuroscience 61: 51-61. [DOI] [PubMed] [Google Scholar]
- Dunwiddie TV, Masino SA (2001) The role and regulation of adenosine in the central nervous system. Annu Rev Neurosci 24: 31-55. [DOI] [PubMed] [Google Scholar]
- Dunwiddie TV, Diao L, Proctor WR (1997) Adenine nucleotides undergo rapid, quantitative conversion to adenosine in the extracellular space in rat hippocampus. J Neurosci 17: 7673-7682. [DOI] [PMC free article] [PubMed] [Google Scholar]
- Hu HZ, Gao N, Zhu MX, Liu S, Ren J, Gao C, Xia Y, Wood JD (2003) Slow excitatory synaptic transmission mediated by P2Y1 receptors in the guinea-pig enteric nervous system. J Physiol (Lond) 550: 493-504. [DOI] [PMC free article] [PubMed] [Google Scholar]
- Idestrup CP, Salter MW (1998) P2Y and P2U receptors differentially release intracellular Ca2+ via the phospholipase c/inositol 1,4,5-triphosphate pathway in astrocytes from the dorsal spinal cord. Neuroscience 86: 913-923. [DOI] [PubMed] [Google Scholar]
- Inoue K (1998) ATP receptors for the protection of hippocampal functions. Jpn J Pharmacol 78: 405-410. [DOI] [PubMed] [Google Scholar]
- Kang J, Jiang L, Goldman SA, Nedergaard M (1998) Astrocyte-mediated potentiation of inhibitory synaptic transmission. Nat Neurosci 1: 683-692. [DOI] [PubMed] [Google Scholar]
- Kato F, Shigetomi E (2001) Distinct modulation of evoked and spontaneous EPSCs by purinoceptors in the nucleus tractus solitarii of the rat. J Physiol (Lond) 530: 469-486. [DOI] [PMC free article] [PubMed] [Google Scholar]
- Khakh BS (2001) Molecular physiology of P2X receptors and ATP signalling at synapses. Nat Rev Neurosci 2: 165-174. [DOI] [PubMed] [Google Scholar]
- Khakh BS, Gittermann D, Cockayne DA, Jones A (2003) ATP modulation of excitatory synapses onto interneurons. J Neurosci 23: 7426-7437. [DOI] [PMC free article] [PubMed] [Google Scholar]
- Khazipov R, Leinekugel X, Khalilov I, Gaiarsa JL, Ben-Ari Y (1997) Synchronization of GABAergic interneuronal network in CA3 subfield of neonatal rat hippocampal slices. J Physiol (Lond) 498: 763-772. [DOI] [PMC free article] [PubMed] [Google Scholar]
- Kittner H, Franke H, Fischer W, Schultheis N, Krügel U, Illes P (2003) Stimulation of P2Y1 receptors causes anxiolytic-like effects in the rat elevated plus-maze: implications for the involvement of P2Y1 receptor-mediated nitric oxide production. Neuropsychopharmacology 28: 435-444. [DOI] [PubMed] [Google Scholar]
- Koizumi S, Saito Y, Nakazawa K, Nakajima K, Sawada JI, Kohsaka S, Illes P, Inoue K (2002) Spatial and temporal aspects of Ca2+ signaling mediated by P2Y receptors in cultured rat hippocampal astrocytes. Life Sci 72: 431-442. [DOI] [PubMed] [Google Scholar]
- Koizumi S, Fujishita K, Tsuda M, Shigemoto-Mogami Y, Inoue K (2003) Dynamic inhibition of excitatory synaptic transmission by astrocyte-derived ATP in hippocampal cultures. Proc Natl Acad Sci USA 100: 11023-11028. [DOI] [PMC free article] [PubMed] [Google Scholar]
- Lee SY, Wolff SC, Nicholas RA, O'Grady SM (2003) P2Y receptors modulate ion channel function through interactions involving the C-terminal domain. Mol Pharmacol 63: 878-885. [DOI] [PubMed] [Google Scholar]
- Léon C, Hechler B, Freund M, Eckly A, Vial C, Ohlmann P, Dierich A, LeMeur M, Cazenave JP, Gachet C (1999) Defective platelet aggregation and increased resistance to thrombosis in purinergic P2Y1 receptor-null mice. J Clin Invest 104: 1731-1737. [DOI] [PMC free article] [PubMed] [Google Scholar]
- Lüscher C, Malenka RC, Nicoll RA (1998) Monitoring glutamate release during LTP with glial transporter currents. Neuron 21: 435-441. [DOI] [PubMed] [Google Scholar]
- Masino SA, Diao L, Illes P, Zahniser NR, Larson GA, Johansson B, Fredholm BB, Dunwiddie TV (2002) Modulation of hippocampal glutamatergic transmission by ATP is dependent on adenosine A1 receptors. J Pharmacol Exp Ther 303: 356-363. [DOI] [PubMed] [Google Scholar]
- McBain CJ, Fisahn A (2001) Interneurons unbound. Nat Rev Neurosci 2: 11-23. [DOI] [PubMed] [Google Scholar]
- Mendoza-Fernandez V, Andrew RD, Barajas-López C (2000) ATP inhibits glutamate synaptic release by acting at P2Y receptors in pyramidal neurons of hippocampal slices. J Pharmacol Exp Ther 293: 172-179. [PubMed] [Google Scholar]
- Molliver DC, Cook SP, Carlsten JA, Wright DE, McCleskey EW (2002) ATP and UTP excite sensory neurons and induce CREB phosphorylation through the metabotropic receptor, P2Y2. Eur J Neurosci 16: 1850-1860. [DOI] [PubMed] [Google Scholar]
- Moore D, Chambers J, Waldvogel H, Faull R, Emson P (2000) Regional and cellular distribution of the P2Y1 purinergic receptor in the human brain: striking neuronal localisation. J Comp Neurol 421: 374-384. [DOI] [PubMed] [Google Scholar]
- Morán-Jiménez MJ, Matute C (2000) Immunohistochemical localization of the P2Y1 purinergic receptor in neurons and glial cells of the central nervous system. Mol Brain Res 78: 50-58. [DOI] [PubMed] [Google Scholar]
- Mori M, Gerber U (2002) Slow feedback inhibition in the CA3 area of the rat hippocampus by synergistic synaptic activation of mGluR1 and mGluR5. J Physiol (Lond) 544: 793-799. [DOI] [PMC free article] [PubMed] [Google Scholar]
- Mori M, Heuss C, Gähwiler BH, Gerber U (2001) Fast synaptic transmission mediated by P2X receptors in CA3 pyramidal cells of rat hippocampal slice cultures. J Physiol (Lond) 535: 115-123. [DOI] [PMC free article] [PubMed] [Google Scholar]
- Nikbakht MR, Stone TW (2000) Complex hippocampal responses to ATP: fade due to nucleotidase inhibition and P2-receptor-mediated adenosine release. Brain Res 860: 161-165. [DOI] [PubMed] [Google Scholar]
- North RA (2002) Molecular physiology of P2X receptors. Physiol Rev 82: 1013-1067. [DOI] [PubMed] [Google Scholar]
- North RA, Surprenant A-M (2000) Pharmacology of cloned P2X receptors. Annu Rev Pharmacol Toxicol 40: 563-580. [DOI] [PubMed] [Google Scholar]
- O'Grady SM, Elmquist E, Filtz TM, Nicholas RA, Harden TK (1996) A guanine nucleotide-independent inwardly rectifying cation permeability is associated with P2Y1 receptor expression in Xenopus oocytes. J Biol Chem 271: 29080-29087. [DOI] [PubMed] [Google Scholar]
- Pankratov Y, Castro E, Miras-Portugal MT, Krishtal O (1998) A purinergic component of the excitatory postsynaptic current mediated by P2X receptors in the CA1 neurons of the rat hippocampus. Eur J Neurosci 10: 3898-3902. [DOI] [PubMed] [Google Scholar]
- Shigetomi E, Kato F (2004) Action potential-independent release of glutamate by Ca2+ entry through presynaptic P2X receptors elicits postsynaptic firing in the brainstem autonomic network. J Neurosci 24: 3125-3135. [DOI] [PMC free article] [PubMed] [Google Scholar]
- Sim JA, Young MT, Sung HY, North RA, Surprenant A (2004) Reanalysis of P2X7 receptor expression in rodent brain. J Neurosci 24: 6307-6314. [DOI] [PMC free article] [PubMed] [Google Scholar]
- Troadec JD, Thirion S, Petturiti D, Bohn MT, Poujeol P (1999) ATP acting on P2Y receptors triggers calcium mobilization in primary cultures of rat neurohypophysial astrocytes (pituicytes). Pflügers Arch 437: 745-753. [DOI] [PubMed] [Google Scholar]
- von Kügelgen I, Wetter A (2000) Molecular pharmacology of P2Y-receptors. Naunyn Schmiedebergs Arch Pharmacol 362: 310-323. [DOI] [PubMed] [Google Scholar]
- Woodhall G, Gee CE, Robitaille R, Lacaille JC (1999) Membrane potential and intracellular Ca2+ oscillations activated by mGluRs in hippocampal stratum oriens/alveus interneurons. J Neurophysiol 81: 371-382. [DOI] [PubMed] [Google Scholar]
- Zhang JM, Wang HK, Ye CQ, Ge W, Chen Y, Jiang ZL, Wu CP, Poo MM, Duan S (2003) ATP released by astrocytes mediates glutamatergic activity-dependent heterosynaptic suppression. Neuron 40: 971-982. [DOI] [PubMed] [Google Scholar]
- Zhang Q, Fukuda M, Van Bockstaele E, Pascual O, Haydon PG (2004) Synaptotagmin IV regulates glial glutamate release. Proc Natl Acad Sci USA 101: 9441-9446. [DOI] [PMC free article] [PubMed] [Google Scholar]
- Zhu Y, Kimelberg HK (2001) Developmental expression of metabotropic P2Y1 and P2Y2 receptors in freshly isolated astrocytes from rat hippocampus. J Neurochem 77: 530-541. [DOI] [PubMed] [Google Scholar]