

Abstract
Hippocampal specimens resected to cure medically intractable temporal lobe epilepsy (TLE) provide a unique possibility to study functional consequences of morphological alterations. One intriguing alteration predominantly observed in cases of hippocampal sclerosis is an uncommon network of granule cells monosynaptically interconnected via aberrant supragranular mossy fibers. We investigated whether granule cell populations in slices from sclerotic and nonsclerotic hippocampi would develop ictaform activity when challenged by low-frequency hilar stimulation in the presence of elevated extracellular potassium concentration (10 and 12 mm) and whether the experimental activity differs according to the presence of aberrant mossy fibers.
We found that ictaform activity could be evoked in slices from sclerotic and nonsclerotic hippocampi (27 of 40 slices, 14 of 20 patients; and 11 of 22 slices, 6 of 12 patients, respectively). However, the two patient groups differed with respect to the pattern of ictaform discharges and the potassium concentration mandatory for its induction. Seizure-like events were already induced with 10 mm K+. They exclusively occurred in slices from sclerotic hippocampi, of which 80% displayed stimulus-induced oscillatory population responses (250-300 Hz). In slices from nonsclerotic hippocampi, atypical negative field potential shifts were predominantly evoked with 12 mm K+. In both groups, the ictaform activity was sensitive to ionotropic glutamate receptor antagonists and lowering of [Ca2+]o.
Our results show that, in granule cell populations of hippocampal slices from TLE patients, high K+-induced seizure-like activity and ictal spiking coincide with basic electrophysiological abnormalities, hippocampal sclerosis, and mossy fiber sprouting, suggesting that network reorganization could play a crucial role in determining type and threshold of such activity.
Keywords: hippocampus, Ammon's horn sclerosis, mesial temporal lobe epilepsy, mossy fiber sprouting, high potassium, bicuculline, ictaform events
Introduction
Temporal lobe epilepsies (TLEs) are frequently drug resistant but can be remedied by partial resection of mesial temporal structures. Morphological investigation of the resected tissue revealed that one group of TLEs is associated with hippocampal sclerosis (HS) characterized by segmental or total cell loss, whereas another group shows less segmental cell loss (non-HS) (Babb et al., 1984; Kim et al., 1990; Mathern et al., 1997a). In specimens with HS, the axons of granule cells [mossy fibers (MF)] send collaterals into the dentate inner molecular layer (IML) (Scheibel et al., 1974; Sutula et al., 1989; Houser et al., 1990; Masukawa et al., 1992; Isokawa et al., 1993) and form multiple asymmetric synapses with dendritic structures of granule cells (Babb et al., 1991; Franck et al., 1995; Zhang and Houser, 1999). This rearrangement is associated with increased immunoreactivity for glutamate receptors in the IML (Babb et al., 1996; Ying et al., 1998), suggesting that a recurrent excitatory network of granule cells might be present in sclerotic tissue.
It is not yet clear whether such reorganization increases seizure susceptibility. In the intact brain of animals, the dentate gyrus (DG) is thought to be relatively resistant to seizures and to control the spread of seizures from entorhinal cortex to the hippocampus proper (Jones and Lambert, 1990; Dreier and Heinemann, 1991; Lothman et al., 1992; Pan and Stringer, 1997). Physiological studies in slices from resected human tissue revealed multiple, prolonged antidromic and orthodromic population responses of dentate granule cells, indicating hyperexcitability (Masukawa et al., 1989, 1992, 1996, 1997, 1999; Uruno et al., 1994; Isokawa and Fried, 1996), but only the degree of antidromic response abnormality was highly correlated with the degree of aberrant MF sprouting. However, in none of the electrophysiological in vitro investigations, spontaneous or evoked ictaform activities could be recorded. Therefore, it remains unknown whether or to what extent dentate reorganization contributes to seizure-like activity.
Studies on the rat kainate or pilocarpine model of HS confirmed the existence of synaptic contacts between granule cells in chronic epileptic animals (Wenzel et al., 2000; Buckmaster et al., 2002; Cavazos et al., 2003) and added evidence for monosynaptic excitatory connectivity between distant granule cells (Molnar and Nadler, 1999; Lynch and Sutula, 2000; Wuarin and Dudek, 2001; Scharfman et al., 2003). However, abnormal population responses have been observed in the presence of bicuculline and/or modestly elevated [K+]o (Cronin et al., 1992; Patrylo et al., 1999a; Hardison et al., 2000; Lynch and Sutula, 2000) rather than in normal perfusion media (Tauck and Nadler, 1985). As in human epileptic tissue, there were no spontaneous seizure-like events unless the slice had been exposed to a procedure that reduced inhibition and raised neuronal excitability, such as elevation of [K+]o (Wuarin and Dudek, 1996; Patrylo and Dudek, 1998).
Here, we have examined slices from human epileptic hippocampus for the incidence of ictaform activity in the DG. We now report that hilar stimulation in the presence of high K+ does induce self-sustained ictaform activity, including events that can last as long as 1 min or more. It is also demonstrated that some characteristics of this pathological activity are statistically coincident with hippocampal cell loss and mossy fiber sprouting.
Materials and Methods
Tissue preparation and maintenance. This study was performed on hippocampal tissue of 62 patients suffering from pharmacoresistant temporal lobe epilepsy as determined by the Epilepsy Center of Berlin-Brandenburg according to the German and European Guidelines for presurgical evaluation (Baumgartner et al., 2000; European Federation of Neurological Societies Task Force, 2000). This study was approved by the ethics committee of the University Hospital Charité (Humboldt, University of Berlin, Berlin, Germany), and a written informed consent for the study was obtained from each patient. All operations were done by one of the authors (T.-N.L.), guaranteeing the same dissection technique of the hippocampus. For the present study, the tissue was taken from the anterior half of the hippocampal body ∼20 mm posterior from the tip of the inferior horn of the lateral ventricle.
HS was assessed in 36 patients (36.6 ± 1.86 years of age); non-HS was assessed in 26 patients (29.5 ± 2.09 years of age). The mean duration of epilepsy was 20.97 ± 1.77 years in HS and 12.02 ± 2.0 years in non-HS. The duration of epilepsy was longer, and age at operation was older in HS patients than in non-HS patients (p < 0.05). There was no difference between HS and non-HS with regard to the right or left side of the resected hippocampus or the gender of the patients.
As described previously (Gabriel et al., 1998; Kivi et al., 2000; Lehmann et al., 2000), a part of the coronally sectioned hippocampal specimens (usually 5-8 mm of the hippocampal body), often dissected into two parts, was obtained in the operation theater and immediately immersed in cold (4°C) carbogenated transport solution containing the following (in mm): 3 KCl, 1.25 NaH2PO4, 10 glucose, 2 MgSO4, 2 MgCl2, 1.6 CaCl2, 21 NaHCO3, 200 sucrose, and 0.1 α-tocopherol, pH 7.4 (osmolality of 300-305 mOsm/kg). Na+ was reduced to prevent hypoxia-induced Na+ influx into neurons, and α-tocopherol was added as a scavenger of free radicals. The tissue was transported in an airtight cooling receiver filled with 1 l chilled carbogenated transport solution, guaranteeing a remaining oxygen tension of at least 580 torr (repeatedly measured with the ISO2 oxygen meter; World Precision Instruments, Sarasota, FL) and a temperature of 3.5-4.5°C at arrival in the laboratory 30 min later. All specimens could be electrophysiologically investigated.
The tissue was coronally dissected into slices of 500 μm thickness using a vibratome (Campden Instruments, Leicester, UK). Six to 10 slices could be obtained per specimen, of which one to two slices were subjected to Timm staining. The remaining slices were immediately transferred into interface chambers and perfused at a rate of 1.7 ml/min with prewarmed (34.5 ± 0.5°C) carbogenated artificial CSF (ACSF) containing the following (in mm): 129 NaCl, 3 KCl, 1.25 NaH2PO4, 10 glucose, 2 MgSO4, 1.6 CaCl2, and 21 NaHCO3, adjusted to pH 7.4 (osmolality of 302 mOsm/kg). Recordings commenced 4-5 hr after preparation of slices to permit for maximal recovery after surgery and transport in Na+-free solution. At onset of the experiments, the baseline of extracellular potassium concentration ([K+]o) was 3 mm.
Dextran-amine-coupled fluorescence and cresyl violet. To visualize dendritic and axonal processes of granule cells by anterograde and retrograde transport of dye, slices (two to four per specimen) were labeled with fluorescein or tetramethylrhodamine conjugated with dextran-amines (fluoro-emerald and fluoro-ruby; Molecular Probes, Leyden, The Netherlands), as described previously (Lehmann et al., 2001). In brief, small crystals of dye were inserted into a hilar lesion obtained after perpendicular penetration of the slice with a 27 gauge injection needle. The slices were kept in the interface chamber for up to 12 hr and finally transferred into 4% paraformaldehyde in 0.1 m phosphate buffer, pH 7.4, for fixation. After impregnation with 30% sucrose, serial sections of 50 and 30 μm thickness were made using a freezing microtome (Leitz; Leica, Wetzlar, Germany). The 50-μm-thick sections were then mounted on gelatin-coated slides, air dried, and coverslipped with a nonfluorescent mounting media (Citifluor AF-1; W. Planet, Hamburg, Germany) for subsequent analysis of dextran-amine fluorescence by epifluorescent microscopy (excitation wavelength, 495 nm, with filter set 09 for fluorescein; excitation wavelength, 550 nm, with filter set 15 for rhodamine) (Axioscope; Zeiss, Oberkochen, Germany). After digital imaging with a microscope-mounted camera (DX30; Kappa Optoelectronics, Gleichen, Germany), the images were processed with the software Kappa Image-Base Control (Kappa Optoelectronics). The remaining 30-μm-thick sections were stained with cresyl violet and used for Wyler grading.
Neo-Timm staining. One to two slices per specimen were used for neo-Timm staining with a reduced concentration of silver nitrate (Babb et al., 1991; Mello et al., 1993). The slices were transferred into the reactive solution (0.238 gm of NaH2PO4 and 0.234 gm of Na2S in 20 ml of distilled water) for 10 min, irrigated with phosphate buffer for another 10 min, and fixed overnight with alcohol (70%). After immersion with 30% sucrose, cryostat frozen sections were mounted on slides purified with chrome sulfur acid and coated with gelatin. The sections were then immersed in the developing solution in darkness without using any metal equipment (5.1 gm of citric acid, 4.7 gm of sodium citrate, and 3.4 gm of hydroquinone were dissolved in 80 ml of water and added to 180 ml of gum arabic, supplemented by 0.19 gm of silver nitrate in 1 ml of distilled water, just before the developing process should start). The drop of silver was estimated by visual control, and the development was stopped in sodium thiosulfate (1 gm of Na2S2O3 in 100 ml of water). All sections were counterstained with toluidin blue. After washing in distilled water, the sections were dehydrated and coverslipped.
Assessment of degree of HS, granule cell dispersion, and aberrant sprouting. Adjacent parts of the hippocampal body were analyzed by the Department of Neuropathology at the Charité-University Medicine Berlin for diagnostic purposes. Removed hippocampi were divided into different groups according to the degree of nerve cell loss, using the Wyler classification (Wyler et al., 1992). In this grading system, grade 0 corresponds to normal hippocampus; grade 1 corresponds to mild mesial temporal damage (MTD) with hippocampal neuronal loss of <10% in areas CA1, CA3, and CA4; grade 2 corresponds to moderate MTD with neuronal loss between 10 and 50%; grade 3 corresponds to marked MTD or classical HS with neuronal loss of >50%; and grade 4 corresponds to total MTD or HS with neuronal loss of >50% involving all sectors of the hippocampal pyramidal cell layer, dentate gyrus, subiculum, and parahippocampal gyrus. For additional analysis, grades 0-2 were considered to be non-HS, and grades 3 and 4 were considered to be HS.
Although adjacent parts of the hippocampal body were used for neuropathological analysis and for studying aberrant sprouting, a difference in sclerosis between the two parts had to be ruled out. For this reason, representative sections from slices used for electrophysiology were stained with cresyl violet. Together with the sections stained following the Timm staining protocol and counterstained by toluidin blue, the tissue was again checked for the Wyler score. In cases that were graded differently, we used the Wyler score determined from the slices studied in our laboratory. This discrepancy might account to variation of the degree of sclerosis along the longitudinal axis of the hippocampus, as shown previously for the dentate gyrus (Masukawa et al., 1995). In addition to the HS score, the presence of granule cell dispersion was determined. Cases of closely approximated granule cell somata forming a narrow lamina with a distinct, regular border toward the IML were not considered to have granule cell dispersion. Cases showing widening of the granule cell layer with an irregular border to the IML and a less compact granule cell packing were appraised to have granule cell dispersion.
All slices were studied for the appearance of an uncommon fiber network in the IML of the dentate gyrus. Dextran-amine tracing technique and Timm staining, two independent methods, were used to reveal network rearrangement. Disclosing retrograde labeling of fibers presenting with typical MF boutons and spreading horizontally and vertically in the dentate molecular layer (ML) suggested mossy fiber sprouting. Only slices with mossy fibers within the IML were assessed to have “aberrant fibers.” Slices without any spread of recurrent mossy fibers into the IML were classified to have “no aberrant fibers.”
The overall intensity of the Timm silver sulfide precipitation differed from specimen to specimen. The relationship of silver precipitation in the hilar and CA3 MF system as well as in the IML was the measure to determine aberrant mossy fiber sprouting. The sections were assigned to a subjective scale rating of 0-3 (Tauck and Nadler, 1985). Grade 0 corresponds to no Timm staining, grade 1 to only spots, grade 2 to broad but discontinuous staining, and grade 3 to strong continuous staining in the IML of the DG. Only grades 2 and 3 were considered to represent aberrant sprouting into the IML. Two observers not aware of the electrophysiological results performed all morphological studies.
Recordings and stimulation. Extracellular recordings as well as hilar (MF) and ML stimulation were performed in parallel in two or three different setups. The recording electrodes were positioned 120-150 μm deep into the granule cell layer opposite to CA1 or the border between CA1 and subiculum. We used double-barreled K+-selective-reference microelectrodes filled with Fluka 60031 ionophore (Fluka Chemie, Buchs, Switzerland) in the K+-selective barrel and 150 mm NaCl in the reference barrel. They were prepared and tested as described previously (Lux and Neher, 1973). Electrodes were accepted if they responded to a 10-fold increase in K+ concentration with a potential shift of 59 ± 1 mV. Responses to single or paired stimuli as well as spontaneous field potentials (FPs) and associated changes of the [K+]o were recorded using interfaces and software from Axon Instruments (pClamp6; Axon Instruments, Foster City, CA), Cambridge Electronics Design (SPIKE 2, SIGNAL; Cambridge Electronics Design, Cambridge, UK), and HEKA (Tida; HEKA, Lamprecht, Germany), with sample rates of 8-10 kHz (filter cutoff, 3 kHz), 4 kHz (filter cutoff, 1 kHz), and 100 Hz (filter cutoff, 1.6 Hz), respectively. All data were stored on a chart recorder and on computer disk.
Bipolar stimulation electrodes (platinum wires of 20 μm diameter; tip separation, 80-120 μm) were positioned into the MF tract (hilus/CA3) and into the ML (outer and middle third, at least 300 μm apart from the recording electrode). Paired stimuli (0.1 msec, 1-30 V, 50 msec interval) were applied every 20-40 sec with intensities evoking population spike (PS) amplitudes at threshold, 30, 60, 80, and 100% of the maximal response, and with 125% of the maximal intensity for supramaximal stimulation. To facilitate development of epileptiform events, paired hilar stimulation was repeated every 15 sec at least up to occurrence of spontaneous epileptiform activity.
Experimental protocol and drug application. Each experiment was started with determination of the input-output relationship for population spike amplitudes in response to paired-pulse stimulation of the MF (MF, full range) and perforant path fibers (ML, mainly 80-125%) for the following reasons: (1) to confirm that the slice was viable and synaptic transmission intact, and (2) to use stimulation of similar efficacy with respect to the level of neuronal activation throughout the experiments on different slices. Subsequently, continuous paired stimulation of MF at 0.067 Hz was maintained up to appearance of spontaneous events using stimulus intensities evoking population spike amplitudes of 80% of maximum response. If after 30-40 min of continuous MF stimulation no epileptiform activities had developed, slices were perfused with ACSF containing 10 mm K+, 10 mm K+ with 5-10 μm bicuculline added, or 12 mm K+. After recording epileptiform activities, the K+-containing solution was replaced by control ACSF to test for recovery. Alternatively, we tested for synaptic or nonsynaptic origin of the evoked activity by application of glutamate receptor antagonists or lowering of [Ca2+]o and subsequent washout of blocking agents or restitution of [Ca2+]o, respectively. We added dl-2-amino-5-phosphonopentanoic-acid (2-APV) (0.03-0.06 mm) and 6-cyano-7-nitroquinoxaline 2,3-(1H, 4H)-dione (CNQX) (0.03-0.06 mm) to the perfusion solution or lowered the Ca2+ concentration within the perfusion solution to 0.2 mm. All drugs were from Biotrend (Cologne, Germany). At the end of the experiment, the slices were fixed in 4% paraformaldehyde for subsequent histological analysis.
Data analysis. All data were analyzed using the SPIKE 2 software and two homemade analysis scripts (Dr. H. Siegmund, Johannes Mueller Institute of Physiology, Charité-University Medicine Berlin, Berlin, Germany). FPs (n = 5 stimuli) recorded in response to each of the different stimulus intensities were averaged and then analyzed for the following parameters: amplitude of the first PS in response to the first and second stimulus of the stimulus pair (PS1, PS2; in millivolts), number of additional recurrent population spikes (RPS1, RPS2), and duration of n recurrent population spikes as measured from the peak of PS1 up to the peak of the last recurrent population spike (in milliseconds). Additionally, the paired-pulse index (PS2/PS1) and the frequency of additional population spikes (number/duration; in Hertz) were determined. Stimulus intensities were given as percentage of the maximal response amplitude elicited, except for threshold stimulation (5%) and supramaximal stimulation (125%). To detect modulation by continuous MF stimulation in the absence and presence of high K+-ACSF, the 80% stimulus responses were analyzed: 20 min after onset of continuous stimulation, before onset of epileptiform activity or 30 min after start of perfusion with high K+-ACSF, and 60-90 min after changing the perfusion to control ACSF.
Spontaneous FP shifts were analyzed for frequency of recurrence (events per minute), amplitudes (the low-frequency component and peak amplitude), duration (two-thirds recovery), number of superimposed transients (amplitude, >0.3 mV), and event-related rises in [K+]o. Corresponding values were determined for at least six (maximal 20) events per slice and averaged. Afterward, the mean values of single slices were again averaged for slice groups showing similar types of events. These types were differentiated according to event frequency (events per minute), event duration, presence of superimposed FP transients, and size of event-associated rises in [K+]o.
Statistics. Patients' data were assigned to the histopathological diagnosis groups and then averaged and compared (Student's t test for independent samples). Histological findings were graded, and the proportion of different grades found in the diagnosis groups were compared using the χ2 homogeneity test. If this test revealed a significant difference of proportions between groups, the contingency coefficient (C) was determined to characterize the degree of coherence. The same type of statistical processing was applied to determine a coherence of graded morphological and graded or grouped electrophysiological findings. Metric electrophysiological data were given as mean ± SEM for different histopathological groups of slices or patients, except when indicated otherwise. Within-group and between-group comparisons of metric data were performed using the Wilcoxon matched-pair signed rank test and the Mann-Whitney U test, or the corresponding paired and independent sample t tests, respectively. To determine whether and which clinical parameters could discriminate electrophysiologically different groups of specimens, two discriminate analysis procedures (entering all variables together and stepwise selection of variables, respectively) were performed. Statistical analysis was performed using the SPSS software package (SPSS, Chicago, IL).
Results
Morphology
All 62 specimens used in the morphological studies were viable for at least 20 hr after arrival in the laboratory (constant maximal field potential amplitudes of ≥1 mV). They were collected from September 1999 to October 2002. To determine whether development of experimental epileptiform activity in the DG might be influenced by cell loss and mossy fiber reorganization, we subjected the removed tissue samples to an extended morphological characterization, including Wyler grading (cell loss), dextran-amine and neo-Timm staining (presence of aberrant MF terminals within the IML and Timm staining score), and presence of granule cell dispersion.
Wyler grading
Removed hippocampal tissue specimens from patients with TLE showed different degrees of mesiotemporal sclerosis (Fig. 1A,B). According to the Wyler classification, we found no sclerosis in 4 specimens, mild sclerosis in 14 specimens, moderate sclerosis in 8 specimens, classical sclerosis in 12 specimens, and total sclerosis in 24 specimens. Specimens with grades 3 (classical sclerosis) and 4 (total sclerosis) were considered to show HS, whereas grades 0-2 were classified as not having mesiotemporal sclerosis (non-HS). HS was accompanied by a lesion in 5 of 36 patients, whereas non-HS was associated with a lesion in the temporal lobe (tumor, cavernoma, dysplasia, and cyst) in 17 of 26 patients. In 5 of the 62 patients, we found a different Wyler grading between the tissue used in the Department of Neuropathology and the tissue used in our laboratory. The assignment to HS or non-HS changed with three upgrades and two downgrades.
Figure 1.
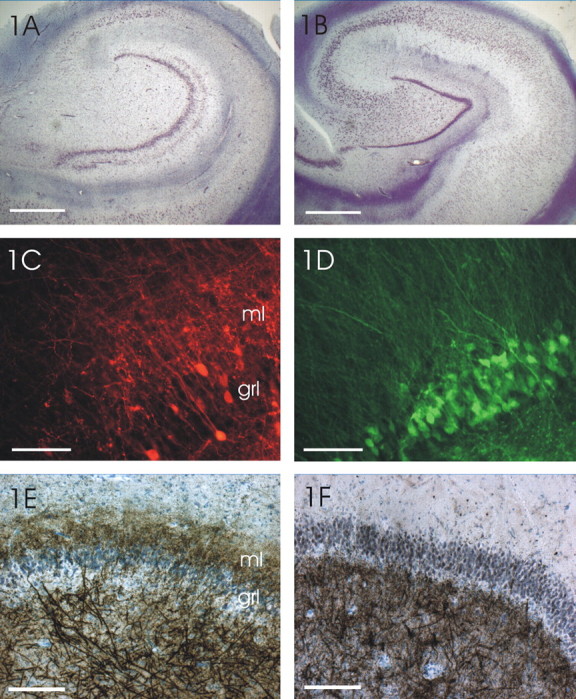
Coronal sections of a sclerotic (left) and a nonsclerotic hippocampus (right). A, A hippocampal formation with classical sclerosis (HS) is shown. Selective nerve cell loss in the hilus, CA3 and CA1 area, and granule cell dispersion are obvious. The granule cell dispersion led to a bilaminar pattern of granule cells (double layering). Most of the CA2 cells and few CA3 cells are still discernible. In contrast to the CA1 with a complete neuron loss, a cell band is still present in the subiculum. Scale bar, 5 mm. B, In the hippocampus of the non-HS case, all areas of the hippocampus can be recognized. The granule cell layer is compact without fringing of granule cells into the molecular layer of the dentate gyrus (cresyl violet staining). Scale bar, 5 mm. C, After injection of dextran-amine-coupled fluorescence (tetramethylrhodamine) into the hilus (bottom right corner; injection site not shown), mossy fibers can be recognized by labeled mossy fiber boutons in the hilus as well as in the molecular layer (ml) of the dentate gyrus. The labeled cells in the granule cell layer (grl) are dispersed and send their dendrites into the molecular layer (tetramethylrhodamine dextran-amine tracing). Scale bar, 50 μm. D, In a corresponding section of a non-HS case, the granule cells are densely packed and not dispersed. They are labeled with dextran-amine-coupled fluorescence (fluorescein), which was injected into the hilus. The granule cell dendrites form a regular dendritic field within the molecular layer. Mossy fiber boutons indicating mossy fibers are only seen in the hilus (bottom right corner) and not in the IML. Some hilar neurons send their processes through the granule cell layer into the molecular layer (fluorescein dextran-amine tracing). Scale bar, 50 μm. E, Timm stain indicates zinc in the mossy fibers by precipitated silver granules. By this way, zinc is visible in the hilus, stratum lucidum (data not shown), and in the IML of sclerotic hippocampi. A few Timm granules are also discernible in the granule cell layer, but most of the silver granules are found in the IML. This suggests that mossy fibers sprout back into the IML, which corresponds to the finding in C. Scale bar, 100 μm. F, In the nonsclerotic hippocampus, Timm granules are only seen in the hilus (and the mossy fiber tract) and never in the IML. As in the dentate gyrus of sclerotic hippocampi, some Timm granules can be seen within the granule cell layer (neo-Timm staining). Scale bar, 100 μm.
Dextran-amine and neo-Timm staining
In 50 specimens, we used fluorescent dextran-amine labeling to disclose aberrant mossy fiber sprouting into the IML of the DG. Retrograde staining with fluoro-emerald or fluoro-ruby within the hilus revealed an extensive network of fluorescent mossy fibers in the IML of HS specimens, whereas ordered apical dendrites of granular cells dominated in the non-HS specimens (Figs. 1, compare C, D; 2, compare A, B). We found aberrant sprouting in 96% (28 of 29) of HS specimens but only in 9.5% (2 of 21) of non-HS specimens (χ2 test; p < 0.001). By determining the proportion of dextran-amine labeling with respect to the different Wyler grades (Fig. 3A), a large increase in the number of aberrant fibers from grade 2 to grade 3 became obvious. This suggests a difference between grades 2 and 3 with respect to structural reorganization. There was a high coherence of Wyler grades 0-2 and negative dextran-amine labeling and Wyler grades 3 and 4 and positive dextran-amine labeling (χ2 test; p < 0.001; C = 0.661).
Figure 2.

Mossy fibers in the DG of HS and non-HS patients. (Both images are composed of two originals fused between the middle and right third of the figure. The color was converted into gray scale and inverted.) A, Labeling (bottom right corner) of anon-HS case with fluorescein dextran-amine in the dense mossy fiber network in the hilus. The mossy fibers are discernible by showing the fluorescein-filled boutons. They spread only in the hilus. No mossy fibers are visible in the IML. The granule cells are retrogradely stained and form a compact layer of cells. The dendrites of the granule cells form a dense and uniform pattern, which is only interrupted by fibers of hilar neurons. The latter cells are probable interneurons and send their dendrites (processes covered with spines; data not shown) through the granule cell layer and the whole molecular layer into its outer part, in which they end in meanders. Scale bar, 100 μm. B, An HS case with a corresponding labeling site as in A. The number of labeled granule cells and their dendrites is lower as a result of loss and dispersion of the cells. Nevertheless, the frequency of mossy fiber boutons in the hilus is higher. Furthermore, aberrant longitudinal and transverse mossy fibers are seen in the IML. Both findings point to a sprouting of mossy fibers within the hilus and into the IML (fluorescein dextran-amine tracing). Scale bar, 100 μm.
Figure 3.
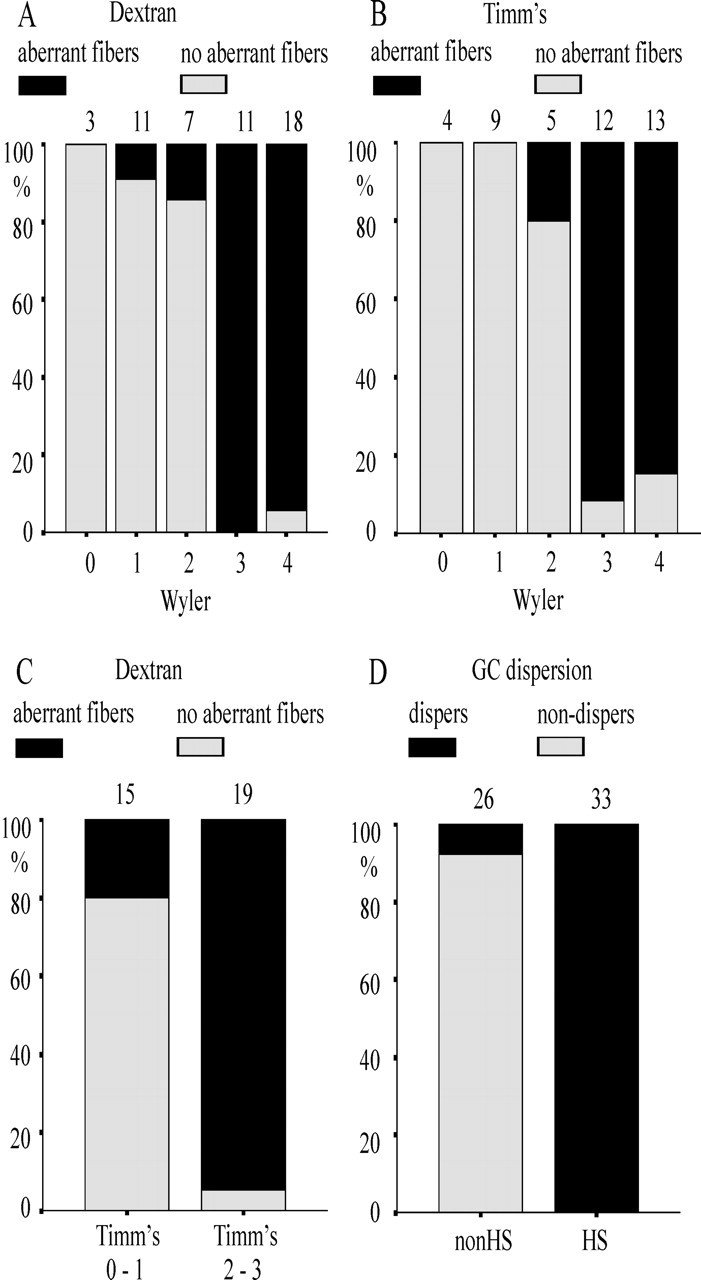
Aberrant sprouting of mossy fibers and granule cell dispersion in different patient groups. A, Proportion of cases presenting with dextran-amine-labeled mossy fibers in the IML (aberrant fibers; black label) in patient groups assigned to Wyler grades 0-4. Cases with aberrant fibers predominated in the groups presenting with classical and strong sclerosis. B, Proportion of cases displaying typical zinc precipitation in the IML (Timm scores 2 and 3 are labeled black) in patient groups assigned to Wyler grades 0-4. Note a dramatic increase from Wyler grade 2 to Wyler grade 3 (classical HS). C, Proportion of cases with positive dextran-amine labeling (black label) in Timm-positive specimens (scores 2 and 3). There is a high coincidence of positive as well as negative labeling provided by the two methods. D, Proportion of cases with dispersion of granule cells (black) in the non-HS and HS groups. All specimens with HS presented with dispersion of granule cells. Wyler grades: 0, no sclerosis; 1, mild sclerosis; 2, moderate sclerosis; 3, classical sclerosis; 4, total sclerosis.
Timm staining for zinc usually present in mossy fiber terminals was performed in 43 of 62 specimens. Supragranular Timm staining in the IML was positive in 22 of 25 specimens with HS, whereas the Timm staining was negative or weak in 17 of 18 specimens with non-HS. Typical staining pattern from HS and non-HS specimens are shown in Figure 1, E and F. With 88% of the HS specimens versus 5.6% of the non-HS specimens presenting with zinc staining in the IML, the difference between HS and non-HS was statistically significant (χ2 test; p < 0.001). With respect to the different Wyler grades, supragranular zinc was present in Wyler grades 4 and 3 (84.6 and 91.7%, respectively), in grade 2 (20%), and was never found in grades 0 and 1 (Fig. 3B).
To rule out that the zinc distribution could be biased by action of zinc transporters and zinc-binding proteins, we concurrently applied dextran-amine and Timm staining and tested for concordance of the findings in 34 specimens (Fig. 3C). Fluorescent-labeled supragranular mossy fibers were coincidentally found in 94.7% of Timm-positive specimens. Concordance of negative supragranular labeling by dextran-amine was found in 80% of Timm-negative specimens. Statistical analysis revealed a strong coherence between labeling by dextran-amine and Timm staining (χ2 test; p < 0.001; C = 0.607). Based on these findings, we classified the remaining 28 specimens as having aberrant sprouting when either Timm staining or dextran-amine fluorescence was clearly positive for supragranular staining.
In patients with HS, the granular cells were dispersed (Fig. 1A), whereas in patients without HS, the granule cell layer was dense and compact (Fig. 1B). Figure 3D shows that granule cell dispersion was found in 100% of the HS cases and in 8% of the non-HS cases (χ2 test; p < 0.001; C = 0.682).
Based on the morphological results, we divided the present tissue sample into two groups: (1) the HS group characterized by Wyler grades 3 and 4, presence of mossy fiber terminals within the IML, and granule cell dispersion; and (2) the non-HS group characterized by Wyler grades 0-2, negligible signs of MF sprouting, and rare granule cell dispersion.
Electrophysiology
Sample composition: main pathomorphological and clinical data
In the present study, field potential recordings from 62 slices of 32 specimens (February 2000 to December 2001) were analyzed, whereas the remaining specimens were subjected to two other projects. The sample comprised 40 slices from 20 hippocampi with HS and 22 slices from 12 hippocampi without HS. According to the different Wyler grades, 50% of specimens used in the electrophysiological experiments displayed grade 4, 12.5% displayed grade 3, 15.6% displayed grade 2, 18.8% displayed grade 1, and 3.1% displayed grade 0. Mossy fiber sprouting was assessed in 95% of HS specimens and in 16.7% of the non-HS specimens, whereas granule cell dispersion was observed in 100 and 16.7%, respectively.
Clinical data (Table 1) revealed that, in the electrophysiological sample, HS and non-HS groups of patients did not differ with regard to gender, age at surgery, duration of epilepsy, age at onset of epilepsy, history, approximated seizure frequencies, frequency of secondary generalization, site of resection, and outcome of surgery after 2 years of follow up according to the classification of Engel (1987b). Compared with the non-HS group, seizures generalized more often in HS patients (95 vs 58.4%; p = 0.038; Fisher's exact test). Approximately two-thirds of patients were treated with carbamazepine or oxcarbazepine either alone or in combination with other anticonvulsants. Patients in the HS group frequently received two different drugs (60%), whereas one drug treatment predominated in the non-HS group (83.3%). The corresponding proportional difference between the two groups is statistically significant (p = 0.028; Fisher's exact test).
Table 1.
Clinical data of patients in the electrophysiological study
|
Variables and categories |
HS (n = 20) |
Non-HS (n = 12) |
Total (n = 32) |
p value |
|---|---|---|---|---|
| Sex | ||||
| Female | 50% | 33.3% | 43.8% | 0.471 |
| Male | 50% | 66.7% | 56.3% | |
| Age at surgery | 35.4(2.48) | 31.2 (2.61) | 33.8 (1.84) | 0.279 |
| Duration of epilepsy (years) | 21.7 (2.12) | 15.3 (3.17) | 19.3 (1.84) | 0.089 |
| Age at onset | 13.7 (2.43) | 15.9 (3.90) | 14.5 (2.08) | 0.606 |
| History | ||||
| Yes | 65% | 58.3% | 62.5% | 0.724 |
| No | 35% | 41.7% | 37.5% | |
| Approximated seizure frequencies | ||||
| <5 per month | 65% | 58% | 62.5% | 0.470 |
| 5-15 per month | 20% | 33.3% | 25% | |
| >15 per month | 15% | 8.3% | 12.5% | |
| Generalization | ||||
| No | 5% | 41.7% | 18.8% | 0.038 |
| <1 SGS per year | 50% | 41.7% | 46.9% | |
| ≥1 SGS per year | 45% | 16.6% | 34.4% | |
| AEDs at surgery | ||||
| (a) OXC/CBZ | 20% | 66.7% | 37.4% | 0.051 |
| (b) LEV/LTG/VPA, | 20% | 16.7% | 18.8% | |
| (c) (a) + LEV/TPX/DZ | 45% | 8.3% | 31.3% | |
| (d) LTD + LEV/VPA/PB | 15% | 8.3% | 12.5% | |
| Site of resection | ||||
| Left | 65% | 41.7% | 56.3% | 0.277 |
| Right | 35% | 58.3% | 43.8% | |
| Outcome after 2 yearsa | ||||
| Seizure free | 65% | 72.7% | 67.7% | 1.000 |
| Rare seizures | 25% | 18.2% | 22.6% | |
| Worthwhile improved | 5% | 0% | 3.2% | |
| Not improved |
5% |
9.1% |
6.5% |
|
Numbers represent mean values (SEM) or proportion of patients within groups (percentage). HS, Patients presenting with hippocampal sclerosis; non-HS, patients not presenting with hippocampal sclerosis; n, number of patients in the group; p, error probability of intergroup differences (Student's test, χ2 test); SGS, secondary generalized seizure; AED, antiepileptic drug; a, b, one of the drugs is given; c, d, the first drug is given in combination with one of the other drugs; OXC, oxcarbazepine; CBZ, carbamazepine; LEV, levetiracetam; LTG, lamotrigine; VPA, valproic acid; TPX, topiramate; DZ, diazepam; PB, phenobarbital.
Engel (1987b).
In vitro analysis of stimulus responses may reveal pathophysiological factors by which granule cell populations in HS and non-HS slices might be predisposed to develop epileptiform activity. Therefore, we first report stimulus-induced field potential responses and their modulation during the induction protocol and subsequently the experimentally induced epileptiform activity.
Field potential responses to paired hilar stimulation in slices with and without hippocampal sclerosis
Typical responses to paired hilar stimulation and stimulus dependence of responses to the first stimulus of the pair are displayed in Figure 4. All data were obtained under control conditions (3 mm [K+]o). As shown previously in the presence of 5 mm [K+]o (Masukawa et al., 1992, 1997; Uruno et al., 1994), paired antidromic stimulation of MF from the hilus/area CA3 border elicited multiple population spike responses in HS slices, already in control ACSF (Fig. 4A,C), originally reported in the kainate model (Tauck and Nadler, 1985).
Figure 4.
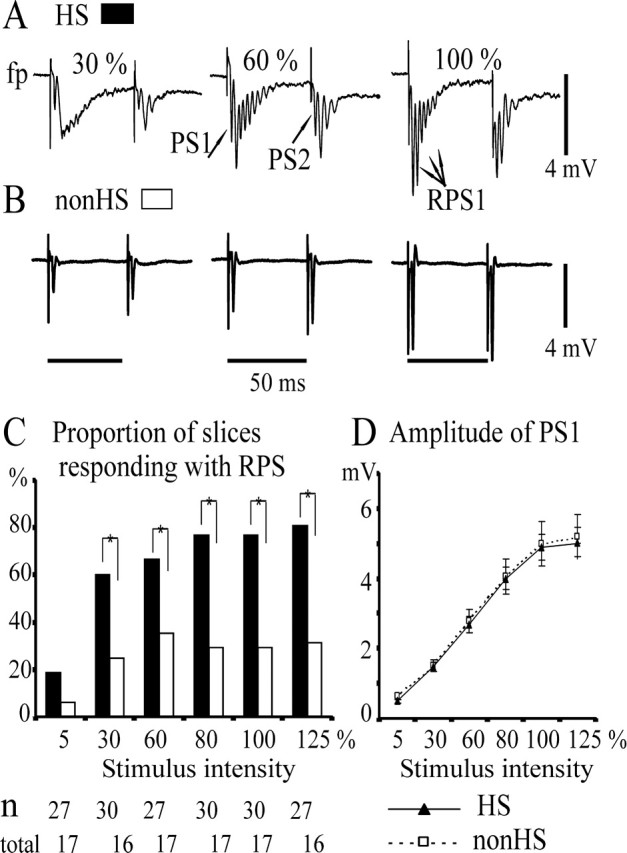
Field potential responses to paired electrical stimulation at the hilus/CA3 border (MF stimulation): differences between HS and non-HS slices. Extracellular recordings from the granule cell layer of the dentate gyrus; hilar stimulation (paired pulses, interval 50 msec, applied every 20 sec) with intensities eliciting a first population spike (PS1) of 5, 30, 60, 80, and 100% of the maximal amplitude and with supramaximal intensity (125%). A, Averaged sample traces (n = 5) of RPS responses after stimuli of 30, 60, and 80% intensity in an HS slice. B, Single population spike responses after similar stimulation in a non-HS slice. In A and B, the calibration bar for the size of field potential transients is to the right. In B, the calibration bar for the time is below. C, D, Stimulus dependence of responses to the first stimulus of the pair. Categories of increasing stimulus intensities are given on the abscissa. C, Proportion of slices displaying recurrent population spikes in response to the first stimulus of the pair in the HS group (black columns) and in the non-HS group (white columns). The total number of slices analyzed for each stimulus intensity and group is given below the category axis (HS, top; non-HS, bottom). Recurrent population spikes predominated in the HS group and are less numerous at threshold intensity. D, Stimulus dependence of the first population spike (PS1). Marker and error bar represent mean value and SEM, respectively. Lines and markers for HS and non-HS groups are given below the x-axis. There are no differences between HS slices (total, n = 34-39) and non-HS slices (total, n = 19-21). Asterisks indicate a significant difference (p = 0.05).
In HS slices, responses to the first stimulus consisted of one to eight population spikes, one regular population spike (PS1), and up to seven recurrent population spikes (RPS1). Referring to the 80% stimulus response, no recurrent population spike was observed in 20% of HS slices, one in 35%, and at least two in 45%. Mean number and duration of recurrent population spikes, as well as frequency of recurrence (150-520 Hz), are given in Table 2. The proportion of slices displaying multiple responses increased with stimulus intensity (Fig. 4C). Number and duration of recurrent population spikes did not display significant stimulus dependence (data not shown). After the second stimulus, the number of recurrent population spikes was lower, and duration of the responses was shorter than after the first one (p = 0.011, p = 0.01, respectively; Wilcoxon test), whereas the paired-pulse index only revealed minor depression. As reported previously (Isokawa and Fried, 1996; Masukawa et al., 1996), we also found negative field potential shifts >0.5 mV after the first and second stimulus in 42.5 and 55% of HS slices, respectively.
Table 2.
Field potential properties of slices grouped according to the histopathological diagnosis: HS (Wyler grades 3 and 4) and non-HS (Wyler grades 0-2)
|
Parameter analyzed |
HS |
Non-HS |
p value |
|---|---|---|---|
| Paired hilar stimulation, first response (80%) | |||
| Amplitude of PS1 (mV) | 4.3 ± 0.4 (40) | 4.3 ± 0.5 (22) | |
| PPI | 0.9 ± 0.04 (40) | 1.1 ± 0.03 (22) | 0.003 |
| Number of RPS (n) | 2.4 ± 0.3 (32) | 1.1 ± 0.14 (7) | 0.028 |
| Duration of RPS (n) (msec) | 9.3 ± 1.3 (32) | 4.8 ± 0.69 (7) | 0.037 |
| Frequency of RPS (Hz) | 267 ± 12 (32) | 249 ± 23 (7) | |
| Paired hilar stimulation, second response (80%) | |||
| Amplitude of PS2 (mV) | 4.0 ± 0.3 (40) | 4.5 ± 0.5 (22) | |
| Number of RPS (n) | 1.8 ± 0.2 (29) | 1.0 ± 0.0 (6) | 0.028 |
| Duration of RPS (n) (msec) | 7.9 ± 1.2 (29) | 3.6 ± 0.2 (6) | 0.003 |
| Frequency of RPS (Hz) | 256 ± 11 (29) | 282 ± 18 (6) | |
| Paired ML-stimulation, first response (80%) | |||
| Amplitude of PS1 (mV) | 2.7 ± 0.3 (31) | 3.7 ± 0.4 (20) | 0.033 |
| PPI | 0.66 ± 0.06 (31) | 0.45 ± 0.06 (20) | 0.023 |
| Number of RPS (n) | 3.4 ± 0.9 (11) | 1 ± 0.0 (5) | 0.015 |
| Duration of RPS (n) (msec) | 12.4 ± 4.0 (11) | 3.7 ± 0.2 (5) | |
| Frequency of RPS (Hz) |
300 ± 18 (11) |
273 ± 21 (5) |
|
Numbers in the table represent mean ± SEM (n slices). p, Error probability of intergroup differences (Mann-Whitney test); 80%, stimulus intensity evoking first population spikes with 80% of maximal size; amplitudes are given in millivolts, duration is given in milliseconds, and frequency is given in Hertz. PS1 (PS2), First population spike of the first (second) response; PPI (PS2/PS1), paired-pulse index; RPS, recurrent population spikes of the first (second) response.
In contrast, single population spike responses (Fig. 4B) predominated in non-HS slices. At 30-125% stimulus intensity, only one recurrent population spike occurred in 30-35% of the slices (Fig. 4C). The amplitude of the first population spike was not different from that of HS slices (Fig. 4D), whereas the minor paired-pulse facilitation in non-HS slices was significantly different from the minor depression in HS slices (Table 2). Negative field potential shifts were seen after the first and second stimulus in 9.1 and 18% of non-HS slices. The corresponding differences between HS and non-HS slices are significant (χ2 test; p = 0.017 and p = 0.012, respectively).
Field potential responses to paired ML stimulation in slices with and without hippocampal sclerosis
Again, in agreement with previous reports (Masukawa et al., 1989, 1996, 1997, 1999; Uruno et al., 1994), recurrent population spike responses could be evoked by orthodromic stimulation within the ML (Table 2). They appeared in 36% of HS slices and in 25% of the non-HS slices. Considering the number of such recurrent population spikes, the HS slices displayed two or more, whereas non-HS slices displayed a maximum of one (χ2 test; p = 0.011). Unlike responses to hilar stimulation, the amplitude of the first population spike and the paired-pulse depression were smaller in HS slices than in non-HS slices. The orthodromically evoked paired-pulse depression was in the same order as described previously (Swanson et al., 1998). We also compared orthodromic responses with responses elicited by hilar stimulation (Table 2) and found that orthodromically evoked paired-pulse depression was clearly stronger than that evoked by hilar stimulation (p < 0.001; Wilcoxon test).
Modulation of field potential responses to hilar stimulation during elevation of [K+]o
Next, we analyzed whether the FP responses (80% of the maximal amplitude) to hilar stimulation undergo modulation by continuous low-frequency stimulation in control ACSF or in the presence of 10-12 mm K+-containing ACSF (Fig. 5). In both HS and non-HS slices, paired low-frequency hilar stimulation at 80% stimulus intensity for 20 min was not associated with significant modulation of the first response (Fig. 5A-F, stim).
Figure 5.
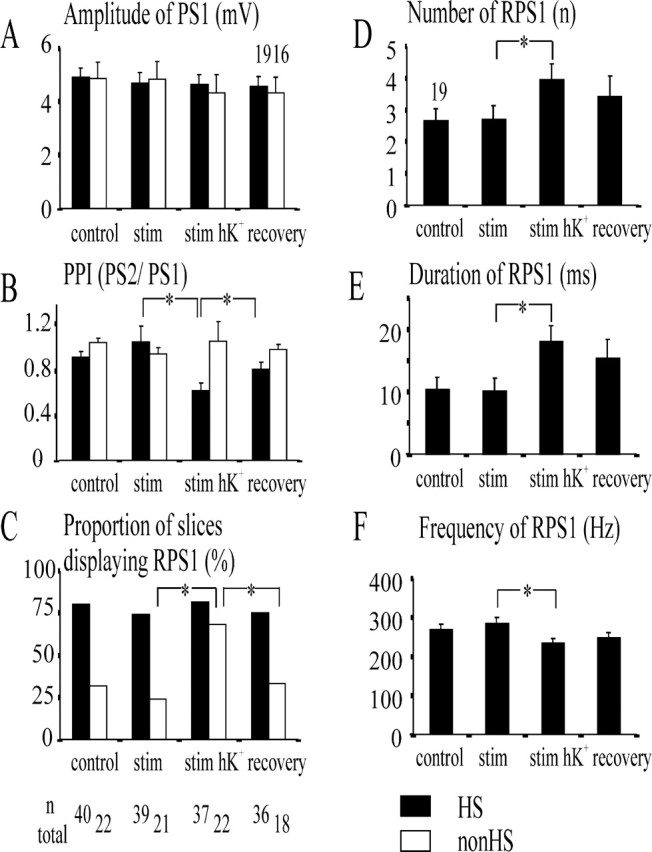
Modulation of responses to paired hilar stimulation during the induction of epileptiform activity by continuous low-frequency stimulation (stim) and stimulation in the presence of high K+-containing ACSF (stim hK+). Stimuli (50 msec interval; 80% intensity) were applied every 15 sec. All graphs except C display mean values and SEM (error bars). A and B show data analyzed listwise from 19 HS slices (black columns) and 16 non-HS slices (white columns), whereas in C, the proportions of slices responding with recurrent population spikes refer to the number of slices tested under the different conditions (numbers below the category axis). The parameters analyzed are defined at the top right of each ordinate, and categories of conditions are given below the abscissa. A, Amplitude of the first population spike (PS1). There is no modulation at all, in either HS slices or non-HS slices. B, Paired-pulse index [PPI (PS2/PS1); PS2 and PS1 are the first population spikes in response to the second/first stimulus of the pair]. The index reversibly decreased during stimulation in the presence of high K+-containing ACSF in HS slices but not in non-HS slices. C, Proportion of slices displaying recurrent population spikes (RPS1). The proportion of HS slices did not change, but that of non-HS slices reversibly increased during stimulation in the presence of high K+-containing ACSF. D-F display data from 19 HS slices. D, Number; E, duration; F, frequency of recurrent population spikes. Note an increase in the number, a prolongation of the duration, and a decline of the frequency under conditions of stimulation in the presence of high K+-containing ACSF, which had only partly recovered 60-90 min after washout of high K+-containing ACSF. Asterisks indicate a significant difference (p = 0.05).
When elevating [K+]o in HS slices, the amplitude of the first population spike and the proportion of slices displaying recurrent population spikes remained constant (Fig. 5A,C, stim hK+). The paired-pulse depression became reversibly stronger (Fig. 5B) (p < 0.000; Wilcoxon test), but the number of recurrent population spikes increased (Fig. 5D) (p = 0.001). Furthermore, the duration of recurrent responses was prolonged (Fig. 5E) (p < 0.000), whereas frequency of recurrence declined (Fig. 5F) (p = 0.007). In contrast, non-HS slices showed a stable, minor paired-pulse facilitation, whereas the proportion of multiple responses reversibly increased (Fig. 5C). Because only a small number of non-HS slices responded with recurrent population spikes in control ACSF, paired sample statistics of RPS parameters was not performed in this subgroup.
At the end of the experiment, after the slices had been bathed in control ACSF for at least 1 hr (recovery), all parameters modulated by perfusion with high K+-containing ACSF were no longer significantly different from control values.
The presence of 5-10 μm bicuculline had no significant effect on the above-mentioned changes of responses to MF stimulation by perfusion with 10 mm K+-containing ACSF.
Induction of epileptiform activities
In orienting experiments, we used solutions containing 5-20 μm bicuculline, 0 mm Mg2+, or 0.1 mm 4-aminopyridine to induce seizure-like events in human hippocampal slices but usually without success. With 5-10 μm bicuculline, single short-FP transients occurred occasionally.
When challenged by hilar stimulation in the absence of high K+-containing ACSF (n = 62), only two HS slices (two specimens) developed spontaneous transients of epileptiform activity, which lasted up to 90 sec (see Fig. 8A). Additionally, in a third HS slice from another specimen, stimulus-evoked short seizure-like events became self-sustained and prolonged (data not shown). In all other slices, continuous low-frequency hilar stimulation for 30-40 min did not induce epileptiform activity.
Figure 8.
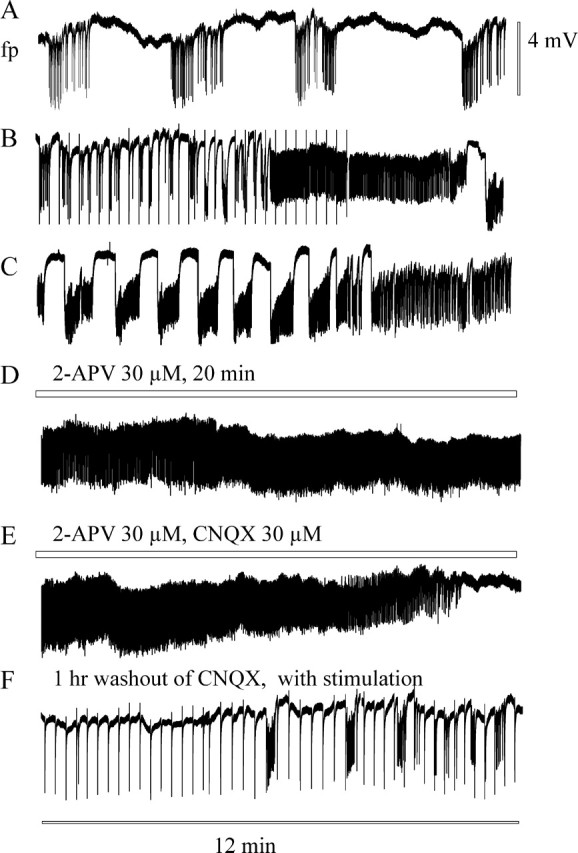
Seizure-like events (type 4) followed by recurrent short discharges: time course and effect of 30 μm CNQX in an HS slice. Calibration bars for size of field potential shifts (to the right of A) and for time (below F) apply to all traces. A, Transient period of spontaneous epileptiform activity that occurred in the absence of high K+ after testing the stimulus dependence of responses to hilar stimulation during the control period. B, Reappearance of short stimulus-associated events after 15 min of stimulation in the presence of 10 mm K+-containing ACSF and transition to typical self-sustaining seizure-like events. C, After another 10 min. Note the very long-lasting seizure-like event at the end of the trace that changed into 1 Hz activity. D, Application of 30 μm 2-APV 20 min before and during the trace had no effect on the activity. E, Additional application of 30 μm CNQX at start of this trace led to fast suppression of the activity. F, Reappearance of short stimulus-associated events after 1 hr washout of 2-APV and CNQX (with hilar stimulation throughout the last 15 min). Hilar stimulation: 50 msec interval, 80% intensity, every 15 sec.
Subsequently, we perfused the slices with ACSF containing 10 mm K+, 10 mm K+ and 5-10 μm bicuculline, or 12 mm K+, and then recurrent epileptiform events developed. These events were first associated with stimulation but became independent of stimulation and self-sustained when stimulation was stopped. Defining negative field potential shifts with duration >5 sec as well as recurrent short discharges with frequencies of 0.8-1.9 Hz as ictal-like events and short-lasting field potential transients with frequencies <0.7 Hz as interictal-like events, 61.2% of the slices showed ictaform activity and 22.6% interictal-like activity. When slices were perfused with 10 mm K+-containing ACSF, ictaform activity was observed in 58.3% of 24 HS slices but only in 20% of 10 non-HS slices (χ2 test; p < 0.05). Using 12 mm K+, ictaform activity appeared in 81.3% of 16 HS slices and in 75% of 12 non-HS slices (χ2 test; p = 0.15). This indicates that HS slices need a lower potassium concentration to develop ictaform activity than non-HS slices. The addition of bicuculline to 10 mm K+-containing ACSF did not have any significant effect (χ2 test; p = 0.53).
Patterns of self-sustained epileptiform activity
We differentiated four types of epileptiform events (Fig. 6, Table 3) according to event frequency, event duration, size of the “low frequency”-component and of the peak potential shift (Fig. 6E, indicated as a and b), additional appearance of FP transients within a single event (Fig. 6E), and event-associated rises in [K+]o. Table 3 displays the corresponding mean values and SEM for each type of activity. As illustrated in Figure 6A, type 1 was considered as short-lasting (0.21-2.6 sec) negative field potential transient with event frequency <0.7 Hz. This activity seems to mimic interictal spiking. Type 2 comprised a heterogeneous group of recurrent long-lasting (15-162 sec) negative field potential shifts, altogether characterized by the absence of “tonic-clonic-” and “clonic”-like discharges. Features of this activity varied from specimen to specimen, displaying either “tonic seizure-like events” (Fig. 6B) (n = 5 slices, 3 specimens) (also see Fig. 10A) with amplitudes <3 mV, spreading depression-like events (Fig. 6C) (n = 6 slices, 3 specimens) (also see Fig. 9A) with amplitudes of 3-12 mV, and real spreading depressions with amplitudes >15 mV (n = 2 slices, 2 specimens; not considered in Table 2, data not shown). Type 3 appeared as ongoing recurrent short discharges with frequencies of 0.8-1.9 Hz (Fig. 6D), mimicking periodic ictal spiking seen in depth-electrode recordings from the sclerotic hippocampus (Engel, 1990; Williamson et al., 1995) or late recurrent discharges in acute status epilepticus models (Dreier and Heinemann, 1991). Although this type was sometimes observed after a period of seizure like-events (see Fig. 8C,D), only slices displaying it from onset throughout the whole course of epileptiform activity were assigned to type 3. Type 4 were “seizure-like events” (Fig. 6E) (also see Fig. 8B,C) characterized by an initial burst with subsequent high-frequency fluctuations of field potentials and then by a prolonged period of tonic-clonic and/or clonic discharges superimposed on a negative FP shift and accompanied by elevations in [K+]o. To evaluate influences of different K+-concentrations, different excitability, cell loss, mossy fiber reorganization, and clinical factors on the incidence of activities of types 1-4, we performed comparisons between corresponding slice groups.
Figure 6.

Types and occurrence of self-sustained epileptiform activity. The activity was induced by paired hilar stimulation and subsequent stimulation in the presence of 10-12 mm [K+]o for at least 20 min. In A-E, the calibration bars for the size of potential shifts are at the left of each trace, and the calibration bar for time is below the traces. A, Type 1, Short-lasting field potential transients from three different slices. B, C, Type 2, Long-lasting field potential shifts mimicking tonic seizure-like events (B) or spreading depression-like events (C), always characterized by absence of clonic-like discharges. D, Type 3, Recurrent short discharges (1 Hz) mimicking ictal spiking. E, Type 4, Seizure-like events. F, G, Proportion of slices displaying types 1-4 epileptiform activity in slice groups responding with different numbers of RPSs (F) and in slice groups from HS and non-HS specimens (G). Ordinates in F and G are similar, with definition at top right of the axis in F. Sample size is given below each column. Note that types 4 and 3 activity dominated in slices that displayed two or more recurrent population spikes and exclusively occurred in HS slices. Type 2 preferentially developed in non-HS slices displaying one or no recurrent population spikes. Hilar stimulation (50 msec interval, 80% intensity, every 15 sec) lasted for 30-40 min to test whether epileptiform activity would develop in the absence of high K+.
Table 3.
Characteristics of types 1-4 spontaneous epileptiform events induced by hilar stimulation in the presence of high K+ -containing ACSF
|
|
Type 1 |
Type 2 |
Type 3 |
Type 4 |
|---|---|---|---|---|
| Analysis time (min) | 11 ± 2 | 22 ± 4 | 4 ± 0.9 | 18 ± 2 |
| Slices analyzed (n) | 7 | 11 | 10 | 16 |
| Events per minute (n/min) | 24 ± 5.4 | 0.5 ± 0.12 | 69.6 ± 7.2 | 1.3 ± 0.3 |
| Field potential shift (mV) | −0.7 ± 0.2 | −4.5 ± 1.1 | −0.9 ± 0.14 | −1.8 ± 0.4 |
| Peak amplitude (mV) | −1.3 ± 0.3 | −5.0 ± 1.1 | −1.3 ± 0.17 | −3.2 ± 0.4 |
| Duration (sec) | 1.0 ± 0.4 | 44.2 ± 13.8 | 0.2 ± 0.05 | 30.1 ± 6.8 |
| FP transients per event (n) | 1 ± 0 | 1 ± 0 | 1 ± 0 | 87.6 ± 22.4 |
| Rise of [K+]o (mm) (n) |
0.4 ± 0.05 (6) |
5.4 ± 0.9 (8) |
0.2 ± 0.05 (10) |
3.5 ± 0.9 (10) |
The characteristics listed in the left column were separately determined and averaged for each slice analyzed. Numbers in the table represent mean ± SEM for subgroups of slices displaying similarities of epileptiform events, particularly with respect to frequency of recurrence and duration. The different treatment conditions (10 mm K+, 10 mm K+ with 5-10 μm bicuculline added, or 12 mm K+) were not considered. Nevertheless, type 4 events recorded in the presence of 10 mm K+ and 10 mm K+ with 5-10 μm bicuculline did not differ with regard to their characteristics (data not shown).
Figure 10.
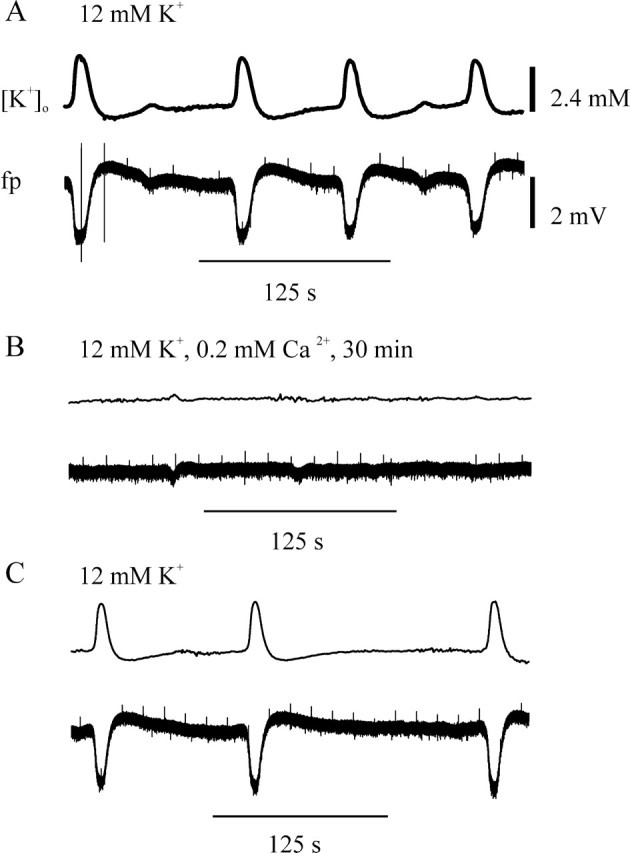
Tonic seizure-like events (type 2) in a non-HS slice: effect of lowering [Ca2+] in the perfusion solution to 0.2 mm. Pairs of synchronous traces of [K+]o and field potential are shown. Denotation for changes in [K+]o and field potential are like that in Figure 9. A, Transition from stimulation-associated events to self-sustaining activity. B, Disappearance of spontaneous events after perfusion with 0.2 mm Ca2+-containing and 12 mm K+-containing ACSF. C, Reappearance of spontaneous events 30 min after solution change to normal Ca2+ and 12 mm K+-containing ACSF. Hilar stimulation: 50 msec interval, 80% intensity, every 15 sec.
Figure 9.
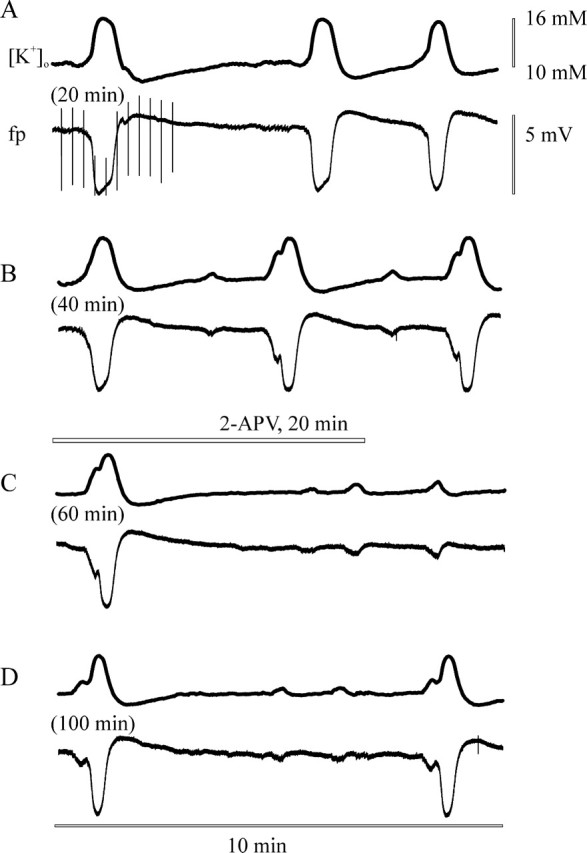
Spreading depression-like events (type 2): time course and effect of 2-APV in a non-HS slice. Pairs of synchronous traces of [K+]o and field potential are displayed. Changes of [K+]o measured in millivolts were transferred into millimolar changes according to the Nernst equation. Calibration bars for size of changes in [K+]o and field potential shifts (to the right of A) and for time (below D) apply to all traces. A, Last stimulation-associated and subsequent self-sustaining events. The trace started after 50 min of hilar stimulation and after 20 min of perfusion with 12 mm K+-containing ACSF. B, Twenty minutes later. C, Blocking effect of 2-APV after 20 min of application. D, Reappearance of less frequently occurring events, 40 min after washout of 2-APV. Numbers at the start of the traces indicate time of perfusion with high K+-containing ACSF. Hilar stimulation: 50 msec interval, 80% intensity, every 15 sec.
Statistical relations to K+ treatment, stimulus responses, hippocampal sclerosis, mossy fiber rearrangement, and clinical data
Bath application of 10 and 12 mm K+ resulted in different proportions of epileptiform activities of types 1-4 (Table 4), in both HS slices (p = 0.01; Fisher's exact test) and non-HS slices (p = 0.049). When HS slices were treated with 10 mm K+, seizure-like events (type 4) had the highest incidence. In the case of 12 mm K+, ictal spiking (type 3) appeared with similar incidence as seizure-like events. In non-HS slices bathed in 10 mm K+, interictal-like activity (type 1) predominated, and elevated K+ to 12 mm induced tonic seizure-like activity or spreading depression-like events (type 2) in a high proportion of slices. With regard to K+ treatment, there was no significant difference between HS slices and non-HS slices.
Table 4.
Incidence of epileptiform activity induced by 10 and 12 mm K+-containing ACSF in slices from sclerotic and nonsclerotic specimens
|
|
|
Interictal-like |
Ictal-like |
|
||||
|---|---|---|---|---|---|---|---|---|
| K+
|
No activity |
Type 1 |
Type 2 |
Type 3 |
Type 4 |
Number of slices |
||
| HS | ||||||||
| 10 mm | 16.7% | 25% | 4.1% | 0% | 54.2% | 24 | ||
| 12 mm | 12.5% | 6.3% | 0% | 37.4% | 43.8% | 16 | ||
| All | 15% | 17.5% | 2.5% | 15% | 50% | 40 | ||
| Non-HS | ||||||||
| 10 mm | 30% | 50% | 20% | 0% | 0% | 10 | ||
| 12 mm | 8.3% | 16.7% | 75% | 0% | 0% | 12 | ||
| All | 18.2% | 31.8% | 50% | 0% | 0% | 22 | ||
| Total |
16.1% |
22.6% |
19.4% |
9.7% |
32.2% |
62 |
||
Numbers represent proportions of slices within groups, indicated in the left two columns.
With reference to recurrent population spike responses evoked by hilar stimulation, we asked whether certain types of epileptiform activities coincidentally occurred with this response type. As shown in Figure 6F, left column, the majority of slices presenting with at least two recurrent population spikes developed types 3 and 4 ictaform activity. In contrast, slices responding with only one or no recurrent population spike mainly developed type 2 and 1 activity (Fig. 6F, middle and right columns). Statistical analysis revealed a significant coincidence of types 3 and 4 activity with hilar RPS of higher degree and of types 2 and 1 with near normal stimulus responses (χ2 test; p = 0.001; C = 0.55). If HS and non-HS slices were separately tested, the coincidence of ictaform events with RPS of higher degree is significant in HS slices (p = 0.017) but not in non-HS slices (p = 0.364), even when recurrent population spike responses of higher degree had developed in the presence of high K+ (p = 0.19).
We also studied the occurrence of epileptiform activity in HS and non-HS slices. As shown in Figure 6G, there is a clear difference between both groups of slices. Ictaform activity of type 3 or 4 was exclusively observed in HS slices, which showed these activities in 65% of the slices (13 of 20 respective specimens). In contrast, ictaform activity of type 2 predominantly appeared in non-HS slices (50% of slices; 6 of 12 specimens). Statistically, the occurrence of ictaform activity of types 3 and 4 was significantly associated with the presence of classical and total sclerosis (χ2 test; p = 0.002; C = 0.589).
Based on the criteria used to assess MF sprouting, we analyzed the coincidence of MF sprouting and the ictaform activities of types 3 and 4. If aberrant supragranular MF sprouting was present, we recorded ictaform activity of types 3 and 4 in 58% (11 of 19) of the specimens. No activity was found in 26% (5 of 19) of the cases, most of them presenting with severe cell loss in the granule cell layer. In slices from specimens without MF sprouting, we never saw ictaform activity of types 3 and 4 but type 2 in 50% (5 of 10) of the respective cases. The proportional difference in the expression of types 1-4 epileptiform activities between cases with and without MF sprouting is significant (χ2 test; p = 0.004), and the coherence of MF sprouting with occurrence of types 3 and 4 ictaform activity is statistically strong (C = 0.59).
Finally, we tested whether the incidence of types 1-4 epileptiform could be influenced by clinical factors such as age at surgery, duration of epilepsy, age at onset of epilepsy, history, approximated seizure frequency, frequency of generalization, and particularly the anticonvulsive treatment. Using one-way ANOVA and χ2 test, we found that no single variable was statistically related to the incidence of experimentally induced epileptiform activities. Discriminant analysis and classification statistics revealed that neither the combination of all parameters (71% of the patients correctly classified) nor any combination of variables was qualified to discriminate the groups of experimentally induced epileptiform activity.
Synaptic nature of ictaform events
Ictaform activities of types 3 and 4 were sensitive to lowering the extracellular Ca2+ concentration to 0.2 mm (Fig. 7D,E). This was tested in 7 of the 26 slices in which these discharge patterns occurred. They were insensitive to 2-APV but were always blocked by application of CNQX (6 of 26 slices tested) (Fig. 8D). The effects of low Ca2+ and of CNQX were partly reversible (Figs. 7F, 8F, respectively).
Figure 7.
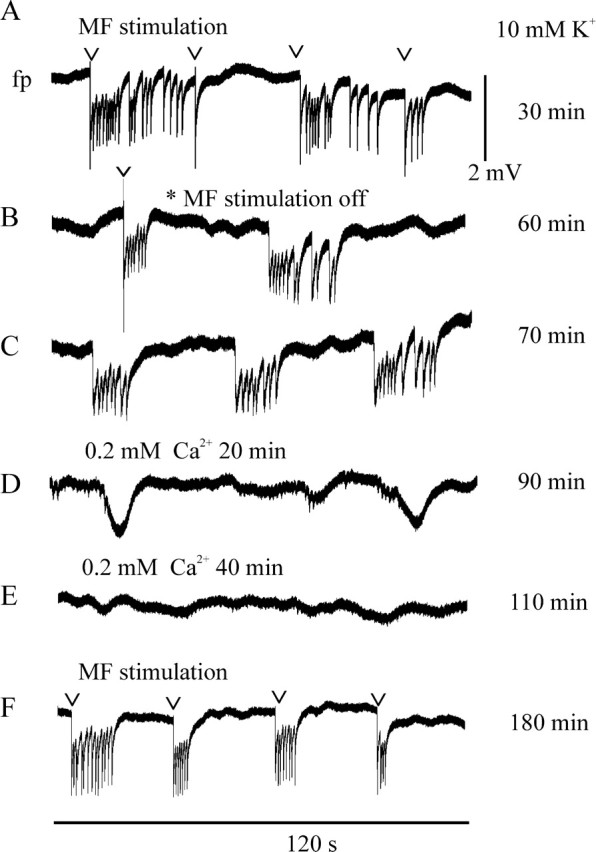
Seizure-like events (type 4): time course and effect of low Ca2+-containing ACSF in an HS slice. The calibration bars for size of field potential shifts (to the right of A) and for time (below F) apply to all traces. Numbers at the right display the time course of the experiment. A, Seizure-like events associated with paired hilar stimulation (50 msec interval, 80% intensity, every 15 sec; here, already 30 sec). B, Transition to self-sustained activity. C, Self-sustained seizure-like events. D, Effect of lowering the [Ca2+]o to 0.2 mm. The events are blocked after 20 min of perfusion, but some slow field potential shifts remained. E, Complete suppression of ictaform activity. F, Reappearance of stimulus-associated events 20 min after solution change to normal Ca2+ in 10 mm K+-containing ACSF.
Spreading depression-like events (type 2) were sensitive to 2-APV (Fig. 9C), but recurring shorter and much smaller tonic seizure-like events could then appear or were maintained (three of the six slices were tested). As illustrated in Figure 9D, the original activity reappeared after washout of 2-APV. Lowering of [Ca2+]o reversibly blocked small type 2 events, such as tonic seizure-like events (Fig. 10B,C), from non-HS patients (two of the five slices were tested).
Discussion
The present study shows for the first time experimentally induced self-sustained and synaptically mediated epileptiform activities in the dentate gyrus of slices prepared from surgically removed sclerotic and nonsclerotic hippocampal specimens of TLE patients.
Our morphological data confirm previous results (Babb et al., 1991; Mathern et al., 1997a) notifying that mossy fiber rearrangement is characteristic for patients with hippocampal sclerosis. We found a high coherence of Timm scores 2 and 3 and presence of fluorescent mossy fibers, indicating that the Timm staining provides evidence for aberrant MF sprouting. This is in line with a previous report showing coincidence of intracellularly labeled aberrant mossy fiber arborization and positive staining for zinc or dynorphin in the inner molecular layer (Isokawa et al., 1993). However, the fluorescent-labeled axons in the inner molecular layer may also identify GABAergic or peptidergic axonal systems, involved in reorganization (de Lanerolle et al., 1989, 2003; Furtinger et al., 2001; Wittner et al., 2001). In addition, we observed a striking concordance of granule cell dispersion with Wyler grades 3 and 4, as described previously (Lurton et al., 1998; El Bahh et al., 1999). Together, our morphological results were used to compare experimentally induced epileptiform activities between sclerotic tissue (Wyler grades 3 and 4) characterized by dentate network reorganization (remarkable cell loss, aberrant mossy fiber sprouting, and granule cell dispersion) and nonsclerotic tissue (Wyler grades 0-2) characterized by absence of reorganization (less cell loss and negligible signs of both MF sprouting and granule cell dispersion).
Despite the general notion that ictaform activity was evoked in both sclerotic and nonsclerotic tissue, we found remarkable differences between the two groups. (1) Seizure-like events in sclerotic tissue developed in the presence of 10 mm K+, whereas their equivalents in nonsclerotic tissue preferentially appeared in the presence of 12 mm K+, suggesting that the K+-induced depolarization necessary to evoke synchronized discharges of granule cells might be lower when network reorganization is present. Because granule cells of both groups display similar resting membrane properties (Urban et al., 1993; Williamson et al., 1999), we suggest that synaptically coupled granule cells, when depolarized by high [K+]o, could sum convergent synchronous input from other granule cells and reach threshold for seizure generation at lower [K+]o than their nonconnected counterparts. Moreover, the finding that antidromically evoked paired-pulse depression of HS slices increased in the presence of high [K+]o points to the involvement of inhibitory network reorganization (de Lanerolle et al., 1989, 1992; Patrylo et al., 1999b; Furtinger et al., 2001; Wittner et al., 2001). Alternatively, a recently suggested reduction of the glial K+-buffer capacity in the hilus (Bordey and Spencer, 2004), not recognized in our previous study on a smaller number of patients with classical sclerosis (Gabriel et al., 1998), could contribute to lowering the K+ threshold in sclerotic tissue. Additionally, it has to be taken into account that, in sclerotic tissue, the altered steady-state voltage dependence of the delayed rectifier potassium current could support hyperexcitability (Beck et al., 1996). (2) Our results also show that different types of epileptiform activities were induced in the two groups. Long-lasting field potential shifts superimposed by tonic-clonic transients like those seen in the model with robust mossy fiber sprouting (Wuarin and Dudek, 1996; Patrylo and Dudek, 1998) were exclusively induced in reorganized tissue, whereas long-lasting field potential shifts without superimposed transients were preferentially observed in tissue with little evidence for reorganization. Interestingly, Wuarin and Dudek (1996) presented evidence that, in chronic epileptic rats, the reorganized granule cell network accounts for prolongation and pattern of such events by showing that action potential firing of granule cells was highly synchronized with field potential transients, that the EPSPs underlying action potential firing became progressively synchronized, and that, with increasing event duration, a higher percentage of cells responded to microdrop application of glutamate 400 μm apart from the recording site. Our experiments did not directly address the specific contribution of the network, but we recognized that characteristic seizure pattern and periodic spiking only appeared in tissue with dentate network reorganization, particularly mossy fiber sprouting. This suggests that the recurrent excitatory network of granule cells, likely in conjunction with inhibitory network reorganization and other neuronal and glial alterations, provides for hyperexcitability and synchronization.
The fact that self-sustained synaptically mediated ictaform activity can be induced in granule cell populations of slices from specimens without reorganization in the presence of 12 mm [K+]o may or may not reflect a propensity to develop ictaform activity. In experiments on normal rat tissue, lowering of [Ca2+]o and increasing [K+]o induced nonsynaptically mediated prolonged field bursts (Schweitzer et al., 1992; Schweitzer and Williamson, 1995), whereas 12 mm [K+]o in otherwise normally composed ACSF were insufficient to made the dentate gyrus “ictogenic” (Patrylo et al., 1994; Pan and Stringer, 1997; Xiong and Stringer, 2001). At least 13-15 mm [K+]o was necessary to cause extracellularly detectable ictaform activity (Patrylo et al., 1994). Cautiously, because human hippocampus differs from that of rodents (de Lanerolle et al., 1989), we cannot simply conclude that 12 mm K+ would not be able to induce epileptiform activity. However, we could demonstrate recently that the antiepileptic drug carbamazepine suppressed long-lasting field potential shifts in slices from carbamazepine-sensitive patients, whereas it was without effect in slices of resistant patients (Remy et al., 2003), thereby supporting the view that this activity reflects at least the degree of pharmacosensitivity.
The aforementioned suggestion that the reorganized network of granule cells provides for hyperexcitability is further supported by studies notifying that, in tissue with highly scored Timm staining, recurrent population spikes were elicited by hilar stimulation in the presence of moderately elevated [K+]o in human slices (Masukawa et al., 1992, 1997; Uruno et al., 1994) and in slices from the rat kainate and pilocarpine model of HS (Wuarin and Dudek, 1996; Patrylo and Dudek, 1998; Hardison et al., 2000; Okazaki and Nadler, 2001). Here, we showed that such population spikes occur already in the presence of 3 mm [K+]o and recur with mean frequencies between 153 and 521 Hz. Moreover, we add the following point: development of seizure-like events and ictal spiking coincided with the generation of antidromically elicited multiple population spike responses, thereby confirming that these responses reflect epileptogenic conditions in reorganized tissue. Stimulus-induced population oscillations display similar frequencies as spontaneous high-frequency oscillations (fast ripples) seen in depth-electrode recordings in epileptogenic zones (Bragin et al., 1999; Staba et al., 2002). Whether such stimulus-induced oscillations also reflect hypersynchronous action potential firing in pathologically interconnected neuron clusters as hypothesized for fast ripples (Bragin et al., 2000) is not yet known. In tissue without reorganization, we found that antidromic stimulation in the presence of high K+ increased the proportion of slices showing more than one population spike, but this effect was without any statistical relation to the development of epileptiform behavior in such slices. In conclusion, our data from human epileptic hippocampus support the view that reorganization of the granule cell network might add to a general propensity for fast stimulus-induced population oscillations, to a lower threshold of epileptiform activity, and to expression of seizure-like events.
Our findings demonstrate that the different ictaform activities were synaptic in origin. This is substantiated by the fact that lowering of extracellular Ca2+, known to block evoked synaptic transmission (Jones and Heinemann, 1987), could suppress epileptiform activity in both groups of tissue. The observation that seizure-like events and ictal spiking disappeared in the presence of the AMPA receptor antagonist CNQX is in line with previous results showing that, in reorganized human and animal tissue, the antidromically activated synaptic transmission is mainly mediated by AMPA receptors (Uruno et al., 1994; Masukawa et al., 1997; Okazaki and Nadler, 2001). However, other studies in animal models and human epilepsy have provided evidence that certain NMDA receptors are overexpressed (Mathern et al., 1997b, 1999; Mikuni et al., 2000) and contribute to synaptic transmission (Isokawa et al., 1997; Patrylo and Dudek, 1998; Okazaki et al., 1999). Our finding that the NMDA receptor antagonist 2-APV blocked only large negative field potential shifts in nonsclerotic tissue suggests that the NMDA receptor is less efficiently implicated in the generation of experimentally induced ictal activity in slices from reorganized tissue. The observation that the GABAA receptor antagonist bicuculline had no additional effect on the development of epileptiform activity in the presence of high [K+]o would imply that GABAA receptor-mediated inhibition is not present or less effective. This might have two reasons: (1) loss and plasticity of hilar interneurons (de Lanerolle et al., 1992) and/or (2) effects of elevating K+ on the chloride reversal potential (Misgeld et al., 1986; Jarolimek et al., 1999).
Finally, it is worth noting that spontaneous epileptiform activity could not be recorded from the dentate gyrus, whereas equivalents of in vivo interictal activity were observed in the subiculum (Cohen et al., 2002), even in slices from specimens included in the present study (Wozny et al., 2003). In vivo depth recordings indicate interictal events and onset of seizure activity at more than one electrode site in one patient (Engel, 1987a; King et al., 1997), but the dentate gyrus in the human hippocampal slice is not a place in which in vitro spontaneous interictal activity emerges. Granule cells that are disconnected from their possible ictogenic input need to be depolarized to generate ictaform activity. The relative silence of the DG has not been addressed in our study. Because granule cells in epileptic tissue show a high resting membrane potential (Urban et al., 1993; Williamson et al., 1993; Franck et al., 1995), display reduced calcium influx (Nägerl et al., 2000), and still receive inhibitory input (Mathern et al., 1995; Patrylo et al., 1999b; Maglóczky et al., 2000; Wittner et al., 2001) evident as strong orthodromically evoked paired-pulse depression (present investigation; Swanson et al., 1998; Wilson et al., 1998), it might be understandable that we had to depolarize the granule cells and to increase synaptic cooperation by high K+ to evoke epileptiform activity.
Concluding remarks
We showed that self-sustained ictaform activity of synaptic origin can be induced in the dentate gyrus of both sclerotic and nonsclerotic human epileptic tissue. However, we also demonstrated that the extracellular potassium concentration necessary to induce such activity as well as the expression of certain patterns of activity varied with cell loss and mossy fiber reorganization. We want to stress that statistical “correlation” or “coincidence” does not provide evidence for causal relations. Therefore, suggestions made concerning the influence of granule cell coupling have to be addressed to specifically designed experiments for confirmation. The fact that it is possible to induce epileptiform activity in slices from human tissue permits testing mechanisms of drug resistance (Remy et al., 2003) and analyzing whether newly developed drugs are superior to presently available anticonvulsants in treatment of pharmacoresistant epilepsies.
Footnotes
This research was supported by Deutsche Forschungsgemeinschaft Grants Sonderforschungsbereich 507 and Sonderforschungsbereich TR3, Graduiertenkolleg 238, and the grant agencies Fundação de Amparo à Pesquisa do Estado de São Paulo and Programa de Apoio a Núcleos de Excelência (Brazil). We are indebted to H. Siegmund and H.-J.Gabriel for providing software and technical support. We thank M. J. Gutnick, A. Draguhn, A. Friedman, O. Kann, and R. Kovacs for discussion.
Correspondence should be addressed to T.-N. Lehmann, Department of Neurosurgery, Augustenburger Platz 1, Universitätsklinikum Charité, Humboldt Universität, D-13353 Berlin, Germany. E-mail: thomas-nicolas.lehmann@charite.de.
Copyright © 2004 Society for Neuroscience 0270-6474/04/2410416-15$15.00/0
S.G. and M.N. contributed equally to this work.
U.H. and T.-N.L. contributed equally to this work.
References
- Babb TL, Brown WJ, Pretorius JK, Davenport CJ, Lieb JP, Crandall PH (1984) Temporal lobe volumetric cell densities in temporal lobe epilepsy. Epilepsia 25: 729-740. [DOI] [PubMed] [Google Scholar]
- Babb TL, Kupfer WR, Pretorius JK, Crandall PH, Lévesque MF (1991) Synaptic reorganization by mossy fibers in human epileptic fascia dentata. Neuroscience 42: 351-363. [DOI] [PubMed] [Google Scholar]
- Babb TL, Mathern GW, Leite JP, Pretorius JK, Yeoman KM, Kuhlman PA (1996) Glutamate AMPA receptors in the fascia dentata of human and kainate rat hippocampal epilepsy. Epilepsy Res 26: 193-205. [DOI] [PubMed] [Google Scholar]
- Baumgartner C, Elger CE, Hufnagel A, Oppel F, Runge U, Schramm J, Stefan H, Steinhoff BJ, Wieser HG, Zentner J (2000) Qualitätsrichtlinien auf dem Gebiet der prächirurgischen Epilepsiediagnostik und operativen Epilepsietherapie. Akt Neurol 27: 88-89. [Google Scholar]
- Beck H, Blümcke I, Kral T, Clusmann H, Schramm J, Wiestler OD, Heinemann U, Elger CE (1996) Properties of a delayed rectifier potassium current in dentate granule cells isolated from the hippocampus of patients with chronic temporal lobe epilepsy. Epilepsia 37: 892-901. [DOI] [PubMed] [Google Scholar]
- Bordey A, Spencer DD (2004) Distinct electrophysiological alterations in dentate gyrus versus CA1 glial cells from epileptic humans with temporal lobe sclerosis. Epilepsy Res 59: 107-122. [DOI] [PubMed] [Google Scholar]
- Bragin A, Engel Jr J, Wilson CL, Fried I, Mathern GW (1999) Hippocampal and entorhinal cortex high-frequency oscillations (100-500 Hz) in human epileptic brain and in kainic acid-treated rats with chronic seizures. Epilepsia 40: 127-137. [DOI] [PubMed] [Google Scholar]
- Bragin A, Wilson CL, Engel Jr J (2000) Chronic epileptogenesis requires development of a network of pathologically interconnected neuron clusters: a hypothesis. Epilepsia 41 [Suppl 6]: S144-S152. [DOI] [PubMed] [Google Scholar]
- Buckmaster PS, Zhang GF, Yamawaki R (2002) Axon sprouting in a model of temporal lobe epilepsy creates a predominantly excitatory feedback circuit. J Neurosci 22: 6650-6658. [DOI] [PMC free article] [PubMed] [Google Scholar]
- Cavazos JE, Zhang PS, Qazi R, Sutula TP (2003) Ultrastructural features of sprouted mossy fiber synapses in kindled and kainic acid-treated rats. J Comp Neurol 458: 272-292. [DOI] [PubMed] [Google Scholar]
- Cohen I, Navarro V, Clemenceau S, Baulac M, Miles R (2002) On the origin of interictal activity in human temporal lobe epilepsy in vitro Science 298: 1418-1421. [DOI] [PubMed] [Google Scholar]
- Cronin J, Obenaus A, Houser CR, Dudek FE (1992) Electrophysiology of dentate granule cells after kainate-induced synaptic reorganization of the mossy fibers. Brain Res 573: 305-310. [DOI] [PubMed] [Google Scholar]
- de Lanerolle NC, Kim JH, Robbins RJ, Spencer DD (1989) Hippocampal interneuron loss and plasticity in human temporal lobe epilepsy. Brain Res 495: 387-395. [DOI] [PubMed] [Google Scholar]
- de Lanerolle NC, Brines M, Williamson A, Kim JH, Spencer DD (1992) Neurotransmitters and their receptors in human temporal lobe epilepsy. Epilepsy Res Suppl 7: 235-250. [PubMed] [Google Scholar]
- de Lanerolle NC, Kim JH, Williamson A, Spencer SS, Zaveri HP, Eid T, Spencer DD (2003) A retrospective analysis of hippocampal pathology in human temporal lobe epilepsy: evidence for distinctive patient subcategories. Epilepsia 44: 677-687. [DOI] [PubMed] [Google Scholar]
- Dreier JP, Heinemann U (1991) Regional and time dependent variations of low magnesium induced epileptiform activity in rat temporal cortex. Exp Brain Res 87: 581-596. [DOI] [PubMed] [Google Scholar]
- El Bahh B, Lespinet V, Lurton D, Coussemacq M, Le Gal LS, Rougier A (1999) Correlations between granule cell dispersion, mossy fiber sprouting, and hippocampal cell loss in temporal lobe epilepsy. Epilepsia 40: 1393-1401. [DOI] [PubMed] [Google Scholar]
- Engel Jr J (1987a) New concepts of the epileptic focus. In: The epileptic focus (Wieser HG, Speckmann E-J, Engel Jr J, eds), pp 83-94. London: Libbey.
- Engel Jr J (1987b) Outcome with respect to epileptic seizures. In: Surgical treatment of the epilepsies (Engel Jr J, ed), pp 553-572. New York: Raven.
- Engel Jr J (1990) The Hans Berger Lecture: functional explorations of the human epileptic brain and their therapeutic implications. Electroencephalogr Clin Neurophysiol 76: 296-316. [DOI] [PubMed] [Google Scholar]
- European Federation of Neurological Societies Task Force (2000) Presurgical evaluation for epilepsy surgery—European standards. Eur J Neurol 7: 119-122. [DOI] [PubMed] [Google Scholar]
- Franck JE, Pokorny J, Kunkel DD, Schwartzkroin PA (1995) Physiologic and morphologic characteristics of granule cell circuitry in human epileptic hippocampus. Epilepsia 36: 543-558. [DOI] [PubMed] [Google Scholar]
- Furtinger S, Pirker S, Czech T, Baumgartner C, Ransmayr G, Sperk G (2001) Plasticity of Y1 and Y2 receptors and neuropeptide Y fibers in patients with temporal lobe epilepsy. J Neurosci 21: 5804-5812. [DOI] [PMC free article] [PubMed] [Google Scholar]
- Gabriel S, Kivi A, Kovács R, Lehmann T-N, Lanksch WR, Meencke HJ, Heinemann U (1998) Effects of barium on stimulus-induced changes in [K+]0 and field potentials in dentate gyrus and area CA1 of human epileptic hippocampus. Neurosci Lett 249: 91-94. [DOI] [PubMed] [Google Scholar]
- Hardison JL, Okazaki MM, Nadler JV (2000) Modest increase in extracellular potassium unmasks effect of recurrent mossy fiber growth. J Neurophysiol 84: 2380-2389. [DOI] [PubMed] [Google Scholar]
- Houser CR, Miyashiro JE, Swartz BE, Walsh GO, Rich JR, Delgado-Escueta AV (1990) Altered patterns of dynorphin immunoreactivity suggest mossy fiber reorganization in human hippocampal epilepsy. J Neurosci 10: 267-282. [DOI] [PMC free article] [PubMed] [Google Scholar]
- Isokawa M, Fried I (1996) Extracellular slow negative transient in the dentate gyrus of human epileptic hippocampus in vitro Neuroscience 72: 31-37. [DOI] [PubMed] [Google Scholar]
- Isokawa M, Lévesque MF, Babb TL, Engel Jr J (1993) Single mossy fiber axonal systems of human dentate granule cells studied in hippocampal slices from patients with temporal lobe epilepsy. J Neurosci 13: 1511-1522. [DOI] [PMC free article] [PubMed] [Google Scholar]
- Isokawa M, Lévesque MF, Fried I, Engel Jr J (1997) Glutamate currents in morphologically identified human dentate granule cells in temporal lobe epilepsy. J Neurophysiol 77: 3355-3369. [DOI] [PubMed] [Google Scholar]
- Jarolimek W, Lewen A, Misgeld U (1999) A furosemide-sensitive K+-Cl- cotransporter counteracts intracellular Cl- accumulation and depletion in cultured rat midbrain neurons. J Neurosci 19: 4695-4704. [DOI] [PMC free article] [PubMed] [Google Scholar]
- Jones RSG, Heinemann U (1987) Abolition of the orthodromically evoked IPSP of CA1 pyramidal cells before the EPSP during washout of calcium from hippocampal slices. Exp Brain Res 65: 676-680. [DOI] [PubMed] [Google Scholar]
- Jones RSG, Lambert JDC (1990) The role of excitatory amino acid receptors in the propagation of epileptiform discharges from the entorhinal cortex to the dentate gyrus in vitro Exp Brain Res 80: 310-322. [DOI] [PubMed] [Google Scholar]
- Kim JH, Guimaraes PO, Shen MY, Masukawa LM, Spencer DD (1990) Hippocampal neuronal density in temporal lobe epilepsy with and without gliomas. Acta Neuropathol Berl 80: 41-45. [DOI] [PubMed] [Google Scholar]
- King D, Bronen RA, Spencer DD, Spencer SS (1997) Topographic distribution of seizure onset and hippocampal atrophy: relationship between MRI and depth EEG. Electroencephalogr Clin Neurophysiol 103: 692-697. [DOI] [PubMed] [Google Scholar]
- Kivi A, Lehmann T-N, Kovács R, Eilers A, Jauch R, Meencke H-J, von Deimling A, Heinemann U, Gabriel S (2000) Effects of barium on stimulus-induced rises of [K+]o in human epileptic non-sclerotic and sclerotic hippocampal area CA1. Eur J Neurosci 12: 2039-2048. [DOI] [PubMed] [Google Scholar]
- Lehmann TN, Gabriel S, Kovacs R, Eilers A, Kivi A, Schulze K, Lanksch WR, Meencke HJ, Heinemann U (2000) Alterations of neuronal connectivity in area CA1 of hippocampal slices from temporal lobe epilepsy patients and from pilocarpine-treated epileptic rats. Epilepsia 41 [Suppl 6]: S190-S194. [DOI] [PubMed] [Google Scholar]
- Lehmann T-N, Gabriel S, Eilers A, Njunting M, Kovacs R, Schulze K, Lanksch WR, Heinemann U (2001) Fluorescent tracer in pilocarpine-treated rats shows widespread aberrant hippocampal neuronal activity. Eur J Neurosci 14: 83-95. [DOI] [PubMed] [Google Scholar]
- Lothman EW, Stringer JL, Bertram EH (1992) The dentate gyrus as a control point for seizures in the hippocampus and beyond. In: The dentate gyrus and its role in seizures (Ribak CE, Gall CM, Mody I, eds), pp 273-280. Amsterdam: Elsevier Science. [PubMed]
- Lurton D, El Bahh B, Sundström LE, Rougier A (1998) Granule cell dispersion is correlated with early epileptic events in human temporal lobe epilepsy. J Neurol Sci 154: 133-136. [DOI] [PubMed] [Google Scholar]
- Lux HD, Neher E (1973) The equilibration time course of [K+]o in cat cortex. Exp Brain Res 17: 190-205. [DOI] [PubMed] [Google Scholar]
- Lynch M, Sutula T (2000) Recurrent excitatory connectivity in the dentate gyrus of kindled and kainic acid-treated rats. J Neurophysiol 83: 693-704. [DOI] [PubMed] [Google Scholar]
- Maglóczky Z, Wittner L, Borhegyi Z, Halász P, Vajda J, Czirják S, Freund TF (2000) Changes in the distribution and connectivity of interneurons in the epileptic human dentate gyrus. Neuroscience 96: 7-25. [DOI] [PubMed] [Google Scholar]
- Masukawa LM, Higashima M, Kim JH, Spencer DD (1989) Epileptiform discharges evoked in hippocampal brain slices from epileptic patients. Brain Res 493: 168-174. [DOI] [PubMed] [Google Scholar]
- Masukawa LM, Uruno K, Sperling MR, O'Connor MJ, Burdette LJ (1992) The functional relationship between antidromically evoked field responses of the dentate gyrus and mossy fiber reorganization in temporal lobe epileptic patients. Brain Res 579: 119-127. [DOI] [PubMed] [Google Scholar]
- Masukawa LM, O'Connor WM, Lynott J, Burdette LJ, Uruno K, McGonigle P, O'Connor MJ (1995) Longitudinal variation in cell density and mossy fiber reorganization in the dentate gyrus from temporal lobe epileptic patients. Brain Res 678: 65-75. [DOI] [PubMed] [Google Scholar]
- Masukawa LM, Wang HW, O'Connor MJ, Uruno K (1996) Prolonged field potentials evoked by 1 Hz stimulation in the dentate gyrus of temporal lobe epileptic human brain slices. Brain Res 721: 132-139. [DOI] [PubMed] [Google Scholar]
- Masukawa LM, O'Connor WM, Burdette LJ, McGonigle P, Sperling MR, O'Connor MJ, Uruno K (1997) Mossy fiber reorganization and its possible physiological consequences in the dentate gyrus of epileptic humans. Adv Neurol 72: 53-68. [PubMed] [Google Scholar]
- Masukawa LM, Burdette LJ, McGonigle P, Wang H, O'Connor W, Sperling MR, O'Connor MJ, Uruno K (1999) Physiological and anatomical correlates of the human dentate gyrus: consequences or causes of epilepsy. Adv Neurol 79: 781-794. [PubMed] [Google Scholar]
- Mathern GW, Babb TL, Pretorius JK, Leite JP (1995) Reactive synaptogenesis and neuron densities for neuropeptide Y, somatostatin, and glutamate decarboxylase immunoreactivity in the epileptogenic human fascia dentata. J Neurosci 15: 3990-4004. [DOI] [PMC free article] [PubMed] [Google Scholar]
- Mathern GW, Kuhlman PA, Mendoza D, Pretorius JK (1997a) Human fascia dentata anatomy and hippocampal neuron densities differ depending in the epileptic syndrome and age at first seizure. J Neuropathol Exp Neurol 56: 199-212. [DOI] [PubMed] [Google Scholar]
- Mathern GW, Pretorius JK, Kornblum HI, Mendoza D, Lozada A, Leite JP, Chimelli LMC, Fried I, Sakamoto AC, Assirati JA, Lévesque MF, Adelson PD, Peacock WJ (1997b) Human hippocampal AMPA and NMDA mRNA levels in temporal lobe epilepsy patients. Brain 120: 1937-1959. [DOI] [PubMed] [Google Scholar]
- Mathern GW, Pretorius JK, Mendoza D, Leite JP, Chimelli L, Born DE, Fried I, Assirati JA, Ojemann GA, Adelson PD, Cahan LD, Kornblum HI (1999) Hippocampal N-methyl-d-aspartate receptor subunit mRNA levels in temporal lobe epilepsy patients. Ann Neurol 46: 343-358. [DOI] [PubMed] [Google Scholar]
- Mello LEAM, Cavalheiro EA, Tan AM, Kupfer WR, Pretorius JK, Babb TL, Finch DM (1993) Circuit mechanisms of seizures in the pilocarpine model of chronic epilepsy: cell loss and mossy fiber sprouting. Epilepsia 34: 985-995. [DOI] [PubMed] [Google Scholar]
- Mikuni N, Babb TL, Wylie C, Ying Z (2000) NMDAR1 receptor proteins and mossy fibers in the fascia dentata during rat kainate hippocampal epileptogenesis. Exp Neurol 163: 271-277. [DOI] [PubMed] [Google Scholar]
- Misgeld U, Deisz RA, Dodt HU, Lux HD (1986) The role of chloride transport in postsynaptic inhibition of hippocampal neurons. Science 232: 1413-1415. [DOI] [PubMed] [Google Scholar]
- Molnar P, Nadler JV (1999) Mossy fiber-granule cell synapses in the normal and epileptic rat dentate gyrus studied with minimal laser photostimulation. J Neurophysiol 82: 1883-1894. [DOI] [PubMed] [Google Scholar]
- Nägerl UV, Mody I, Jeub M, Lie AA, Elger CE, Beck H (2000) Surviving granule cells of the sclerotic human hippocampus have reduced Ca2+ influx because of a loss of calbindin-D(28k) in temporal lobe epilepsy. J Neurosci 20: 1831-1836. [DOI] [PMC free article] [PubMed] [Google Scholar]
- Okazaki MM, Nadler JV (2001) Glutamate receptor involvement in dentate granule cell epileptiform activity evoked by mossy fiber stimulation. Brain Res 915: 58-69. [DOI] [PubMed] [Google Scholar]
- Okazaki MM, Molnar P, Nadler JV (1999) Recurrent mossy fiber pathway in rat dentate gyrus: synaptic currents evoked in presence and absence of seizure-induced growth. J Neurophysiol 81: 1645-1660. [DOI] [PubMed] [Google Scholar]
- Pan E, Stringer JL (1997) Role of potassium and calcium in the generation of cellular bursts in the dentate gyrus. J Neurophysiol 77: 2293-2299. [DOI] [PubMed] [Google Scholar]
- Patrylo PR, Dudek FE (1998) Physiological unmasking of new glutamatergic pathways in the dentate gyrus of hippocampal slices from kainate-induced epileptic rats. J Neurophysiol 79: 418-429. [DOI] [PubMed] [Google Scholar]
- Patrylo PR, Schweitzer JS, Dudek FE (1994) Potassium-dependent prolonged field bursts in the dentate gyrus: effects of extracellular calcium and amino acid receptor antagonists. Neuroscience 61: 13-19. [DOI] [PubMed] [Google Scholar]
- Patrylo PR, Schweitzer JS, Dudek FE (1999a) Abnormal responses to perforant path stimulation in the dentate gyrus of slices from rats with kainate-induced epilepsy and mossy fiber reorganization. Epilepsy Res 36: 31-42. [DOI] [PubMed] [Google Scholar]
- Patrylo PR, Van den Pol AN, Spencer DD, Williamson A (1999b) NPY inhibits glutamatergic excitation in the epileptic human dentate gyrus. J Neurophysiol 82: 478-483. [DOI] [PubMed] [Google Scholar]
- Remy S, Gabriel S, Urban BW, Dietrich D, Lehmann TN, Elger CE, Heinemann U, Beck H (2003) A novel mechanism underlying drug resistance in chronic epilepsy. Ann Neurol 53: 469-479. [DOI] [PubMed] [Google Scholar]
- Scharfman HE, Sollas AL, Berger RE, Goodman JH (2003) Electrophysiological evidence of monosynaptic excitatory transmission between granule cells after seizure-induced mossy fiber sprouting. J Neurophysiol 90: 2536-2547. [DOI] [PubMed] [Google Scholar]
- Scheibel ME, Crandall PH, Scheibel AB (1974) The hippocampal dentate complex in temporal lobe epilepsy. Epilepsia 15: 55-80. [DOI] [PubMed] [Google Scholar]
- Schweitzer JS, Williamson A (1995) Relationship between synaptic activity and prolonged field bursts in the dentate gyrus of the rat hippocampal slice. J Neurophysiol 74: 1947-1952. [DOI] [PubMed] [Google Scholar]
- Schweitzer JS, Patrylo PR, Dudek FE (1992) Prolonged field bursts in the dentate gyrus: dependence on low calcium, high potassium, and nonsynaptic mechanisms. J Neurophysiol 68: 2016-2025. [DOI] [PubMed] [Google Scholar]
- Staba RJ, Wilson CL, Bragin A, Fried I, Engel Jr J (2002) Quantitative analysis of high-frequency oscillations (80-500 Hz) recorded in human epileptic hippocampus and entorhinal cortex. J Neurophysiol 88: 1743-1752. [DOI] [PubMed] [Google Scholar]
- Sutula TP, Cascino G, Cavazos JE, Parada I, Ramirez L (1989) Mossy fiber synaptic reorganization in the epileptic human temporal lobe. Ann Neurol 26: 321-330. [DOI] [PubMed] [Google Scholar]
- Swanson TH, Sperling MR, O'Connor MJ (1998) Strong paired pulse depression of dentate granule cells in slices from patients with temporal lobe epilepsy. J Neural Transm 105: 613-625. [DOI] [PubMed] [Google Scholar]
- Tauck DL, Nadler JV (1985) Evidence of functional mossy fiber sprouting in hippocampal formation of kainic acid-treated rats. J Neurosci 5: 1016-1022. [DOI] [PMC free article] [PubMed] [Google Scholar]
- Urban L, Aitken PG, Crain BJ, Friedman AH, Somjen GG (1993) Correlation between function and structure in “epileptic” human hippocampal tissue maintained in vitro Epilepsia 34: 54-60. [DOI] [PubMed] [Google Scholar]
- Uruno K, O'Connor MJ, Masukawa LM (1994) Alterations of inhibitory synaptic responses in the dentate gyrus of temporal lobe epileptic patients. Hippocampus 4: 583-593. [DOI] [PubMed] [Google Scholar]
- Wenzel HJ, Woolley CS, Robbins CA, Schwartzkroin PA (2000) Kainic acid-induced mossy fiber sprouting and synapse formation in the dentate gyrus of rats. Hippocampus 10: 244-260. [DOI] [PubMed] [Google Scholar]
- Williamson A, Spencer DD, Shepherd GM (1993) Comparison between the membrane and synaptic properties of human and rodent dentate granule cells. Brain Res 622: 194-202. [DOI] [PubMed] [Google Scholar]
- Williamson A, Spencer SS, Spencer DD (1995) Depth electrode studies and intracellular dentate granule cell recordings in temporal lobe epilepsy. Ann Neurol 38: 778-787. [DOI] [PubMed] [Google Scholar]
- Williamson A, Patrylo PR, Spencer DD (1999) Decrease in inhibition in dentate granule cells from patients with medial temporal lobe epilepsy. Ann Neurol 45: 92-99. [DOI] [PubMed] [Google Scholar]
- Wilson CL, Khan SU, Engel Jr J, Isokawa M, Babb TL, Behnke EJ (1998) Paired pulse suppression and facilitation in human epileptogenic hippocampal formation. Epilepsy Res 31: 211-230. [DOI] [PubMed] [Google Scholar]
- Wittner L, Magloczky Z, Borhegyi Z, Halasz P, Toth S, Eross L, Szabo Z, Freund TF (2001) Preservation of perisomatic inhibitory input of granule cells in the epileptic human dentate gyrus. Neuroscience 108: 587-600. [DOI] [PubMed] [Google Scholar]
- Wozny C, Kivi A, Lehmann TN, Dehnicke C, Heinemann U, Behr J (2003) Comment on “On the origin of interictal activity in human temporal lobe epilepsy in vitro” Science 301: 463. [DOI] [PubMed] [Google Scholar]
- Wuarin J-P, Dudek FE (1996) Electrographic seizures and new recurrent excitatory circuits in the dentate gyrus of hippocampal slices from kainate-treated epileptic rats. J Neurosci 16: 4438-4448. [DOI] [PMC free article] [PubMed] [Google Scholar]
- Wuarin J-P, Dudek FE (2001) Excitatory synaptic input to granule cells increases with time after kainate treatment. J Neurophysiol 85: 1067-1077. [DOI] [PubMed] [Google Scholar]
- Wyler AR, Dohan FC, Schweitzer JB, Berry AD (1992) A grading system for mesial temporal pathology (hippocampal sclerosis) from anterior temporal lobectomy. J Epilepsy 5: 220-225. [Google Scholar]
- Xiong ZQ, Stringer JL (2001) Prolonged bursts occur in normal calcium in hippocampal slices after raising excitability and blocking synaptic transmission. J Neurophysiol 86: 2625-2628. [DOI] [PubMed] [Google Scholar]
- Ying Z, Babb TL, Comair YG, Bushey M, Touhalisky K (1998) Increased densities of AMPA GluR1 subunit proteins and presynaptic mossy fiber sprouting in the fascia dentata of human hippocampal epilepsy. Brain Res 798: 239-246. [DOI] [PubMed] [Google Scholar]
- Zhang N, Houser CR (1999) Ultrastructural localization of dynorphin in the dentate gyrus in human temporal lobe epilepsy: a study of reorganized mossy fiber synapses. J Comp Neurol 405: 472-490. [PubMed] [Google Scholar]