

Abstract
The endoplasmic reticulum (ER) stress response contributes to neuronal survival in ischemia and neurodegenerative processes. ORP150 (oxygen-regulated protein 150)/HSP12A (heat shock protein 12A), a novel stress protein located in the ER, was markedly induced in Purkinje cells maximally at 4-8 d after birth, a developmental period corresponding to their vulnerability to cell death. Both terminal deoxynucleotidyl transferase-mediated biotinylated UTP nick end-labeling analysis and immunostaining using anti-activated caspase-3 antibody revealed that transgenic mice with targeted neuronal overexpression of ORP150 (Tg ORP150) displayed diminished cell death in the Purkinje cell layer and increased numbers of Purkinje cells up to 40 d after birth (p < 0.01), compared with those observed in heterozygous ORP150/HSP12A-deficient (ORP150+/-) mice and wild-type littermates (ORP150+/+). Cultured Purkinje cells from Tg ORP150 mice displayed resistance to both hypoxia- and AMPA-induced stress. Behavioral analysis, using rotor rod tasks, indicated impairment of cerebellar function in Tg ORP150 animals, consistent with the concept that enhanced survival of Purkinje cells results in dysfunction. These data suggest that ER chaperones have a pivotal role in Purkinje cell survival and death and thus may highlight the importance of ER stress in neuronal development.
Keywords: apoptosis, [Ca], cerebellum, death, Purkinje cell, glutamate, neuronal cell death, calbindin, cerebellar ataxia
Introduction
Among cells constituting the CNS, neurons are especially vulnerable to fluctuations in the extracellular environment, including ischemic stress, trauma, and a range of infectious challenges. Moreover, within the general population of neurons, certain subsets display enhanced vulnerability to particular toxic insults. One mechanism often invoked to explain neuronal susceptibility to stress is their response to glutamate (Coyle and Puttfarchen, 1993). For example, in ischemia, glutamate toxicity is likely to exacerbate neuronal death, along with hypoxia, glucose deprivation, and the generation of reactive oxygen intermediates (Siesjoe, 1988). Glutamate-receptor interaction ultimately triggers elevation of intracellular [Ca2+] ([Ca2+]i), the final common pathway of cell death attributable, at least in part, to activation of intracellular Ca2+-dependent proteinases, such as calpain/cathepsin, caspases, and p35 (Lee et al., 2000). Thus, cellular mechanisms that buffer these events could have a protective role, potentially early in the ischemic process.
In contrast, astrocytes are considerably more resistant to environmental challenge. On the basis of this phenotypic difference in cell behavior, we have cloned a stress protein induced by oxygen deprivation, ORP150 (oxygen-regulated protein 150), and have shown it to have a central role in cellular survival in hypoxia (Kuwabara et al., 1996; Ozawa et al., 1999). Subsequently, we analyzed neuronal expression of ORP150 and found that it contributes to maintenance of cell viability in ischemia, although the time course and level of ORP150 expression were quite different than in astrocytes (Tamatani et al., 2001). In hippocampal neuronal cultures, ORP150 induced in the endoplasmic reticulum (ER) in response to hypoxia stabilized [Ca2+]i, thereby suppressing activation of Ca2+-dependent proteinases (Kitao et al., 2001). Furthermore, adenovirus-mediated expression of ORP150 in the hippocampus suppressed, at least partly, delayed neuronal cell death (Miyazaki et al., 2002). These data suggest a central role for the ER-associated molecular chaperone ORP150 in the defense of neurons to environmental stress.
Cerebellar Purkinje cells represent a group of neurons highly vulnerable to ischemic and excitotoxic stress (Welsh et al., 2002). The effect of ischemic stress on Purkinje cells has been difficult to analyze in vivo because of methodological difficulties, especially in mice (Hata et al., 1993; Sieber et al., 1995). However, it has become clear that ischemia-related stress responses are operative during brain development, suggesting an overlap of basic cellular properties marshaled to deal with physiological and pathological environmental conditions (Calabrese et al., 2002). Therefore, a strategy contributing to Purkinje cell survival in development might also lead to recognition of protective mechanisms relevant to pathophysiological situations.
In this report, we demonstrate that expression of ORP150 in the cerebellum occurs especially in Purkinje cells early after birth. Purkinje cell death observed in this developmental period was correlated with induction of ORP150, potentially representing incomplete protection attributable to insufficient endogenous expression of ORP150, compared with other cell types, such as astrocytes (Tamatani et al., 2001). Consistent with this concept, transgenic (Tg) mice with targeted neuronal overexpression of ORP150 displayed decreased Purkinje cell death and increased numbers of Purkinje cells in the cerebellum (with associated changes in cerebellar function), whereas the opposite was observed in mice heterozygous for deletion of the ORP150 gene (ORP150+/-; note that ORP150-/- mice display an embryonic lethal phenotype). These data suggest the role of ER stress, through induction of ORP150, and, potentially, other factors in modulating Purkinje cell vulnerability during development and postnatally in stress responses.
Materials and Methods
Animals. Mice deficient in ORP150 were originally generated by Kitao et al. (2001). Germ line transmission of the mutationally inactivated ORP150 gene was achieved, and mice were backcrossed into the C57BL/6 strain (N10). Genotype assignment of offspring was determined by Southern blotting of genomic DNA from tails. Transgenic mice with targeted neuronal expression of wild-type ORP150 were made using the platelet-derived growth factor (PDGF) B-chain promoter (Sasahara et al., 1991). The latter animals were made and characterized as described (Tamatani et al., 2001). Offspring that carried the transgene were identified by Southern blotting and bred into the C57BL/6 strain (N10).
Histochemistry. Animals were perfused with paraformaldehyde (4%) under deep anesthesia, and brains were cut into parasagittal slices on a cryostat. Sections were processed for cresyl violet staining or for immunohistochemistry using anti-rabbit human ORP150 IgG (5 μg/ml; Kuwabara et al., 1996; Kitao et al., 2001; Ozawa et al., 2001), monoclonal mouse anti-calbindin D28K IgG (Sigma, St. Louis, MO; 1:1000 dilution), mouse anti-growth arrest- and DNA damage-inducible gene 153/CHOP (C/EBP-homologous protein) IgG (Santa Cruz Biotechnology, Santa Cruz, CA; 1:100 dilution), mouse anti-Lys-Asp-Glu-Leu (KDEL) IgG (Stressgen Biotechnologies Co. ; 1:500 dilution), rabbit anti-HSP72 (72 kDa heat shock protein) IgG (Stressgen Biotechnologies Co. ; 1:500 dilution), or mouse anti-activated JNK1 (Jun kinase 1) IgG (Sigma; 1:100 dilution). The density and size of Purkinje cells were calculated as described previously (Baader et al., 1998). In brief, every 10th section (10 μm thickness) was evaluated by counting the number of Purkinje cells. The mean Purkinje cell (PC) number per section was derived from five sections. For area measurements, every third section (40 μm thickness) was measured in a digital captured image using Photoshop software (Adobe Systems, Tokyo, Japan). The cell density and size were also measured in the granular cell layer according to the protocol by Kakizawa et al. (2000). In brief, mice were perfusion-fixed at 30 d after birth. After the staining of a sagittal section (10 μm thickness) with cresyl violet, granular cell density in lobules 4 and 5 was counted. In each case, two observers without knowledge of the experimental protocol evaluated sections, and experiments were repeated at least three times.
Assessment of neuronal cell death in vivo. Parasagittal cerebellar sections were evaluated by terminal deoxynucleotidyl transferase-mediated biotinylated UTP nick end-labeling (TUNEL) staining (Trevigen Apoptotic Cell System 2 terminal deoxynucleotidyl transferase-fluor in situ apoptosis detection kit; Trevigen, Inc.) and immunostaining with antibody to activated caspase-3 (Genzyme, Boston, MA; 0.3 μg/ml final concentration). Calbindin D28K-positive neurons were identified as Purkinje cells and counted in sections in three fields (magnification, 40×; Fan et al., 2001). Purkinje cells staining positively by either the TUNEL method or with anti-activated caspase-3 antibody were scored as dead cells. Neurons in the other parts of the brain were identified by immunostaining with anti-MAP2 antibody (Kitao et al., 2001). Neuronal cell death was assessed by an overlapping distribution of either TUNEL or activated caspase-3 staining and MAP2-positive cells. In each case (studies involving TUNEL assay and immunocytochemistry), two observers without knowledge of the experimental protocol evaluated sections and experiments were repeated at least three times.
Cell culture of cerebellar neurons. Primary cultures of cerebellar cells were prepared from cerebella of mouse pups (embryonic day 18) as described by Netzeband et al. (1999), followed by determination of genotype by PCR (Kitao et al., 2001). In brief, cerebellar cortices were isolated from the surrounding tissue and then minced and triturated without enzymatic treatment in saline containing (in mm): 137 NaCl, 5.4 KCl, 0.17 Na2HPO4, 0.22 KH2PO4, 33.3 glucose, 43.8 sucrose, and 10 HEPES-NaOH, pH 7.3. Cells were plated on 15 mm round coverslips (∼105 cells per slip) coated with poly-l-lysine (Sigma). Cultures were then placed on a feeder layer of astrocytes, which were incubated in DMEM (Sigma) supplemented with horse serum (heat-inactivated, 10%), fetal calf serum (heat-inactivated, 10%), and glucose (5 gm/l). The medium was exchanged twice weekly, and experiments were performed after cells had been maintained for 9 d in vitro.
Assessment of Purkinje cell death in vitro. Purkinje cell death triggered by either excitotoxicity or oxygen deprivation was assessed as described by Brorson et al. (1995). In brief, cells plated on chamber slides were exposed to either AMPA (30 μm; Sigma) or vehicle (PBS) dissolved in HEPES-buffered saline containing tetrodotoxin (0.5 μm) and bicuculline (20 μm) for 20 min, as described (Brorson et al., 1995). After exchange of the medium, cells were further maintained under normoxic conditions for up to 24 hr. To determine cell viability in the setting of oxygen deprivation, cultures were either exposed to hypoxia, using a controlled environment chamber (Ogawa et al., 1990), or maintained in normoxia for up to 24 hr. In each experiment, cultures on chamber slides, treated in the same manner, were immunostained with antibody to calbindin D28k. Calbindin D28k-positive and -negative cells were counted to achieve totals of >100 for each condition by a blinded evaluator. Survival of calbindin D28k-positive neurons under each condition was calculated as relative survival based on the quotient of calbindin D28k-positive cells under that condition divided by calbindin D28k-positive cells present under control conditions. Similarly, the specific survival of calbindin D28k-negative neurons under each condition was calculated as relative survival based on the quotient calbindin D28k-negative cells under that condition divided by calbindin D28k-negative cells under control conditions. No qualititative change in the appearance of the calbindin D28k staining pattern was observed in surviving neurons. Survival of calbindin D28k-positive or -negative cells was determined by at least three separate experiments.
Western blot and analysis. Levels of ORP150 antigen in tissue extracts were determined semiquantitatively by immunoblotting, as described (Kuwabara et al., 1996). Tissue extracts were prepared in PBS containing NP-40 (1%), and proteins were separated by SDS-PAGE and transferred to polyvinylidene difluoride paper, followed by incubation with either anti-human ORP150 antibody (1 μg/ml) or anti-human β-actin antibody (1000× dilution; Sigma), the latter as an internal control. Where indicated, Western blotting using anti-KDEL monoclonal antibody (Stressgen Biotechnologies Co.; 0.2 μg/ml) was used to assess levels of GRP78 (78 kDa glucose-regulated protein; Ozawa et al., 1999). Densitometric evaluation was employed to assess ORP150 antigen using imaging software (Adobe Photoshop).
Behavioral studies. Mice were subjected to behavioral analysis 30 d after birth. After identification of genotypes (see above), animals were subjected to open-field and rotor rod tests. During the open-field test, animals were allowed to search freely in a square acrylic box (30 × 30 cm) for 20 min. The light attached to the sealing of the enclosure was on during the first 10 min (light period) and off during the later 10 min. On each x and y bank of the open field, two infrared rays were attached 2 cm above the floor at 10 cm intervals, making a flip-flop circuit between the two beams. The total number of beam crossings was counted for 10 min as traveling behavior of the animal (locomotion). On the x bank, the other 12 infrared rays were set 5 cm above the floor at 3 cm intervals, and the total number of beam crossings was counted for 10 min as rearing behavior (rearing). The enclosure was washed with water and then 70% ethanol between each test to avoid the smell, which interferes with mouse behavior. In the rotor rod test, an animal was placed on a drum that was turned at a speed of 2.5 rpm for 30 sec. If the animal fell during the interval, the latency was recorded. If the mouse could maintain its position, the speed was accelerated by 2.5 rpm every 30 sec; i.e., to 5, 7.5, and 10 rpm at 30 sec intervals. Falling latency was then recorded. Each trial was repeated three times, and the mean latency of three trials was calculated for each mouse. Student's t test was used for statistical comparison.
Electrophysiological analysis. Parasagittal cerebellar slices (250 μm thickness) were prepared from ORP150+/-, ORP150+/+, or Tg ORP150 mice as described (Kano et al., 1995). Whole-cell recordings were made from visually identified Purkinje cells using an upright microscope (BX50WI; Olympus Optical, Tokyo, Japan) at 31°C. Resistance of patch pipettes was 3-6 MΩ when filled with an intracellular solution composed of (in mm): 60 CsCl, 10 Cs gluconate, 20 TEA-Cl, 20 BAPTA, 4 MgCl2, 4 ATP, and 30 HEPES, pH 7.3, adjusted with CsOH. Pipette access resistance was compensated by 70-80%. Composition of the standard bathing solution was (in mm): 125 NaCl, 2.5 KCl, 2 CaCl2, 1 MgSO4, 1.25 NaH2PO4, 26 NaHCO3, and 20 glucose, bubbled with 95% O2 and 5% CO2. Bicuculline (10 mm) was always added to block inhibitory synaptic transmission. Ionic currents were recorded with an Axopatch 1D patch-clamp amplifier (Axon Instruments, Foster City, CA). Signals were filtered at 2 kHz and digitized at 20 kHz. On-line data acquisition and off-line data analysis were performed using PULSE software (HEKA). Stimulation pipettes (5-10 mm tip diameter) were filled with standard saline and used to apply square pulses for focal stimulation (duration, 0.1 msec; amplitude, 0-90 V). Climbing fibers were stimulated in the granule cell layer 50-100 mm away from the Purkinje cell soma.
Statistical analyses. Unless indicated otherwise, statistical analysis was performed by either ANOVA followed by multiple-comparison analysis using the Newman-Keuls equation or two-way ANOVA followed by multiple-contrast analysis. Where indicated, data were analyzed by χ2 analysis.
Results
Expression of ORP150 in developing brain
Immunoblotting was performed to compare levels of ORP150 in different regions of developing mouse brain. Expression of ORP150 in cerebral cortex (Fig. 1A), caudate putamen (Fig. 1B), and hippocampus (Fig. 1C) displayed a small, although nonsignificant, rise from the time of birth to postnatal days 8-20, when an apparent plateau was reached. Immunohistochemical analysis revealed low levels of ORP150 antigen in a range of neurons in the latter brain subregions on postnatal days 1, 4, and 10 (Fig. 1F-H,K-M,P-R, respectively). In contrast, ORP150 peaked 4-6 d after birth in cerebellum, with levels significantly above the baseline, by threefold to fivefold, on days 4-8 (Fig. 1D). Cerebellar ORP150 antigen detected immunohistochemically showed a parallel rise on postnatal day 4 (Fig. 1N) compared with days 1 and 10 (Fig. 1I,S). On the basis of Nissl staining of adjacent slices, ORP150 was localized predominantly to the Purkinje cell layer (Fig. 1T,V). Consistent with previous reports (Stacchiotti et al., 1997; Calabrese et al., 2002), inducible-type HSP70 was also expressed in the Purkinje cell layer (Fig. 1U). Another class of molecular chaperones, GRP78 and GRP94, displayed very low-level expression using anti-KDEL antibody in the cerebellum 4 d after birth (Fig. 1W) (Kitao et al., 2001). Expression of stress-related proteins, such as JNK (Urano et al., 2000) and CHOP (Wang et al., 1996), was also virtually undetectable on postnatal day 4 (Fig. 1X,Y, respectively).
Figure 1.
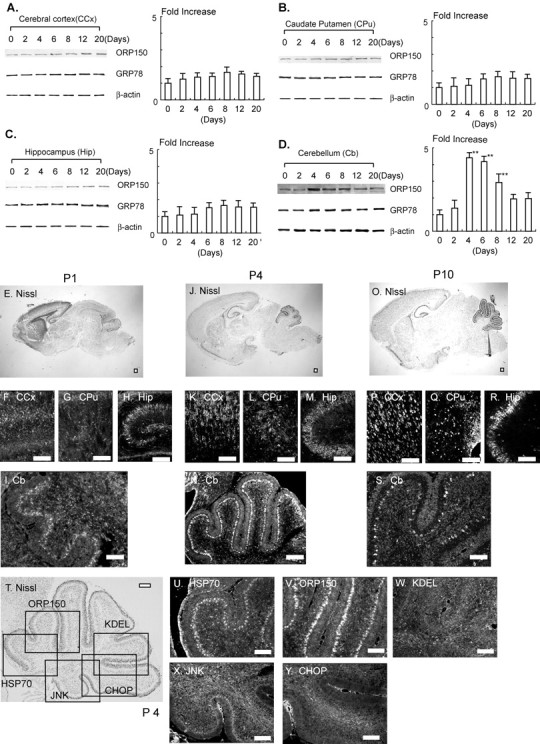
Expression of ORP150 in brain during postnatal development. A-D, Protein extracts prepared from cerebral cortex (CCx; A), caudate putamen (Cpu; B), hippocampus (Hip; C), or cerebellum (Cb; D) during development (0-20 d after birth) were subjected to Western blotting using antibody to ORP150 (top lanes), GRP78 (middle lanes), or β-actin (bottom lanes). In each blot, densitometric analysis of the ORP150 band intensity was performed and expressed by fold increase versus that on day 0; n = 6 per time point. **p < 0.01, multiple-comparison analysis followed by ANOVA. E-S, Mouse brain was perfusion-fixed on P1, P4, and P10. Tissue was either stained with cresyl violet (E, J, O) or immunostained with antibody to ORP150 (F-I, K-N, P-S). T-Y, Mouse brain (P4) was stained with cresyl violet (T). Adjacent sections were stained with antibody to inducible-type HSP70 (U), ORP150 (V), KDEL (which recognizes both GRP78 and GRP94; W), activated JNK (X), or CHOP (Y). Orientation of U-Y is indicated as an open box in T. Scale bars, 100 μm. Images representative of six experiments are shown.
In view of the role of ORP150 in stress-mediated neuronal cell death (Kitao et al., 2001; Tamatani et al., 2001), we examined whether there was a relationship between ORP150 expression and induction of ORP150 in the developing cerebellum. Immunohistochemical analysis with antibody to activated caspase-3 and TUNEL staining both showed ∼2-3% positive neurons (i.e., MAP2-positive cells) in cerebral cortex, caudate putamen, and hippocampus (Fig. 2A-C). In contrast, there is an increase in cells labeled with activated caspase-3 antigen, the latter defined as Purkinje cells based on immunoreactivity with calbindin D28k (Brorson et al., 1995), 4-6 d after birth (Fig. 2D,E-H). DNA fragmentation, displayed by TUNEL assay, followed the increase in activated caspase-3 antigen (Fig. 2D,I-L). These data indicate that ORP150 expression appears to be maximal at a time corresponding to programmed death of Purkinje cells.
Figure 2.

Cell death in the postnatal developing brain. A-D, Mouse brain was perfusion-fixed 0-20 d after birth. Cerebral hemispheres were then stained with antibody to activated caspase-3 or by the TUNEL method. The same sections were also visualized with either antibody to MAP2 staining (for A-C; data not shown) or calbindin D28K (for D; data not shown) to identify neurons (A-C) or Purkinje cells (D). Open bars represent the percentage of activated caspase-3-positive cells also positive for MAP2 (A-C) or calbindin D28k (D); shaded bars represent TUNEL-positive cells in each population; n = 6 per experimental condition. *,**p < 0.01 by multiple-comparison analysis followed by two-way ANOVA, compared with the values at day 0. E-H, Cerebellar sections prepared 4 d after birth were stained with cresyl violet (E), antibody to calbindin D28k (Calb; F), or activated caspase-3 (casp3; G). The merged image of F and G is shown in H. I-L, Cerebellar sections prepared 6 d after birth were stained with either cresyl violet (I), antibody to calbindin D28k (J), or using the TUNEL method (K). The merged image of J and K is shown in L. Scale bars, 100 μm. Images representative of six experiments are shown.
Expression of ORP150 in cerebellum in genetically manipulated mice and the effect on Purkinje cell death
Our previous work demonstrated a protective effect of ORP150 on neuronal viability in the settings of ischemia and excitotoxicity. Thus, expression of ORP150 in Purkinje cells at a time corresponding to induction of cell death could denote insufficient expression of endogenous ORP150 to exert a protective effect. Alternatively, the function of ORP150 in the cerebellum might be quite different from what has been observed elsewhere (Tamatani et al., 2001). To address these issues, we turned to genetically manipulated mice: heterozygous for deficiency of ORP150 (ORP150+/-) and heterozygous transgenic with neuronal expression of ORP150 driven by the PDGF B-chain promoter (Tg ORP150).
Immunoblotting was performed to assess ORP150 antigen levels in ORP150+/-, wild-type (ORP150+/+), and Tg ORP150 mice in the cerebellum (Fig. 3). ORP150+/- animals displayed a relatively constant low level of ORP 150 antigen up to 30 d after birth (Fig. 3A), compared with intermediate levels (following the expression pattern observed in Fig. 2D) in non-Tg littermates (wild-type; Fig. 3H) and constant high levels in Tg ORP150 animals (Fig. 3P). The latter were maintained up to postnatal day 120 (data not shown). Immunohistochemical analysis using antibodies to calbindin D28k and ORP150 showed decreased expression of ORP150 antigen in the Purkinje cell layer from ORP150+/- mice (Fig. 3B-G). Non-Tg littermates displayed time-dependent ORP150 induction, peaking at 4-6 d after birth (Fig. 3I-N). Tg ORP150 mice displayed uniform and strong staining in the Purkinje cell layer (Fig. 3Q-V). The latter high level of ORP150 expression was maintained at the latest time point evaluated, 30 d (data not shown).
Figure 3.

Expression of ORP150 in cerebellum of genetically manipulated mice. Immunoblotting was performed on protein extracts from ORP150+/- mice (A), non-Tg littermates (ORP150+/+; H) or Tg ORP150 mice (P) at postnatal days 0-30 using antibody to ORP150 (top lanes) or β-actin (bottom lanes). In each panel, densitometric analysis of ORP150 band intensity was performed, and statistical analysis of four representative experiments is shown. Values are expressed as fold increase versus antigen level of ORP150 in the cerebellum in non-Tg littermates at the time of birth; n = 6 per time point. **p < 0.01, multiple-comparison analysis followed by ANOVA. B-G, ORP150+/- mice were perfusion-fixed at P1, P4, and P10. Cerebellar hemispheres were then subjected to immunostaining using antibody to calbindin D28k (B, D, F) or ORP150 (C, E, G). I-O, ORP150+/+ mice were subjected to immunostaining for calbindin D28k (I, K, M) and ORP150 (J, L, N) antigen. O, Higher magnification of N. Q-W, Tg ORP150 mice were subjected to immunostaining for calbindin D28k (Q, S, U) or ORP150 (R, T, V). W, Higher magnification of V. Scale bar, 100 μm. Images are representative six experiments.
The key issue was to correlate levels of ORP150 expression with induction of apoptosis in the Purkinje cell layer, on the basis of TUNEL assay (Migheli et al., 1995) and immunostaining with antibody to activated caspase-3 (Selimi et al., 2000). In ORP150+/- mice, cell death in the Purkinje cell layer was apparent by TUNEL analysis [Fig. 4A-C, postnatal day 6 (P6), P10, arrowheads] and immunohistochemical staining with antibody to activated caspase-3 (Fig. 4D, P4, arrowheads). Both TUNEL (Fig. 4F-H, arrowheads) analysis and immunostaining (Fig. 4I, arrowheads) showed that signals related to Purkinje cell death tended to be fewer in wild-type littermates (OPR150+/+), although this difference was not statistically significant. Such evidence of programmed cell death in wild-type and ORP150+/- animals was strongly suppressed in Tg ORP150 mice (Fig. 4K-N). Image analysis demonstrated a significant reduction in TUNEL- and caspase-3-positive cells from Tg ORP150 animals on days 4-6, compared with wild-type and ORP150+/- animals (Fig. 4P,Q). Even by postnatal day 12, there were greater numbers of TUNEL-positive nuclei in the cerebellum of ORP150+/- animals compared with wild-type animals (Fig. 4P). The suppression of Purkinje cell death was generally observed in cerebellum because there were no anatomical differences (i.e., vermis or hemisphere) in the frequency of either TUNEL- or activated caspase-3-positive signals (data not shown).
Figure 4.

Expression of ORP150 suppresses Purkinje cell death during cerebellar development. A-O, ORP150+/-, ORP150+/+, or Tg ORP150 mice were perfusion fixed at P1, P4, P6, P10, and P30 and stained with antibody to calbidin D28k only (Calb; E, J, O) or double-stained by TUNEL assay and antibody to calbindin D28k (A-C, F-H, K-M), or antibodies to calbindin D28k and activated caspase-3 (Casp3; D, I, N). Scale bars, 100 μm; images are representative of six experiments. P, The percentage of TUNEL-positive nuclei colocalized with calbindin D28k-positive cells in ORP150+/- (open bars), ORP150+/+ (shaded bars), or Tg ORP150 (filled bars) mice was determined in samples prepared 6 and 12 d after birth. Q, The percentage of cellular profiles positive for both activated caspase-3 and calbindin D28k in ORP150+/- (open bars), ORP150+/+ (shaded bars), or Tg ORP150 (filled bars) mice was determined in samples prepared 4 and 12 d after birth. **p < 0.01; *p < 0.05, compared with non-Tg littermates (n = 6 per time point). R, The population of Purkinje cells (calbindin D28k-positive cells) was counted in the cerebellar hemisphere of Tg ORP150 (filled bars) and ORP150+/- (open bars) mice at 4, 10, 20, and 30 d after birth. Values are expressed as fold increase or decrease compared with non-Tg littermates; n = 6 per time point. **p < 0.01, nonpaired t test compared with non-Tg (wild-type) littermates.
We reasoned that if Tg ORP150 mice displayed strongly attenuated evidence of apoptosis in the Purkinje cell layer, then there might also be a difference in cell number in the cerebellum. The number of calbindin D28k-positive cellular profiles was used to identify Purkinje cells (Fan et al., 2001). Compared with wild-type controls (arbitrarily assigned a value of 1), there was a significant increase in Purkinje cells in Tg ORP150 mice (∼30-40%). In contrast, there was a decrease in Purkinje cells (∼20%) in ORP150+/- mice that did not achieve significance. Although assessed in different anatomical regions (Baader et al., 1998), no significant difference was observed in either population or cell size between vermis and hemisphere (data not shown). These data indicate that expression of ORP150 in Purkinje cells appears to have a protective effect in terms of cell death during early development, inconsistent with a previous report, which suggested that overexpression of human bcl-2 suppressed programmed Purkinje cell death (Zanjani et al., 1996). In contrast, there was no significant difference in either numerical density or size of granular cells (data not shown), which was assessed by the protocol described by Kakizawa et al. (2000).
ORP150 suppresses Purkinje cell death in vitro
To further analyze the effect of ORP150 on the Purkinje cell response to cell stress, cultured Purkinje cells were exposed to either hypoxia (Fig. 5A) or AMPA (Fig. 5C) for up to 24 hr, followed by assessment of cell viability using immunohistochemical criteria (Brorson et al., 1995). Incubation of cultured Purkinje cells under hypoxic conditions (Fig. 5A) or in the presence of AMPA (Fig. 5C) decreased the number of calbindin D28k-positive cellular profiles (compared with untreated controls). Cultures prepared from Tg ORP150 mice displayed relative resistance of calbindin D28k-positive cells to each of these stimuli, compared with Purkinje cells from ORP150+/- or wild-type mice. Although we predicted that there might be a notable difference in the response to stress between calbindin D28k-positive cells from ORP150+/- mice and those from non-Tg mice, the former potentially showing greater vulnerability to cell death compared with the latter, this difference proved barely discernible in cell culture. Micrographs (Fig. 5E-J) of wild-type cultures display representative fields revealing calbindin D28k-positive cells under quiescent conditions (Fig. 5E,H) or after exposure to hypoxia (Fig. 5F) or AMPA (Fig. 5I). Note the evident decrease in calbindin D28k-positive cells in cultures from wild-type animals compared with results using cultures from Tg ORP150 mice (Fig. 5G,J).
Figure 5.

Effect of ORP150 on Purkinje cell death in vitro. A-D, Purkinje cells were prepared from ORP150+/- (open bars), ORP150+/+ (shaded bars), or Tg ORP150 (filled bars) mice within 1 d after birth. Cells were then incubated in astrocyte-conditioned medium, as described in Materials and Methods, for 10 d and exposed to hypoxia (A, B) for 0-24 hr. Viability of Purkinje cells (A) and non-Purkinje cells (B) was then assessed at the indicated time points, as described in Materials and Methods. Purkinje cells (C) and non-Purkinje cells (D) were also exposed to AMPA (30 μm) under normoxic conditions. At the indicated time points, cell viability was assessed. Values are expressed as percent cell death compared with the viability of the untreated cultures. *p < 0.01, compared with wild-type cultures by multiple-contrast analysis followed by two-way ANOVA. E-J, Representative images of immunostaining of cultures from wild-type (WT; non-Tg) animals under controlled conditions, neurons from WT animals exposed to hypoxia (F) or AMPA (I), or neurons from Tg ORP150 mice (TG) exposed to hypoxia (G) or AMPA (J). Incubation of cultures under hypoxic conditions (E, F) or exposure to AMPA (30 μm; H-J) was for 24 hr. Scale bars, 100 μm. Images are representative of six experiments.
In contrast, calbindin-negative cells, which mostly represent granular neurons (Brorson et al., 1995), were relatively resistant to both hypoxia (Fig. 5B) and AMPA (Fig. 5D), regardless of mouse genotype, compared with calbindin D28k-positive neurons. Because expression of ORP150 was similarly decreased in calbindin D28k-positive and -negative neuronal populations in vitro from ORP150+/- mice (data not shown) and similarly increased in calbindin D28k-positive and -negative neuronal populations in vitro from Tg ORP150 mice (data not shown), these data suggest a special effect of ORP150 on Purkinje cell viability.
Behavioral and cerebellar function in Tg ORP150 mice
To assess whether suppression of neuronal cell death in Tg ORP150 mice altered cerebellar function in a more global way, behavioral testing was performed using two motor tasks, open-field (Fig. 6A) and rotor rod (Fig. 6B) tasks (Shahbazian et al., 2001; Chena et al., 2002). In the open-field test (Fig. 6A), ORP150+/- mice displayed performance identical to that of ORP150+/+ animals. In contrast, motor coordination, assessed by the rotor rod test (Fig. 6B), showed significant impairment in Tg ORP150 mice. These data suggest that overexpression of ORP150, although enhancing the viability of Purkinje cells in early development and increasing their numbers in adult animals, ultimately caused cerebellar dysfunction. There were no differences in performance of ORP150+/- and ORP150+/+ mice (data not shown).
Figure 6.

Behavioral analysis of Tg ORP150 mice. Open-field activity (A) and rotor rod behavior (B) were assessed in non-Tg littermates (ORP150+/+; shaded bars) and Tg ORP150 mice (filled bars). A, Open-field performance was examined using an acrylic box as described in Materials and Methods. The total number of crossings across the two infrared rays attached 2 cm above the floor on each x and y bank was counted during first 10 min (with light on; Light) and the following 10 min (with the light off; Dark) as traveling behavior of the animal (Locomotion). The total number of crossings across the 12 infrared rays attached 5 cm above the floor on the x bank was counted during the first 10 min (Light) and the following 10 min (Dark) as rearing behavior of the animal (Rearing). Values are expressed as mean frequency of each activity in each period. Body weights of phenotype mice are also shown at the right. B, Motor coordination was evaluated by the mean of falling latency from the rotor rod using an acceleration protocol (2.5, 5, and 7.5 rpm followed by 10 rpm for 30 sec each). Values are mean ± SE. ORP150+/+, n = 9 for each condition; Tg ORP150, n = 6 for each condition. *p < 0.05, Student's t test.
Normal cerebellar synaptic function in ORP150 mutant mice
To probe the mechanism underlying cerebellar dysfunction in mutant mice, we examined the electrophysiological properties of Purkinje cells using whole-cell recordings in cerebellar slices. We first compared passive membrane properties of Purkinje cells by recording membrane currents in response to hyperpolarizing voltage steps from the holding potential of -70 to -80 mV. As reported previously (Llano et al., 1991), the decay of the current was biphasic and could be described by the sum of two exponentials (data not shown). From their time constants, we calculated several parameters representing passive properties of Purkinje cells on the basis of the model equivalent circuit of Purkinje cells described by Llano et al. (1991) (Table 1). This model distinguishes two regions in the Purkinje cell. Region 1 represents the soma and the main proximal dendrite, and region 2 represents the main part of dendritic tree. The lumped membrane capacitance of regions 1 and 2 were calculated as C1 and C2, respectively. R1 represents the pipette access resistance. Region 2 is linked to region 1 by resistor R2, which represents the lumped resistance between the main proximal dendrite and each membrane region of the distal dendrites. R3 represents the lumped resistance of the dendritic tree of Purkinje cells. With respect to these parameters, we found no significant differences among ORP150-/+, ORP150+/+, and Tg ORP150 mice (Table 1). These results suggest that the size of the soma and the main proximal dendrite and the extent of the dendritic tree are similar in these three strains of mice.
Table 1.
Passive membrane properties of PCs
|
Mice |
C1(pF) |
C2(pF) |
R1(MΩ) |
R2(MΩ) |
Rm(R3)(MΩ) |
n |
|---|---|---|---|---|---|---|
| ORP150-/+ | 162.2 ± 87.4 | 847.6 ± 203.4 | 6.4 ± 1.1 | 9.0 ± 2.8 | 181.5 ± 70.6 | 16 |
| ORP150+/+ | 154.8 ± 68.7 | 870.7 ± 230.9 | 6.1 ± 0.9 | 8.0 ± 2.5 | 162.7 ± 70.8 | 25 |
| TgORP150 |
171.6 ± 78.1 |
854.0 ± 120.9 |
6.3 ± 1.6 |
7.9 ± 1.9 |
198.7 ± 88.6 |
11 |
Parameters for passive membrane properties were calculated according to the model described by Llano et al. (1991), which distinguishes two regions of Purkinje cells: region 1 representing the soma and the main proximal dendrites and region 2 representing the dendritic tree. C1 and C2 represent the lumped membrane capacitance of regions 1 and 2, respectively. R1 represents the pipette access resistance. Region 2 is linked to region 1 by resistor R2, which represents the lumped resistance between the main proximal dendrite and each membrane region of the distal dendrites. R3 represents the lumped resistance of the dendritic tree of PCs.
Purkinje cells receive two distinct excitatory inputs: parallel fibers (the axons of granule cells) and climbing fibers (the axons of the inferior olivary neurons) (Ito, 1984). Individual Purkinje cells are innervated by multiple climbing fibers initially during early development, but supernumerary climbing fibers are pruned subsequently, and most Purkinje cells become monoinnervated by the third postnatal week (Crepel et al., 1981; Mariani and Changeux, 1981a,b). Several knock-out mice show abnormal retention of multiple climbing fiber innervation and impairment of motor coordination (Kano et al., 1995, 1997). Thus, we examined whether multiple climbing fiber innervation persists in the ORP 150 mutant mice. We estimated the number of climbing fibers innervating each Purkinje cell by electrophysiological examination (Kano et al., 1995, 1997). When a climbing fiber was stimulated, an EPSC was elicited in an all-or-none manner in the majority of Purkinje cells (Fig. 6A), indicating that such Purkinje cells were innervated by single climbing fibers. In some Purkinje cells, more than one discrete climbing fiber-mediated EPSC (CF-EPSC) could be elicited when the stimulating electrode was moved systematically by 20 μm steps and the stimulus intensity was increased gradually at each stimulation site. The number of climbing fibers innervating the Purkinje cell was estimated by counting the number of discrete CF-EPSC steps. The summary graph in Figure 6B indicates that frequency distribution of Purkinje cells in terms of the number of CF-EPSC steps (Fig. 6A,B) showed no significant difference between the three genetically manipulated mice (p > 0.05, χ2 test). These results suggest that developmental elimination of surplus climbing fibers is normal in these mice. We then examined basic electrophysiological properties of EPSCs by stimulating climbing fibers and parallel fibers. We first examined the kinetics of CF-EPSCs. The 10-90% rise times, decay time constants, and amplitudes were similar among the three strains of mice (data not shown). We then examined short-term plasticity of climbing fiber and parallel fiber synapses. In normal external calcium concentration (2 mm), CF-EPSCs display depression, whereas parallel fiber-mediated EPSCs (PF-EPSCs) undergo facilitation, to the pair of stimuli (Konnerth et al., 1990; Aiba et al., 1994). The paired pulse depression of CF-EPSCs (pulse interval, 10-3000 msec) and the paired pulse facilitation of PF-EPSCs (pulse interval, 10-300 msec) were similar among the three strains of mice (data not shown). These results indicate that basic properties of CF- and PF-EPSCs are normal in these mice.
Discussion
Integral to development of the central nervous system is loss of a large number of neurons through “naturally occurring cell death,” by mechanisms that remain to be elucidated (Calabrese et al., 2002). Morphological evidence suggests that such cell death often displays characteristics typical of apoptosis as a final common pathway. However, the key issue is to identify endogenous triggers and breaks on this system that enable selected neuronal populations to survive and to form complex synaptic networks, whereas others are eliminated. Expression of molecular chaperones in developing brain, such as ORP150, suggests the presence of ongoing neuronal stress probably attributable, in part, to perturbations in the local environment. ORP150 was first identified as a stress protein in astrocytes exposed to severe hypoxia (Kuwabara et al., 1996). Because ORP150 is localized to the ER and expressed in response to stress, upregulation of Purkinje cell ORP150 suggests the presence of an ongoing stress response during cerebellar development.
Molecular chaperones are abundant, well conserved proteins essential for maintaining cellular function (Wynn et al., 1994). Environmental stress focused on the ER (termed ER stress) causes a proteotoxic insult: immature proteins accumulate in the ER; conformational changes occur (Patil and Walter, 2001); and induction of molecular chaperones is the result. The protective role of chaperones is crucial for cell survival and repair in response to environmental challenge. In this context, we have previously demonstrated that ORP150 has neurotrophic properties in a range of settings, including ischemia-induced cell death (Tamatani et al., 2001), excitotoxicity (Kitao et al., 2001), and delayed neuronal cell death (Miyazaki et al., 2002). In this article, we have extended this concept by showing that expression of ORP150 in Purkinje cells decreases their vulnerability to hypoxic and excitotoxic stress and enhances their survival during development in vivo.
Certain neuronal populations display selective vulnerability to toxic insults, potentially resulting in loss of those cells. Purkinje cells, in particular among cerebellar neurons, are susceptible to ischemic stress (Sieber et al., 1995; Yoshida et al., 2002), as well as other neurodegenerative-associated conditions (Dove et al., 2000). A likely final common pathway for such toxicity is elevation of free [Ca2+]i. Increased [Ca2+]i is associated with a number of cytotoxic events, including chronic ethanol intoxication (Netzeband et al., 1999), diseases characterized by accumulation of proteins with polyglutamine repeats (Clark and Orr, 2000), and traumatic brain injury (Netzeband et al., 1999). Molecular chaperones in the ER have the capacity to function as a buffer system to suppress elevated [Ca2+]i by the maintaining the complex metabolic and biosynthetic properties of this organelle (Yu et al., 1999). In this context, we have demonstrated that ORP150 also suppresses elevations of [Ca2+]i in cultured hippocampal neurons exposed to excitatory amino acids (Kitao et al., 2001). Our preliminary observations reveal expression of ORP150 in Purkinje cells in the setting of human stroke and a primate model of experimental brain ischemia. Taken together, these observations further support the concept that expression of ORP150 in Purkinje cells during development (P4-P8; Figs. 1, 2) is indicative of the presence of environmental stress, potentially ischemic, excitotoxic, or both (see below).
Our current results demonstrate selective upregulation of ORP150 in the developing cerebellum, whereas levels of other molecular chaperones, such as GRP78, remain unchanged. From an evolutionary point of view, these two stress proteins (ORP150 and GRP78) have overlapping functions in yeast. Null mutant strains of lumenal Hsp seventy (LHS)1, the yeast homolog of ORP150, display “compensatory” upregulation of Kar2p, the yeast homolog of GRP78. Although each gene alone is not essential for yeast viability, lethality is observed when inactivating mutations are introduced into both Kar2p and LHS1 (Craven et al., 1996). In contrast, our previous study demonstrated embryonic lethality in homozygous ORP150-/- embryos (in which the ORP150 gene had been deleted by homologous recombination and replaced by an inactive, truncated form). Thus, it appears that properties of ORP150 and GRP78 have diverged over time; the function of ORP150 cannot be complemented by increased expression of GRP78, and ORP150 appears to be essential for survival in mammalian embryogenesis (Craven et al., 1996). A similar critical role for the HSP47, another molecular chaperone in the ER, in embryonic development has been shown; a genomic mutant of HSP47 also results in embryonic lethality (Nagai et al., 2000).
Mechanisms underlying the vulnerability of cerebellar Purkinje cells to environmental stress remain to be clarified. Cell differentiation and synaptogenesis in cerebellum come in different waves depending on the neuronal populations and afferents and are highly interactive mutually (Altman and Bayer, 1997). In rats, the first postnatal wave comes at P4, characterized with rapid growth in cortex. Most PCs were already multiply innervated by CFs as early as 3 d. The multiple innervation culminated on P5, which rapidly regressed later on (Zhao et al., 1998; Miranda-Contreras et al., 1999). Our results demonstrate increased Purkinje cell death at P4-P6. Though the synaptic formation of climbing fibers from the inferior olive are still immature and confined in somatic regions (Altman and Bayer, 1997), strong immunostaining of glutamate receptor subunits 2 and 3 could be observed at postnatal days 1-3 within Purkinje cell bodies and primary dendrites (Bergmann et al., 1996; Hafidi and Hillman, 1997). At this stage of development, vesicular glutamate transporter is expressed in terminals around PC soma at P1-P10 (Miyazaki T et al., 2003). Because this transporter mainly mediates the filling of cytoplasmic glutamate into synaptic vesicles in terminals, its expression indicates that glutamate release at CF → PC synapses is functional from the molecular point of view, suggesting that polyinnervation of CFs during the first postnatal week could be glutamate stress to developing PCs. A certain extent of Purkinje cell death at this point in development appears to be essential for optimal cerebellar function. Although synaptic properties of Purkinje cells in Tg ORP150 mice appeared normal (Fig. 7), and the number of these neurons was increased (Fig. 4), cerebellar function was clearly suboptimal (Fig. 6). Thus, it is possible that the agility with which certain neuronal populations mount an ER stress response may have important implications for their vulnerability to a range of environmental perturbations. Consistent with this concept, mutations in the presenilin-1 gene, a cause of familial Alzheimer's disease, also renders neurons more sensitive to glutamate stress (Guo et al., 1999), probably via modification of the ER stress response (Katayama et al., 1999).
Figure 7.

CF innervation of Purkinje cells in ORP150 genetically manipulated mice. A, Sample traces of CF-EPSCs recorded from ORP150+/-, ORP150+/+, and Tg ORP150 Purkinje cells. CFs were stimulated in the granular layer at 0.2 Hz, holding the potential at -20 mV. Two or three traces are superimposed at threshold stimulus intensity. B, Summary histograms showing the number of discrete steps of CF-EPSCs for ORP150+/- (open columns; n = 45), ORP150+/+ (shaded columns; n = 91), and Tg ORP150 (filled columns; n = 46) Purkinje cells. There was no significant difference in the distributions for the three types of Purkinje cells (p < 0.05, χ2 test for independent samples).
We have demonstrated that expression of ORP150 in developing brain most likely serves a cytoprotective function in Purkinje cells. Levels of ORP150 induced during brain development are carefully balanced to allow the appropriate amount of Purkinje cell death but to preserve the necessary number of these cerebellar neurons for normal function. The subtle nature of the system was revealed by overexpression of the ORP150 transgene in Purkinje cells; the number of Purkinje cells increased in Tg ORP150 animals, but cerebellar function was suboptimal. These observations with ORP150 emphasize the importance of ER stress in the Purkinje cell response to ischemia and, most likely, a range of environmental perturbations. It is intriguing to speculate that the same mechanisms that may contribute to neuronal vulnerability to ischemia and excitotoxicity (and, potentially, other stresses), such as insufficient induction of ORP150 to uniformly prevent cell death in the larger population of neurons, may be carefully programmed to prevent excess cell survival during development, at which time such additional neurons would compromise brain function.
Footnotes
We thank F. Ichinoda (Department of Neuroanatomy, Kanazawa University Medical School) and K. Obata (Department of Internal Medicine, Hyogo College of Medicine) for expert technical support.
Correspondence should be addressed to Dr. Yasuko Kitao, Department of Neuroanatomy, Kanazawa University Medical School, 13-1 Takara-machi, Kanazawa City 920-8640, Ishikawa, Japan. E-mail: kitao@nanat.m.kanazawa-u.ac.jp.
Copyright © 2004 Society for Neuroscience 0270-6474/04/241486-11$15.00/0
References
- Aiba A, Kano M, Chen C, Stanto ME, Fox GD, Herrup K, Zwingman TA, Tonegawa S (1994) Deficient cerebellar long-term depression and impaired motor learning in mGluR1 mutant mice. Cell 79: 377-388. [PubMed] [Google Scholar]
- Altman J, Bayer SA (1997) An overview of the postnatal development of the rat cerebellum. In: Development of the cerebellar system (Altman J, Bayer SA, eds), pp 317-324. Boca Raton, FL: CRC.
- Baader SL, Sanlioglu S, Berrebi AS, Parker-Thornburg J, Oberdick J (1998) Ectopic overexpression of engrailed-2 in cerebellar Purkinje cells causes restricted cell loss and retarded external germinal layer development at lobule junctions. J Neurosci 18: 1763-1773. [DOI] [PMC free article] [PubMed] [Google Scholar]
- Bergmann M, Fox PA, Grabs D, Post A, Schilling K (1996) Expression and subcellular distribution of glutamate receptor subunits 2/3 in the developing cerebellar cortex. J Neurosci Res 43: 78-86. [DOI] [PubMed] [Google Scholar]
- Brorson JR, Manzolillo PA, Gibbons SJ, Miller RJ (1995) AMPA receptor desensitization predicts the selective vulnerability of cerebellar Purkinje cells to excitotoxicity. J Neurosci 15: 4515-4524. [DOI] [PMC free article] [PubMed] [Google Scholar]
- Calabrese V, Scapagnini G, Ravagna A, Giuffrida Stella AM, Butterfield DA (2002) Molecular chaperones and their roles in neural cell differentiation. Dev Neurosci 24: 1-13. [DOI] [PubMed] [Google Scholar]
- Chena Z, Ljunggrenb HG, Bogdanovica N, Nennesmoc I, Winblada B, Zhu J (2002) Excitotoxic neurodegeneration induced by intranasal administration of kainic acid in C57BL/6 mice. Brain Res 931: 135-145. [DOI] [PubMed] [Google Scholar]
- Clark HB, Orr HT (2000) Spinocerebellar ataxia type 1: modeling the pathogenesis of a polyglutamine neurodegenerative disorder in transgenic mice. Neuropathol Exp Neurol 59: 265-270. [DOI] [PubMed] [Google Scholar]
- Coyle JT, Puttfarchen P (1993) Oxidative stress, glutamate, and neurodegenerative disorders. Science 262: 689-695. [DOI] [PubMed] [Google Scholar]
- Craven RA, Egerton M, Stirling CJ (1996) A novel Hsp70 of the yeast ER lumen is required for the efficient translocation of a number of protein precursors. EMBO J 15: 2640-2650. [PMC free article] [PubMed] [Google Scholar]
- Crepel F, Delhaye-Bouchaud N, Dupont JL (1981) Fate of the multiple innervation of cerebellar Purkinje cells by climbing fibers in immature control, x-irradiated and hypothyroid rats. Brain Res 227: 59-71. [DOI] [PubMed] [Google Scholar]
- Dove LS, Nahm SS, Murchison D, Abbott LC, Griffith WH (2000) Altered calcium homeostasis in cerebellar Purkinje cells of leaner mutant mice. J Neurophysiol 84: 513-524. [DOI] [PubMed] [Google Scholar]
- Fan H, Favero M, Vogel MW (2001) Elimination of Bax expression in mice increases cerebellar Purkinje cell numbers but not the number of granule cells. J Comp Neurol 436: 82-91. [PubMed] [Google Scholar]
- Guo Q, Fu W, Sopher BL, Miller MW, Ware CB, Martin GM, Mattson MP (1999) Increased vulnerability of hippocampal neurons to excitotoxic necrosis in presenilin-1 mutant knock-in mice. Nat Med 5: 101-106. [DOI] [PubMed] [Google Scholar]
- Hafidi A, Hillman DE (1997) Distribution of glutamate receptors GluR 2/3 and NR1 in the developing rat cerebellum. Neuroscience 81: 427-436. [DOI] [PubMed] [Google Scholar]
- Hata R, Matsumoto M, Hatakeyama T, Ohtsuki T, Handa N, Niinobe M, Mikoshiba K, Sakaki S, Nishimura T, Yanagihara T, Kamada T (1993) Differential vulnerability in the hindbrain neurons and local cerebral blood flow during bilateral vertebral occlusion in gerbils. Neuroscience 56: 423-439. [DOI] [PubMed] [Google Scholar]
- Ito M (1984) The cerebellum and neural control. New York: Raven.
- Kakizawa S, Yamasaki M, Watanabe M, Kano M (2000) Critical period for activity-dependent synapse elimination in developing cerebellum. J Neurosci 20: 4954-4961. [DOI] [PMC free article] [PubMed] [Google Scholar]
- Kano M, Hashimoto K, Chen C, Abeliovich A, Aiba A, Kurihara H, Watanabe M, Inoue Y, Tonegawa S (1995) Impaired synapse elimination during cerebellar development in PKC gamma mutant mice. Cell 83: 1223-1231. [DOI] [PubMed] [Google Scholar]
- Kano M, Hashimoto K, Kurihara H, Watanabe M, Inoue Y, Aiba A, Tonegawa S (1997) Persistent multiple climbing fiber innervation of cerebellar Purkinje cells in mice lacking mGluR1. Neuron 18: 71-79. [DOI] [PubMed] [Google Scholar]
- Katayama T, Imaizumi K, Sato N, Miyoshi K, Kudo T, Hitomi J, Morihara T, Yoneda T, Gomi F, Mori Y, Nakano Y, Takeda J, Tsuda T, Itoyama Y, Murayama O, Takashima A, St. George-Hyslop P, Takeda M, Tohyama M (1999) Presenilin-1 mutations downregulate the signalling pathway of the unfolded-protein response. Nat Cell Biol 1: 479-485. [DOI] [PubMed] [Google Scholar]
- Kitao Y, Ozawa K, Miyazaki M, Tamatani M, Kobayashi T, Yanagi H, Okabe M, Ikawa M, Yamashima T, Tohyama M, Stern D, Hori O, Ogawa S (2001) Expression of 150 kda oxygen regulated protein (orp150), a molecular chaperone in the endoplasmic reticulum, rescues hippocampal neurons from glutamate toxicity. J Clin Invest 108: 1439-1450. [DOI] [PMC free article] [PubMed] [Google Scholar]
- Konnerth A, Llano I, Armstrong CM (1990) Synaptic currents in cerebellar Purkinje cells. Proc Natl Acad Sci USA 87: 2662-2665. [DOI] [PMC free article] [PubMed] [Google Scholar]
- Kuwabara K, Matsumoto M, Ikeda J, Hori O, Ogawa S, Maeda Y, Kitagawa K, Imuta N, Kinoshita K, Stern D, Yanagi H, Kamada T (1996) Purification and characterization of a novel stress protein, the 150-kDa oxygen-regulated protein (ORP150), from cultured rat astrocytes, and its expression in ischemic mouse brain. J Biol Chem 279: 5025-5032. [DOI] [PubMed] [Google Scholar]
- Lee MS, Kwon YT, Li M, Peng J, Friedlander RM, Tsai LH (2000) Neurotoxicity induces cleavage of p35 to p25 by calpain. Nature 405: 360-364. [DOI] [PubMed] [Google Scholar]
- Llano I, Marty A, Armstrong CM, Konnerth A (1991) Synaptic- and agonist-induced excitatory currents of Purkinje cells in rat cerebellar slice. J Physiol (Lond) 434: 183-213. [DOI] [PMC free article] [PubMed] [Google Scholar]
- Mariani J, Changeux JP (1981a) Ontogenesis of olivocerebellar relationships. I. Studies by intracellular recordings of the multiple innervation of Purkinje cells by climbing fibers in the developing rat cerebellum. J Neurosci 1: 696-702. [DOI] [PMC free article] [PubMed] [Google Scholar]
- Mariani J, Changeux JP (1981b) Ontogenesis of olivocerebellar relationships. II. Spontaneous activity of inferior olivary neurons and climbing fiber mediated activity of cerebellar Purkinje cells in developing rats. J Neurosci 1: 703-709. [DOI] [PMC free article] [PubMed] [Google Scholar]
- Migheli A, Attanasio A, Lee WH, Bayer SA, Ghetti B (1995) Detection of apoptosis in weaver cerebellum by electron microscopic in situ end-labeling of fragmented DNA. Neurosci Lett 199: 53-56. [DOI] [PubMed] [Google Scholar]
- Miranda-Contreras L, Benitez-Diaz PR, Mendoza-Briceno RV, Delgado-Saez MC, Palacios-Pru EL (1999) Levels of amino acid neurotransmitters during mouse cerebellar neurogenesis and in histotypic cerebellar cultures. Dev Neurosci 21: 147-158. [DOI] [PubMed] [Google Scholar]
- Miyazaki M, Ozawa K, Hori O, Kitao Y, Matsushita K, Ogawa S, Matsuyama T (2002) Expression of ORP150 (150 kDa oxygen regulated protein) in the hippocampus suppresses delayed neuronal cell death. J Cereb Blood Flow Metab 22: 979-987. [DOI] [PubMed] [Google Scholar]
- Miyazaki T, Fukaya M, Shimizu H, Watanabe M (2003) Subtype switching of vesicular glutamate transporters at parallel fiber-Purkinje cell synapses in developing mouse cerebellum. Eur J Neurosci 17: 2563-2572. [DOI] [PubMed] [Google Scholar]
- Nagai N, Hosokawa M, Itohara S, Adachi E, Matsushita T, Hosokawa N, Nagata K (2000) Embryonic lethality of molecular chaperone hsp47 knockout mice is associated with defects in collagen biosynthesis. J Cell Biol 150: 1499-1506. [DOI] [PMC free article] [PubMed] [Google Scholar]
- Netzeband JG, Trotter C, Caguioa JN, Gruol DL (1999) Chronic ethanol exposure enhances AMPA-elicited Ca2+ signals in the somatic and dendritic regions of cerebellar Purkinje neurons. Neurochem Int 35: 163-174. [DOI] [PubMed] [Google Scholar]
- Ogawa S, Gerlach H, Esposito C, Macaulay AP, Brett J, Stern D (1990) Hypoxia modulates the barrier and coagulant function of cultured bovine endothelium. J Clin Invest 85: 1090-1098. [DOI] [PMC free article] [PubMed] [Google Scholar]
- Ozawa K, Kuwabara K, Tamatani M, Yakatsuji K, Tsumakoto Y, Kaneda S, Yanagi H, Stern D, Ogawa S, Tohyama M (1999) ORP150 (150 kDa oxygen-regulated protein) suppresses hypoxia-induced apoptotic cell death. J Biol Chem 274: 6397-6404. [DOI] [PubMed] [Google Scholar]
- Ozawa K, Tsukamoto Y, Hori O, Kitao Y, Yanagi H, Stern D, Ogawa S (2001) Regulation of tumor angiogenesis by ORP150, an inducible endoplasmic reticulum chaperone. Cancer Res 61: 4206-4213. [PubMed] [Google Scholar]
- Patil C, Walter P (2001) Intracellular signaling from the endoplasmic reticulum to the nucleus: the unfolded protein response in yeast and mammals. Curr Opin Cell Biol 13: 349-355. [DOI] [PubMed] [Google Scholar]
- Sasahara M, Freis JW, Rains EW, Gown AM, Westrum LE, Frosch MP, Bonthron DT, Ross R, Collins T (1991) PDGF B-chain in neurons of the central nervous system, posterior pituitary, and in a transgenic model. Cell 64: 217-227. [DOI] [PubMed] [Google Scholar]
- Selimi F, Doughty M, Delhaye-Bouchaud N, Mariani J (2000) Target-related and intrinsic neuronal death in Lurcher mutant mice are both mediated by caspaea-3 activation. J Neurosci 20: 992-1000. [DOI] [PMC free article] [PubMed] [Google Scholar]
- Shahbazian MD, Orr HT, Zoghbi HY (2001) Reduction of Purkinje cell pathology in SCA1 transgenic mice by p53 deletion. Neurobiol Dis 8: 974-981. [DOI] [PubMed] [Google Scholar]
- Sieber FE, Palmon SC, Traystman RJ, Matrin LJ (1995) Global incomplete cerebral ischemia produces predominantly cortical neuronal injury. Stroke 26: 2091-2096. [DOI] [PubMed] [Google Scholar]
- Siesjoe BK (1988) Mechanisms of ischemic brain damage. Crit Care Med 16: 954-963. [DOI] [PubMed] [Google Scholar]
- Stacchiotti A, Schiaffonati L, Tiberio L, Rodella L, Bianchi R (1997) Constitutive expression of heat shock proteins 70 and 90 in rat cerebellum. Eur J Histochem 41: 127-132. [PubMed] [Google Scholar]
- Tamatani M, Matsuyama T, Yamaguchi A, Mitsuda N, Tsukamoto Y, Taniguchi T, Che YH, Ozawa K, Hori O, Nishimura H, Yamashita A, Okabe M, Yanagi H, Stern DM, Ogawa S, Tohyama M (2001) ORP150 protects against hypoxia/ischemia-induced neuronal death. Nat Med 7: 317-323. [DOI] [PubMed] [Google Scholar]
- Urano F, Wang X, Bertolotti A, Zhang Y, Chung P, Harding HP, Ron D (2000) Coupling of stress in the ER to activation of JNK protein kinases by transmembrane protein kinase IRE1. Science 287: 664-666. [DOI] [PubMed] [Google Scholar]
- Wang XZ, Lawson B, Brewer JW, Zinszner H, Sanjay A, Mi LJ, Boorstein R, Kreibich G, Hendershot LM, Ron D (1996) Signals from the stressed endoplasmic reticulum induce C/EBP-homologous protein (CHOP/GADD153). Mol Cell Biol 16: 4273-4280. [DOI] [PMC free article] [PubMed] [Google Scholar]
- Welsh JP, Yuen G, Placantonakis DG, Vu TQ, Haiss F, O'Hearn E, Molliver ME, Aicher SA (2002) Why do Purkinje cells die so easily after global brain ischemia? Aldolase C, EAAT4, and the cerebellar contribution to posthypoxic myoclonus. Adv Neurol 89: 331-359. [PubMed] [Google Scholar]
- Wynn RM, Davie JR, Cox RP, Chuang DT (1994) Molecular chaperones: heat-shock proteins, foldases, and matchmakers. J Lab Clin Med 124: 31-36. [PubMed] [Google Scholar]
- Yoshida M, Yamashima T, Zhao L, Tsuchiya K, Kohda Y, Tonchev AB, Matsuda M, Kominami E (2002) Primate neurons show different vulnerability to transient ischemia and response to cathepsin inhibition. Acta Neuropathol (Berl) 104: 267-272. [DOI] [PubMed] [Google Scholar]
- Yu Z, Luo H, Fu W, Mattson MP (1999) The endoplasmic reticulum stress-responsive protein GRP78 protects neurons against excitotoxicity and apoptosis: suppression of oxidative stress and stabilization of calcium homeostasis. Exp Neurol 155: 302-314. [DOI] [PubMed] [Google Scholar]
- Zanjani HS, Vogel MW, Delhaye-Bouchaud N, Martinou JC, Mariani J (1996) Increased cerebellar Purkinje cell numbers in mice overexpressing a human bcl-2 transgene. J Comp Neurol 374: 332-341. [DOI] [PubMed] [Google Scholar]
- Zhao HM, Wenthold RJ, Petralia RS (1998) Glutamate receptor targeting to synaptic populations on Purkinje cells is developmentally regulated. J Neurosci 18: 5517-5528. [DOI] [PMC free article] [PubMed] [Google Scholar]