Abstract
We examined the functional organization of the rat trigeminal nuclear complex and its developmental dynamics using a multiple-site optical recording technique. Brainstem preparations were dissected from embryonic day 12 (E12)-E16 rat embryos, and stimulation was applied individually to the three branches of the trigeminal nerve (V1-V3). The action potential activity of presynaptic fibers was detected from E13, and the glutamate-mediated postsynaptic response was significantly observed from E15 on. At E14, the evoked signals usually consisted of only the action potential-related fast component. However, when extracellular Mg2+ was removed, a significant dl-2-amino-5-phosphonovaleric acid-sensitive slow component appeared. These results suggest that postsynaptic function mediated by NMDA receptors is latently generated as early as E14. The response area of the three branches of the trigeminal nerve showed some functional somatotopic organization, with the ophthalmic (V1) nerve area medially located and the mandibular (V3) nerve area laterally located. The center of the trigeminal nuclear complex in which the activity of neurons and synaptic function was greatest shifted caudally with development, suggesting that the functional architecture of the trigeminal nuclear complex is not fixed but changes dynamically during embryogenesis. By electron microscopy, we could not observe clear correlations between functional data and morphological information; when we surveyed E16 preparations, we could not identify typical synaptic structures between the 1,1′-dioctyldecyl-3,3,3′,3′-tetramethylindocarbocyanine perchlorate-labeled trigeminal nerve terminals and the neurons in the trigeminal nuclear complex. This implies that postsynaptic function in the trigeminal nuclear complex is generated before the appearance of the morphological structure of conventional synapses.
Keywords: optical recording, voltage-sensitive dye, trigeminal nucleus, rat embryo, synapse formation, electron microscopy
Introduction
To understand the CNS, it is essential to know how sensory information from the periphery is processed within the CNS and how motor commands are outputted from the brain. We have been trying to answer these questions by using an ontogenetic approach and applying multiple-site optical recording techniques with voltage-sensitive dyes (for review, see Kamino, 1990; Momose-Sato et al., 2001, 2002).
Among the cranial nerves that carry sensory information to the CNS, the trigeminal somatosensory system is of special interest because of its precise somatotopic organization (Nord, 1967; Waite, 1984; Waite and Tracey, 1995). During neuronal network formation, the establishment, maturation, and refinement of synapses are controlled by activity-dependent processes that require intimate communication between presynaptic and postsynaptic elements (Goodman and Shatz, 1993; Katz and Shatz, 1996; Friauf and Lohmann, 1999; Sur and Leamey, 2001; Wong and Ghosh, 2002). Because the trigeminal system develops sequentially from the periphery to the cortex (Hicks and D'Amato, 1968; McAllister and Das, 1977; Altman and Bayer, 1982; Al-Ghoul and Miller, 1993a), it seems likely that activity in the brainstem nuclear complex influences subsequent development of the trigeminal system such as the thalamus and somatosensory cortex. It is therefore important to identify at what stage and in what patterns functional synapses are first expressed in the brainstem nuclear complex.
In the present study, we applied an optical recording technique to the embryonic rat brainstem and examined the early steps of functional organization of the trigeminal nuclear complex. Optical methods have several advantages over conventional electrophysiological techniques. First, it is possible to monitor changes in intracellular membrane potential in living systems that are inaccessible to microelectrodes. Second, electrical activity can be recorded simultaneously from many sites in the preparation, which enables the analysis of spatiotemporal patterns of a response (for review, see Cohen and Salzberg, 1978; Salzberg, 1983; Grinvald et al., 1988; Wu et al., 1998). We studied spatiotemporal patterns of the ophthalmic (V1), maxillary (V2), and mandibular (V3) nerve responses and revealed developmental organization and functional architecture (spatial patterns of activity) of the rat trigeminal nuclear complex. In addition, we performed an ultrastructural analysis of the trigeminal nuclear complex and found that postsynaptic responses can be observed before there is morphological evidence of conventional synapses.
Parts of this paper have been published previously in abstract form (Momose-Sato and Sato, 2003).
Materials and Methods
Preparations. Experiments were performed in accordance with the guidelines of Tokyo Medical and Dental University for the care and use of laboratory animals. All efforts were made to minimize the number of animals used and their suffering. For optical studies, Wistar rats at 12-16 d gestation [embryonic day 12 (E12)-E16; Saitama Experimental Animals Supply Co. Ltd., Saitama, Japan] were used. Successful data were obtained from 23 preparations (E12, n = 5; E13, n = 4; E14, n = 5; E15, n = 4; E16, n = 5). Females were caged with males in the evening and were checked for sperm positivity the next morning. This day was termed E0. Pregnant rats were anesthetized with ether, and fetuses were removed surgically. The embryos were decapitated, and the brainstems, with three branches of the trigeminal nerve, namely, the ophthalmic (V1), maxillary (V2), and mandibular (V3) nerves, were dissected from the embryos. The preparation was bathed in a solution of the following composition (in mm): 149 NaCl, 5.4 KCl, 1.8 CaCl2, 0.5 MgCl2, 10 glucose, and 10 Tris-HCl buffer, pH 7.4. In Mg 2+-free experiments, MgCl2 was replaced with CaCl2. The solution was equilibrated with oxygen. The pia mater was carefully removed in the bathing solution under a dissection microscope. After staining with a dye (see below), the preparation was attached to the silicone (KE 106LTV; Shin-etsu Chemical Co., Tokyo, Japan) bottom of a recording chamber with the ventral side up by pinning it with tungsten wires. The preparation was continuously perfused with Ringer's solution at a rate of 1.5 ml/min at 26-30°C except during the measurement period.
Voltage-sensitive dye staining. The preparation was stained by incubating it for 20 min in Ringer's solution containing a 0.2 mg/ml concentration of a voltage-sensitive merocyanine-rhodanine dye, NK2761 (Hayashibara Biochemical Laboratories Inc./Kankoh-Shikiso Kenkyusho, Okayama, Japan; Kamino et al., 1981; Momose-Sato et al., 1995). Excess (unbound) dye was washed away with dye-free Ringer's solution before recording. This merocyanine-rhodanine dye has been shown to be particularly useful for the study of embryonic nervous and cardiac tissues (Kamino, 1991; Momose-Sato et al., 1995).
Electrical stimulation. The cut end of each branch of the trigeminal nerve was drawn into a glass microsuction electrode. Positive (depolarizing) square current pulses (20-50 μA/1 msec for E12 and E13 preparations and 8 μA/5 msec for E14-E16 preparations), which evoked maximum responses, were applied to each branch at an interval of 10-15 min.
Optical recording. The methods used for multiple-site optical recording of electrical activity in embryonic brainstem preparations are described elsewhere (Momose-Sato et al., 1994; Sato et al., 1998; Momose-Sato et al., 2001). In brief, bright-field illumination was provided by a 300 W tungsten-halogen lamp (JC-24V-300W; Kondo-Philips Ltd., Tokyo, Japan) driven by a stable DC power supply. Incident light was made quasimonochromatic by an interference filter (703 ± 15 nm; Asahi Spectra Co., Tokyo, Japan) placed between the light source and the preparation, which was mounted on the stage of a microscope. A microscope objective (10×, S plan Apo, 0.4 numerical aperture) and a photographic eye piece (2.5×) formed a magnified (25×) real image of the preparation at the image plane. The transmitted light intensity at the image plane was detected using a multi-element silicon photodiode matrix array. We used two optical recording systems, which were constructed in our laboratory (for review, see Kamino, 1991; Momose-Sato et al., 2001). One was a 1020-site system with a 34 × 34-element silicon photodiode array (for details, see Hirota et al., 1995), and the other was a 144-site system using a 12 × 12-element silicon photodiode array. The time resolution of these systems was ∼1 msec (1024 frames/1000 msec in the 1020-site system and 1000 frames/1000 msec in the 144-site system). The interval between each recording (i.e., control, drug application, position change, and wavelength change) was 10-15 min, and incident light was turned off except during the measurement period. The recordings were made in single sweeps except where noted.
Electron microscopy. Two fetal (E16; n = 2) rats were used for electron microscopy. Animals were immersed in a fixative containing 5% paraformaldehyde and 4% glutaraldehyde in 0.1 m phosphate buffer, pH 7.4. The brains were removed from the skull, and a small crystal of 1,1′-dioctyldecyl-3,3,3′,3′-tetramethylindocarbocyanine perchlorate (DiI; Molecular Probes, Eugene, OR) was placed on the sectioned root of the left or right trigeminal nerve. Brains with DiI placements were stored for 4-5 weeks at 37°C in the fixative. After confirming labeling of the trigeminospinal tract under a dissection microscope, the brainstem was dissected out and cut into three or four blocks with a thickness of 200-400 μm in a transverse plane. The fluorescence of the labeled axons was photoconverted to a permanent electron-dense reaction product by excitation of the dye in diaminobenzidine (DAB) (von Bartheld et al., 1990). After three washes in Tris-HCl buffer, pH 7.6, blocks were preincubated for at least 2 hr in 1 mg/ml DAB solution in 0.05 m Tris buffer, pH 7.6, at 4°C in the dark. The preincubated blocks were mounted on glass slides, covered with fresh cold 1 mg/ml DAB solution, and illuminated for 1.5-2.5 hr until a dark DAB reaction product appeared in the DiI-labeled neurons. The DAB solution was replaced approximately every 15 min. The blocks were illuminated through a 10× objective lens using the rhodamine filter set (excitation, 510-560; dichroic, 575; emission, 590) of a fluorescence microscope (Eclipse E600; Nikon, Tokyo, Japan) equipped with a 100 W mercury lamp. The blocks were postfixed with Palade's osmium (Palade, 1952) and stained en bloc with 1% uranium acetate buffered to pH 6.0 with acetate veronal buffer overnight at room temperature. They were then dehydrated with several changes of ethanol gradient concentrations and embedded in Epon. Semithin sections were cut, stained with toluidine blue, and photographed using a Nikon Microphot-FXA microscope. Ultrathin sections were collected on collodion-coated 100 mesh/inch grids, stained with lead citrate (Reynolds, 1963), and examined using a Hitachi H-7100 transmission electron microscope.
Results
Optical signals evoked by trigeminal nerve stimulation
Figure 1 shows examples of optical recordings obtained from E14-E16 rat brainstem preparations in response to maxillary (V2) nerve stimulation. Simultaneous 1020-site optical recordings were made in a single sweep in four areas of the intact brainstem by moving the photodiode array over the image of the preparation. The recordings displayed in Figure 1 were reconstructed by combining four individual recordings.
Figure 1.
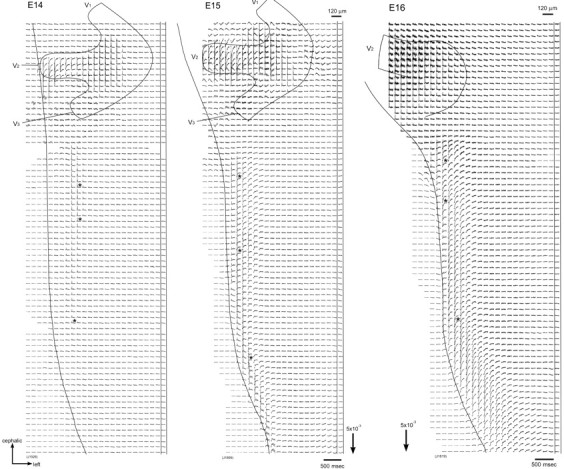
Multiple-site optical recordings of trigeminal responses. Multiple-site optical recordings of neural responses were made in intact preparations of E14-E16 embryonic rat brainstems. The optical signals were evoked by applying a brief positive square current pulse (8 μA/5 msec) to the right maxillary (V2) nerve with a microsuction electrode. The evoked optical signals were detected from the ventral side of the brainstem in a single sweep. The 1020-site simultaneous recordings were made in four different contiguous regions by sliding the photodiode array over the image of the preparation. The direction of the arrows at the bottom indicates an increase in transmitted light intensity (decrease in dye absorption), and the length of the arrows represents the stated value of the fractional change ΔI/I. The signals indicated by asterisks are enlarged in Figure 2.
When a positive (depolarizing) stimulating current (8 μA/5 msec), which gave the maximum response, was applied to the maxillary nerve, optical signals with a short latency (7-15 msec) were evoked in the lateral region of the brainstem. When a negative (hyperpolarizing) current pulse was applied, no optical signal was detected within the brainstem, although an electrotonic potential-related component was observed within the trigeminal ganglion (data not shown).
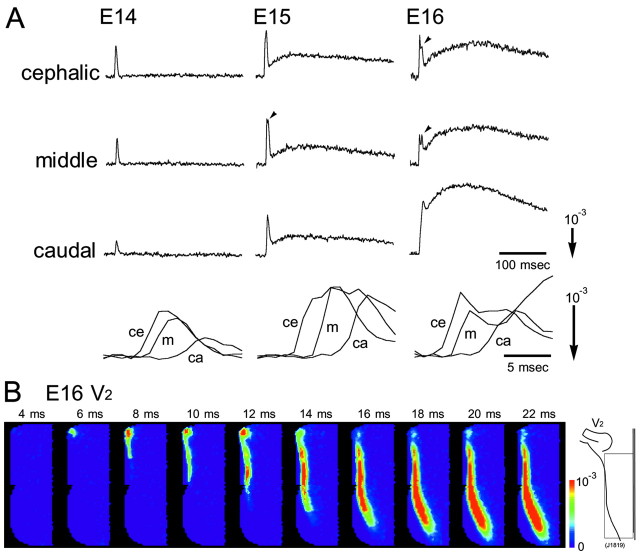
In Figure 2A, enlarged traces of the optical signals detected from three regions (cephalic, middle, and caudal) of the brainstem (Fig. 1, asterisks) are presented. In these recordings, we identified two components of the optical signal: a fast spike-like signal and a delayed long-lasting slow signal. In the E14 preparation, only the fast spike-like signal was detected from every location, whereas in the E15 and E16 preparations, signals consisting of fast and slow components were recorded. Slow signals in E16 preparations were usually larger than those in E15 preparations. In some preparations dissected from E15 and E16 embryos, a second spike-like signal was also detected from several locations as indicated in Figure 2A, arrowheads. The expanded time base of the fast signal (Fig. 2A, bottom) and pseudocolor images of the optical response (Fig. 2B) made clear that the optical signals were conducted from the cephalic region to the caudal region with a conduction velocity of ∼0.4 m/sec.
Figure 2.
Enlarged traces and color images of the optical signal. A, Top, Enlarged traces of the optical signals detected from three positions (cephalic, middle, and caudal regions) indicated by asterisks in Figure 1. Arrowheads show the second spike-like signal. Bottom, Expanded time base of the fast component. Signals detected from the three positions (ce, cephalic; m, middle; ca, caudal) are superimposed. The stimulation was applied 3 msec before the onset of the signal. B, Time-lapse imaging representations of the neural response evoked by maxillary (V2) nerve stimulation in an E16 preparation. Color images were constructed from optical signals detected from the area indicated by the square in the right inset using Neuroplex software (RedShirtImaging, Fairfield, CT). The numerals show the time after stimulation.
To examine the wavelength dependence of the evoked signal, we made similar measurements at 630 nm, at which the NK2761-dependent extrinsic absorption change is absent (Momose-Sato et al., 1995). At 630 nm, the evoked signals were mostly eliminated (data not shown). This wavelength dependence indicated that both fast and slow signals were voltage-dependent absorption changes in the dye, corresponding to membrane potential depolarization. In the recordings at 630 nm, small downward signals (an increase in transmitted light intensity) were sometimes observed in locations where the large signals were detected at 700 nm (data not shown). Such signals were not observed with hyperpolarizing pulses, suggesting that they correspond to a small fraction of intrinsic light-scattering changes, which may be attributable to volume changes (swelling) in neural cells accompanied by a large depolarization (Sato et al., 1997). In the mouse neurohypophysis, Salzberg et al. (1985) reported an increase in transparency correlated with neurosecretion. It is possible that neurotransmitter release from afferent nerve fibers also contributes to intrinsic optical signals in the embryonic brainstem.
Fast and slow components
Previously, we reported that trigeminal nerve stimulation in the embryonic chick brainstem evoked similar two-component signals in the region corresponding to the trigeminal nuclear complex, and that fast and slow responses reflected the action potential and glutamate-mediated postsynaptic response, respectively (Sato et al., 1999).
We examined the effects of the glutamate receptor antagonists dl-2-amino-5-phosphonovaleric acid (APV, an NMDA receptor antagonist) and 6-cyano-7-nitroquinoxaline-2,3-dione (CNQX, a non-NMDA receptor antagonist) on the evoked optical signal as seen in Figure 3. The preparation was dissected from an E16 embryo, and the maxillary (V2) nerve was stimulated. When we applied APV (200 μm; Fig. 3A) or CNQX (5 μm; Fig. 3B), the slow signals were partly reduced. The initial phase of the slow signal was much more sensitive to CNQX, whereas the later phase was reduced by APV. Slow signals were mostly inhibited with the application of both APV and CNQX (Fig. 3C) and Cd2+ (10 μm; data not shown). When we applied tetrodotoxin (2 μm), the fast spike-like signals were eliminated together with the slow signals (data not shown). This implies that the fast signal corresponds to the sodium-dependent action potential and that the slow signal reflects postsynaptic events including EPSPs and asynchronous postsynaptic firings. These results also suggest that synaptic transmission from the trigeminal nerve afferents is mediated by glutamate, and both NMDA and non-NMDA receptors are included.
Figure 3.
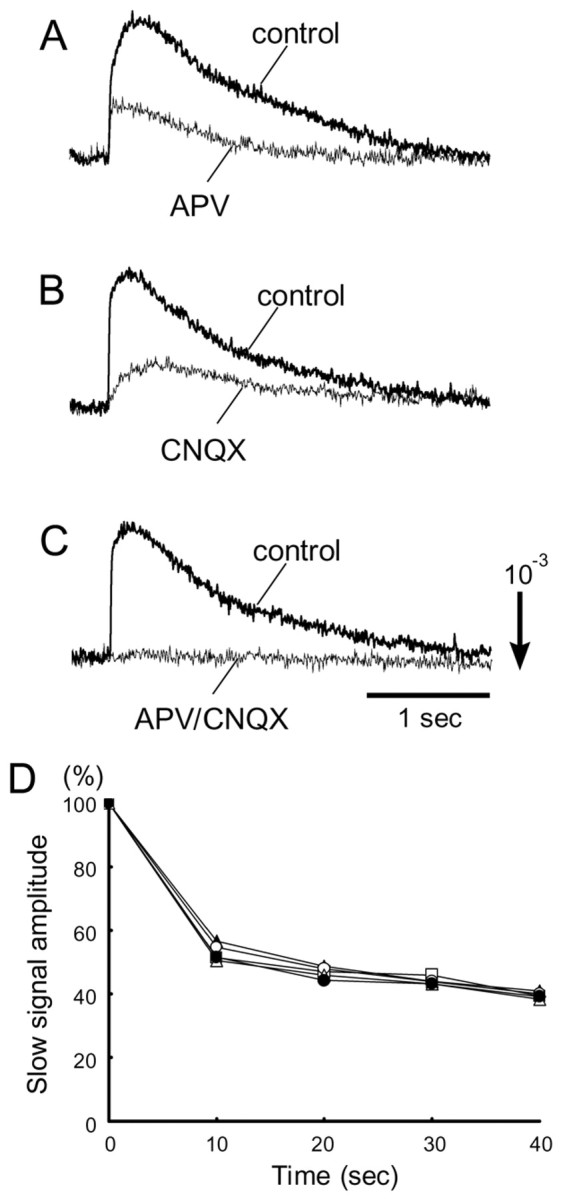
Effects of glutamate blockers and repetitive stimuli on the slow signal. A-C, Effects of APV and CNQX on the evoked optical signals. The data were obtained from E16 preparations with maxillary (V2) nerve stimulation. Thicker traces show controls, and thinner traces were obtained in APV (200 μm)-containing solution (A), CNQX (5 μm)-containing solution (B), and APV (190 μm)- and CNQX (5 μm)-containing solution (C). D, Decreasing slow signal amplitude with repetitive stimuli (0.1 Hz). The relative amplitudes of the slow signals in response to maxillary (V2) nerve stimulation are plotted against the time in seconds. Data were obtained from an E16 preparation. The different symbols correspond to different positions.
A study by Waite et al. (2000) demonstrated that GABAergic responses appeared at later stages and were maximal from E20 to postnatal day 1. They also reported that small postsynaptic responses mediated by neither glutamate nor GABA were present in many preparations. In the present experiment, postsynaptic responses detected from E15-E16 preparations were primarily inhibited by glutamate blockers, whereas other components were not significantly identified.
To examine the properties of the synaptic response, we studied the effect of repetitive stimuli on the slow optical signal. As shown in Figure 3D, the amplitude of the slow signals decreased gradually after applying repetitive stimuli (0.1 Hz). This decline seems to reflect synaptic fatigue, and it suggests that the slow signal is closely related to the postsynaptic response.
In experiments using blockers of synaptic transmission or experiments using repetitive stimuli, the fast optical signals were sometimes reduced in amplitude. This reduction was usually accompanied by elimination of the second spike-like signal. Assuming that the amplitude of the fast signal is the sum of presynaptic and postsynaptic spikes (Komuro et al., 1991; Momose-Sato et al., 1997; Sato et al., 1998), it is possible that the reduction in the fast signal amplitude is attributable to a reduction in postsynaptic firing resulting from a blockade of synaptic transmission.
Considering the nature of the fast and slow optical signals, it is reasonable to interpret that the optical response area shown in Figure 1 corresponds to the trigeminal sensory nuclear complex, which includes the principal nucleus and the spinal nucleus of the trigeminal nerve. In the rat brainstem, the principal nucleus and the subregions of the spinal nucleus (oralis, interpolaris, and caudalis) are aligned contiguously from the level of the trigeminal ganglion to the upper cervical spinal cord (Altman and Bayer, 1980, 1995; Waite and Tracey, 1995). In the recordings shown in Figure 1, optical signals were not identified in the region just caudal to the trigeminal ganglion. In the present experiment, the meningeal tissue surrounding the ganglion was not removed to keep the trigeminal root intact, and this might have resulted in difficulty in recording optical signals.
V1-V3 responses and their developmental changes
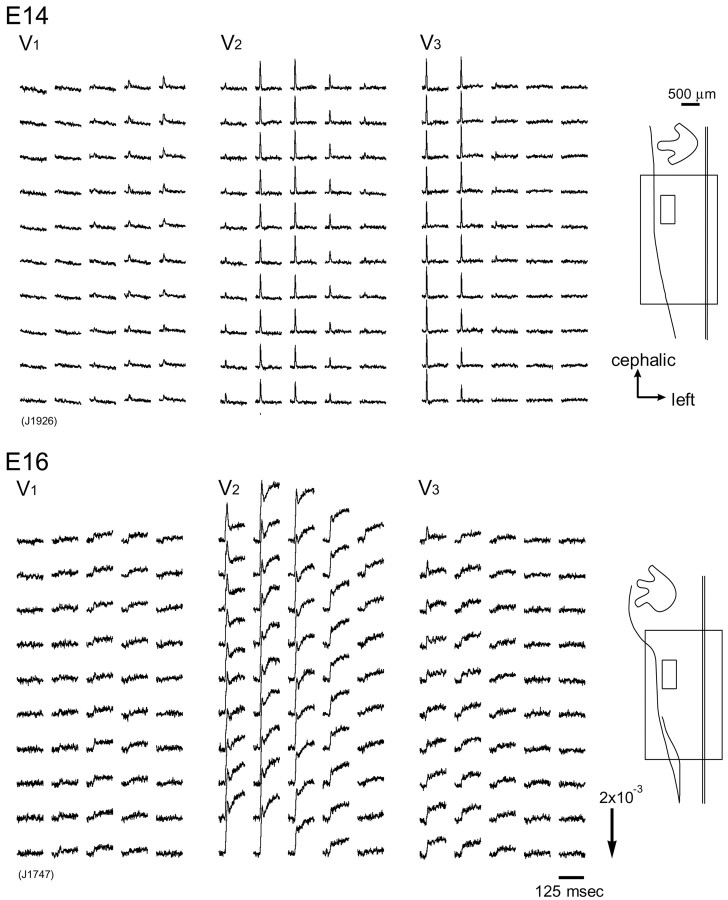
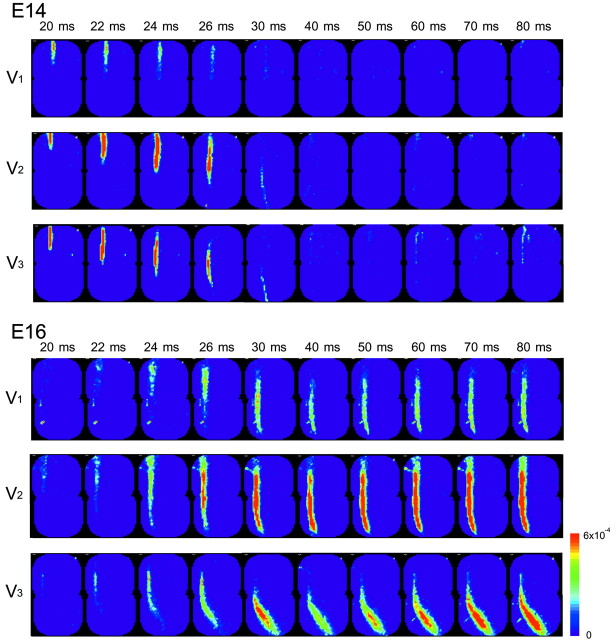
Next, we examined optical responses to stimulation of the three branches of the trigeminal nerve and compared their development and spatiotemporal patterns. Figure 4 shows examples of optical recordings obtained from an E14 (top) and E16 (bottom) brainstem preparation in response to individual stimulation of the ophthalmic (V1; left recordings), maxillary (V2; middle recordings), and mandibular (V3; right recordings) nerves. In each preparation, signals detected from the region indicated by the small squares in the right insets are presented. Spatiotemporal propagation patterns of signals in the entire region of the trigeminal nuclear complex (Fig. 4, large squares in insets) are also illustrated in Figure 5.
Figure 4.
Optical recordings of V1-V3 responses. Multiple-site optical recordings of neural responses to ophthalmic (V1), maxillary (V2), and mandibular (V3) nerve stimulation were made in E14 (top) and E16 (bottom) brainstem preparations. Optical signals detected from the area indicated by the small squares in the right insets are presented.
Figure 5.
Spatiotemporal activity maps of V1-V3 responses. Time-lapse imaging representations of the neural responses in E14 (top) and E16 (bottom) preparations are shown. V1, V2, and V3 correspond to the images in response to ophthalmic, maxillary, and mandibular nerve stimulation, respectively. Color images were constructed from optical signals detected from the area indicated by the large squares in the insets of Figure 4.
When the three branches of the trigeminal nerve were stimulated, optical signals with similar waveforms were obtained. In the E14 preparation, the signals exhibited a simple spike-like shape, and in the E16 preparation, fast and slow components were identified. The amplitude of the optical signals was usually larger in the maxillary (V2) nerve than in the ophthalmic (V1) and mandibular (V3) nerves (also see Fig. 6). Characteristics of fast and slow signals evoked by three-nerve stimulation were basically the same, with the fast signal corresponding to the action potential and the slow signal reflecting the glutamate-mediated postsynaptic response.
Figure 6.
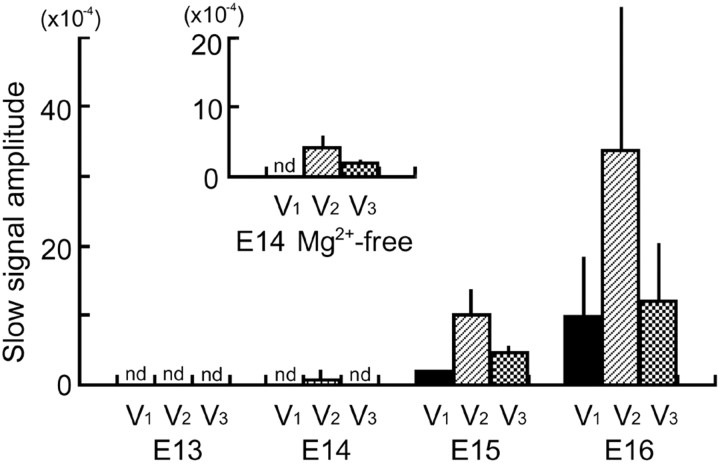
Developmental changes in the slow signal amplitude. The amplitude of the slow optical signals (mean ± SD) in response to ophthalmic (V1), maxillary (V2), and mandibular (V3) nerve stimulation is shown. The inset shows the amplitude of the slow signals detected from E14 preparations in Mg 2+-free solution. The slow signal was considered positive when the signal amplitude was >1.5 × 10 -4 (signal-to-noise ratio ≤ 2 in the 2-averaged recording). nd, Not detected in all tested preparations.
To trace developmental expression of the presynaptic and postsynaptic activities in the three nerve pathways, we examined at what stages fast and slow optical signals were detected with each nerve stimulation (Fig. 6). The action potential-related fast optical signal was recorded from the region corresponding to the trigeminal tract from E13 for every nerve (V1-V3) stimulation. At E14, each nerve stimulation produced only the fast response in most preparations (n = 4), as shown in Figures 1, 2, and 4. However, in one E14 preparation, small but significant [change in the light intensity divided by DC background intensity (ΔI/I) = 3.0 × 10⁻⁴] slow signals were detected together with the fast signal when the maxillary (V2) nerve was stimulated. Examples of positive slow signals in the E14 preparation are shown in Figure 7A, top left traces (V2, control). At E15 and E16, slow signals were detected from all tested preparations (n = 4 at E15 and 5 at E16) with every nerve stimulation. The amplitude of the slow signal gradually increased as development proceeded (Fig. 6).
Figure 7.
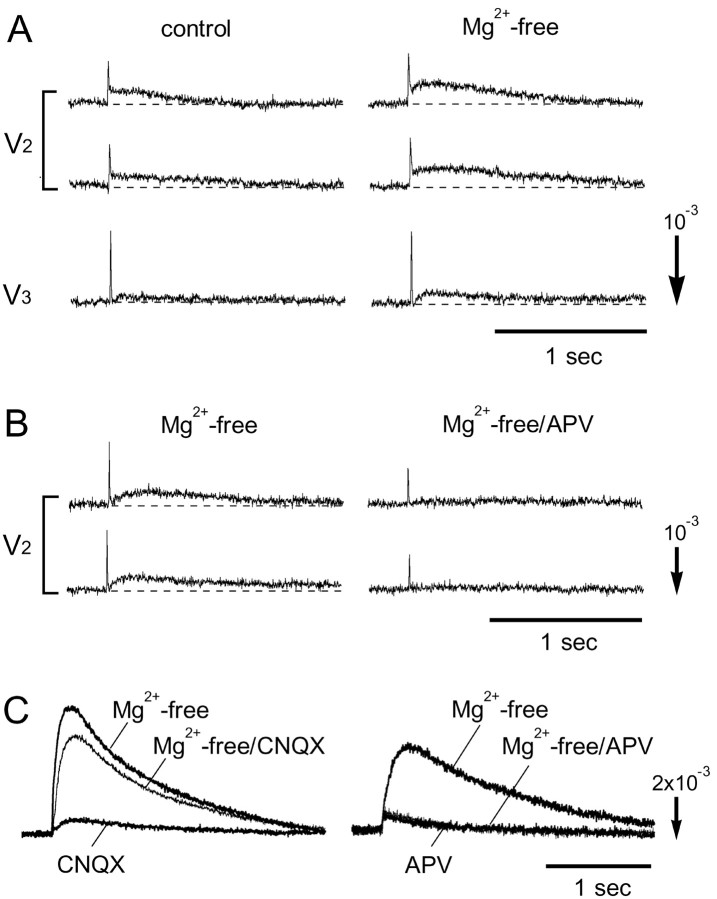
Effects of Mg 2+-free solution. A, Appearance of the slow signal in Mg 2+-free solution in an E14 preparation. The signals were obtained in response to maxillary (V2) and mandibular (V3) nerve stimulation. Two trials were averaged. B, Slow signals appearing in Mg 2+-free solution (left) were eliminated in the presence of APV (200 μm; right). Data were obtained from an E14 preparation in response to maxillary (V2) nerve stimulation. C, Optical signals detected from an E16 preparation. The signals were recorded in Mg 2+-free solution, CNQX (5 μm; left)- or APV (200 μm; right)-containing Mg 2+-free solution, and CNQX (5 μm; left)- or APV (200 μm; right)-containing Ringer's solution.
In the embryonic chick and rat nucleus of the tractus solitarius, it was reported that removal of Mg2+ from the bathing solution resulted in the appearance of an NMDA receptor-mediated postsynaptic response that was not significant in normal Ringer's solution (Momose-Sato et al., 1994; Sato et al., 1998). Thus, we examined the effects of Mg2+-free solution on the E14 preparation. Figure 7A shows examples of optical signals obtained from an E14 preparation in normal (left traces) and Mg2+-free (right traces) solutions. In this preparation, maxillary (V2) nerve stimulation evoked small slow signals in normal Ringer's solution, but postsynaptic responses were not significant (ΔI/I <1.5 × 10⁻⁴) with the ophthalmic (V1) and mandibular (V3) nerves. When we replaced extracellular Mg2+ with Ca2+ (right traces), slow signals induced by maxillary (V2) nerve stimulation were markedly enhanced. In addition, a small slow component appeared with mandibular (V3) nerve stimulation (also see Fig. 6, inset).
Concerning the ophthalmic (V1) nerve, we could not identify significant slow signals in E14 preparations either in normal or Mg2+-free solution (n = 3). This result might be interpreted as indicating that the time course of functional synaptogenesis is not the same for the three nerve pathways. However, because the ophthalmic (V1) nerve responses were extremely small compared with other nerves (Fig. 6), and the sensitivity of the measuring technique is dependent on the signal-to-noise ratio, it was difficult to make a definite conclusion concerning the difference in the time course of synaptogenesis. Unfortunately, because the slow signal in early embryonic preparations was easily fatigued (Fig. 3D), we could not average many trials to further improve the signal-to-noise ratio.
In the Mg2+-free experiment, it is possible that magnesium affects not only NMDA receptors but also transmitter release in being competitive to calcium (Katz and Miledi, 1969) and the excitability of neurons attributable to a reduction in the action potential threshold (Frankenhaeuser and Hodgkin, 1957). Thus, we examined the effects of APV and CNQX on Mg2+ sensitivity. Slow signals that were induced in the E14 preparation in Mg2+-free solution were specifically blocked in the presence of APV (Fig. 7B). Furthermore, in the E16 preparation, the slow signal was markedly enhanced in Mg2+-free solution in the presence of CNQX (Fig. 7C, left) but was not changed significantly in the presence of APV (Fig. 7C, right).
These results suggest that by the E14 embryonic stage, postsynaptic function mediated by NMDA receptors is potentially generated within the trigeminal nuclear complex, although it is mostly suppressed by external Mg2+ in normal bathing solution.
Spatial distribution patterns of the V1-V3 responses
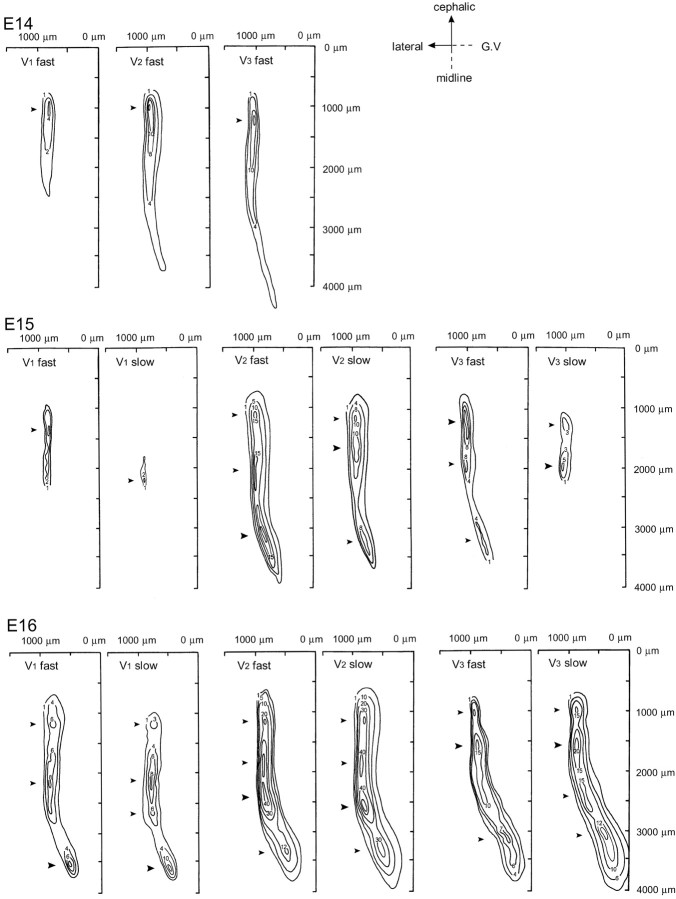
In Figures 4 and 5, we noted that there was a difference in the spatial distribution patterns between the three nerve responses. In Figure 4, the ophthalmic (V1) nerve response was detected from the medial region, whereas the mandibular (V3) nerve response was observed in the lateral region. Using the optical technique for monitoring membrane potential changes, the linearity of the optical signal with changes in membrane potential has been established (Cohen and Salzberg, 1978). It is also assumed that the fractional signal size is proportional to the magnitude of the membrane potential changes in each cell and process as well as the number and membrane area of activated neural elements within the field detected optically by one photodiode under conditions in which the amount of dye bound to the membrane is uniform (Salzberg et al., 1977; Obaid et al., 1985; Orbach et al., 1985; Kamino et al., 1989). To reveal the functional organization of the three nerve areas, we constructed contour line maps of the three nerve responses in E14-E16 preparations (Fig. 8).
Figure 8.
Contour line maps of V1-V3 responses. Spatial distribution patterns of the optical signals detected from E14 (top), E15 (middle), and E16 (bottom) preparations are shown. The numerals on the contour line indicate the fractional changes multiplied by 10 4. The y-axes correspond to the midline of the preparation, and the x-axes correspond to the level of the trigeminal ganglion. The root of the trigeminal nerve is positioned caudal to the x-axes. Arrowheads indicate peak locations. The large arrowheads show the largest peaks.
Figure 8 shows typical examples of maps obtained from E14-E16 preparations. The maps were constructed for fast (reflecting the presynaptic action potential; left maps) and slow (reflecting the postsynaptic response; right maps) optical signals. In Figure 8, the following features were depicted: (1) The contour line maps of the E14 preparation (Fig. 8, top) represented a single peak pattern with large optical signals distributed in the rostral region. (2) In the E15 and E16 contour line maps (Fig. 8, middle, bottom), the signals were inhomogenously distributed, and several peak locations were distinguished along with a rostrocaudal axis (arrowheads). One possibility is that these peak locations correspond to the subregions of the trigeminal nuclear complex. If this is the case, the result suggests that these subregions of the trigeminal nuclear complex are functionally differentiated by these developmental stages. (3) At E15, large responses were concentrated in the rostral area. As development proceeded to E16, large signals became detectable from the caudal region.
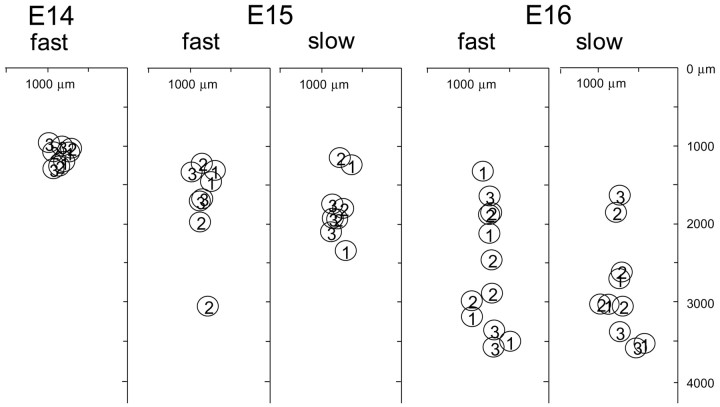
We plotted the location of the largest signal peak identified in each contour line map in Figure 9, which was constructed by superimposing data obtained from three or four preparations for each developmental stage. In Figure 9, the peak response area shifted caudally as development proceeded. In E14-E16 preparations, the region corresponding to the trigeminal nuclear complex was almost homogeneously stained, and no clear difference was observed in dye affinity between the rostral and caudal regions. This implies that the altered distribution of optical signals is not simply attributable to an altered pattern of dye affinity but reflects the change in the functional architecture of the trigeminal nuclear complex. Considering that the amplitude of the optical signal is proportional to a weighted average of the potential change and the membrane area imaged onto each detector (Salzberg et al., 1977; Obaid et al., 1985; Orbach et al., 1985; Kamino et al., 1989), the results shown in Figure 9 suggest that the center of the trigeminal nuclear complex in which the synaptic activity, number of neurons and functional synapses, or both are highest shifts caudally with development.
Figure 9.
Developmental changes in the peak response area. The largest peak locations identified in each contour line map are plotted for stages E14-E16. Peaks 1-3 correspond to ophthalmic (V1), maxillary (V2), and mandibular (V3) nerve responses, respectively. Data obtained from three (E14, E15) or four (E16) preparations are superimposed.
To examine whether somatotopic organization is observed in the embryonic brainstem, we compared the relative locations of the three nerve areas by superimposing the outlines of the contour line maps in the same preparation (Fig. 10). Comparison of the three nerve areas revealed that at E13-E15, the ophthalmic (V1) nerve area is located in the mediorostral region, whereas the mandibular (V3) nerve area is located separately in the lateral region. The maxillary (V2) nerve area appeared to be positioned in an intermediate region. Despite overlapping each other, mediolateral alignment of the three nerve areas is in accordance with the morphological observations of spatially ordered ingrowth of afferent nerve fibers at early developmental stages (Altman and Bayer, 1982; Erzurumlu and Killackey, 1983; Erzurumlu and Jhaveri, 1992). These results suggest that there is some functional somatotopic organization of the trigeminal nuclear complex at the onset of nucleus formation.
Figure 10.
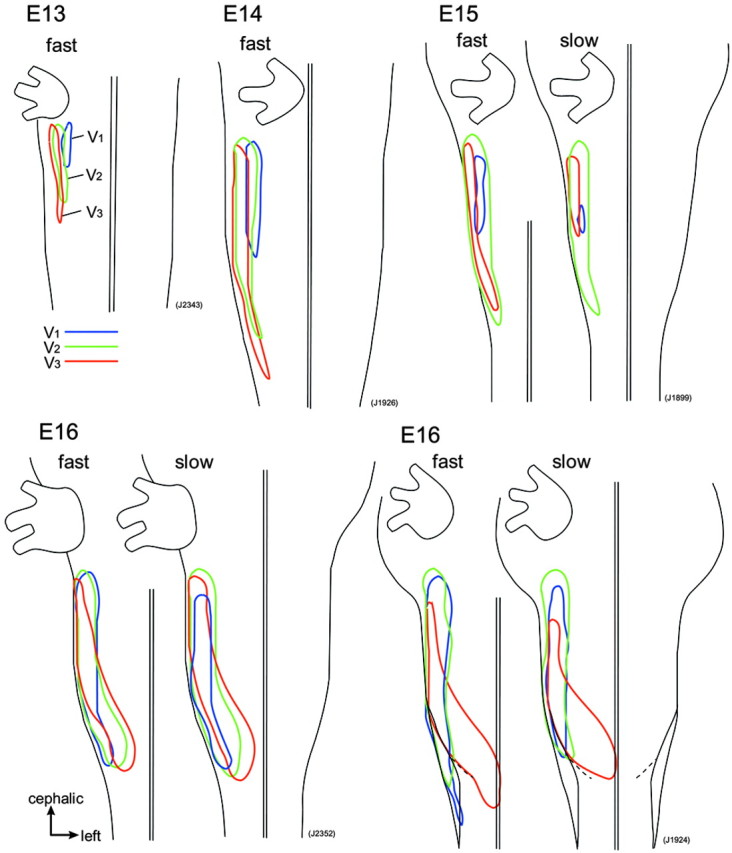
Comparison of V1-V3 response areas The relative locations of the areas in which fast and slow signals were evoked in response to ophthalmic (V1; blue lines), maxillary (V2; green lines), and mandibular (V3; red lines) nerve stimulation are superimposed.
Concerning the result that the response area, especially that of the maxillary (V2) nerve, primarily overlapped with other areas, one interpretation is that somatotopic representation of the trigeminal inputs is not strictly defined in the early embryonic brainstem, and projection areas of the three branches of the trigeminal nerve functionally overlap. Another possibility is that the response area determined by optical mapping was overestimated compared with the real area because of light scattering in the preparation, which blurs the signals detected by each diode element and limits the spatial resolution (Orbach and Cohen, 1983; London et al., 1987).
As development proceeded to E16, the mediolateral alignment of the three nerve areas changed. Although the mandibular (V3) nerve area was still laterally deviated in the rostral region, it was located medially in the caudal region. At ∼E15, the rat brainstem is morphologically transformed from a flat, thin tissue to a thick, three-dimensional structure, which leads to movement of the lateral brainstem dorsally. The change in the relative locations of the three nerve areas at E16 seems to be related to such a morphological transformation.
Ultrastructural analysis
To obtain morphological information concerning the structure of the terminals of the trigeminal nerve during early developmental stages, an ultrastructural analysis was performed on DiI-photoconverted material. Placement of DiI crystals on the sectioned root of the trigeminal nerve led to anterograde labeling of the trigeminal tract and trigeminal nuclear complex (Fig. 11A). Photoconverted trigeminal nerves and terminal-like swellings were identified by the DAB reaction product that appeared as dark brown staining in the light microscope (Fig. 11B, arrows) and as electron-dense precipitates in the electron microscope (Fig. 11C,D, arrows). In all specimens, many labeled axons were recognized in the trigeminal tract (Fig. 11C) and the trigeminal nuclear complex (Fig. 11D) on the side of the DiI application. Some of the labeled axons in the trigeminal nuclear complex were located close to or adjacent to cell bodies of neurons (Fig. 11D, arrows). As far as we surveyed, typical synaptic structures could not be detected for DiI-labeled axons and terminals, although synapses with typical synaptic structures but no labels were unequivocally found in the trigeminal tract and the trigeminal nuclear complex. We could not identify the origin of the unlabeled synapses. The trigeminal sensory neurons are known to receive several inputs other than primary afferent fibers, including intranuclear projections (Waite and Tracey, 1995) and ascending projections from the spinal cord (Torvik, 1956). We suggest that these projections are possible candidates for the synapses with no labels.
Figure 11.
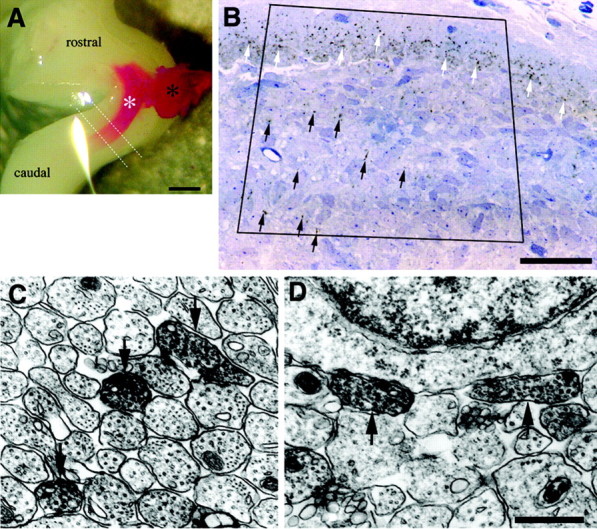
Ultrastructure of the trigeminal nerve terminals A, E16 rat brainstem before photoconversion. The DiI-labeled root of the right trigeminal nerve (black asterisk) and trigeminal tract (white asterisk) were observed as a red band. A block was removed from the brainstem between the two white dotted lines and examined by an electron micrographic study. Scale bar, 500 μm. B, Distribution of DiI-labeled trigeminal afferent fibers in the trigeminal tract (white arrows) and trigeminal nuclear complex (black arrows) on E16. A horizontal section was prepared between the two dotted lines of the brainstem, as indicated in A, and was counterstained by toluidine blue. The DiI labels were photoconverted and observed as dark brown dots. The region in the square frame was investigated by electron microscopy. Scale bar, 500 μm. C, D, Electron micrographs of DiI-labeled trigeminal axons after photoconversion. Arrows point to labeled axons in the trigeminal tract (C) and trigeminal nuclear complex (D). Scale bar, 500 nm.
Discussion
The multiple-site optical recordings obtained revealed several features of the rat trigeminal nuclear complex that have not been previously addressed. These include spatiotemporal patterns of the presynaptic and postsynaptic responses, relative contributions of the three branches of the trigeminal nerve to sensory information transfer, early generation of postsynaptic function, as early as E14, and functional architecture of the trigeminal nuclear complex and its developmental dynamics.
Development of presynaptic and postsynaptic function
We identified optical signals in a restricted region of the lateral brainstem in response to trigeminal nerve stimulation. The evoked optical signals consisted of fast spike-like and slow components, which reflected the presynaptic action potential and postsynaptic response, respectively.
The action potential activity of presynaptic fibers was observed in the region corresponding to the trigeminal tract from E13. This stage corresponds to the age when central afferents of the trigeminal nerve begin to grow into the trigeminal tract (Erzurumlu and Jhaveri, 1992; Waite et al., 2000; Miyahara et al., 2003). Our results indicate that sensory neurons are already excitable when they send growing fibers to the brainstem.
In normal Ringer's solution, slow optical signals related to postsynaptic activity were detected unambiguously from E15 with stimulation of every branch of the trigeminal nerve (V1-V3). This result is in accordance with a pioneering study by Waite et al. (2000) in which the ontogenesis of functional synaptic transmission in the rat trigeminal nuclear complex was assessed by recording electrical activity from the brainstem surface with a single suction electrode. Properties of the slow optical signal (i.e., waveform, slow time course, rapid fatigue, and pharmacological characteristics) were similar to those of the postsynaptic potentials detected from the chick trigeminal nuclear complex (Sato et al., 1999). A major difference between the rat and chick is the relative contribution of the three branches of the trigeminal nerve to postsynaptic responses. In the rat, maxillary nerve responses are markedly larger than those of other nerves, whereas in the chick, ophthalmic responses are the largest. This suggests a difference in somatosensory information processing between birds and mammals. In the rat, the maxillary nerve pathway carries sensory information from the vibrissas and seems to be the most important.
The present study demonstrated that postsynaptic function mediated by NMDA receptors is latently generated within the trigeminal nuclear complex as early as E14. This stage is before the age when production (E11-E15) and migration (E14-E17) of principal and spinal trigeminal neurons has been completed (Nornes and Morita, 1979; Altman and Bayer, 1980, 1982; Miller and Muller, 1989; Al-Ghoul and Miller, 1993a) and also before the ingrowth of primary afferent collaterals into the nucleus (E15; Waite et al., 2000). Using electron microscopy, we could not identify typical synaptic structures between DiI-labeled trigeminal nerve terminals and neurons in the trigeminal nuclear complex as far as we surveyed in E16 preparations. Al-Ghoul and Miller (1993b) reported that anti-synapsin I immunoreactivity (synaptic boutons) did not appear in the trigeminal tract and the principal sensory nucleus until E17 and E19 (given as E18 and E20 in their staging), respectively. These observations imply that postsynaptic function in the trigeminal nuclear complex is generated well before the appearance of the morphological structure of conventional synapses. The discrepancy between morphological and functional observations suggests that communication between presynaptic and postsynaptic neurons at very early stages is not mediated by a typical “synapse.” In developing neuromuscular junctions in culture obtained from Xenopus embryos, it was also reported that end plate potentials can be recorded from immature neuromuscular synapses with no presynaptic specializations such as active zones (Takahashi et al., 1987). At present, the precise mechanism of functional presynaptic and postsynaptic neuronal communication is unknown. Possible mechanisms are transmitter release from the growth cone (Hume et al., 1983), axonal and dendritic filopodial communication, and morphologically unspecialized functional presynaptic and postsynaptic contact (Cohen-Cory, 2002). In the present experiment, the postsynaptic responses appeared to be detected from a wide region outside the central trigeminal tract even at the stage with no significant axon collateral arborization present (Waite et al., 2000). Although we cannot exclude the possibility that the response areas determined by optical mapping were overestimated because of inherent technical difficulties (see Results), this profile suggests that other mechanisms such as the paracrine mode of intercellular communication, which is observed in the hippocampal neurons before synapse formation (Demarque et al., 2002), might also be included.
In developmental processes of synaptic network formation, it was recognized that neuronal activity influences several events, including cell survival, dendritic and axonal growth, refinement of synaptic connections, and fine tuning of functional maps (Goodman and Shatz, 1993; Katz and Shatz, 1996; Friauf and Lohmann, 1999; Sur and Leamey, 2001; Wong and Ghosh, 2002). In the rodent trigeminal system, NMDA receptors are known to play a fundamental role in activity-dependent stabilization and refinement of synaptic connections during development of the trigeminal system (Schlaggar et al., 1993; Li et al., 1994; Iwasato et al., 1997). Although the experimental condition used in the present study might have been different from the milieu in vivo, the results suggest the possibility that NMDA receptor function appears, although strongly suppressed, in the rat trigeminal nuclear complex at an earlier developmental stage than previously anticipated (Waite et al., 2000).
Developmental organization of the trigeminal nuclear complex
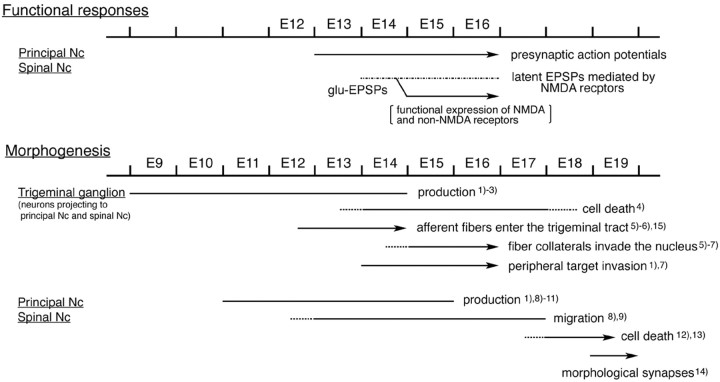
In conjunction with data obtained by optical recording and those of morphological and histochemical studies (Fig. 12), we suggest the developmental organization of the rat trigeminal nuclear complex is as follows: (1) Trigeminal ganglion cells are produced during E9-E14 with a peak at E12. Ganglion cell processes are spatially ordered as they extend their processes to peripheral and central targets at E12 (Erzurumlu and Jhaveri, 1992). (2) Afferent nerve fibers grow into the brainstem at E13 in a somatotopic manner. At this time, sensory neurons are already excitable. (3) Afferent nerves make functional contacts with second-order neurons in the trigeminal nuclear complex as early as E14, before the production and migration of target neurons has been completed. At this stage, postsynaptic function, which is mediated by glutamate, is mostly suppressed in normal physiological solutions and is expressed when the Mg2+ block on NMDA receptors is removed. (4) From E15, significant postsynaptic activity is observed, with stimulation of every branch of the trigeminal nerve. Functional synaptic connections are dense in the rostral region of the trigeminal nuclear complex and appear to be established in a somatotopic manner. (5) As development proceeds to E16, functional synapses increase, and the region of highest postsynaptic activity shifts caudally. (6) In parallel with a developmental increase in functional synaptic connections, cell death occurs in the trigeminal ganglion. This process retracts some axons that innervate the trigeminal nuclear complex and affects somatotopic representation, including a whisker-related pattern formation in the trigeminal nuclear complex (Henderson et al., 1994). (7) Cell death of second-order neurons occurs beginning at E17 and E18 in both the principal and spinal nuclei (Ashwell and Waite, 1991; Miller and Al-Ghoul, 1993). This process would also affect and possibly mediate the functional organization of synaptic connections in the trigeminal nuclear complex.
Figure 12.
Summary of developmental organization of the rat trigeminal nuclear complex. Functional events are compared with morphogenesis. The embryonic age refers to the first 24 hr after mating, which is designated E0. 1, From Altman and Bayer (1982); 2, from Forbes and Welt (1981); 3, from Rhoades et al. (1991); 4, from Henderson et al. (1994); 5, from Waite et al. (2000); 6, from Erzurumlu and Jhaveri (1992); 7, from Erzurumlu and Killackey (1983); 8, from Altman and Bayer (1980); 9, from Al-Ghoul and Miller (1993a); 10, from Nornes and Morita (1979); 11, from Miller and Muller (1989); 12, from Ashwell and Waite (1991); 13, from Miller and Al-Ghoul (1993); 14, from Al-Ghoul and Miller (1993b); 15, from Miyahara et al. (2003). Nc, Nucleus.
Within the trigeminal pathway, a sequential order of development from the periphery to the cortex has been proposed (Hicks and D'Amato, 1968; McAllister and Das, 1977; Altman and Bayer, 1982; Al-Ghoul and Miller, 1993a), with the unique somatotopic pattern appearing successively later along the pathway (Belford and Killackey, 1979; Killackey and Belford, 1979; Chiaia et al., 1992; Erzurumlu and Jhaveri, 1992; Al-Ghoul and Miller, 1993b; Waite and Tracey, 1995). Functional mapping of the optical signals demonstrated that some somatotopic arrangements of presynaptic and postsynaptic neurons were observed in the brainstem nuclear complex from the beginning of nuclear organization. Early expressed activity and its pattern in the brainstem nuclear complex might influence subsequent development and pattern formation in the higher trigeminal system, such as the thalamus and somatosensory cortex.
Footnotes
This work was supported by grants from the Mombu-Kagaku-sho of Japan, Shimadzu Foundation, Uehara Memorial Life Science Foundation, Takeda Science Foundation, Inamori Foundation, and Brain Science Foundation. We thank Dr. Kohtaro Kamino for encouragement throughout the course of our work.
Correspondence should be addressed to Yoko Momose-Sato, Department of Physiology, Tokyo Medical and Dental University, Graduate School and Faculty of Medicine, 1-5-45 Yushima, Bunkyo-ku, Tokyo 113-8519, Japan. E-mail: yoko.phy2@tmd.ac.jp.
Copyright © 2004 Society for Neuroscience 0270-6474/04/241366-11$15.00/0
References
- Al-Ghoul WM, Miller MW (1993a) Orderly migration of neurons to the principal sensory nucleus of the trigeminal nerve of the rat. J Comp Neurol 330: 464-475. [DOI] [PubMed] [Google Scholar]
- Al-Ghoul WM, Miller MW (1993b) Development of the principal sensory nucleus of the trigeminal nerve of the rat and evidence of a transient synaptic field in the trigeminal sensory tract. J Comp Neurol 330: 476-490. [DOI] [PubMed] [Google Scholar]
- Altman J, Bayer SA (1980) Development of the brain stem in the rat. IV. Thymidine-radiographic study of the time of origin of neurons in the pontine region. J Comp Neurol 194: 905-929. [DOI] [PubMed] [Google Scholar]
- Altman J, Bayer SA (1982) Development of the cranial nerve ganglia and related nuclei in the rat. Berlin: Springer. [DOI] [PubMed]
- Altman J, Bayer SA (1995) Atlas of prenatal rat brain development. Boca Raton, FL: CRC.
- Ashwell KWS, Waite PME (1991) Cell death in the developing trigeminal nuclear complex of the rat. Dev Brain Res 63: 291-295. [DOI] [PubMed] [Google Scholar]
- Belford GR, Killackey HP (1979) The development of vibrissae representation in subcortical trigeminal centers of the neonatal rat. J Comp Neurol 188: 63-74. [DOI] [PubMed] [Google Scholar]
- Chiaia NL, Bennett-Clarke CA, Eck M, White FA, Crissman RS, Rhoades RW (1992) Evidence for prenatal competition among the central arbors of trigeminal primary afferent neurons. J Neurosci 12: 62-76. [DOI] [PMC free article] [PubMed] [Google Scholar]
- Cohen LB, Salzberg BM (1978) Optical measurement of membrane potential. Rev Physiol Biochem Pharmacol 83: 35-88. [DOI] [PubMed] [Google Scholar]
- Cohen-Cory S (2002) The developing synapse: construction and modulation of synaptic structures and circuits. Science 298: 770-776. [DOI] [PubMed] [Google Scholar]
- Demarque M, Represa A, Becq H, Khalilov I, Ben-Ari Y, Aniksztejn L (2002) Paracrine intercellular communication by a Ca2+- and SNARE-independent release of GABA and glutamate prior to synapse formation. Neuron 36: 1051-1061. [DOI] [PubMed] [Google Scholar]
- Erzurumlu RS, Jhaveri S (1992) Trigeminal ganglion cell processes are spatially ordered prior to the differentiation of the vibrissa pad. J Neurosci 12: 3946-3955. [DOI] [PMC free article] [PubMed] [Google Scholar]
- Erzurumlu RS, Killackey HP (1983) Development of order in the rat trigeminal system. J Comp Neurol 213: 365-380. [DOI] [PubMed] [Google Scholar]
- Forbes DJ, Welt C (1981) Neurogenesis in the trigeminal ganglion of the albino rat: a quantitative autoradiographic study. J Comp Neurol 199: 133-147. [DOI] [PubMed] [Google Scholar]
- Frankenhaeuser B, Hodgkin AL (1957) The action of calcium on the electrical properties of squid axons. J Physiol (Lond) 137: 218-244. [DOI] [PMC free article] [PubMed] [Google Scholar]
- Friauf E, Lohmann C (1999) Development of auditory brainstem circuitry: activity-dependent and activity-independent processes. Cell Tissue Res 297: 187-195. [DOI] [PubMed] [Google Scholar]
- Goodman CS, Shatz CJ (1993) Developmental mechanisms that generate precise patterns of neuronal connectivity. Cell [Suppl] 72: 77-98. [DOI] [PubMed] [Google Scholar]
- Grinvald A, Frostig RD, Lieke E, Hildesheim R (1988) Optical imaging of neuronal activity. Physiol Rev 68: 1285-1366. [DOI] [PubMed] [Google Scholar]
- Henderson TA, Johnson Jr EM, Osborne PA, Jacquin MF (1994) Fetal NGF augmentation preserves excess trigeminal ganglion cells and interrupts whisker-related pattern formation. J Neurosci 14: 3389-3403. [DOI] [PMC free article] [PubMed] [Google Scholar]
- Hicks SP, D'Amato CJ (1968) Cell migrations to the isocortex in the rat. Anat Rec 160: 619-634. [DOI] [PubMed] [Google Scholar]
- Hirota A, Sato K, Momose-Sato Y, Sakai T, Kamino K (1995) A new simultaneous 1020-site optical recording system for monitoring neural activity using voltage-sensitive dyes. J Neurosci Methods 56: 187-194. [DOI] [PubMed] [Google Scholar]
- Hume RI, Role LW, Fischbach GD (1983) Acetylcholine release form growth cones detected with patches of acetylcholine receptor-rich membranes. Nature 305: 632-634. [DOI] [PubMed] [Google Scholar]
- Iwasato T, Erzurumlu RS, Huerta PT, Chen DF, Sasaoka T, Ulupinar E, Tonegawa S (1997) NMDA receptor-dependent refinement of somatotopic maps. Neuron 19: 1201-1210. [DOI] [PubMed] [Google Scholar]
- Kamino K (1990) Optical studies of early developing cardiac and neural activities using voltage-sensitive dyes. Jpn J Physiol 40: 443-461. [DOI] [PubMed] [Google Scholar]
- Kamino K (1991) Optical approaches to ontogeny of electrical activity and related functional organization during early heart development. Physiol Rev 71: 53-91. [DOI] [PubMed] [Google Scholar]
- Kamino K, Hirota H, Fujii S (1981) Localization of pacemaking activity in early embryonic heart monitored using voltage-sensitive dye. Nature 290: 595-597. [DOI] [PubMed] [Google Scholar]
- Kamino K, Hirota A, Komuro H (1989) Optical indications of electrical activity and excitation-contraction coupling in the early embryonic heart. Adv Biophys 25: 45-93. [DOI] [PubMed] [Google Scholar]
- Katz B, Miledi R (1969) Tetrodotoxin-resistant electric activity in presynaptic terminals. J Physiol (Lond) 203: 459-487. [DOI] [PMC free article] [PubMed] [Google Scholar]
- Katz LC, Shatz CJ (1996) Synaptic activity and the construction of cortical circuits. Science 274: 1133-1138. [DOI] [PubMed] [Google Scholar]
- Killackey HP, Belford GR (1979) The formation of afferent patterns in the somatosensory cortex of the neonatal rat. J Comp Neurol 183: 285-304. [DOI] [PubMed] [Google Scholar]
- Komuro H, Sakai T, Momose-Sato Y, Hirota A, Kamino K (1991) Optical detection of postsynaptic potentials evoked by vagal stimulation in the early embryonic chick brain stem slice. J Physiol (Lond) 442: 631-648. [DOI] [PMC free article] [PubMed] [Google Scholar]
- Li Y, Erzurumlu RS, Chen C, Jhaveri S, Tonegawa S (1994) Whisker-related neuronal patterns fail to develop in the trigeminal brainstem nuclei of NMDAR1 knockout mice. Cell 76: 427-437. [DOI] [PubMed] [Google Scholar]
- London JA, Zecevic D, Cohen LB (1987) Simultaneous optical recording of activity from many neurons during feeding in Navanax. J Neurosci 7: 649-661. [DOI] [PMC free article] [PubMed] [Google Scholar]
- McAllister IIJP, Das GD (1977) Neurogenesis in the epithalamus, dorsal thalamus and ventral thalamus of the rat: an autoradiographic and cytological study. J Comp Neurol 172: 647-686. [DOI] [PubMed] [Google Scholar]
- Miller MW, Al-Ghoul WM (1993) Numbers of neurons in the developing principal sensory nucleus of the trigeminal nerve: enhanced survival of early-generated neurons over late-generated neurons. J Comp Neurol 330: 491-501. [DOI] [PubMed] [Google Scholar]
- Miller MW, Muller SJ (1989) Structure and histogenesis of the principal sensory nucleus of the trigeminal nerve: effect of prenatal exposure to ethanol. J Comp Neurol 282: 570-580. [DOI] [PubMed] [Google Scholar]
- Miyahara M, Shirasaki R, Tashiro Y, Muguruma K, Heizmann CW, Murakami F (2003) Pathfinding and growth termination of primary trigeminal sensory afferents in the embryonic rat hindbrain. J Comp Neurol 460: 503-513. [DOI] [PubMed] [Google Scholar]
- Momose-Sato Y, Sato K (2003) Developmental organization of the rat trigeminal nucleus revealed by optical mapping. Neurosci Res [Suppl] 27: S89. [Google Scholar]
- Momose-Sato Y, Sakai T, Hirota A, Sato K, Kamino K (1994) Optical mapping of early embryonic expressions of Mg 2+-/APV-sensitive components of vagal glutaminergic EPSPs in the chick brainstem. J Neurosci 14: 7572-7584. [DOI] [PMC free article] [PubMed] [Google Scholar]
- Momose-Sato Y, Sato K, Sakai T, Hirota A, Matsutani K, Kamino K (1995) Evaluation of optimal voltage-sensitive dyes for optical monitoring of embryonic neural activity. J Membr Biol 144: 167-176. [DOI] [PubMed] [Google Scholar]
- Momose-Sato Y, Sato K, Hirota A, Sakai T, Yang X-S, Kamino K (1997) Optical characterization of a novel GABA response in early embryonic chick brainstem. Neuroscience 80: 203-219. [DOI] [PubMed] [Google Scholar]
- Momose-Sato Y, Sato K, Kamino K (2001) Optical approaches to embryonic development of neural functions in the brainstem. Prog Neurobiol 63: 151-197. [DOI] [PubMed] [Google Scholar]
- Momose-Sato Y, Sato K, Kamino K (2002) Application of voltage-sensitive dyes to the embryonic central nervous system. In: Recent research developments in membrane biology (Fagan J, Davidson JN, Shimizu N, eds), pp 159-181. Kerara, India: Research Signpost.
- Nord SG (1967) Somatotopic organization in the spinal trigeminal nucleus, the dorsal column nuclei and related structures in the rat. J Comp Neurol 130: 343-356. [DOI] [PubMed] [Google Scholar]
- Nornes HO, Morita M (1979) Time of origin of the neurons in the caudal brain stem of rat. An autoradiographic study. Dev Neurosci 2: 101-114. [Google Scholar]
- Obaid AL, Orkand RK, Gainer H, Salzberg BM (1985) Active calcium responses recorded optically from nerve terminals of the frog neurohypophysis. J Gen Physiol 85: 481-489. [DOI] [PMC free article] [PubMed] [Google Scholar]
- Orbach HS, Cohen LB (1983) Optical monitoring of activity from many areas of the in vitro and in vivo salamander olfactory bulb: a new method for studying functional organization in the vertebrate central nervous system. J Neurosci 3: 2251-2262. [DOI] [PMC free article] [PubMed] [Google Scholar]
- Orbach HS, Cohen LB, Grinvald A (1985) Optical mapping of electrical activity in rat somatosensory and visual cortex. J Neurosci 5: 1886-1895. [DOI] [PMC free article] [PubMed] [Google Scholar]
- Palade GE (1952) A study of fixation for electron microscopy. J Exp Med 95: 285-307. [DOI] [PMC free article] [PubMed] [Google Scholar]
- Reynolds ES (1963) The use of lead citrate at high pH as an electron-opaque stain in electron microscopy. J Cell Biol 17: 208-212. [DOI] [PMC free article] [PubMed] [Google Scholar]
- Rhoades RW, Enfejian HL, Chiaia NL, Macdonald GJ, Miller MW, McCann P, Goddard CM (1991) Birthdates of trigeminal ganglion cells contributing axons to the infraorbital nerve and specific vibrissa follicles in the rat. J Comp Neurol 307: 163-175. [DOI] [PubMed] [Google Scholar]
- Salzberg BM (1983) Optical recording of electrical activity in neurons using molecular probes. In: Current methods in cellular neurobiology, Vol 3, Electrophysiological techniques (Barker JL, McKelvy JF, eds), pp 139-187. New York: Wiley.
- Salzberg BM, Grinvald A, Cohen LB, Davila HV, Ross WN (1977) Optical recording of neuronal activity in an invertebrate central nervous system: simultaneous monitoring of several neurons. J Neurophysiol 40: 1281-1291. [DOI] [PubMed] [Google Scholar]
- Salzberg BM Obaid AL, Gainer H (1985) Large and rapid changes in light scattering accompany secretion by nerve terminals in the mammalian neurohypophysis. J Gen Physiol 86: 395-411. [DOI] [PMC free article] [PubMed] [Google Scholar]
- Sato K, Momose-Sato Y, Arai Y, Hirota A, Kamino K (1997) Optical illustration of glutamate-induced cell swelling coupled with membrane depolarization in embryonic brain stem slices. NeuroReport 8: 3559-3563. [DOI] [PubMed] [Google Scholar]
- Sato K, Momose-Sato Y, Hirota A, Sakai T, Kamino K (1998) Optical mapping of neural responses in the embryonic rat brainstem with reference to the early functional organization of vagal nuclei. J Neurosci 18: 1345-1362. [DOI] [PMC free article] [PubMed] [Google Scholar]
- Sato K, Momose-Sato Y, Mochida H, Arai Y, Yazawa I, Kamino K (1999) Optical mapping reveals the functional organization of the trigeminal nuclei in the chick embryo. Neuroscience 93: 687-702. [DOI] [PubMed] [Google Scholar]
- Schlaggar BL, Fox K, O'Leary DDM (1993) Postsynaptic control of plasticity in developing somatosensory cortex. Nature 364: 623-626. [DOI] [PubMed] [Google Scholar]
- Sur M, Leamey CA (2001) Development and plasticity of cortical areas and networks. Nat Rev Neurosci 2: 251-262. [DOI] [PubMed] [Google Scholar]
- Takahashi T, Nakajima Y, Hirosawa K, Nakajima S, Onodera K (1987) Structure and physiology of developing neuromuscular synapses in culture. J Neurosci 7: 473-481. [DOI] [PMC free article] [PubMed] [Google Scholar]
- Torvik A (1956) Afferent connections to the sensory trigeminal nuclei, the nucleus of the solitary tract and adjacent structures. J Comp Neurol 106: 51-141. [DOI] [PubMed] [Google Scholar]
- von Bartheld CS, Cunningham DE, Rubel EW (1990) J Histochem Cytochem 38: 725-733. [DOI] [PubMed] [Google Scholar]
- Waite PME (1984) Rearrangement of neuronal responses in the trigeminal system of the rat following peripheral nerve section. J Physiol (Lond) 352: 425-445. [DOI] [PMC free article] [PubMed] [Google Scholar]
- Waite PME, Tracey DJ (1995) Trigeminal sensory system. In: The rat nervous system (Paxinos G, ed), pp 705-724. San Diego: Academic.
- Waite PME, Ho SM, Henderson TA (2000) Afferent ingrowth and onset of activity in the rat trigeminal nucleus. Eur J Neurosci 12: 2781-2792. [DOI] [PubMed] [Google Scholar]
- Wong ROL, Ghosh A (2002) Activity-dependent regulation of dendritic growth and patterning. Nat Rev Neurosci 3: 803-812. [DOI] [PubMed] [Google Scholar]
- Wu J-Y, Lam Y-W, Falk CX, Cohen LB, Fang J, Loew L, Prechtl JC, Kleinfeld D, Tsau Y (1998) Voltage-sensitive dyes for monitoring multineuronal activity in the intact central nervous system. Histochem J 30: 169-187. [DOI] [PubMed] [Google Scholar]


