

Abstract
In the primary visual cortex (V1), the single-neuron response to a grating stimulus placed in the classical receptive field (CRF) is suppressed by a similar stimulus presented in the CRF surround. To assess the input mechanism underlying the surround suppression, we tested the effects of iontophoretically administered GABAA-receptor antagonist, bicuculline methiodide (BMI), for the 46 V1 neurons in anesthetized cats. First, the stimulus-size tuning curves were studied, with or without BMI administration, for each neuron by changing the size of the grating patch. During the BMI administration, the shape of the normalized size tuning curve did not change considerably. Second, the dependency of surround suppression on the orientation of the surround grating was examined. In the control, the surround suppression showed the clear orientation tuning that peaked at an orientation the same as the optimal orientation of the CRF response. The BMI administration did not change the orientation dependency of surround suppression. We also estimated the relative contribution of excitation and inhibition to the size and orientation tuning of surround suppression. It was concluded that cortical excitation and inhibition were well balanced, having similar tuning profiles for both stimulus size and orientation of the surround grating. Furthermore, surround stimuli used for V1 neurons suppressed the CRF response of neurons in the lateral geniculate nucleus. These results suggest that surround suppression is not primarily attributable to the intracortical inhibition, but because of a reduction of thalamocortical inputs, which drive the cortical excitation and inhibition, and a subsequent decrease in the cortical excitatory interactions.
Keywords: striate cortex, receptive field surround, surround suppression, bicuculline, intracortical inhibition, lateral geniculate nucleus, cat
Introduction
The response of a neuron in the primary visual cortex (V1) to visual stimulation of its classical receptive field (CRF) is modulated by a second stimulus concurrently presented in the receptive field surround. The often reported effect of surround stimulation is suppression (Blakemore and Tobin, 1972; Nelson and Frost, 1978; Knierim and Van Essen, 1992; DeAngelis et al., 1994; Sengpiel et al., 1997; Sceniak et al., 1999; Walker et al., 1999, 2000; Akasaki et al., 2002) rather than facilitation (Maffei and Fiorentini, 1976; Li and Li, 1994; Sillito et al., 1995; Levitt and Lund, 1997; Polat et al., 1998). The strength of the surround suppression is dependent on the exact relationship of the gratings at the center and surround of the CRF. Maximal suppression is obtained when the orientation and spatial frequency of the surround grating are identical with those of the center grating (DeAngelis et al., 1994; Li and Li, 1994; Levitt and Lund, 1997; Sengpiel et al., 1997; Akasaki et al., 2002). This suggests that surround modulation is generated by both the intracortical connection among V1 neurons with similar stimulus specificities and the stimulus-specific convergence of thalamic inputs to V1 (Chapman et al., 1991; Reid and Alonso, 1995; Ferster et al., 1996).
The strength of surround suppression in V1 is also dependent on how large an area beyond the CRF is stimulated. The response magnitude increases with an increase in the size of a circular grating centered on the CRF until the size becomes as large as the CRF and then the response magnitude decreases as the stimulus becomes larger than the CRF (DeAngelis et al., 1994; Li and Li, 1994; Sengpiel et al., 1997; Sceniak et al., 1999; Walker et al., 2000; Anderson et al., 2001; Akasaki et al., 2002). There is evidence that the source of surround suppression is spatially localized at the end-, side-, or oblique-zones around the CRF (DeAngelis et al., 1994; Walker et al., 1999, 2002). Therefore, the suppression might arise from inhibitory interneurons with their receptive fields outside the CRF of the neuron under study (Anderson et al., 2001). This type of inhibition differs in function from that reported to be directly involved in the generation of the CRF (Borg-Graham et al., 1998; Hirsch et al., 1998).
Although the nature of surround modulation has been fairly well described, its underlying mechanism has not yet been clarified. In the present study, we investigated the contribution of intracortical inhibition to surround suppression by recording extracellularly from single neurons in cat V1 while blocking intracortical inhibition by the iontophoretic administration of bicuculline methiodide (BMI). We examined the effects of BMI administration on size and orientation tuning of the suppressive surround effect and assessed the relationship between tuning curves for excitation and inhibition underlying the suppression. Size tuning of the suppressive effect was also examined in neurons of the lateral geniculate nucleus (LGN) to assess the subcortical mechanisms of the surround effects. Preliminary results of this study have been reported previously (Ozeki et al., 2002).
Materials and Methods
Preparation. The details of the experimental preparation were as described previously (Akasaki et al., 2002). Seventeen adult cats weighing 2.5-4 kg were anesthetized with ketamine (5 mg/kg, i.m.) followed by a mixture of isoflurane (2-3%) and N2O:O2 (2:1). The trachea of each animal was intubated, and a catheter was placed in the femoral vein. The animals were then placed in a stereotaxic head holder, continuously paralyzed with pancuronium bromide (0.1 mg/kg/hr, i.v.) to minimize eye movements and maintained under artificial ventilation. During the recording of neuronal activity, isoflurane was reduced to 0-0.5% (generally 0.3-0.5%) in N2O:O2 (2:1), and fentanyl citrate (Fentanest; Sankyo, Tokyo, Japan; 10 μg/kg/hr, i.v.) was continuously infused. A local anesthetic, lidocaine, was administered at pressure points and around surgical incisions. The rectal temperature and end-tidal CO2 were adjusted to 37-38°C and 3.5-4%. Electrocardiogram and heart rate were continuously monitored throughout the experiment. All procedures were performed in accordance with National Institutes of Health guidelines for the care of experimental animals and the regulations of Osaka University Medical School Animal Care Committee.
Physiological recording. Triple-barreled glass micropipettes were used for extracellular single-neuron recording and the iontophoretic administration of BMI (Sigma, St. Louis, MO; 5 mm, pH 4.0) and GABA (Tocris Cookson, Bristol, UK; 0.5 m, pH 4.0) to the neurons under study (Sato et al., 1996). For most electrodes, the tip of the recording pipette protruded by 20-30 μm from that of the drug pipettes to block primarily the GABAA receptors located at the soma. For a few electrodes, the recording pipette protruded 200-250 μm from the drug pipette to block primarily the distal GABAA receptors of the recorded neuron. The strength of the ejection current of BMI was set to antagonize the suppressive effects of iontophoretic administration of GABA. The GABA ejection was first adjusted to a level that abolished all visual responses of the recorded neuron. The BMI ejection was then set to a level high enough to abolish the effects of GABA, yet not so high as to appreciably increase the spontaneous activity of the neuron. This procedure was chosen to prevent excessive activation by BMI that might lead to the saturation of spike firing. Generally, the ejecting and retaining currents of BMI were between +5 and +20 nA and between -5 and -10 nA. During BMI administration, using a tip separation of 20-30 μm, the response to stimulation of the CRF alone increased by a factor of 2.91 ± 1.45 (mean ± SD; range, 1.51-9.49; n = 43) relative to the control response.
The recording pipette was filled with 0.5 m sodium acetate containing 4% Pontamine Sky Blue. At the end of each penetration, dye marks were produced by passing tip-negative DC currents (intensity, 8-10 μA; duration, 1 sec at 0.5 Hz; 100 pulses) and recovered in histological sections (see below). After recording, the animals were deeply anesthetized with sodium pentobarbital (40 mg/kg, i.v.) and perfused transcardially with buffered saline followed by 4% paraformaldehyde in saline. Thin cortical sections were sliced at 60 μm thickness in the coronal plane and stained with cresyl violet, and the locations of the recorded sites were identified by microscopic observations.
Fifteen cats were used for the recording of V1 neurons. Two cats were used for recording neurons in laminas A and A1 of the LGN. The experimental protocol for the LGN recordings was the same as that for recording V1 neurons, except that BMI iontophoresis was not performed.
Visual stimulation. When a neuron was encountered, its minimum response field was manually plotted using a hand-held projector and then a computer-generated visual stimulus was targeted on the center of the field. The retinal eccentricity of the receptive fields was within ∼6° of the area centralis. The stimulus used was a drifting sinusoidal grating generated by a visual stimulus generator (VSG 2/3; Cambridge Research Systems, Rochester, UK), presented monocularly on a display (CPD-G500J; Sony, Tokyo, Japan; mean luminance, 40 cd/m2; refresh rate, 100 Hz; screen size, 40 × 30°) placed 57 cm in front of the cat's eyes. To analyze the receptive field characteristics of the neuron, the orientation, spatial frequency, temporal frequency, and size of the grating stimulus were controlled independently. We performed two types of tuning tests. (1) The size of the drifting grating was varied while the other stimulus parameters were kept optimal for the neuron (size tuning test). The response magnitude continuously increased toward a peak value with each increase in stimulus size and then either decreased or became asymptotic. The CRF size was defined by the stimulus diameter at which the response reached a maximum (see Fig. 1 B) or became saturated. In the latter case, the CRF size was determined as the minimum stimulus diameter at which the response was within ±1 SEM of the response to a stimulus of the maximal size used (e.g., whole screen of display, 40 × 30°). According to Freeman and colleagues (DeAngelis et al., 1994; Walker et al., 1999, 2000), the CRF sizes determined by the reverse correlation technique, another way to assess the receptive field structure, correspond well to the size estimates of the CRF used in the present study. (2) While displaying an optimal drifting grating confined to the CRF, the CRF surround was stimulated by the larger drifting grating with the same spatial and temporal frequency as the CRF grating. The orientation of the surround grating was then varied (surround-orientation test). The grating contrast was the same for the stimulation of the CRF and its surround, ranging from 5 to 100% (17 neurons, 5-30%; 18 neurons, 50%; 11 neurons, 80-100%).
Figure 1.

A, B, Schematic illustration of stimulus-size tuning curve and explanation of data-fitting parameters (A) and indices (B). See Materials and Methods.
For all tests, the contrast of the surround stimulus was adjusted for each neuron to elicit a surround suppression strong enough to test the effect of BMI, although we did not measure the full contrast-response function for each neuron. Neurons without surround suppression were excluded from additional tests using BMI. Each stimulus was presented stationary for 1 sec and then drifted for 2-4 sec. The stationary period was introduced to avoid the feature-nonspecific and phasic response to the appearance of a stimulus patch. Visually evoked responses to the first 2 sec of grating drift were analyzed to reduce the effect of response adaptation. Each set of stimuli was presented 2-20 times in a pseudorandom order to construct a family of peristimulus time histograms (PSTHs), and each stimulus presentation was interleaved for 1-4 sec with a blank screen with the same mean luminance (40 cd/m2) as the gratings.
Data analysis. For each neuron, the fundamental (F0) and first harmonic (F1) components of the averaged responses were computed from PSTHs that were compiled during a set of tests. Cell type was classified into either simple or complex on the basis of the F1/F0 ratio (F1/F0 ≥ 1, simple cell; F1/F0 < 1, complex cell) (Skottun et al., 1991). As the response measures, we used the amplitude of the F1 component for simple cells and the F0 component for complex cells.
In the size tuning test, to quantitatively describe the tuning curve, the data were fitted with the following:
 |
1 |
where R, x, and a are the firing rate, stimulus diameter, and CRF size (Fig. 1). b and c are the space constants of Gaussian functions fitted to the data outside (x ≥ a) and within (x ≤ a) the CRF (see Fig. 1A). We did not use an empirical method of describing the size tuning curve with the difference-of-Gaussians (DOG) model (DeAngelis et al., 1994; Sceniak et al., 2001), because our results were not consistent with its assumptions (see Discussion for details). First, we fitted the descending limb of the size tuning curve (see Fig. 1A, solid line), because the number of data points was large enough to estimate the fitting parameters K, b, and d (K and d represent the amplitude of the Gaussian function and offset of asymptotic response from spontaneous activity). Second, using K, d, and the free parameter c, the ascending limb of the size tuning curve (Fig. 1A, dotted line) was fitted. To evaluate how well our fitting procedure explained experimental data, the error between the actual data (data) and fitted values (fit) was calculated as the mean square error normalized by the average response across all data points of the fitted curve (Sceniak et al., 2001) using:
 |
2 |
We then calculated two indices, namely suppression index (SI) and half-width at half suppression (HWHS), using K, b, and d (Fig. 1 B). SI is the strength of the maximal surround suppression normalized by the activity of the recorded neuron. It was calculated as K/(K + d) and takes a value between 0 (no suppression) and 1 (complete suppression). HWHS is the tuning width outside the CRF, proportional to b, at which the half maximal surround suppression is obtained.
In the surround-orientation test, the orientation tuning of the surround effect was fitted with:
 |
3 |
where R(θs) is the response at the orientation difference θs between the center and surround gratings, R(CRF) is the response to the CRF stimulation, As and σs are the amplitude and width of the Gaussian function, and rs is the difference in magnitude between the CRF response and the response with the cross-oriented surround. Orientation tuning for the responses to the CRF grating was fitted with:
 |
4 |
where R(θc) is the response at the orientation difference θc between the optimal orientation of the recorded neuron and the stimulus orientation used, Ac and σc are the amplitude and width of the Gaussian function, and rc is the offset from spontaneous activity. We then calculated the full width at half amplitude of the fitted Gaussian for comparison of the orientation selectivity of the CRF response and surround effect using σc and σs. We also calculated the orientation selectivity index (OSI) using:
 |
5 |
where R(θi) is the response magnitude at the stimulus orientation θi (Batschelet, 1965; Sary et al., 1995; Sato et al., 1996). This index takes a value between 0 (equal response to any orientation) and 1 (complete selectivity).
Results
For 46 neurons in the primary visual cortex, the recording conditions were stable and lasted long enough (at least 2 hr) so that we could accomplish a set of tests with BMI iontophoresis. Almost all of the tested neurons exhibited strong surround suppression with >50% reduction of the response to the CRF stimulation. The neurons were classified into simple cells (n = 24) and complex cells (n = 22) on the basis of the F1/F0 ratio of visual responses (Skottun et al., 1991) (see Materials and Methods). In 40 of the 46 neurons, we were able to compare the simple-complex classification on the basis of the F1/F0 ratio with the classification based on the distribution of ON and OFF subregions (Hubel and Wiesel, 1962). The classifications matched in 31 of 40 cases. We suspect that the mismatch in classification in the remaining nine cases might have been caused by the relatively high contrast of the stimulus grating used in our experiments. A high-contrast stimulus modulates the gain of the cortical network (Ohzawa et al., 1985) and therefore might enhance the F1 component in complex cells and the F0 component in simple cells (Chance et al., 1999). In contrast, BMI administration near the recording site (see below) very slightly decreased the F1/F0 ratio in both simple and complex cells (1.62 ± 0.16, mean ± SD, to 1.50 ± 0.26 in 21 simple cells and 0.45 ± 0.20 to 0.32 ± 0.14 in 16 complex cells; p < 0.0001; paired t test).
Forty-six neurons were studied using one of two different types of iontophoretic electrodes. Using a tip separation of 20-30 μm between recording and drug pipettes in 43 neurons, we targeted GABAA receptors close to the soma (proximal administration). Using a tip separation of 200-250 μm in 26 neurons, we targeted apical dendrites (distal administration). The proximal administration was always effective, whereas the distal administration showed significant effects in only three of the 26 neurons tested. The results from these three neurons were nearly identical to those of the proximal administration but were excluded from the following analyses (data not shown).
Size tuning of surround suppression in V1
We examined the effects of BMI administration on the stimulus-size tuning of surround modulation. The results of the size tuning test for a layer II/III simple cell are shown in Figure 2. Figure 2A exemplifies the PSTHs of responses to small (8.9° in diameter) and large (28.4° in diameter) grating patches before (Control), during (BMI), and after (Recovery) BMI administration. In the control, this neuron exhibited a strong and brisk response to a small grating of which the diameter was the same as the CRF size, whereas the response to a large grating (28.4°) was strongly reduced by surround suppression. When BMI was administered with +7 nA of ejecting current, the response to the CRF stimulation was 250% of the control response. Although the BMI administration also increased the response to the large grating patch that stimulated both the CRF and its surround, the response magnitude was still appreciably smaller than the response to CRF stimulation. These effects of BMI administration on surround suppression are summarized as size tuning curves in Figure 2B. Because BMI administration (Fig. 2B, dashed line) increased the response at every stimulus size relative to the control responses (solid line), the two curves showed very similar tuning patterns, with only a slight broadening of tuning width that can be seen when the two curves are normalized and superimposed in Figure 2C. Previous studies have suggested that surround suppression is primarily generated by intracortical inhibition (DeAngelis et al., 1994; Anderson et al., 2001), implying that BMI administration should significantly counteract the suppression. In the neuron shown in Figure 2, however, the average effect of a stimulus larger than 17.8°, which induced the maximal suppression, was an 86.4% reduction in the response to the CRF stimulation in the control and a 73.3% reduction during the BMI administration. That is, the BMI administration eliminated only 15.2% of the surround suppression. This suggests that surround suppression is not primarily attributable to intracortical inhibition.
Figure 2.

Effect of BMI on stimulus-size tuning. An example of the size tuning test in a layer II/III simple cell is shown. Stimuli of a circular drifting grating with optimal orientation, direction, spatial frequency, and temporal frequency but with varying sizes were presented at the center of the CRF. The stimulus contrast was 50%. A, PSTHs of responses to stimuli shown at the top before (Control), during (BMI), and after (Recovery) the BMI administration with an ejecting current of +7 nA. In each PSTH, three consecutive cycles are shown. Arrows below the illustration of the stimulus indicate the drift direction. B, Tuning curves for the control response (solid line) and response during BMI administration (dashed line). Data are fitted by Equation 1. Error bars are ±1 SEM. Whole screen, 40 × 30° stimulation; SA, spontaneous activity. C, Tuning curves normalized to the response (fitted value) to the CRF stimulation.
To quantify the effects of BMI administration on the size tuning curve for each neuron, the ascending and descending limbs of the tuning curve were separately fitted by two half-Gaussian functions (Eq. 1), and the following indices were calculated (see Materials and Methods) (Fig. 1): CRF size, maximal surround suppression normalized by the activity level of each neuron (SI), and tuning width eliciting the half-maximal surround suppression (HWHS). Equation 1 successfully fitted the stimulus-size tuning for 38 of the 43 neurons; five neurons were poorly fit because of the small number of data points (n = 4) or the asymptotic tuning curve (n = 1). For the 38 neurons, the fitting errors of the data outside the CRF calculated with Equation 2 were 0.04 ± 0.04 (mean ± SD) in the control and 0.03 ± 0.03 with BMI administration, indicating similar levels of goodness of the fit.
During BMI administration, most of the neurons did not notably change in CRF size; the average size changes were 0.11 ± 0.76° for 21 simple cells and -0.05 ± 1.11° for 17 complex cells (average CRF size in the control, 4.55 ± 2.35°, mean ± SD, for simple cells and 5.10 ± 3.73° for complex cells; p > 0.59; t test). However, the SI showed a slight decrease under the BMI effect (Fig. 3). Almost all data points were below the diagonal line, and the average effect of BMI administration was an 11.6 ± 18.0% (mean ± SD) reduction in surround suppression. This BMI effect on SI was highly significant (p < 0.000001; paired t test). However, this in turn means that a large proportion (88.4%) of the suppression remains intact under the BMI effect. The third parameter of the tuning curve, HWHS, like CRF size, was mostly unchanged by BMI administration (Fig. 4). Almost all data points in Figure 4, A (simple cells) and B (complex cells), were found near the diagonal line, suggesting that the BMI administration did not change the tuning width of the surround suppression appreciably (p > 0.37; paired t test). Figure 4C summarizes the distribution of the BMI-induced changes in HWHS (ratio of BMI HWHS/control HWHS). Most of the neurons did not change the tuning width of the surround suppression during the BMI administration (median, 1.07). From these results of the BMI effects on CRF size, SI, and HWHS, it is concluded that the spatial tuning of surround suppression is not strongly affected by the blockade of intracortical inhibition.
Figure 3.

Effect of BMI on SI. A, B, Comparison of SI between with and without BMI administration for simple (A) and complex (B) cells. Recorded layers are indicated by symbols (open triangle, layer II/III; filled square, layer IV; open circle, layer V; filled triangle, layer VI). In these graphs, five neurons (one simple and four complex cells) that showed a poor fit by the fitting function (Eq. 1) are also included. For the 43 neurons, the BMI-induced reduction in surround suppression was 11.6 ± 18.0% (mean ± SD; p < 0.000001; paired t test), calculated using (Control SI - BMI SI)/Control SI.
Figure 4.

Effect of BMI on HWHS. A, B, Comparison of HWHS between with and without BMI administration for simple (A) and complex (B) cells. Recorded layers are indicated by symbols (open triangle, layer II/III; filled square, layer IV; open circle, layer V; filled triangle, layer VI). For the 38 neurons, there were no consistent changes in HWHS during the BMI administration (p > 0.37; paired t test). C, Distributions of BMI-induced changes in HWHS (BMI HWHS/Control HWHS ratio) for simple (filled bar) and complex (open bar) cells (n = 38). The average ratio value was 1.25 ± 0.68 (mean ± SD), indicating the increase in HWHS with BMI administration, but this change was not statistically significant (p > 0.37; paired t test). Arrow indicates the median value, 1.07.
From Figure 4C, it can be seen that a few neurons did show large changes in the tuning width of surround suppression. One possibility is that these neurons differed in other properties from the rest of the population. For example, we speculated that a strong inhibition-mediated component of the suppression might tend to make the CRF of such neurons smaller than normal. However, there was no correlation between CRF size and the BMI-induced change in CRF (r2 = 0.00002), and only 3 of the 21 neurons with CRFs smaller than the average CRF size of the 38 neurons (4.80°) showed a significant increase in CRF size during BMI administration. Also, there was no correlation between CRF size and the BMI-induced change in HWHS (r2 = 0.072). These results suggest that the smaller CRF is not attributable to the stronger operation of the cortical inhibition evoked from the CRF surround.
Finally, we examined the relative contribution of excitation and inhibition to the size tuning curve. For this analysis, we assume that the tuning curve of a neuron results from subtractive interactions between excitation and inhibition, each of which is separately tuned for stimulus size (see DOG model of Sceniak et al., 2001). We then used the effects of BMI administration to assess the shape of tuning curve for inhibition. That is, we took the tuning curve recorded in the presence of BMI as an estimate of the excitatory contribution to the control tuning curve. Similarly, we took the difference between tuning curves recorded with and without BMI as an estimate of the contribution of intracortical inhibition (Sato et al., 1996). Figure 5A shows examples of this type of analysis for six neurons. In all of the six neurons, the stimulus size tuning curves of control (solid line), excitation (dashed line), and inhibition (dotted line) exhibited surround suppression and are similar to each other in shape. In all of the 38 neurons analyzed, the excitation and inhibition exhibited similar tuning profiles, suggesting that the inhibitory mechanism is coextensive with the excitatory one (Sceniak et al., 2001; Cavanaugh et al., 2002).
Figure 5.

Relationship between excitation and inhibition in size tuning. A, Examples of the size tuning curves of the excitation (dashed line), inhibition (dotted line), and control response (solid line). The curves of inhibition for each example were derived by subtracting the control response from the response with BMI administration. Neurons were classified into three groups on the basis of the BMI HWHS/Control HWHS ratio. When the ratio was <0.7 or >1.3, the tuning profile of the excitation was classified into narrow (top row) and broad (bottom row). The tuning curves of the remaining neurons were classified into same (middle row). One complex cell with an extremely large receptive field (16.0°) was excluded from the analysis. Nineteen (51%) of the 37 neurons analyzed were classified into same, 12 neurons (32%) into broad, and six neurons (16%) into narrow. For these three groups, there was no significant difference in the shape of the control tuning curves (CRF size, p > 0.45, ANOVA; SI, p > 0.49; HWHS, p > 0.26). The BMI-induced increase in the response to the CRF stimulation was also nearly identical (p > 0.70). In data fitting (Eq. 1), when the stimulus size eliciting the peak response appreciably differed between the control and the BMI administration (top right graph), the average size was used as the CRF size. Error bars indicate ±1 SEM. B, Size-tuning curves were normalized and averaged for the 37 neurons in which these curves were reconstructed on the basis of the fitted parameters. During the BMI administration, the response to the CRF stimulation was 274 ± 24% (mean ± SEM) of the control response. C, The tuning curve of the relative contribution of excitation and inhibition. Because the intracortical inhibition is assumed to work as a response division shown in Equation 8, the ratio of the response with BMI administration to that in the control is plotted. Arrow indicates the average CRF size, 4.5°.
An intracellular study by Anderson et al. (2001) showed that the length-tuning property of neurons (i.e., end-inhibition) is generated by a combination of active cortical inhibition and a decrease in excitation for stimuli longer than the CRF. They also reported that the inhibitory conductance often exhibits a biphasic response to an increase in stimulus length, that is, the inhibitory conductance is large for short and long stimuli and small for stimuli of intermediate length. In none of our neurons did we observe a bimodal shape of the size tuning of inhibition (that is, the difference between the BMI and control tuning curves). However, it might be that our use of a single-peaked function (two half Gaussians, Eq. 1) to fit the tuning curves would allow us to overlook such bimodality. If bimodality were to occur, we would expect to find it only in those neurons for which the tuning curve obtained with BMI was significantly broader than the control tuning curve. We therefore selected one-third of the neurons for which BMI broadened the size tuning by >30% (12 of 37). The single peaked function fit the tuning curves for such neurons (goodness of fit as measured by Eq. 2) just as well as it did for other neurons (p > 0.26; t test), once again suggesting that there was no significant bimodality in the shape of the curves.
A divisive model for inhibition
The normalized and averaged size tuning curve for the 37 neurons is shown in Figure 5B, where the excitation and inhibition are normalized to the control response obtained by the CRF stimulation. This graph indicates that both the excitation and inhibition have similar tuning profiles and are well balanced, that is, strong excitation accompanies strong inhibition and vice versa. Such a relationship between excitation and inhibition, in turn, suggests that intracortical inhibition works to control the output level of the cortical network according to the amount of excitatory inputs or contrast level (response- or contrast-gain control mechanism) (Sengpiel et al., 1998). Recent studies have proposed a divisive role of inhibition as a mechanism underlying contrast gain control (Heeger, 1992) and surround suppression (Sengpiel et al., 1998; Sceniak et al., 2001; Cavanaugh et al., 2002; Walker et al., 2002), in which response is normalized by a pool of inputs driven by center and surround stimulation. Our results with extracellular recordings are not appropriate to directly address the validity of divisive model, because we do not know the exact contribution of excitation and inhibition to responses of recorded neurons. However, our approximate estimation of inhibitory contribution with divisive model did not confirm the result of intracellular recordings (Anderson et al., 2001). In this model, the response in the control condition, R(Control), is given by:
 |
6 |
where excitatory inputs (Excitation) are divided by inhibitory ones (Inhibition), and β is the nonlinear threshold imposed by the spike-rate-encoding mechanism (Sceniak et al., 2001). During BMI administration, because of the reduction in intracortical inhibition, the response, R(BMI), is assumed to be:
 |
7 |
and, from Equations 6 and 7, the inhibitory inputs are taken as:
 |
8 |
Thus, the contribution of inhibition is proportional to R(BMI)/R(Control) ratio. Therefore, the size tuning curve of inhibition was calculated from the data in Figure 5B (BMI and Control) with Equation 8 (β = 1; -1 was ignored for simplification) and plotted against stimulus size in Figure 5C (BMI/Control). The shape of this inhibitory tuning for stimulus size is very different from those estimated from the intracellular recording study (Anderson et al., 2001). In this curve, calculated with divisive model, a smaller value of BMI/Control ratio indicates a dominant contribution of excitation relative to inhibition, whereas the larger value of the ratio indicates a dominant contribution of inhibition. The highest level of inhibition is indicated in Figure 5C for very small stimuli (<1°). These high values might be a function of the cutoff of subthreshold excitation by firing threshold mechanism in the control recordings, which would lead to an overestimation of the inhibition. In contrast, there is a minimum in the derived level of inhibition when the stimulus diameter is near the optimal (i.e., CRF) (Fig. 5C, arrow), which means that the relative contribution of excitation is more dominant than that of inhibition. This is probably attributable to spike threshold nonlinearity (Jagadeesh et al., 1993; Carandini and Ferster, 2000), in which spike-rate coding is amplified for a stronger excitation above the spike threshold. Thus, the estimation of the size tuning curve of inhibition with applying the divisive model to the extracellularly recorded spike responses seems to be inappropriate because of the threshold mechanisms inherent in spike generation. This point should be further analyzed with intracellular recordings.
The results in Figure 5, A and B, suggest that the size tuning property of V1 neurons is determined by the synergistic contribution of excitation and inhibition. These inputs are well balanced throughout a wide range of stimulus sizes. That is, surround suppression is generated by a reduction both in excitation and inhibition, which occurs with an increase in stimulus size.
Orientation tuning of surround suppression in V1
We examined the effects of BMI administration on the orientation dependency of surround modulation. Figure 6 shows the results of the surround-orientation test for the neuron shown in Figure 2. The neuron was tuned to an orientation of 30° and did not respond at all to orthogonal gratings. The PSTHs in Figure 6A show the responses to stimulation of the CRF at the preferred orientation, alone and in combination with surround stimulation at three different orientations in the control (top) and during BMI administration (bottom). In the control, the response to the CRF stimulation was maximally suppressed by the iso-orientation surround grating (Fig. 6A, +0), whereas the suppressive effect by the cross-orientation surround grating was negligible (Fig. 6A, +90). That is, the strength of surround suppression was evidently dependent on the orientation difference between the CRF and surround gratings; the larger the orientation difference, the smaller the surround suppression (Fig. 6B, solid line). Although the BMI administration with +7 to +10 nA of ejecting current increased the responses to any orientation differences (Fig. 6B, dashed line), the shape of the orientation-tuning curve under the BMI effect was quite similar to that in the control (Fig. 6C).
Figure 6.

Effect of BMI on orientation dependency of surround effect. An example of the surround-orientation test for the neuron shown in Figure 2. Patterned stimuli are composed of the CRF grating with optimal parameters and surround grating with the same parameters as those of the CRF grating, except for orientation. The stimulus contrast was 50%. A, PSTHs of responses before (Control) and during (BMI) BMI administration. B, Tuning curves for the control response (solid line) and response during BMI administration (dashed line) plotted against orientation difference between the CRF and surround gratings. Data are fitted by Equation 3. Error bars indicate ±1 SEM. CRF, CRF stimulation. C, Tuning curves normalized to the response to the CRF stimulation. Other conventions are the same as those in Figure 2.
For all seven neurons tested, the relationship between tuning widths, with and without BMI administration (derived from Gaussian fits; Eqs. 3, 4), are plotted for the orientation tuning of the CRF response (center-orientation tuning) (Fig. 7A) and the orientation tuning of the surround suppression (surround-orientation tuning) (Fig. 7B). Note that the fitting errors for the CRF tuning were slightly larger than those for surround tuning (CRF, 0.05 ± 0.04, mean ± SD, for control and 0.04 ± 0.03 for BMI administration; surround, 0.13 ± 0.13 and 0.07 ± 0.10).
Figure 7.

Effect of BMI on orientation-tuning widths of the CRF response and the surround suppression. A, B, Left graphs, Orientation-tuning width of response to the CRF grating with varying orientation (A) and that of the surround effect (B) are compared between with and without BMI administration. Right graphs, Schematic illustration of orientation-tuning curves of the CRF response (A) and the surround suppression (B) are indicated, and full widths at half heights of fitted Gaussians (Eqs. 3, 4) are shown by arrows. In the data fitting of surround-orientation tuning (Eq. 3), the difference in magnitude between the CRF response and the response with the cross-oriented surround grating (rs) was set to 0, when the fitted curve did not show an asymptotic profile within the range of sampled data (B, left, two points at the extreme right).
BMI did not change the orientation tuning of the CRF response or of surround suppression. In the control, almost all of the neurons (six of seven) showed the maximal surround suppression when the orientations of the center and surround gratings were identical and, for one neuron, the maximal suppression was obtained when the orientation of the surround differed by 15° from the optimal orientation for this neuron. The width of the surround-orientation tuning (81.1 ± 34.7°; mean ± SD) was broader than that of the center-orientation tuning (43.8 ± 22.4°; p < 0.04; paired t test). During BMI administration, the surround orientation eliciting the maximal suppression did not change. Also, the widths of the center-orientation tuning (Fig. 7A) and surround-orientation tuning (Fig. 7B) did not change (43.8 ± 22.4 to 42.7 ± 14.9° for the center-orientation tuning, p > 0.82, paired t test; 81.1 ± 34.7 to 72.8 ± 26.7° for the surround-orientation tuning, p > 0.36). In contrast, the OSI (Eq. 5) of the CRF response changed slightly (0.36 ± 0.19, mean ± SD, to 0.25 ± 0.14; p < 0.04; paired t test), indicating that BMI decreased orientation selectivity. This result is consistent with the BMI effect on the orientation selectivity of macaque V1 (Sato et al., 1996).
The decrease of OSI during the BMI administration seems to be attributable to an increase of offset component, that is, the orientation-nonspecific response rather than a change in the shape of tuning. The normalized and averaged orientation-tuning curves from all seven neurons are shown for the center-orientation tuning (Fig. 8A) and surround-orientation tuning (Fig. 8B), in which the curves with BMI administration are normalized to the control response to the optimally oriented CRF grating. During BMI administration, the orientation selectivity of neurons decreased in the sense that the neurons started responding to the stimulus with a grating orientation orthogonal to the optimal (Fig. 8A, dashed line). However, the BMI administration did not significantly change the orientation-tuning width defined as the full width at half height (Fig. 7A) (see above).
Figure 8.
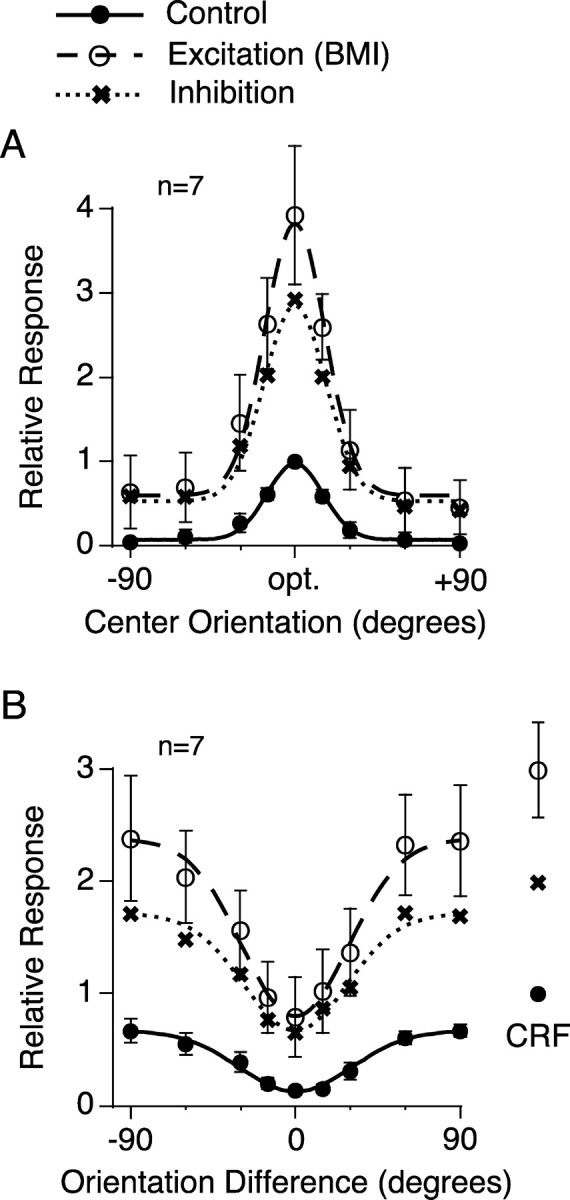
Relationship between excitation and inhibition to the orientation tuning of the CRF response and the surround suppression. A, B, Orientation tuning curves were normalized and averaged for the responses to the CRF grating (A) and the surround effect (B). The curves of inhibition were obtained by subtracting the control response from the response with BMI administration. Data in A and B are fitted by Equations 4 and 3. Error bars indicate ±1 SEM. During BMI administration, the responses to the CRF grating with the optimal orientation and size were 393 ± 82% (mean ± SEM; n = 7) of the control response in A and 299 ± 42% in B.
With the subtraction method, we also examined the relative contribution of excitation and inhibition to the orientation-tuning curve. The inhibitory orientation-tuning curves of the CRF response and surround suppression are indicated with dotted lines in Figure 8, A and B. In these graphs, the excitation (dashed line) and inhibition (dotted line) were tuned to the optimal orientation in Figure 8A or to the orientation difference of 0° in Figure 8B; the tuning profiles of excitation and inhibition were quite similar in the shape to the control response. This indicates that the orientation dependency of surround suppression is produced by excitation and inhibition, which are tuned to the optimal orientation of the response to the CRF grating.
Together with the results of the size-tuning test (Fig. 5A,B), these results suggest that V1 responses are regulated by well balanced excitation and inhibition, which have similar tuning profiles for size and orientation.
Size tuning of surround suppression in LGN
Because our results in V1 suggest that the cortical excitation and inhibition underlying the surround suppression have similar tuning profiles, it is possible that thalamocortical input by itself exhibits surround suppression with tuning properties similar to those observed in V1. To check this possibility, we recorded 20 LGN neurons with receptive fields of similar retinal eccentricity as the recorded V1 neurons (within ∼6°) and tested the size tuning of the LGN neurons using the same stimuli as those used for the V1 neurons.
Two stimulus contrasts, high (80%) and low (10-15%), which were in the range used for testing V1 neurons (5-100%), were used for each LGN neuron. Among the 20 neurons recorded, the strength of surround suppression greatly varied, but only one neuron (5%) lacked any surround suppression. Figure 9 shows three examples of the size tuning curves. At a stimulus contrast of 80% (Fig. 9, filled squares), on average, the CRF size defined by the same criteria as for V1 neurons was 1.99 ± 1.17° (mean ± SD; n = 20), the strength of surround suppression (SI) was 0.47 ± 0.19 (n = 20), and the tuning width eliciting half value of SI (HWHS) was 1.99 ± 1.31° (n = 19). The strength of suppression was remarkably attenuated when the stimulus contrast was decreased (Fig. 9, open squares), which could be a basis of the contrast-dependent changes in the CRF size (Sceniak et al., 1999) and contextual effects observed in V1 neurons (Levitt and Lund, 1997). For V1 neurons, according to Akasaki et al. (2002), the average strengths of surround suppression, defined as the difference between response to the CRF stimulation and response to the large (40 × 30°) grating that was normalized to the response to the CRF stimulation (stimulus contrast, generally >80%), were 0.60 ± 0.14 (n = 49) for layer II/III and 0.31 ± 0.36 (n = 28) for layer IV. In the present study, the CRF size and the HWHS of the 38 V1 neurons were 4.80 ± 3.01 and 3.18 ± 2.32°. Thus, LGN neurons showed a smaller CRF and narrower width of suppressive surround than V1 neurons but exhibited a strength of surround suppression comparable with that observed in V1 neurons. Although, as mentioned above, almost all LGN neurons (19 of 20; 95%) did not show the saturation-type tuning, 50% of the neurons in layer IV of V1 exhibited the saturation-type size tuning to a stimulus larger than the CRF (Akasaki et al., 2002). That the maximal strength of surround suppression in the LGN seems to be similar to that observed in layer IV of V1 suggests that the response reduction in the LGN by a large stimulus could underlie the surround suppression observed in V1.
Figure 9.
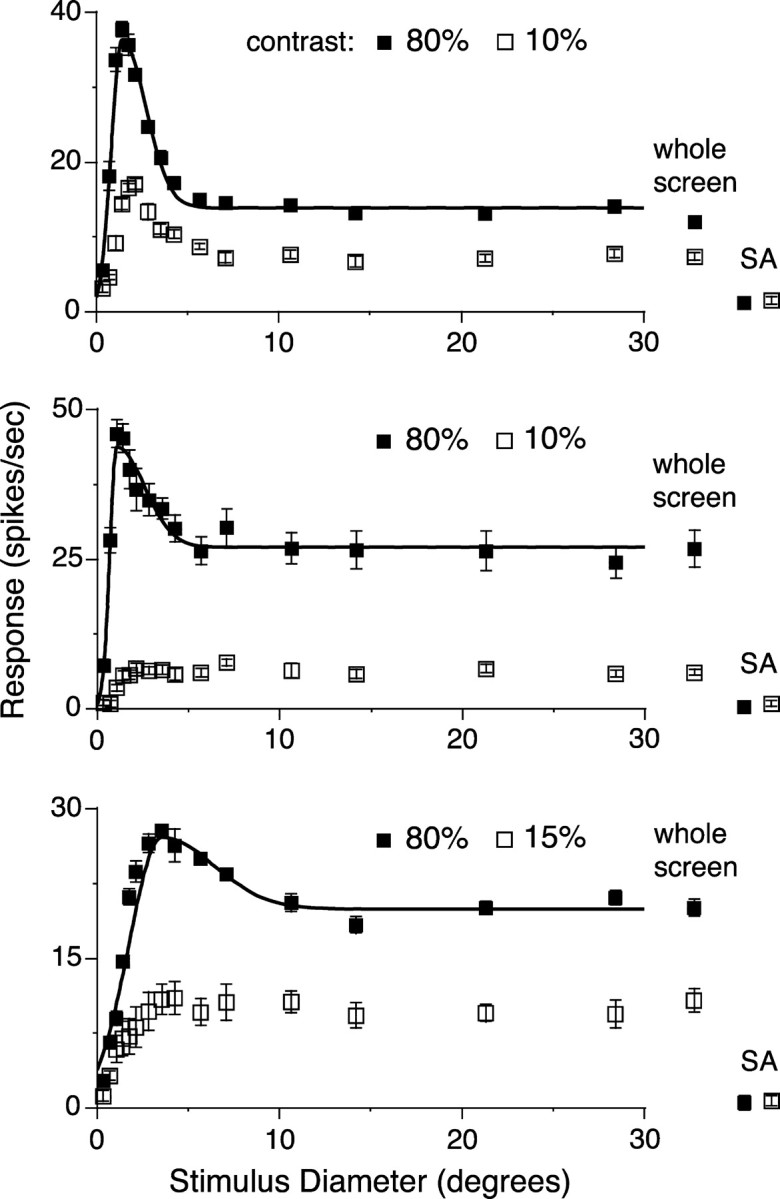
Size tuning curves of three LGN neurons recorded from lamina A (top and bottom) or A1 (middle). Drifting gratings with the same parameters as those used for the recording of V1 neurons were presented. Spatial frequency and temporal frequency were 0.1 c/° and 1 c/sec (top), 0.5 and 2 (middle), and 0.2 and 1 (bottom). Neurons were tested with high (80%) and low (10-15%) contrast gratings. Curve fitting with Equation 1 was not performed for responses to the low-contrast stimuli, because Equation 1 is not relevant to describe the saturation-type tuning.
Discussion
Mechanisms underlying surround suppression
We studied the cortical mechanisms underlying the stimulus-size tuning property and orientation-tuned surround suppression of V1 neurons with the pharmacological blockade of intracortical GABAergic inhibition. The blockade of the inhibition did not significantly reduce the surround suppression or change its size and orientation tuning. Previous results on this issue are mixed. Sillito and Versiani (1977) reported that the length preference of neurons in the visual cortex was only partially eliminated by the administration of bicuculline. However, others have found some evidence of a possible involvement of an intracortical mechanism (DeAngelis et al., 1994; Walker et al., 1999, 2002; Anderson et al., 2001). There are also reports suggesting that surround suppression arises from intracortical inhibition in V1, which is directly driven by feedback from higher cortical areas (Bullier et al., 2001; Angelucci et al., 2002; Cavanaugh et al., 2002; Levitt and Lund, 2002; Bair et al., 2003).
Our estimates of the relationship between the profiles of excitation and inhibition underlying the stimulus-size tuning (Fig. 5B) and orientation-tuned surround suppression (Fig. 8B) suggest that the well balanced excitation and inhibition synergistically produce the size and orientation tuning of the surround effect. Because the excitation and inhibition have similar tuning profiles (Figs. 5B, 8B), it appears that the driving source for the excitation and inhibition is identical (Anderson et al., 2000). This implies that the primary cause of the surround suppression is the reduction in the amount of excitatory inputs from the thalamus to the cortical network responsible for the activity of the recorded neurons, and the role of the cortical network is the regulation of output level according to its activity (i.e., response normalization). From our LGN experiment (Fig. 9), the most likely origin of the reduction in the amount of excitatory inputs is the length- and size-tuning properties of the LGN (Jones and Sillito, 1991; Sillito et al., 1993; Walker et al., 1999). Because it was reported that the surround suppression in the cat LGN neurons exhibits orientation-tuning property (Sillito et al., 1993), a reduction in the response magnitude of LGN neurons, when stimulated by a large grating that covers their inhibitory surround, should result in a substantial reduction in the amount of thalamocortical excitatory inputs to a neuron population in V1, which is tuned to the grating orientation (Chapman et al., 1991; Reid and Alonso, 1995; Ferster et al., 1996). This, in turn, would result in the orientation-tuned surround suppression in V1. Moreover, the major inputs to the cortical neurons are the recurrent excitation and inhibition from the local network in which the cortical neuron under study is embedded (Douglas et al., 1995). Therefore, a reduction in the amount of thalamocortical inputs would result in a subsequent decrease in excitatory interactions in the cortical network, which enhances the suppressive surround effect in V1.
Comparison with other models for surround suppression
The DOG model has been used often to describe the spatial distribution of the excitatory and inhibitory subfields underlying the CRF of V1 neurons (DeAngelis et al., 1994; Sceniak et al., 1999, 2001; Walker et al., 2000). An important assumption of this model is that the inhibitory summation field is broader than the excitatory one, and the integrated inputs of the excitation and inhibition across the respective summation fields become asymptotic at the edges of each summation field (Enroth-Cugell and Robson, 1966; Sceniak et al., 2001). Thus, the integrated difference between excitation and inhibition is the stimulus-size tuning with surround suppression. In contrast, Cavanaugh et al. (2002) have shown that cortical inhibition works as a divisive mechanism rather than a subtractive one, in which the excitatory and inhibitory subfields are assumed to be identical with those of the subtractive (DOG) model. There is evidence supporting the divisive mechanism of intracortical inhibition activated by visual stimulation (Borg-Graham et al., 1998; Hirsch et al., 1998; Anderson et al., 2000). Sceniak et al. (2001) compared the divisive model with the subtractive (DOG) model and showed that both models exhibited good agreements for the size-tuning property, indicating overlapping neural mechanisms between them. According to these models, the surround suppression is attributable to an increase in intracortical inhibition. However, our results (Fig. 5A,B) are inconsistent with these models, because both the excitation and inhibition showed size tuning, having a peak at the CRF size with a clear reduction in the response magnitude to a stimulus larger than the CRF. This point should be further analyzed with intracellular recordings that enable estimations of excitatory and inhibitory conductance and also the level of background synaptic input controlling the gain modulation of cortical neurons (Chance et al., 2002).
Blockade of inhibitory synapses by iontophoretically administered bicuculline methiodide
There are at least two technical limitations in the BMI iontophoresis. First, there is a possibility that iontophoretically administered BMI did not block all of the GABAA receptors on the neuron under study. Although most of the inhibitory synapses in the visual cortex are assumed to be distributed near the soma, including proximal dendritic shaft and initial segment (Somogyi, 1989), inhibitory synapses make contact with the distal dendrites as well (Kawaguchi and Kubota, 1997). In our experiments, the intensity of the ejecting current of BMI was determined to antagonize the effects of iontophoretically administered GABA, which effectively abolished the visual responses of the recorded neuron, but not to elicit a marked increase in spontaneous firing to prevent the saturation of spike firing attributable to excessive activation. Although it is hard to estimate exactly the extent of a diffusion of BMI, Fox et al. (1989) estimated the effective diffusion area of d-2-amino-5-phosphonovaleric acid (APV) as 100-200 μm from the tip of the electrode. This estimate should be applicable to the present experiments, because they used a similar range of ejecting currents and there are no uptake mechanisms for either BMI or APV. Therefore, the administered BMI should have antagonized most of the GABAA receptors responsible for visual responses. Figure 10 shows an example of BMI effects with different ejecting currents. Although the response to the CRF stimulation increased depending on the intensity of ejecting current, the strengths of surround suppression under different levels of the BMI effect were similar. We also tested the effects of the distal BMI administration targeting apical dendrites. The proximal BMI administration was always effective, whereas the distal administration did not change the response magnitude, except for 3 of the 26 neurons tested. This suggests that the distal inhibitory synapses do not play an appreciable role in the control of somatic spikes. We conclude that cortical GABAA inhibition plays a minor role in the suppressive effect of the CRF surround. However, there is a report that a blockade of GABAB receptors in V1 reduces the orientation selectivity of the sustained component of visual response (Allison et al., 1996). Therefore, the contribution of slow GABAB inhibition to surround suppression remains to be clarified.
Figure 10.

BMI effect with different ejecting currents on stimulus-size tuning. Although the response to the CRF stimulation markedly increased depending on current intensity, the surround suppression did not significantly decrease. BMI administration with ejecting currents of 5 and 9-12 nA increased the response to the CRF grating up to 260 and 445%. SI values were 0.96 (Control), 0.95 (BMI; 5 nA), and 0.87 (BMI; 9-12 nA), and the reductions in the surround suppression, calculated using (Control SI - BMI SI)/Control SI, were 0.4% (BMI; 5 nA) and 8.8% (BMI; 9-12 nA).
A second technical limitation of the BMI experiments is that iontophoretically administered BMI might facilitate the visual responses of not only the recorded neuron but also its neighboring neurons that synaptically excite the recorded neuron. However, our estimates of the relationship of excitation and inhibition underlying the orientation selectivity of V1 neurons in a BMI study (Fig. 8A) (see Fig. 9 in Sato et al., 1996) are comparable with the related observations in an intracellular recording [Anderson et al., (2000), their Fig. 18] in which the excitation and inhibition were tuned to similar orientations, although more recent studies showed a diversity of combinations of excitatory and inhibitory interactions underlying orientation selectivity (Schummers et al., 2002; Monier et al., 2003). Taking these results together, we conclude that the BMI iontophoresis in the present study is an appropriate method with which we can estimate the mechanisms underlying the surround suppression.
Surround suppression in LGN
In the present study, the driving sources of the cortical excitation and inhibition underlying surround suppression are suggested to have similar tuning characteristics. This, in turn, suggests that the surround suppression in the LGN is a possible origin of that in V1. Consistent with this notion, we (Fig. 9) and other researchers (Walker et al., 1999; Jones et al., 2000), using grating stimuli with the same parameters as those used for cortical neurons, showed that LGN neurons exhibit a surround suppression comparable with that observed in V1. Although the surround suppression in V1 is orientation dependent, there is a discrepancy between cats and primates in results of the orientation tuning of the surround suppression in LGN neurons. That is, it is reported to be orientation dependent in cats (Sillito et al., 1993) but not in primates (Solomon et al., 2002; Webb et al., 2002). Additional studies are necessary to clarify the transforming mechanism of thalamocortical projection to generate a great diversity in strength of surround suppression and an orientation tuning of that in V1.
Footnotes
This work was supported by grants to H.S. from the Japanese Ministry of Education, Culture, Sports, Science, and Technology (13041032, 13210086, 14017058, and Neuroinfomatics Research in Vision Project), and the Naito Foundation. H.O. was supported by the Japan Society for the Promotion of Science Research Fellowships. We thank Drs. Takuji Kasamatsu, Izumi Ohzawa, and David Ferster for critical reading and improving the English of this manuscript, and Dr. Yumiko Yoshimura for discussion.
Correspondence should be addressed to Dr. Hiromichi Sato, School of Health and Sport Sciences, Osaka University, 1-17 Machikaneyama, Toyonaka, Osaka 560-0043, Japan. E-mail: sato@vision.hss.osaka-u.ac.jp.
Copyright © 2004 Society for Neuroscience 0270-6474/04/241428-11$15.00/0
References
- Akasaki T, Sato H, Yoshimura Y, Ozeki H, Shimegi S (2002) Suppressive effects of receptive field surround on neuronal activity in the cat primary visual cortex. Neurosci Res 43: 207-220. [DOI] [PubMed] [Google Scholar]
- Allison JD, Kabara JF, Snider RK, Casagrande VA, Bonds AB (1996) GABAB-receptor-mediated inhibition reduces the orientation selectivity of the sustained response of striate cortical neurons in cats. Vis Neurosci 13: 559-566. [DOI] [PubMed] [Google Scholar]
- Anderson JS, Carandini M, Ferster D (2000) Orientation tuning of input conductance, excitation, and inhibition in cat primary visual cortex. J Neurophysiol 84: 909-926. [DOI] [PubMed] [Google Scholar]
- Anderson JS, Lampl I, Gillespie DC, Ferster D (2001) Membrane potential and conductance changes underlying length tuning of cells in cat primary visual cortex. J Neurosci 21: 2104-2112. [DOI] [PMC free article] [PubMed] [Google Scholar]
- Angelucci A, Levitt JB, Walton EJS, Hupe JM, Bullier J, Lund JS (2002) Circuits for local and global signal integration in primary visual cortex. J Neurosci 22: 8633-8646. [DOI] [PMC free article] [PubMed] [Google Scholar]
- Bair W, Cavanaugh JR, Movshon JA (2003) Time course and time-distance relationships for surround suppression in macaque V1 neurons. J Neurosci 23: 7690-7701. [DOI] [PMC free article] [PubMed] [Google Scholar]
- Batschelet E (1965) Statistical methods for the analysis of problems in animal orientation and certain biological rhythms. Washington, DC: American Institute of Biological Sciences.
- Blakemore C, Tobin EA (1972) Lateral inhibition between orientation detectors in the cat's visual cortex. Exp Brain Res 15: 439-440. [DOI] [PubMed] [Google Scholar]
- Borg-Graham LJ, Monier C, Fregnac Y (1998) Visual input evokes transient and strong shunting inhibition in visual cortical neurons. Nature 393: 369-373. [DOI] [PubMed] [Google Scholar]
- Bullier J, Hupe JM, James AC, Girard P (2001) The role of feedback connections in shaping the responses of visual cortical neurons. Prog Brain Res 134: 193-204. [DOI] [PubMed] [Google Scholar]
- Carandini M, Ferster D (2000) Membrane potential and firing rate in cat primary visual cortex. J Neurosci 20: 470-484. [DOI] [PMC free article] [PubMed] [Google Scholar]
- Cavanaugh JR, Bair W, Movshon JA (2002) Nature and interaction of signals from the receptive field center and surround in macaque V1 neurons. J Neurophysiol 88: 2530-2546. [DOI] [PubMed] [Google Scholar]
- Chance FS, Nelson SB, Abbott LF (1999) Complex cells as cortically amplified simple cells. Nat Neurosci 2: 277-282. [DOI] [PubMed] [Google Scholar]
- Chance FS, Abbott LF, Reyes AD (2002) Gain modulation from background synaptic input. Neuron 35: 773-782. [DOI] [PubMed] [Google Scholar]
- Chapman B, Zahs KR, Stryker MP (1991) Relation of cortical cell orientation selectivity to alignment of receptive fields of the geniculocortical afferents that arborize within a single orientation column in ferret visual cortex. J Neurosci 11: 1347-1358. [DOI] [PMC free article] [PubMed] [Google Scholar]
- DeAngelis GC, Freeman RD, Ohzawa I (1994) Length and width tuning of neurons in the cat's primary visual cortex. J Neurophysiol 71: 347-374. [DOI] [PubMed] [Google Scholar]
- Douglas RJ, Koch C, Mahowald M, Martin KAC, Suarez HH (1995) Recurrent excitation in neocortical circuits. Science 269: 981-985. [DOI] [PubMed] [Google Scholar]
- Enroth-Cugell C, Robson JG (1966) The contrast sensitivity of retinal ganglion cells of the cat. J Physiol (Lond) 187: 517-552. [DOI] [PMC free article] [PubMed] [Google Scholar]
- Ferster D, Chung S, Wheat H (1996) Orientation selectivity of thalamic input to simple cells of cat visual cortex. Nature 380: 249-252. [DOI] [PubMed] [Google Scholar]
- Fox K, Sato H, Daw N (1989) The location and function of NMDA receptors in cat and kitten visual cortex. J Neurosci 9: 2443-2454. [DOI] [PMC free article] [PubMed] [Google Scholar]
- Heeger DJ (1992) Normalization of cell responses in cat striate cortex. Vis Neurosci 9: 181-197. [DOI] [PubMed] [Google Scholar]
- Hirsch JA, Alonso JM, Reid RC, Martinez LM (1998) Synaptic integration in striate cortical simple cells. J Neurosci 18: 9517-9528. [DOI] [PMC free article] [PubMed] [Google Scholar]
- Hubel DH, Wiesel TN (1962) Receptive fields, binocular interaction and functional architecture in the cat's visual cortex. J Physiol (Lond) 160: 106-154. [DOI] [PMC free article] [PubMed] [Google Scholar]
- Jagadeesh B, Wheat HS, Ferster D (1993) Linearity of summation of synaptic potentials underlying direction selectivity in simple cells of the cat visual cortex. Science 262: 1901-1904. [DOI] [PubMed] [Google Scholar]
- Jones HE, Sillito AM (1991) The length-response properties of cells in the feline dorsal lateral geniculate nucleus. J Physiol (Lond) 444: 329-348. [DOI] [PMC free article] [PubMed] [Google Scholar]
- Jones HE, Andolina IM, Oakely NM, Murphy PC, Sillito AM (2000) Spatial summation in lateral geniculate nucleus and visual cortex. Exp Brain Res 135: 279-284. [DOI] [PubMed] [Google Scholar]
- Kawaguchi Y, Kubota Y (1997) GABAergic cell subtypes and their synaptic connections in rat frontal cortex. Cereb Cortex 7: 476-486. [DOI] [PubMed] [Google Scholar]
- Knierim JJ, Van Essen DC (1992) Neuronal responses to static texture patterns in area V1 of the alert macaque monkey. J Neurophysiol 67: 961-980. [DOI] [PubMed] [Google Scholar]
- Levitt JB, Lund JS (1997) Contrast dependence of contextual effects in primate visual cortex. Nature 387: 73-76. [DOI] [PubMed] [Google Scholar]
- Levitt JB, Lund JS (2002) The spatial extent over which neurons in macaque striate cortex pool visual signals. Vis Neurosci 19: 439-452. [DOI] [PubMed] [Google Scholar]
- Li CY, Li W (1994) Extensive integration field beyond the classical receptive field of cat's striate cortical neurons-classification and tuning properties. Vision Res 34: 2337-2355. [DOI] [PubMed] [Google Scholar]
- Maffei L, Fiorentini A (1976) The unresponsive regions of visual cortical receptive fields. Vision Res 16: 1131-1139. [DOI] [PubMed] [Google Scholar]
- Monier C, Chavane F, Baudot P, Graham LJ, Fregnac Y (2003) Orientation and direction selectivity of synaptic inputs in visual cortical neurons: a diversity of combinations produces spike tuning. Neuron 37: 663-680. [DOI] [PubMed] [Google Scholar]
- Nelson JI, Frost BJ (1978) Orientation-selective inhibition from beyond the classic visual receptive field. Brain Res 139: 359-365. [DOI] [PubMed] [Google Scholar]
- Ohzawa I, Sclar G, Freeman RD (1985) Contrast gain control in the cat's visual system. J Neurophysiol 54: 651-667. [DOI] [PubMed] [Google Scholar]
- Ozeki H, Sadakane O, Akasaki T, Naito T, Sato H (2002) Excitatory and inhibitory mechanisms underlying the contextual response modulation in the cat primary visual cortex. Soc Neurosci Abstr 457.9. [DOI] [PMC free article] [PubMed]
- Polat U, Mizobe K, Pettet MW, Kasamatsu T, Norcia AM (1998) Collinear stimuli regulate visual responses depending on cell's contrast threshold. Nature 391: 580-584. [DOI] [PubMed] [Google Scholar]
- Reid RC, Alonso JM (1995) Specificity of monosynaptic connections from thalamus to visual cortex. Nature 378: 281-284. [DOI] [PubMed] [Google Scholar]
- Sary G, Vogels R, Kovacs G, Orban GA (1995) Responses of monkey inferior temporal neurons to luminance-, motion-, and texture-defined gratings. J Neurophysiol 73: 1341-1354. [DOI] [PubMed] [Google Scholar]
- Sato H, Katsuyama N, Tamura H, Hata Y, Tsumoto T (1996) Mechanisms underlying orientation selectivity of neurons in the primary visual cortex of the macaque. J Physiol (Lond) 494: 757-771. [DOI] [PMC free article] [PubMed] [Google Scholar]
- Sceniak MP, Ringach DL, Hawken MJ, Shapley R (1999) Contrast's effect on spatial summation by macaque V1 neurons. Nat Neurosci 2: 733-739. [DOI] [PubMed] [Google Scholar]
- Sceniak MP, Hawken MJ, Shapley R (2001) Visual spatial characterization of macaque V1 neurons. J Neurophysiol 85: 1873-1887. [DOI] [PubMed] [Google Scholar]
- Schummers J, Marino J, Sur M (2002) Synaptic integration by V1 neurons depends on location within the orientation map. Neuron 36: 969-978. [DOI] [PubMed] [Google Scholar]
- Sengpiel F, Sen A, Blakemore C (1997) Characteristics of surround inhibition in cat area 17. Exp Brain Res 116: 216-228. [DOI] [PubMed] [Google Scholar]
- Sengpiel F, Baddeley RJ, Freeman TCB, Harrad R, Blakemore C (1998) Different mechanisms underlie three inhibitory phenomena in cat area 17. Vision Res 38: 2067-2080. [DOI] [PubMed] [Google Scholar]
- Sillito AM, Versiani V (1977) The contribution of excitatory and inhibitory inputs to the length preference of hypercomplex cells in layers II and III of the cat's striate cortex. J Physiol (Lond) 273: 775-790. [DOI] [PMC free article] [PubMed] [Google Scholar]
- Sillito AM, Cudeiro J, Murphy PC (1993) Orientation sensitive elements in the corticofugal influence on centre-surround interactions in the dorsal lateral geniculate nucleus. Exp Brain Res 93: 6-16. [DOI] [PubMed] [Google Scholar]
- Sillito AM, Grieve KL, Jones HE, Cudeiro J, Davis J (1995) Visual cortical mechanisms detecting focal orientation discontinuities. Nature 378: 492-496. [DOI] [PubMed] [Google Scholar]
- Skottun BC, De Valois RL, Grosof DH, Movshon JA, Albrecht DG, Bonds AB (1991) Classifying simple and complex cells on the basis of response modulation. Vision Res 31: 1079-1086. [DOI] [PubMed] [Google Scholar]
- Solomon SG, White AJR, Martin PR (2002) Extraclassical receptive field properties of parvocellular, magnocellular, and koniocellular cells in the primate lateral geniculate nucleus. J Neurosci 22: 338-349. [DOI] [PMC free article] [PubMed] [Google Scholar]
- Somogyi P (1989) Synaptic organization of GABAergic neurons and GABAA receptors in the lateral geniculate nucleus and visual cortex. In: Neural mechanisms of visual perception (Lam DMK, Gilbert CD, eds), pp 35-62. The Woodlands, TX: Portfolio.
- Walker GA, Ohzawa I, Freeman RD (1999) Asymmetric suppression outside the classical receptive field of the visual cortex. J Neurosci 19: 10536-10553. [DOI] [PMC free article] [PubMed] [Google Scholar]
- Walker GA, Ohzawa I, Freeman RD (2000) Suppression outside the classical cortical receptive field. Vis Neurosci 17: 369-379. [DOI] [PubMed] [Google Scholar]
- Walker GA, Ohzawa I, Freeman RD (2002) Disinhibition outside receptive fields in the visual cortex. J Neurosci 22: 5659-5668. [DOI] [PMC free article] [PubMed] [Google Scholar]
- Webb BS, Tinsley CJ, Barraclough NE, Easton A, Parker A, Derrington AM (2002) Feedback from V1 and inhibition from beyond the classical receptive field modulates the responses of neurons in the primate lateral geniculate nucleus. Vis Neurosci 19: 583-592. [DOI] [PubMed] [Google Scholar]