

Abstract
To test the hypothesis that growth and regeneration of the adult retina involves a mechanistic recapitulation of retinal development, the patterns of photoreceptor differentiation were investigated in the developing retina, as well as growing and regenerating adult retina, of a metamorphic vertebrate, the winter flounder. Only one opsin, of type RH2 (a “green” cone opsin), was expressed in premetamorphic (developing) retina, and a corresponding middle-wavelength visual pigment was observed. In premetamorphic retinas there was no evidence for any other cone opsins or pigments, rods, rod opsin expression, or rod visual pigment. In contrast, a rod opsin (RH1) and three cone opsins (SWS2, RH2, and LWS) were expressed in postmetamorphic (adult) retina, and these opsins were consistent with the observed repertoire of visual pigments. During postmetamorphic retinal growth and regeneration, cones were always produced before rods, but the different cone types were apparently produced simultaneously, suggesting that cone differentiation mechanisms might change after metamorphosis. The results support the hypothesis that photoreceptor differentiation during growth and regeneration of the adult retina involves a recapitulation of mechanisms that control the sequence of photoreceptor production during retinal development.
Keywords: rods, cones, opsin, retina, development, metamorphosis
Introduction
The CNS of fish grows throughout life and can substantially regenerate after injury. These special aspects of neuronal assembly extend to the neural retina (for review, see Raymond and Hitchcock, 2000; Stenkamp and Cameron, 2002; Otteson and Hitchcock, 2003). The extent to which adult retinal growth and regeneration recapitulate the mechanisms that control retinal development, however, is not entirely clear.
The retinas of metamorphic fish provide a convenient model system for investigating this problem. Metamorphosis, which is often characterized by significant changes in an animal's structural, physiological, and behavioral attributes (Weeks et al., 1997; Consoulas et al., 2000), involves substantial reorganization within the CNS (Hoskins, 1990; Truman, 1996). The neural retina can be a target for metamorphic transformation (Evans and Fernald, 1993; Evans et al., 1993; Shand et al., 1999, 2002; Helvik et al., 2001), and such metamorphic reorganization of the retina is likely to impact visual function, including color vision and absolute visual sensitivity. Furthermore, the metamorphic transition in vertebrates is driven by thyroid hormone (TH) signaling mechanisms (Inui and Miwa, 1985; Graf and Baker, 1990; Denver et al., 1997; Denver, 1998; Tata, 1999; Power et al., 2001), and because TH signaling has been implicated in retinal development (Browman and Hawryshyn, 1992; Kelley et al., 1995; Ng et al., 2001; Sevilla-Romero et al., 2002; Harpavat and Cepko, 2003; Cossette and Drysdale, 2004), the neural retina of metamorphic fish provides additional advantages for investigating the mechanisms that control cell differentiation in the developing, growing, and regenerating CNS.
As an initial step toward identifying and characterizing these mechanisms, we analyzed the patterns of photoreceptor differentiation in the retinas of premetamorphic and postmetamorphic winter flounder. The retinal opsins were cloned and sequenced, the presence of corresponding visual pigments was confirmed, and the patterns of photoreceptor differentiation were determined, including measurements relative to the spatial axes of normal postmetamorphic retinal growth and induced regeneration. We report that the developmental sequence of cone and rod photoreceptor differentiation, in which cones are produced before rods, was recapitulated during postmetamorphic retinal growth and regeneration. Although a temporal sequence of cone opsin expression is associated with retinal development, no evidence for a corresponding sequence was observed during postmetamorphic retinal growth or regeneration. This latter observation is consistent with the operation of a controlling mechanism that changes after metamorphosis, which we hypothesize involves TH signaling.
Materials and Methods
Postmetamorphic winter flounder (Pleuronectes americanus) (Fig. 1, right panel) were purchased from the Marine Biological Laboratory (Woods Hole, MA) and housed in standard fish tanks with water maintained at 13°C. Premetamorphic flounder (larval) (Fig. 1, left) ≤21 d after hatching were acquired from the Coastal Marine Laboratory (University of New Hampshire, New Castle, NH) and used immediately for experiments (metamorphosis in P. americanus typically occurs 42-98 d after hatching; Chambers and Leggett, 1987; Miller et al., 1991).
Figure 1.

Premetamorphic and postmetamorphic winter flounder. The total rostrocaudal length of the displayed premetamorphic fish (left, 21 d after hatching) (scale bar, 100 μm) is approximately equal to the pupil diameter of the displayed postmetamorphic fish (right). Note differences in bilateral symmetry, ocular location, fin organization, and body pigmentation.
Molecular cloning of opsins. The methodology for cloning retinal opsins was similar to that reported previously (Fyhrquist et al., 1998). Poly(A+) RNA was isolated from pooled, frozen, postmetamorphic retinas or whole premetamorphic fish (QuickPrep Micro mRNA Purification Kit; Amersham; Little Chalfont, UK), and the material was either stored at -80°C or used immediately for first-strand cDNA synthesis (First Strand cDNA Synthesis Kit; Amersham). Opsin cDNA was amplified with reverse transcriptase (RT)-PCR using degenerate primers (Integrated DNA Technologies, Coralville, IA) designed from conserved opsin sequences of marine teleosts, particularly the Atlantic halibut (Hippoglossus hippoglossus) (Helvik et al., 2001). A poly(dT) reverse primer was used with the appropriate forward primers to acquire sequence at the 3′ end of each message, and 5′ rapid amplification of cDNA ends (RACE) was performed with sequence-specific reverse primers to acquire sequence at the 5′ end of each message (Smart RACE kit; BD Biosciences, Palo Alto, CA). The amplified PCR products were cloned into pCR4-TOPO and transformed into TOP10 Escherichia coli using the manufacturer's protocol (Invitrogen, Carlsbad, CA). Colonies were expanded, and the plasmid DNA was purified with either a “miniprep” procedure using a cell resuspension solution, lysis buffer, and neutralization solution, or a commercial kit (Wizard Plus MiniPrep kit; Promega, Madison, WI). The DNA was sequenced from one of the insert-flanking M13 sites in the plasmid (Biotechnology Resource Center, Cornell University, Ithaca, NY). The open reading frame of the sequenced product was identified, and the amino acid sequence of the encoded protein was determined with conceptual translation. All nucleotide and inferred amino acid sequences have been deposited in the GenBank database (accession numbers: RH1, AY631036; RH2, AY631037; SWS2, AY631038; and LWS, AY631039).
In situ hybridization and immunohistochemistry. To identify patterns of opsin expression, cRNA probes for nonisotopic in situ hybridization were prepared. Briefly, PCR products of target opsin sequences 500-600 base pairs in length [extending from the putative fifth transmembrane (TM) region into the 3′ untranslated region] were generated, purified by gel electrophoresis (Qiaex II gel extraction kit; Qiagen, Chatsworth, CA), and cloned into pCR4-TOPO as above. Sequencing was performed to confirm the identity of all PCR-amplified products. Purified, linearized plasmid DNA from expanded colonies (10 μg) was used as a template for the synthesis of digoxigenin (DIG)-labeled cRNA probes using T3 or T7 RNA polymerase in the presence of digoxigenin-UTP (Roche Diagnostics, Indianapolis, IN).
For in situ hybridization analysis, the corneas and lenses were removed from extracted eyes, and the eye cups were immediately fixed by immersion in fresh 4% paraformaldehyde and 0.1 m phosphate buffer, pH 7.4, at room temperature. The fixed eye cups were processed for cryosectioning as described previously (Cameron and Carney, 2000), using RNase-free conditions. Sections at 15 μm thickness were collected, melt-mounted directly onto SuperFrost Plus glass slides (Fisher Scientific, Atlanta, GA), and stored at -80°C. Mounted sections were processed for in situ hybridization with the DIG-labeled RNA probes using previously described protocols (Barthel and Raymond, 1993) (G. Manglapus and J. Schwob, personal communication). Indirect immunohistochemistry, using an alkaline phosphatase-conjugated anti-DIG antibody (Roche) and subsequent nitroblue tetrazolium chloride-5-bromo-4-chlorindolyl-phosphate exposure, was used to detect bound RNA probe. Visual inspection and image capture of reacted slides was performed with standard transmitted or epifluorescence light microscopy (Axioskop; Zeiss, Thornwood, NY) and an associated digital image analysis system (MetaMorph; Universal Imaging, Downingtown, PA). Identification of the sense and antisense cRNA probe for each opsin (T3- or T7-derived) was determined empirically.
Indirect immunohistochemical techniques were used to label rod and cone photoreceptors and proliferative cells in cryosections (Cameron, 2000; Cameron and Carney, 2000). Antibodies were used that selectively label rods (zpr-3, University of Oregon Monoclonal Antibody Facility; anti-rhodopsin, courtesy of B. Knox, State University of New York, Upstate), cones (zpr-1, University of Oregon), or proliferating cell nuclear antigen (PCNA; Dako, High Wycombe, UK). Detection of primary antibodies was achieved with cyanine 2 (Cy2)-conjugatged or Cy3-conjugated secondary antibodies (Jackson ImmunoResearch, West Grove, PA). Detection of cells exhibiting evidence of apoptotic cell death was achieved in cryosections with the terminal deoxynucleotidyl transferase-mediated biotinylated UTP nick end labeling (TUNEL) method, using a commercial kit (ApopTag; Serologicals Corporation, Norcross, GA).
Measurements of photoreceptor location relative to growth axes. Regeneration of postmetamorphic dorsal retina was induced using a mechanical lesion paradigm described previously (Hitchcock et al., 1992; Cameron and Easter, 1995). The absolute and relative positions of rod and cone photoreceptors in adult retinas were referenced to two neurogenic structures (Fig. 2): the circumferential germinal zone (CGZ), a site of ongoing cytogenesis in the teleost retina (Johns, 1977), and the edge of a retinal lesion, a site of induced, regenerative cytogenesis (Hitchcock et al., 1992). The distance from a salient morphological structure at the CGZ, the termination of the inner plexiform layer (IPL), to the nearest labeled rod (dc,rods) and/or cone (dc,cones) was measured for at least six samples spanning adjacent cryosections. Similar measurements were made for the distance from labeled rods (dL,rods) and/or cones (dL,cones) to the edge of a lesion site. In cases in which a section was double labeled for rods and cones, the distance between the labeled rod and cone closest to the CGZ (dc,rods-cones) or lesion edge (dL,rods-cones) was determined. Statistical analysis of measurements was performed with either a paired or independent Student's t test, the former when rod and cone measurements were derived from different, but adjacent, sections from the same retina.
Figure 2.

Measurements of rod and cone photoreceptor position relative to the postmetamorphic axes of retinal growth and regeneration. The distance of the rods (dc,rods; dL,rods) and cones (dc,cones; dL,cones) nearest to the CGZ and lesion edge, respectively, are schematically indicated in the top two rows. The IHC labeling patterns of rods (zpr-3) and cones (zpr-1) are represented (see Materials and Methods) (Fig. 7). For sections double labeled with zpr-1 and anti-rhodopsin (bottom row), the distance between the rods and cones nearest to the CGZ (dc,rods-cones) and the lesion edge (d,L,rods-cones) were determined.
Microspectrophotometry. The methodology of microspectrophotometric analysis of individual photoreceptors isolated from postmetamorphic retina was as described previously (Cameron et al., 1997; Cameron, 2002). Briefly, fish were dark-adapted for at least 2 hr, anesthetized, and killed by immersion in 0.1% tricaine methanesulfonate in artificial sea water (Sigma, St. Louis, MO), and photoreceptors were mechanically isolated from the retinas. For premetamorphic fish, photoreceptor isolation was achieved by simultaneous mechanical dissociation of eyes (with extraocular cranial tissue attached) from six fish. The absorbance spectrum of visual pigment within single, isolated photoreceptors was determined using a single beam, photon-counting microspectrophotometer at the MacNichol Microspectrophotometry Facility (Boston University, Boston, MA) (MacNichol, 1978; Levine and MacNichol, 1985) and was measured over the range 375-750 nm. The wavelength of peak absorbance (λmax, in nanometers) was determined for each photoreceptor, and a mean λmax value for each photoreceptor morphology (rod, single cone, or double cone member) was determined. The distributions of λmax values for each photoreceptor morphology were compared with an independent Student's t test.
Results
Photoreceptors and opsins in premetamorphic and postmetamorphic retina
RT-PCR analysis revealed the expression of a putative retinal opsin in premetamorphic flounder. The inferred amino acid sequence of this opsin was determined with conceptual translation, and the seven putative transmembrane-spanning regions were identified, along with important conserved amino acids such as the lysine residue within the seventh transmembrane-spanning domain (Fig. 3) (Stenkamp et al., 2002). Based on the classification scheme of Ebrey and Koutalos (2001), this opsin was of the RH2 class (a green cone opsin), and the inferred amino acid sequence had >93% identity to the “green” cone opsin of a related marine fish, the Atlantic halibut (H. hippoglossus) (Helvik et al., 2001).
Figure 3.

Amino acid sequences and corresponding visual pigment absorbance spectra of winter flounder retinal opsins. Left, The inferred amino acid sequences, derived from conceptual translation of the full-length nucleotide sequences, for the RH2 (green cone), SWS2 (blue cone), LWS (red cone), and RH1 (rod) opsins, placed within a model of opsin secondary structure. Roman numerals indicate hypothesized transmembrane (TM)-spanning regions, and important, conserved amino acids are indicated by filled circles (i.e., thelysine residue in TM VII that is linked via Schiff-base to the chromophore and the glutamic acid counterion in TM III). Hypothesized linkage sites of palmitoyl groups are also indicated (jagged lines extending from cytoplasmic cysteine residues near TM VII). Right, Averaged, normalized absorbance spectra for each of the spectral types of photoreceptors derived from premetamorphic (open symbols) and postmetamorphic (filled symbols) fish, aligned with the corresponding opsin. Although qualitatively similar, the RH2-based pigments of premetamorphic and postmetamorphic fish are significantly different (see Results).
One rod opsin (rhodopsin) and three distinct cone opsins were cloned from postmetamorphic flounder retina using RT-PCR. As above, conceptual translation revealed seven putative transmembrane-spanning regions and important conserved amino acids for each opsin (Fig. 3) (Stenkamp et al., 2002). Phylogenic analysis of the inferred amino acid sequence of the rhodopsin (opsin class RH1) (Ebrey and Koutalos, 2001) revealed a high degree of similarity with the rhodopsins of other teleosts, particularly marine fish (data not shown). The nucleotide sequence of winter flounder rhodopsin, including the untranslated regions at the 3′ and 5′ ends of the mRNA molecule, had 94% identity to the rhodopsin of H. hippoglossus (Helvik et al., 2001); the inferred amino acid sequence had 94% identity to the rhodopsin of H. hippoglossus, and 74% identity to the rhodopsins of both Bos taurus (Nathans and Hogness, 1983) and Homo sapiens (Nathans and Hogness, 1984).
The three cone opsins expressed in postmetamorphic retina were members of the SWS2 (“blue” opsin), RH2 (green opsin), and LWS (“red” opsin) classes (Fig. 3). The RH2 opsin had a nucleotide sequence, and thus an inferred amino acid sequence, identical to that of the premetamorphic RH2 opsin. For all cone opsins, there was >93% amino acid sequence identity with the corresponding opsin of H. hippoglossus (Helvik et al., 2001). RT-PCR analysis with primers designed against the H. hippoglossus UV opsin (GenBank accession number AF156264) (Helvik et al., 2001) failed to produce any amplified product, suggesting that as in the premetamorphic retina, a UV opsin is not expressed in the postmetamorphic retina of winter flounder.
Nonisotopic in situ hybridization was used to determine the patterns of opsin expression in premetamorphic and postmetamorphic retina. In premetamorphic retina, evidence of opsin expression was observed only at the outer nuclear layer (ONL) and only for the RH2 opsin (Fig. 4). In postmetamorphic retina, evidence for rod and cone opsin expression was observed, with all labels localized to the expected regions of the ONL: rhodopsin expression was localized to the perinuclear regions of cells located throughout the ONL, and cone opsin expression was localized to cells at the outer region of the ONL, with cone expression patterns having a generally pyriform profile (Fig. 4) similar to that reported for H. hippoglossus (Helvik et al., 2001). The in situ hybridization analyses indicated a developmental sequence of opsin expression, RH2 cone opsin followed by SWS2 and LWS cone opsins and a RH1 rod opsin, identical to that observed from the RT-PCR experiments.
Figure 4.

In situ hybridization analysis of opsin expression in premetamorphic and postmetamorphic winter flounder retina. The source of reacted cryosections (premetamorphic or postmetamorphic retina) is indicated to the left of each row, and the probe identity-target opsin mRNA (all antisense) is indicated along the top of each column. Corresponding sense probes for each of the opsins revealed no labeling (data not shown). The only opsin expressed in premetamorphic retina is the RH2 (arrows, top two rows), whereas RH2, SWS2, LWS, and RH1 are all expressed in postmetamorphic retina (arrows, bottom row). All of the opsins are expressed only at the ONL and with the expected spatial patterns (Helvik et al., 2001). The broad expression pattern of RH2 in the ONL of premetamorphic fish is consistent with the relatively small size of the cones and the absence of rods in these retinas. The scale bar in the bottom left panel applies to all panels except the middle row, for which the scale bar is 10 μm.
Indirect immunohistochemical (IHC) analyses were performed to independently assess the developmental sequence of cone and rod differentiation. An antibody that selectively labels cone photoreceptors (zpr-1) exhibited substantial labeling in both premetamorphic and postmetamorphic retinas (Fig. 5). A marker for rod photoreceptors (zpr-3), in contrast, labeled rod outer segments in postmetamorphic retina but exhibited no labeling in premetamorphic retinas (Fig. 5). An antibody against rhodopsin displayed labeling profiles similar to that of zpr-3 (Fig. 5). The indirect IHC analysis was thus consistent with the RT-PCR and in situ hybridization analyses in suggesting a cone-to-rod progression of photoreceptor differentiation during development.
Figure 5.

Indirect IHC analysis of rod and cone presence in premetamorphic and postmetamorphic winter flounder retina. The source of reacted cryosections (premetamorphic or postmetamorphic retina) is indicated to the left of each row, and the identity of the screened primary antibody is indicated along the top of each column. Cones, as labeled by zpr-1, are evident in both premetamorphic and postmetamorphic retinas (left column). Rods, as labeled by either zpr-3 (middle column) or anti-rhodopsin (right column), are evident in postmetamorphic retina (both antibodies label an antigen located at the outer segments) but are absent from premetamorphic retina (arrows indicate the regions of expected labeling; i.e., the location of photoreceptor outer segments). The scale bar applies to all panels.
Microspectrophotometric (MSP) analysis of individual photoreceptors was performed to verify both the developmental sequence of photoreceptor differentiation and the “functionality” of the cloned opsins. The only photoreceptor morphology observed from premetamorphic flounder was the single cone, whereas rod and cone photoreceptors were readily dissociated and identifiable from postmetamorphic retina, with the single and double cone morphologies observed. These observed photoreceptor morphologies were consistent with previous reports (Levine and MacNichol, 1979; Evans and Fernald, 1993; Evans et al., 1993).
All absorbance spectra were consistent with 11-cis-retinal-based visual pigments (Govardovskii et al., 2000), all pigments could be bleached, and the specific density for all visual pigments at the wavelength of peak absorbance, λmax, was similar to that reported for other teleosts (data not shown) (Hárosi, 1975). The visual pigment of single cones derived from premetamorphic flounder had a λmax at 520 ± 8 nm (n = 13 samples) (Fig. 3), consistent with an opsin of the RH2 class; no other visual pigments were observed. This visual pigment was not significantly different from that reported previously for premetamorphic flounder retina (Evans et al., 1993), and the distribution of the measured λmax values was significantly different from those of the postmetamorphic flounder pigments (p ≪ 0.001; see below). The MSP analysis of premetamorphic photoreceptors confirmed the opsin expression analyses and indicated that the premetamorphic retina likely supports only monochromatic processing of the visual scene.
The postmetamorphic retina contained photoreceptors with different visual pigments. Rod photoreceptors contained a middle wavelength visual pigment with λmax at 509 ± 5 nm (mean ± SD; n = 31), consistent with a RH1 opsin. Single cones of postmetamorphic retina, but no rods or double cones, always contained a short wavelength pigment with λmax at 461 ± 7 nm (n = 60), consistent with a SWS2 opsin but not a RH2 opsin. Two other cone pigments were observed for postmetamorphic retina, both of which were located in members of double cones. These pigments had λmax values of 529 ± 3 nm (n = 50) and 547 ± 6 nm (n = 10), were not significantly different from the double cone pigments previously described for postmetamorphic winter flounder (Evans et al., 1993), and were consistent with an RH2 and LWS opsin, respectively. There was no evidence for a UV pigment in any of the analyzed photoreceptors. The presence of three distinct cone pigments in the postmetamorphic retina indicated a physical substrate for trichromatic processing of the visual scene, and the presence of rods suggested a mechanism for enhanced absolute visual sensitivity compared with premetamorphic fish. Although the same RH2 opsin was expressed in premetamorphic and postmetamorphic retinas, the associated green cone pigments were significantly different and were assigned to different cone morphologies. The apparent dichotomy between RH2 opsin expression and the associated visual pigments is considered below (see Discussion).
The independent analyses of RT-PCR, in situ hybridization, IHC, and MSP all revealed an overt, developmental sequence of photoreceptor differentiation in the winter flounder retina. This sequence consists of two general components: (1) a temporal progression of photoreceptor class, with cones produced before rods, and (2) a temporal progression of cone subtypes, with the RH2 cone opsin expressed before the other cone opsins and changing its assignment from the single-cone to the double-cone morphology. These sequences of photoreceptor differentiation are developmentally correlated with the metamorphic transition.
Patterns of photoreceptors and opsins during postmetamorphic retinal growth and regeneration
The sequence of rod and cone differentiation was analyzed with respect to the axes of retinal growth and regeneration in the postmetamorphic retina. The patterns of PCNA-positive cells in postmetamorphic retina confirmed the presence of (1) a proliferative neuroepithelium at the retinal margin (i.e., the CGZ), and (2) an apparent regenerative blastema at the edge of lesions (Fig. 6) (Hitchcock et al., 1992). These observations support the hypotheses that the adult winter flounder retina grows via cellular production at the CGZ and that the lesioned retina does regenerate.
Figure 6.
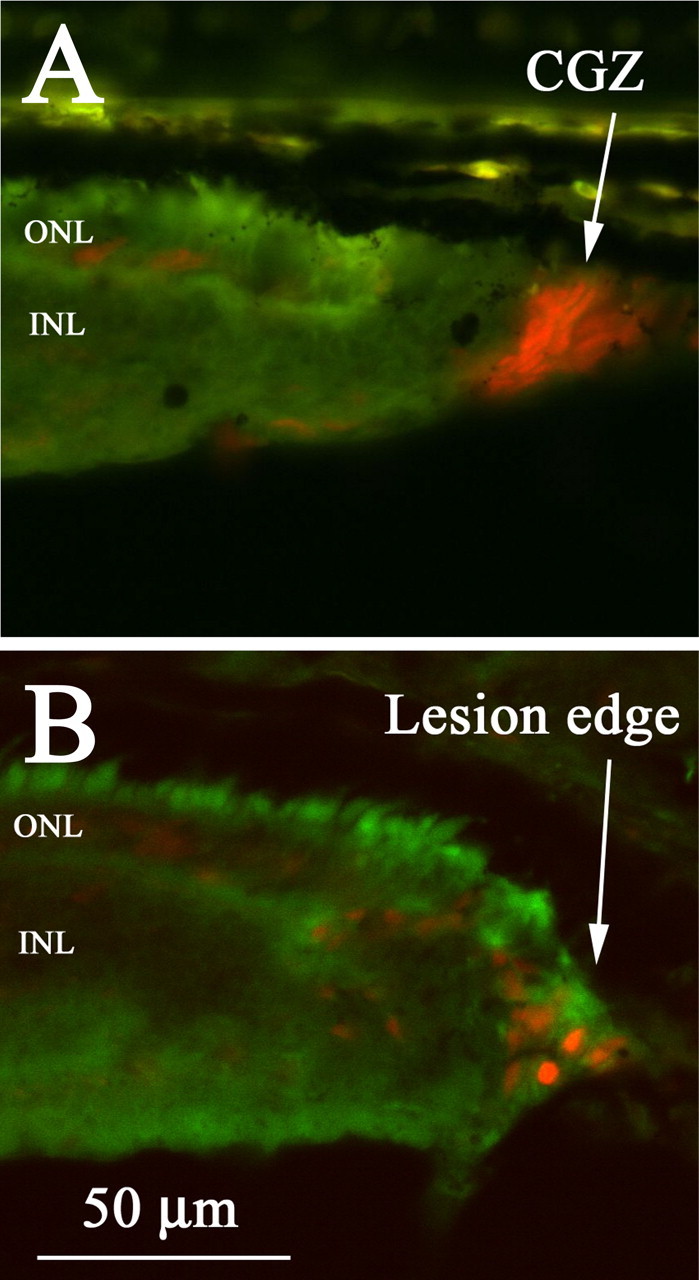
Proliferative cells located at the margin and lesion edge of postmetamorphic flounder retina. A, PCNA-positive cells are located at the CGZ, a proliferative neuroepithelium at the retinal margin that generates and adds new cells to the retina. B, PCNA-positive cells are located at the edge of retinal lesion sites, consistent with the presence of a regenerative blastema from which regenerated retinal cells are produced (Hitchcock et al., 1992).
The labeling patterns of photoreceptor-specific antibodies and antisense cRNA probes indicated a sequence of photoreceptor differentiation during postmetamorphic retinal growth and regeneration. Specifically, cone photoreceptors (labeled with the zpr-1 antibody) were always located closer to the CGZ and lesion edge than rods (labeled with either the zpr-3 or anti-rhodopsin antibodies) (Fig. 7, compare green and red arrows). Because of the appositional nature of cellular addition from these cytogenic regions and because photoreceptors located closest to the cytogenic regions include the youngest cohort, the labeling pattern was consistent with the first cones being generated before the first rods within growing and regenerating retina. The in situ hybridization analyses supported this interpretation: cone opsin expression was always located closer to the cytogenic regions than rod opsin expression (Fig. 8). The differential labeling patterns of rods and cones were apparently not caused by intrinsic or induced patterns of rod death, because no evidence of TUNEL-positive cells was observed at the CGZ (data not shown), and TUNEL-positive cells at lesion sites were spatially restricted to the extreme edge of the lesion (Fig. 9). That is, the ONL adjacent to the lesion edge, wherein cones are evident but rods are apparently absent (Fig. 8), was not spatially coincident with those cells exhibiting evidence of death (Fig. 9).
Figure 7.

Indirect IHC analysis of photoreceptor differentiation during postmetamorphic retinal growth and regeneration. The identity of the screened primary antibodies (zpr-1, zpr-3, or combined zpr-1 and anti-rhodopsin) is indicated to the left of each row, and the retinal assembly condition (growth from the CGZ or regeneration from the edge of a lesion site) is indicated along the top of each column. The green and red arrows indicate the estimated distance from the CGZ or lesion site to the nearest cone or rod photoreceptor, respectively. Note that in both conditions of retinal assembly, the length of the red arrows always exceeds that of the corresponding green arrows (see Fig. 2; quantification is presented in Fig. 10), consistent with a cone-to-rod sequence of photoreceptor differentiation (see Results).
Figure 8.

In situ hybridization analysis of photoreceptor differentiation during regeneration of the postmetamorphic winter flounder retina. The sections, which were sequentially collected from the same retina 35 d after lesion, were screened with antisense cRNA probes against RH2, SWS2, LWS, or RH1, as indicated. The distance from the lesion edge to the nearest labeled cone or rod is indicated by the blue or red arrow, respectively. An equivalent blue arrow is present for the RH2, SWS2, and LWS panels and is superimposed on the RH1 panel for direct comparison with the red arrow. The length of the red arrow exceeds that of the superimposed blue arrow (note also the RH1-free region of ONL nearest to the lesion edge), consistent with a cone-to-rod differentiation sequence during postmetamorphic retinal regeneration (Fig. 7) (see Results). The scale bar applies to all panels.
Figure 9.

Injury-induced cell death in postmetamorphic winter flounder retina. Cells exhibiting evidence of apoptosis were labeled using the TUNEL method (see Materials and Methods) at 7 d (A) and 26 d (B) after lesion. A, TUNEL-positive cells (red arrows) are located at the extreme edge of the lesion site, in this case near the corner of a square-shaped lesion (Cameron and Easter, 1995). Note the relative dearth of TUNEL-positive cells within the extant retina, particularly within the ONL, although the reaction has been overexposed in an effort to reveal all TUNEL-positive cells. PE, Pigmented epithelium. B, No TUNEL-positive cells are evident at the edge of a lesion site (red arrows) at 26 d after lesion.
No evidence was observed for a differential sequence of cone differentiation during retinal growth or regeneration. Analysis of the in situ hybridization patterns revealed that the distances of each of the expressed cone opsins to the regions of cytogenesis (CGZ or lesion edge) did not differ (Fig. 8, compare the equivalent-length blue arrows on each panel). This result differed from the temporal progression of cone opsin expression observed during retinal development, in which RH2 is expressed first, followed by the SWS2 and LWS cone opsins (Fig. 4).
Quantification of the labeling patterns of cones and rods, referenced to the spatial axes of retinal growth and regeneration (see Materials and Methods) (Fig. 2), supported the qualitative assessment of a cone-to-rod differentiation sequence. The closest photoreceptor class to the CGZ was always the cone (Fig. 10A,B) (p < 0.005). At the lesion edge, a differential pattern of cone and rod labeling became evident after a delay of ∼1-2 weeks, with the closest photoreceptor class to the legion edge always being the cone. As measured by (dL,rods-dL,cones) and (dL,rods-cones) (Fig. 2), this differential pattern achieved and maintained a statistically significant amplitude between 2 and 8 weeks after lesion (p < 0.04) (Fig. 10C,D). After this period, the differential pattern returned toward the control level (Fig. 10C); that is, as the lesion site was resolved with regenerated retinal cells, overlapping sheets of rods and cones were formed, contiguous with the extant retina.
Figure 10.

Quantification of photoreceptor differentiation sequence during growth and regeneration of postmetamorphic winter flounder retina. The measured parameters are schematized on Figure 2. A, The relative distances between the CGZ and the nearest rods (zpr-3) and cones (zpr-1) as a function of time after lesion (dc,rods/dc,cone; mean ± SE). The solid horizontal line indicates the pooled mean value. Because all values are significantly greater than unity, a cone-to-rod differentiation sequence was inferred. B, The absolute distance between the rods (anti-rhodopsin) and cones (zpr-1) nearest to the CGZ as a function of time after lesion (dc,rods-cones; mean ± SE). The solid horizontal line indicates the pooled mean value. Because all values are significantly greater than zero, a cone-to-rod differentiation sequence was inferred. C, The relative distances between the lesion edge and the nearest rods (zpr-3) and cones (zpr-1) as a function of time after lesion (dL,rod/dL,cone; mean ± SE). After a delay of ∼1 week, the relative distances increase, with cones always closer to the lesion edge than rods. At 90 d after lesion, the relative distances return to control values (see Results). The maximal values closely match those of the CGZ (A), indicating similar relative dynamics of the cone-to-rod differentiation sequence during retinal growth and regeneration (see Discussion). D, The absolute distance between the rods (anti-rhodopsin) and cones (zpr-1) nearest to the lesion edge as a function of time after lesion (dL,rods-cones; mean ± SE). Because all values are significantly greater than zero, a cone-to-rod differentiation sequence was inferred. Note the similarity in temporal progression with C, including the delay phase. Also, compared with the values associated with normal postmetamorphic retinal growth (B), the elevated values between 2 and 5 weeks after lesion suggest that cytogenesis occurs at a faster absolute rate during regeneration than during normal retinal growth (see Discussion).
The in situ hybridization and indirect IHC analyses indicated, both qualitatively and quantitatively, that a developmental sequence of photoreceptor differentiation in which cones are produced before rods is recapitulated during postmetamorphic retinal growth and regeneration. In contrast, the developmental sequence of cone subtype differentiation, in which RH2-expressing cones are produced before SWS2- and LWS-expressing cones, was apparently absent during postmetamorphic retinal growth and regeneration.
Discussion
In the current study, several independent techniques (RT-PCR, in situ hybridization, IHC, and MSP) were used to assess the sequence of photoreceptor differentiation in the winter flounder retina. A general order of photoreceptor differentiation was consistently observed, in which the differentiation of photoreceptor class (cone vs rod) always displayed a cone-to-rod progression, regardless of the context of retinal assembly (i.e., development, adult growth, or adult regeneration). In contrast, the developmental order of cone differentiation (as assessed by patterns of cone opsin expression), and thus the underlying control mechanism, changed after metamorphosis. Below we present interpretations of these results within the contexts of retinal regeneration, visual pigment physiology, and hypothesized mechanisms for controlling photoreceptor differentiation in this model system.
Retinal regeneration recapitulates developmental mechanisms
The retinas of adult fish can regenerate cells that are lost because of injury (for review, see Raymond and Hitchcock, 2000; Stenkamp and Cameron, 2002; Otteson and Hitchcock, 2003). The mechanisms that enable this regenerative phenomenon are unclear, and a fundamental question involves whether regeneration might require a precise spatiotemporal recapitulation of the cellular and molecular mechanisms that drive retinal development. The results of the current study suggest that retinal regeneration apparently includes a recapitulation of developmental mechanisms. Specifically, the differentiation sequence of photoreceptor class during regeneration, and by implication the underlying control mechanisms, matched that of normal development, with cones produced before rods, as reported previously for regenerating goldfish retina (Raymond, 1991). Quantification of the order of photoreceptor differentiation revealed that although the relative progression of cones to rods during regeneration matched that of normal retinal growth (Fig. 10, compare A, C), the absolute distances between the cones and rods nearest to the cytogenic regions was approximately fourfold greater during regeneration (Fig. 10, compare B, D). This result was interpreted as being consistent with the operation of a common control mechanism for “cones first” differentiation during growth and regeneration but a substantially faster rate of cytogenesis during regeneration. A physical analogy involves the sequential but temporally coincident placement of objects onto conveyor belts that are moving at different rates. The relative distances traveled by each object on a given conveyor will be the same for both conveyors, but the absolute distance between the objects will be greater for the conveyor moving at the faster rate; the objects on the faster conveyor will also travel a greater distance per unit time than their counterparts on the slower conveyor.
The lack of an overt sequence in cone differentiation during postmetamorphic retinal regeneration matched the situation observed for normal, postmetamorphic retinal growth. This result suggests the operation of an underlying control mechanism that, although perhaps equivalent for postmetamorphic growth and regeneration, is in some fundamental way different from that in operation during premetamorphic retinal development. We hypothesize that thyroid hormone signaling is a candidate mechanism (see below).
Does one opsin manifest two pigments?
A curious observation from the current study, which adds to previous investigations of visual pigments in winter flounder (Levine and MacNichol, 1979; Evans et al., 1993), is that a single RH2 opsin, expressed in both premetamorphic and postmetamorphic retinas, apparently contributes to visual pigments that have significantly different absorbance spectra. A potential explanation is that distinct RH2 opsins are expressed in premetamorphic and postmetamorphic retina, but the RT-PCR analysis revealed only one of them, and the RH2 cRNA probe used in the in situ hybridization experiments, which was >500 nt long, successfully hybridized with the mRNA of both of these hypothesized opsins. Another explanation is that a developmental change in chromophore content (Beatty, 1984) might account for the 9 nm red shift in the λmax of the RH2 pigment. Although the absorbance spectra of all the measured pigments are consistent with a single chromophore (11-cis-retinal) (Govardovskii et al., 2000), as was also reported previously (Evans et al., 1993), the analysis of Hárosi (1994) suggests that a mixture of 11-cis-retinal and 3-dehydroretinal might account for the observed λmax shift. Last, we note that elevations in [Cl-] can induce red shifts in the λmax of some visual pigments (Crescitelli, 1977; Kleinschmidt and Hárosi, 1992; Wang et al., 1993; Ebrey and Koutalos, 2001; Hirano et al., 2001), and that the environments occupied by premetamorphic and postmetamorphic flounder (pelagic in-shore vs benthic off-shore) might differ in [Cl-] in a manner consistent with the observed red shift (Klein-MacPhee, 1978; Buckley, 1989). The RH2 sequence, however (Fig. 3), apparently lacks the appropriate Cl--sensitive amino acids (Wang et al., 1993; Ebrey and Koutalos, 2001). A physical explanation for the developmental red shift in the RH2-based visual pigment or pigments therefore remains unclear, but our evidence suggests that a single opsin protein can manifest distinct visual pigments in the flounder retina.
Photoreceptor differentiation: hypothesized roles for thyroid hormone signaling
A substantial reorganization of the flounder retina occurs during development: the cone-only retina of premetamorphic fish, possessing single cones that express only one type of opsin (RH2), progresses to a duplex architecture of RH1-expressing rods and cones that express one of three distinct cone opsins (SWS2, RH2, or LWS). The visual correlates of these developmental modifications are likely to be significant: premetamorphic animals most likely have monochromatic cone-mediated vision and relatively low scotopic (night-time) sensitivity, whereas postmetamorphic animals possess the physical substrates for trichromatic “color” vision and relatively high scotopic sensitivity. Winter flounder are reported to be visual feeders (Olla et al., 1969), and the adaptive value of these developmental changes in vision might involve aspects of prey acquisition, and perhaps many other behaviors, that are germane to the environments occupied by the premetamorphic and postmetamorphic animals (Douglas et al., 2003).
The substantial developmental changes in the cellular and molecular organization of the retina are directly associated with metamorphosis. Because flounder metamorphosis is driven by TH signaling mechanisms (Miwa and Inui, 1987; Miwa et al., 1988), a controlling function for TH in photoreceptor differentiation is therefore suggested. Regarding the potential role of TH signaling mechanisms in the differentiation of photoreceptor class (cones vs rods), our data admit two competing interpretations. First, the cone-to-rod differentiation sequence might be independent of TH signaling. This interpretation is suggested by the presence of a cone-to-rod progression during retinal assembly contexts that differed in their TH levels (low in premetamorphic animals, higher in postmetamorphic animals; the latter has been confirmed in postmetamorphic winter flounder by radioimmunoassay) (our unpublished observations). If the elevated levels of TH in postmetamorphic retina enable the differentiation of the rod phenotype, for example, one might have expected the first rods and first cones to be formed simultaneously during postmetamorphic retinal growth and regeneration. Furthermore, although the initial cones and rods can form simultaneously in model systems that do not exhibit an overt metamorphic transition (Kunz et al., 1983), a cone-to-rod sequence has been reported in nonmetamorphic systems (e.g., goldfish) (Raymond, 1985), and during zebrafish development rod differentiation occurs before cone differentiation (Stenkamp et al., 1996). These observations suggest, if indirectly, that the cone-to-rod differentiation sequence in winter flounder might be independent of TH signaling mechanisms.
An alternative interpretation is that the differentiation of photoreceptor class is dependent on TH signaling. In this scenario, elevated TH is required for rods to be formed, but there is an obligatory temporal delay between the ultimate differentiation of the cone and rod phenotypes. This model admits both the lack of rods in premetamorphic animals and the cone-to-rod progression observed in growing and regenerating postmetamorphic retina. Experiments involving direct manipulation of TH levels in postmetamorphic fish (Miwa and Inui, 1987; Schreiber and Specker, 1998) could resolve these two alternatives.
Photoreceptor differentiation also involves the regulation of cone opsin expression. Data from the current study suggest that the underlying control mechanism or mechanisms change after metamorphosis: the developmental progression of cone opsin expression, in which the RH2 opsin is expressed before SWS2 and LWS, was not evident during postmetamorphic retinal growth and regeneration. Because TH increases after metamorphosis, and because TH is known to affect photoreceptor development in other systems, TH signaling presents itself as a candidate mechanism for determining temporal aspects of cone differentiation in this model system. Within this hypothesized scheme, the differentiation of SWS2-expressing and LWS-expressing cones is predicted to require TH, whereas RH2-expressing cones, which are present in both premetamorphic (low TH) and postmetamorphic (high TH) retinas, might be independent of TH signaling. Differential effects of this type would indicate nonuniformity in the mechanisms that control the in vivo expression patterns of individual cone opsins, perhaps including the assignment of opsin expression to particular cone morphologies (single and double cones). As above, experimental manipulations of TH in postmetamorphic fish could test these hypothesized functions of TH signaling, which in turn would motivate detailed molecular analysis of the TH signaling components (receptors, cofactors, response elements, etc.) (Zhang and Lazar, 2000) that operate in this model system.
Footnotes
We thank Sandra Mooney, Eric Olson, Melinda Tyler, and Patrick Yurco for helpful discussions and comments on this manuscript; Hunt Howell (Coastal Marine Laboratory, University of New Hampshire, New Castle, NH) for supplying biological materials; Barry Knox (State University of New York, Upstate) for supplying the anti-rhodopsin antibody; and Clay Smith (University of Florida) for originally instructing us in the methods of molecular cloning.
Correspondence should be addressed to David A. Cameron, Department Neuroscience and Physiology, State University of New York, Upstate Medical University, 750 East Adams Street, Syracuse, NY 13210. E-mail: camerond@upstate.edu.
Copyright © 2004 Society for Neuroscience 0270-6474/04/2411463-10$15.00/0
References
- Barthel LK, Raymond PA (1993) Subcellular localization of alpha-tubulin and opsin mRNA in the goldfish retina using digoxigenin-labeled cRNA probes detected by alkaline phosphatase and HRP histochemistry. J Neurosci Methods 50: 145-152. [DOI] [PubMed] [Google Scholar]
- Beatty DD (1984) Visual pigments and the labile scotopic visual system of fish. Vision Res 24: 1563-1573. [DOI] [PubMed] [Google Scholar]
- Browman HI, Hawryshyn CW (1992) Thyroxine induces a precocial loss of ultraviolet photosensitivity in rainbow trout (Oncorhynchus mykiss, Teleostei). Vision Res 32: 2303-2312. [DOI] [PubMed] [Google Scholar]
- Buckley J (1989) Species profiles: life histories and environmental requirements of coastal fishes and invertebrates (North Atlantic): Winter flounder. United States Fish and Wildlife Service, Biol Rep 82 (11.87), United States Army Corps of Engineers, TR EL-82-4.
- Cameron DA (2000) Cellular proliferation and neurogenesis in the injured retina of adult zebrafish. Vis Neurosci 17: 789-797. [DOI] [PubMed] [Google Scholar]
- Cameron DA (2002) Mapping cone fractions, absorbance spectra, and neuronal mechanisms to photopic visual sensitivity in the zebrafish. Vis Neurosci 19: 365-372. [DOI] [PubMed] [Google Scholar]
- Cameron DA, Carney LH (2000) Cell mosaic patterns in the native and regenerated inner retina of zebrafish: implications for retinal assembly. J Comp Neurol 416: 356-367. [PubMed] [Google Scholar]
- Cameron DA, Easter Jr SS (1995) Cone photoreceptor regeneration in adult fish retina: phenotypic determination and mosaic pattern formation. J Neurosci 15: 2255-2271. [DOI] [PMC free article] [PubMed] [Google Scholar]
- Cameron DA, Cornwall MC, MacNichol Jr EF (1997) Visual pigment assignments in regenerated retina. J Neurosci 17: 917-923. [DOI] [PMC free article] [PubMed] [Google Scholar]
- Chambers RC, Leggett WC (1987) Size and age at metamorphosis in marine fishes: an analysis of laboratory-reared winter flounder (Pseudopleuronectes americanus) with a review of variation in other species. Can J Fish Aquat Sci 44: 1936-1947. [Google Scholar]
- Consoulas C, Duch C, Bayline RJ, Levine RB (2000) Behavioral transformations during metamorphosis: remodeling of neural and motor systems. Brain Res Bull 53: 571-583. [DOI] [PubMed] [Google Scholar]
- Cossette SMM, Drysdale TA (2004) Early expression of thyroid hormone receptor β and retinoid X receptor γ in the Xenopus embryo. Differentiation 72: 239-249. [DOI] [PubMed] [Google Scholar]
- Crescitelli F (1977) Ionochromic behavior of Gecko visual pigments. Science 195: 187-188. [DOI] [PubMed] [Google Scholar]
- Denver RJ (1998) The molecular basis of thyroid hormone-dependent central nervous system remodeling during amphibian metamorphosis. Comp Biochem Physiol 119: 219-228. [DOI] [PubMed] [Google Scholar]
- Denver RJ, Pavgi S, Shi Y-B (1997) Thyroid hormone-dependent gene expression program for Xenopus neural development. J Biol Chem 272: 8179-8188. [DOI] [PubMed] [Google Scholar]
- Douglas RH, Bowmaker JK, Hunt DM (2003) Spectral sensitivity tuning in the deep-sea. In: Sensory processing in aquatic environments (Collin SP, Marshall NJ, eds), pp 323-342. Berlin: Springer.
- Ebrey T, Koutalos Y (2001) Vertebrate photoreceptors. Prog Retin Eye Res 20: 49-91. [DOI] [PubMed] [Google Scholar]
- Evans BI, Fernald RD (1993) Retinal transformation at metamorphosis in the winter flounder (Pseudopleuronectes americanus). Vis Neurosci 10: 1055-1064. [DOI] [PubMed] [Google Scholar]
- Evans BI, Hárosi FI, Fernald RD (1993) Photoreceptor spectral absorbance in larval and adult winter flounder (Pseudopleuronectes americanus). Vis Neurosci 10: 1065-1071. [DOI] [PubMed] [Google Scholar]
- Fyhrquist N, Donner K, Hargrave PA, McDowell JH, Popp MP, Smith WC (1998) Rhodopsins from three frog and toad species: sequences and functional comparisons. Exp Eye Res 66: 295-305. [DOI] [PubMed] [Google Scholar]
- Govardovskii VI, Fyhrquist N, Reuter T, Kuzmin DG, Donner K (2000) In search of the visual pigment template. Vis Neurosci 17: 509-528. [DOI] [PubMed] [Google Scholar]
- Graf W, Baker R (1990) Neuronal adaptation accompanying metamorphosis in the flatfish. J Neurobiol 21: 1136-1152. [DOI] [PubMed] [Google Scholar]
- Hárosi FI (1975) Absorption spectra and linear dichroism of some amphibian photoreceptors. J Gen Physiol 66: 357-382. [DOI] [PMC free article] [PubMed] [Google Scholar]
- Hárosi FI (1994) An analysis of two spectral properties of vertebrate visual pigments. Vision Res 34: 1359-1367. [DOI] [PubMed] [Google Scholar]
- Harpavat S, Cepko CL (2003) Thyroid hormone and retinal development: an emerging field. Thyroid 13: 1013-1019. [DOI] [PubMed] [Google Scholar]
- Helvik JV, Drivenes O, Naess TH, Fjose A, Seo HC (2001) Molecular cloning and characterization of five opsin genes from the marine flatfish Atlantic halibut (Hippoglossus hippoglossus). Vis Neurosci 18: 767-780. [DOI] [PubMed] [Google Scholar]
- Hirano T, Imai H, Kandori H, Shichida Y (2001) Chloride effect on iodopsin studied by low-temperature visible and infrared spectroscopies. Biochemistry 40: 1385-1392. [DOI] [PubMed] [Google Scholar]
- Hitchcock PF, Lindsey Myhr KJ, Easter Jr SS, Mangione-Smith R, Jones DD (1992) Local regeneration in the retina of the goldfish. J Neurobiol 23: 187-203. [DOI] [PubMed] [Google Scholar]
- Hoskins SG (1990) Metamorphosis of the amphibian eye. J Neurobiol 21: 970-989. [DOI] [PubMed] [Google Scholar]
- Inui Y, Miwa S (1985) Thyroid hormone induces metamorphosis of flounder larvae. Gen Comp Endocrinol 60: 450-454. [DOI] [PubMed] [Google Scholar]
- Johns PR (1977) Growth of the adult goldfish eye. III. Source of the new retinal cells. J Comp Neurol 176: 343-357. [DOI] [PubMed] [Google Scholar]
- Kelley MW, Turner JK, Reh TA (1995) Ligands of steroid/thyroid receptors induce cone photoreceptors in vertebrate retina. Development 121: 3777-3785. [DOI] [PubMed] [Google Scholar]
- Klein-MacPhee G (1978) Synopsis of biological data for the winter flounder, Pseudopleuronectes americanus (Waldbaum). FAO Fisheries Synopsis No. 117, United States Department of Commerce.
- Kleinschmidt J, Hárosi FI (1992) Anion sensitivity and spectral tuning of cone visual pigments in situ Proc Natl Acad Sci USA 89: 9181-9185. [DOI] [PMC free article] [PubMed] [Google Scholar]
- Kunz YW, Ennis S, Wise C (1983) Ontogeny of the photoreceptors in the embryonic retina of the viviparous guppy, Poecilia reticulata P (Teleostei). Cell Tissue Res 230: 469-486. [DOI] [PubMed] [Google Scholar]
- Levine JS, MacNichol Jr EF (1979) Visual pigments in teleosts fishes: effects of habitat, microhabitat and behavior on visual system evolution. Sens Proc 3: 95-131. [PubMed] [Google Scholar]
- Levine JS, MacNichol Jr EF (1985) Microspectrophotometry of primate photoreceptors: art, artifact, and analysis. In: The visual system (Fein A, Levine JS, eds), pp 73-78. New York: Liss.
- MacNichol Jr EF (1978) A photon-counting microspectrophotometer for the study of single vertebrate photoreceptor cells. In: Frontiers of visual science (Cool SJ, Smith EL, eds), pp 194-208. Berlin: Springer.
- Miller JM, Burke JS, Fitzhugh GR (1991) Early life history patterns of Atlantic North American flatfish: likely (and unlikely) factors controlling recruitment. Neth J Sea Res 27: 261-275. [Google Scholar]
- Miwa S, Inui Y (1987) Effects of various doses of thyroxine and triiodothyronine on the metamorphosis of flounder (Paralichthys olivaceus). Gen Comp Endocrinol 67: 356-363. [DOI] [PubMed] [Google Scholar]
- Miwa S, Tagawa M, Inui Y, Hirano T (1988) Thyroxine surge in metamorphosing flounder larvae. Gen Comp Endocrinol 70: 158-163. [DOI] [PubMed] [Google Scholar]
- Nathans J, Hogness DS (1983) Isolation, sequence analysis, and intron-exon arrangement of the gene encoding bovine rhodopsin. Cell 34: 807-814. [DOI] [PubMed] [Google Scholar]
- Nathans J, Hogness DS (1984) Isolation and nucleotide sequence of the gene encoding human rhodopsin. Proc Natl Acad Sci USA 81: 4851-4855. [DOI] [PMC free article] [PubMed] [Google Scholar]
- Ng L, Hurley JB, Dierks B, Srinivas M, Salto C, Vennstrom B, Reh TA, Forrest D (2001) A thyroid hormone receptor that is required for the development of green cone photoreceptors. Nat Gen 27: 94-98. [DOI] [PubMed] [Google Scholar]
- Olla BL, Wicklund R, Wilk S (1969) Behavior of winter flounder in a natural habitat. Trans Am Fish Soc 98: 717-720. [Google Scholar]
- Otteson DC, Hitchcock PF (2003) Stem cells in the teleost retina: persistent neurogenesis and injury-induced regeneration. Vision Res 43: 927-936. [DOI] [PubMed] [Google Scholar]
- Power DM, Llewellyn L, Faustino M, Nowell MA, Bjornsson BT, Einarsdottir IE, Canario AV, Sweeney GE (2001) Thyroid hormones in growth and development of fish. Comp Biochem Physiol C Toxicol Pharmacol 130: 447-459. [DOI] [PubMed] [Google Scholar]
- Raymond PA (1985) Cytodifferentiation of photoreceptors in larval goldfish: delayed maturation of rods. J Comp Neurol 236: 90-105. [DOI] [PubMed] [Google Scholar]
- Raymond PA (1991) Retinal regeneration in teleosts fish. Ciba Found Symp 160: 171-186. [DOI] [PubMed] [Google Scholar]
- Raymond PA, Hitchcock PF (2000) How the neural retina regenerates. Results Probl Cell Differ 31: 197-218. [DOI] [PubMed] [Google Scholar]
- Schreiber AM, Specker JL (1998) Metamorphosis in the summer flounder (Paralichthys dentatus): stage-specific developmental response to altered thyroid status. Gen Comp Endocrinol 111: 156-166. [DOI] [PubMed] [Google Scholar]
- Sevilla-Romero E, Munoz A, Pinazo-Duran MD (2002) Low thyroid hormone levels impair the perinatal development of the rat retina. Ophthalmic Res 34: 181-191. [DOI] [PubMed] [Google Scholar]
- Shand J, Archer MA, Collin SP (1999) Ontogenetic changes in the retinal photoreceptor mosaic in a fish, the black bream, Acanthopagrus butcheri J Comp Neurol 412: 203-217. [DOI] [PubMed] [Google Scholar]
- Shand J, Hart NS, Thomas N, Partridge JC (2002) Developmental changes in the cone visual pigments of black bream Acanthopagrus butcheri J Exp Biol 205: 3661-3667. [DOI] [PubMed] [Google Scholar]
- Stenkamp DL, Cameron DA (2002) Cellular pattern formation in the retina: retinal regeneration as a model system. Mol Vision 8: 280-293. [PubMed] [Google Scholar]
- Stenkamp DL, Hisatomi O, Barthel LK, Tokunaga F, Raymond PA (1996) Temporal expression of rod and cone opsins in embryonic goldfish retina predicts the spatial organization of the cone mosaic. Invest Ophthalmol Vis Sci 37: 363-376. [PubMed] [Google Scholar]
- Stenkamp RE, Filipek S, Driessen CA, Teller DC, Palczewski K (2002) Crystal structure of rhodopsin: a template for cone visual pigments and other G protein-coupled receptors. Biochim Biophys Acta 1565: 168-182. [DOI] [PubMed] [Google Scholar]
- Tata JR (1999) Amphibian metamorphosis as a model for studying the developmental actions of thyroid hormone. Biochimie 81: 359-366. [DOI] [PubMed] [Google Scholar]
- Truman JW (1996) Steroid receptors and nervous system metamorphosis in insects. Dev Neurosci 18: 87-101. [DOI] [PubMed] [Google Scholar]
- Wang Z, Asenjo AB, Oprian DD (1993) Identification of the Cl--binding site in the human red and green color vision pigments. Biochemistry 32: 2125-2130. [DOI] [PubMed] [Google Scholar]
- Weeks JC, Jacobs GA, Pierce JT, Sandstrom DJ, Streichert LC, Trimmer BA, Wiel DE, Wood ER (1997) Neural mechanisms of behavioral plasticity: metamorphosis and learning in Manduca sexta Brain Behav Evol 50[Suppl 1] 69-80. [DOI] [PubMed] [Google Scholar]
- Zhang J, Lazar MA (2000) The mechanism of action of thyroid hormones. Annu Rev Physiol 62: 439-466. [DOI] [PubMed] [Google Scholar]