Abstract
We have developed an innovative way to establish a functional bridge around a spinal lesion. We disconnected the T13 nerve from its muscle targets, leaving the proximal end intact. The cut end was inserted either into an intact spinal cord, to assess regeneration of T13 axons into the cord and synapse formation with spinal neurons, or caudal to a hemisection at L2/3, to assess restoration of function below the injury. Four to 28 weeks later, anterograde tracers indicated that axons from the inserted T13 nerve regenerated into the ventral horn, the intermediate zone, and dorsal horn base, both in intact and hemisected animals. Antibodies to cholinergic markers showed that many regenerating axons were from T13 motoneurons. Electrical stimulation of the T13 nerve proximal to the insertion site 4 weeks or more after insertion into the intact cord evoked local field potentials in the intermediate zone and ventral horn, which is where T13 axons terminated. Stimulation of T13 in 71% of the animals (8 hemisected, 7 intact) evoked contraction of the back or leg muscles, depending on the level of insertion. Animals in which T13 was inserted caudal to hemisection had significantly less spasticity and muscle wasting and greater mobility at the hip, knee, ankle, and digits in the ipsilateral hindlimb than did animals with a hemisection only. Thus, T13 motor axons form novel synapses with lumbosacral motor circuits. Because the T13 motor neurons retain their connections to the brain, these novel circuits might restore voluntary control to muscles paralyzed below a spinal lesion.
Keywords: spinal cord injury, regeneration, injury bypass, peripheral nerve, motoneuron, rat
Introduction
Most efforts to restore function after spinal injury have been directed toward promoting regeneration of severed axons through the injury site, but this approach has met with limited success (Behar et al., 2000). An alternative strategy is to create a “bypass” to guide axons around the injury and into the cord, where they can synapse on undamaged intrinsic circuits, to help reestablish motor control in patients with spinal injuries (Barbeau et al., 1999; Rossignol, 2000). In their pioneering studies, David and Aguayo (1981) grafted an isolated segment of peripheral nerve between two CNS sites to create a conduit for bidirectional regeneration. This approach established communication between the eye and the optic tectum to bypass optic nerve damage (Keirstead et al., 1989). A major limitation to using a nerve segment as the bridge is that there is no a priori reason that a given neuron type will extend axons into it. Given their diversity, it is likely that many neuron phenotypes will not respond to trophic factors in the nerve implant. Consequently, the number of axons regenerating into the bridge may be small and not reproducible. Moreover, supraspinal motor systems may not adapt internal representations to the novel connections when the populations of axons in the bridge are diverse or their numbers small.
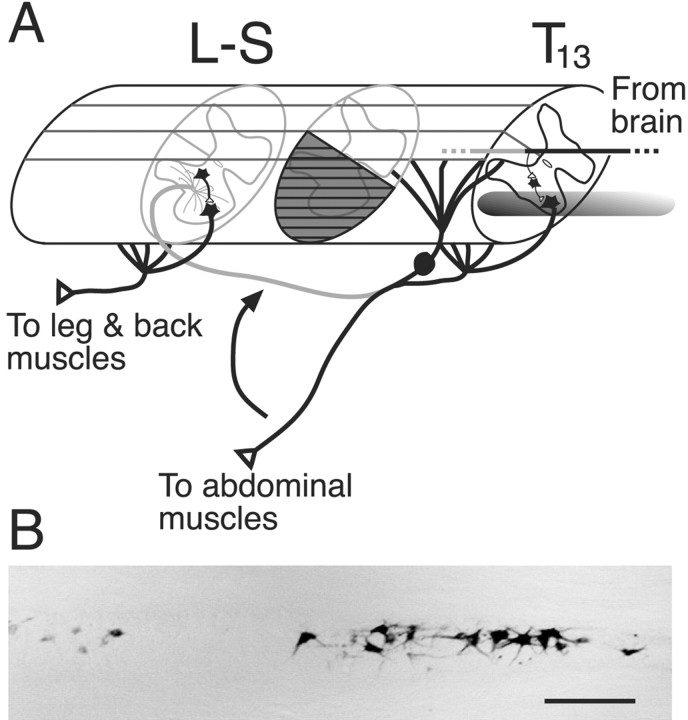
Building on these studies, we devised an innovative approach to bypass a spinal injury and activate motor circuits below the lesion. We disconnected a thoracic spinal nerve (T13) from its muscle target, but retained the attachment of the proximal end to the spinal cord. We then inserted the distal cut end of the nerve either into the intact spinal cord, to assess regeneration from the nerve and synapse formation with uninjured spinal neurons, or into the spinal cord below a hemisection, to assess how well these regenerating axons restored function (see Fig. 1). This nerve-insertion approach overcomes the limitations described above because T13 has a defined population of motor axons whose cell bodies, located rostral to spinal injury, retain their connections with the brain. We anticipated that these motor axons would regenerate and form synapses in the cord. Peripheral axons of somatic motoneurons regenerate robustly (Fu and Gordon, 1997) and are theoretically capable of forming connections in the CNS because motoneurons have an axon collateral that synapses on ventral horn neurons (Lagerback et al., 1981).
Figure 1.
A, Schematic showing the relationship between the origin and insertion of the 13th thoracic (T13) spinal nerve. T13 normally innervates lower abdominal muscles. The nerve is detached from the muscle and inserted into the cord at the level of the first lumbar vertebra (L2/3 segment) or farther caudally (L-S). The T13 motoneurons retain their connections with the brain, as shown by the descending pathway. Regenerating T13 motor axons grow into the spinal white matter and gray matter. Spinal hemisection (gray cross-hatching) was produced between the T13 vertebras and the nerve insertion site. B, Horizontal section through the thoracic ventral gray matter showing the distribution of T13 motoneurons retrogradely labeled after injecting WGA-HRP into the nerve. Scale bar, 300 μm.
We report that T13 motor axons regenerate into the spinal cord and make functional synapses with lumbosacral neurons. Furthermore, the synapses are sufficiently strong to evoke complex spinal cord potentials at the insertion site and to elicit robust muscle contraction when stimulated. Animals subjected to this nerve insertion after spinal hemisection showed ameliorated spastic limb signs and significantly greater mobility at the knee, ankle, and digits than hemisected controls without nerve insertion. Thus, this is a promising new strategy for promoting recovery after spinal injury. Because this approach does not depend on axon growth before scar formation, as do many regeneration approaches, it is suitable for chronic spinal injury.
Materials and Methods
General surgery
Experiments were conducted in adult Sprague Dawley rats (250-350 gm; mostly female). All experiments were conducted with the approval of the New York State Psychiatric Institute animal care and use committee. Animals were anesthetized with a mixture of ketamine (60 mg/kg, i.p.) and xylazine (5 mg/kg, i.p.) and the skin over the lower back was shaved and disinfected with Betadine. We made a 2 cm midline incision at the level of the 13th thoracic (T13) rib and vertebra. Muscle and other soft tissues were bluntly dissected over the rib. The T13 nerve was identified by its location parallel and caudal to the 13th rib and, paying careful attention to preserving its vascular supply, the nerve was dissected from the abdominal wall and cut at its insertion into the lateral abdominal muscle.
Nerve insertion
In the initial experiments, we made a small opening in the L1 vertebra (corresponding to the L3 spinal segment) ∼1 mm from the midline, ipsilateral to the dissected nerve. Using micro-dissecting forceps, the nerve was held by the epineurium and bluntly inserted into the cord through an opening in the dura. The nerve was inserted to a depth of ∼1 mm and was fixed in place with a microsuture between the epineurium and the dura or with fibrin glue. In later experiments, we made a T13-L1 laminectomy and exposed the T13 dorsal root ganglion. The dura was cut for the length of the opening, and the T13 nerve was reflected back on the cord surface and inserted into the cord at the L3 segment. The dura was placed over the nerve and sutured closed. The latter procedure was used for electrophysiological testing and tracer injections into the nerve because it facilitated identifying the inserted nerve after months of recovery.
Spinal cord lesion
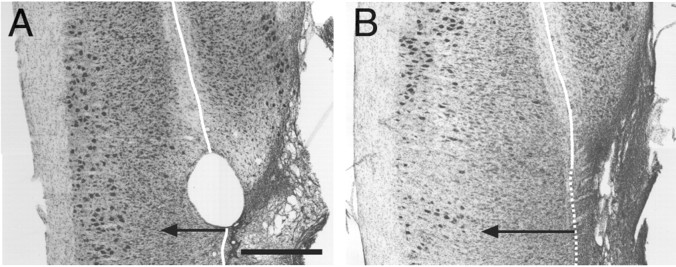
A dorsal laminectomy was made at the level of the L1 vertebra. This corresponded to the L3/4 segments (defined by the roots after perfusion). The dura was incised, and suction aspiration was used to hemisect the right side of the spinal cord. During surgery we attempted to extend the lesion just beyond the midline to ensure that the hemisection was complete. All animals were capable of normal urination after recovering from surgery. Hindlimb function on the contralateral side was mildly impaired for a day or two after surgery. We verified that the spinal cord was hemisected postmortem by Nissl-staining alternate horizontal sections through the lesion site (see Fig. 10). Animals with spinal hemisection were fitted with a neck shield and checked daily for sores on the affected limb.
Figure 10.
Nissl-stained horizontal sections through the lumbosacral cord showing the L2/3 lesion site (right side of image; extensive gliosis, arrow) in one control animal (A) that did not receive a nerve implant and in one test animal (B) in which the T13 nerve was inserted caudal to the lesion. The solid white line indicates the midline, identified as the midpoint within the ventromedial white matter. The dotted white line is the approximate extension of the midline into the lesioned zone. The lesions were complete on the right side and extended a small distance into the left. Gliosis is also present in the left cord, from the midline to the tip of the arrow. Scale bar, 1 mm.
Electrophysiology
We electrically stimulated the inserted T13 nerve and recorded evoked spinal neural activity to determine whether axons in the nerve were regenerating and making synapses with spinal neurons. After a second T13-L1 laminectomy to expose the inserted nerve, the T13 nerve was placed on hook electrodes. A thin piece of latex was inserted between the nerve electrodes, and the surface of the cord and the nerve was elevated slightly so that the electrodes did not touch the latex insulation. To restrict the actions of T13 stimulation to its distal (i.e., regenerating) endings, we cut the nerve between the T13 origin and its insertion rather than transecting the cord because bleeding after cord transection made it difficult to record stable surface and depth potentials. The spinal cord surface was covered with warm mineral oil. Surface recordings were made using a silver ball electrode; depth recordings were made with a glass micropipette filled with 4 m NaCl, 0.1-0.4 MΩ. The low-frequency filter cutoff was set at 10 Hz and the high-frequency cutoff at 5 kHz; the gain was between 1000 and 10,000. The nerve was stimulated between 0.8 and 1.2 V using a constant voltage source. To stimulate the gray matter electrically, we used a concentric electrode and a constant current source (up to ∼100 μA). Electromyographic (EMG) activity was recorded using nichrome wires that were de-insulated at the tips and inserted via 25 gauge hypodermic needles directly into the belly of the contracting muscle. The low-frequency filter cutoff was set at 10 Hz and the high-frequency cutoff at 5 kHz; the gain was 1000. Spinal and EMG recordings were acquired using a Digidata digitizer (Axon Instruments, Union City, CA) at a sampling rate of 10 kHz and subsequently analyzed using AxoGraph (Axon Instruments). Muscle contractions during T13 nerve stimulation were detected by observing joint motion, by movements of skin overlying the muscle, and by palpating the belly of the muscle. In many cases, contractions were confirmed by recorded EMG activity (see Fig. 14) and/or videotaping (see supplementary material; available at www.jneurosci.org).
Figure 14.
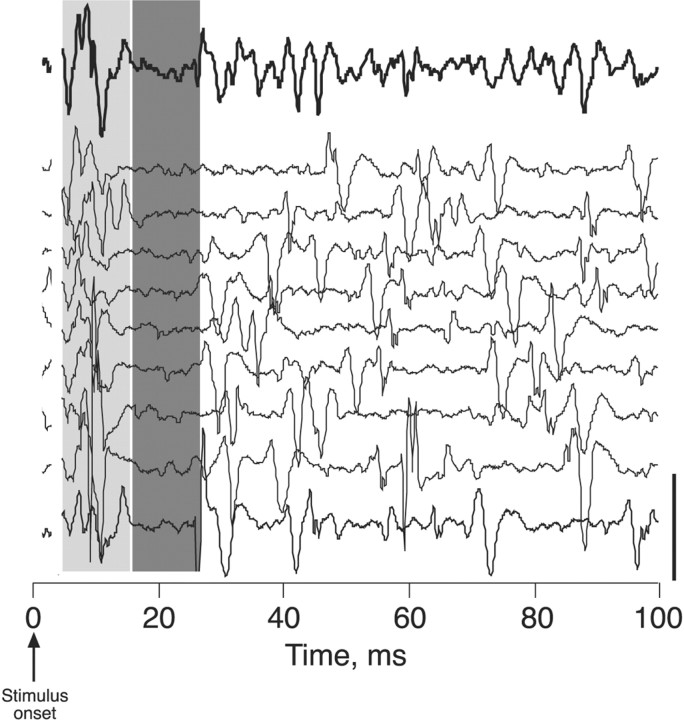
T13 nerve stimulation in hemisected animal evokes a burst of activity in an extrinsic digit muscle at short latency. Top trace (thick line) shows ensemble average (n = 9 trials) of EMG activity recorded from an extrinsic digit muscle in the calf. Individual trials are shown below (thin lines). The light gray column marks the burst. The dark gray column marks the period after the burst when EMG activity was suppressed. The stimulus artifact was eliminated on the figure. Calibration, 0.5 V
Labeling regenerating T13 axons
Anterograde and retrograde labeling. T13 axons were anterogradely labeled by: (1) pressure-injecting a 5% solution of wheat germ agglutinin-conjugated to horseradish peroxidase (WGA-HRP; Sigma-Aldrich, St. Louis, MO) or by ionophoresis (7 μA; 7 sec pulses; 20 min) of a 10% solution (in PBS, pH 8.0) of biotinylated dextran amine (BDA; Molecular Probes, Eugene, OR) directly into the T13 motor nucleus; (2) pressure-injecting 3 μl of a 5% solution of Neurobiotin (Vector Laboratories, Burlingame, CA) or BDA directly into the T13 nerve (similar to Brushart et al., 2002); (3) pressure-injecting BDA into the T13 dorsal root ganglion; and (4) prelabeling the inserted nerve using the carbocyanine dye, DiI. For DiI labeling, we dipped the cut end of the T13 nerve into a solution of tracer dissolved in a 50% solution of DMSO in saline. In the experiments using WGA-HRP, we transected the spinal cord just caudal to the tracer injection site to prevent labeling of propriospinal and descending pathways. We present data from the Neurobiotin nerve injections, but comparable results (i.e., ipsilateral lumbar label; see Results) were obtained with the other techniques. Retrograde labeling of axons in T13 was accomplished by inserting the cut end of the T13 nerve into a silicone cuff containing 5% WGA-HRP for either 24 or 48 hr (see Fig. 1B). Injection of Neurobiotin into the T13 nerve also retrogradely labeled T13 motoneuron cell bodies and sensory axons in the dorsal horn and dorsal column. The various tracers were detected as described below.
Immunocytochemistry for cholinergic markers. We used antibodies to choline acetyltransferase (ChAT; polyclonal goat anti-choline acetyl transferase; Chemicon, Temecula, CA) and vesicular acetylcholine transporter (VAT; polyclonal goat anti-vesicular acetylcholine transporter; Chemicon) to identify regenerating motor axons. We used three criteria to distinguish cholinergic marker label associated with the inserted nerve from intrinsic spinal label: (1) labeled processes were followed back to the inserted nerve; (2) labeled processes ended in terminal varicosities (see Figs. 4, 5A1,A2); and (3) labeled axons must be in a location in which intrinsic label was absent or very light (see Results and Figs. 4, 5A, 7). The antibodies were detected as described below.
Figure 4.
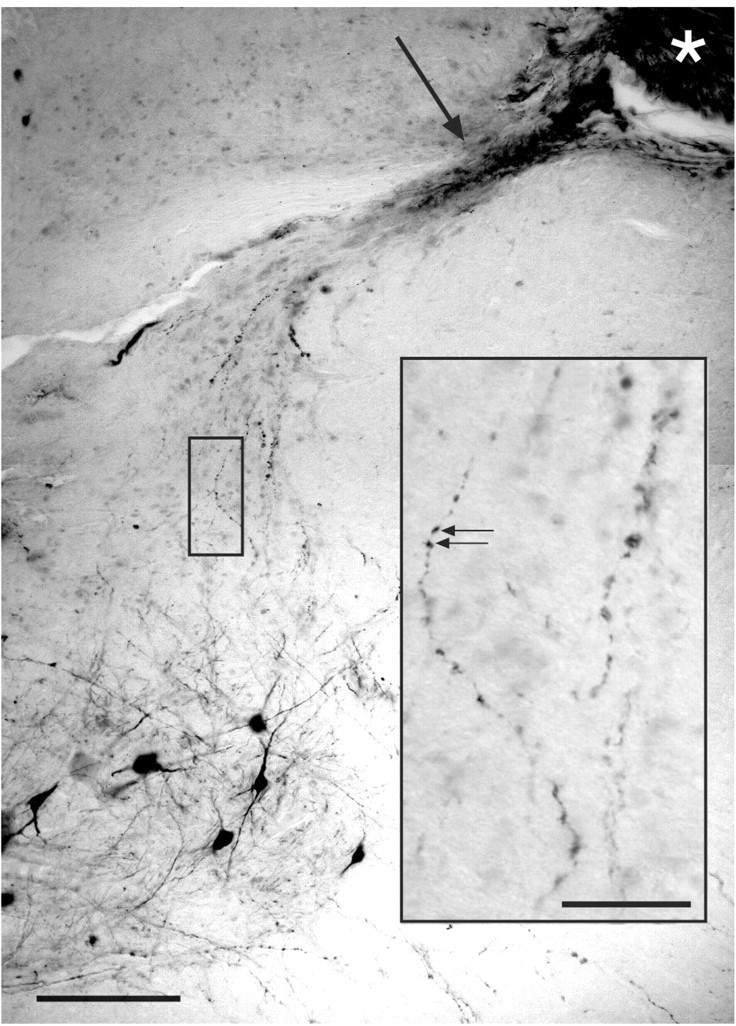
ChAT-labeled axons coursing from the inserted nerve (asterisk), into the intermediate zone and ventral horn. The clear area adjacent to the asterisk is a sectioning artifact. A dense band of ChAT-labeled regenerating axons (arrow) courses toward the intermediate zone and motor nucleus. Single ChAT-labeled axons contain large varicosities, which are seen at higher magnification in the inset (arrows). The darkly labeled neurons at the bottom of section are lumbar motoneurons. Scale bar, 200 μm; inset, 100 μm.
Figure 5.
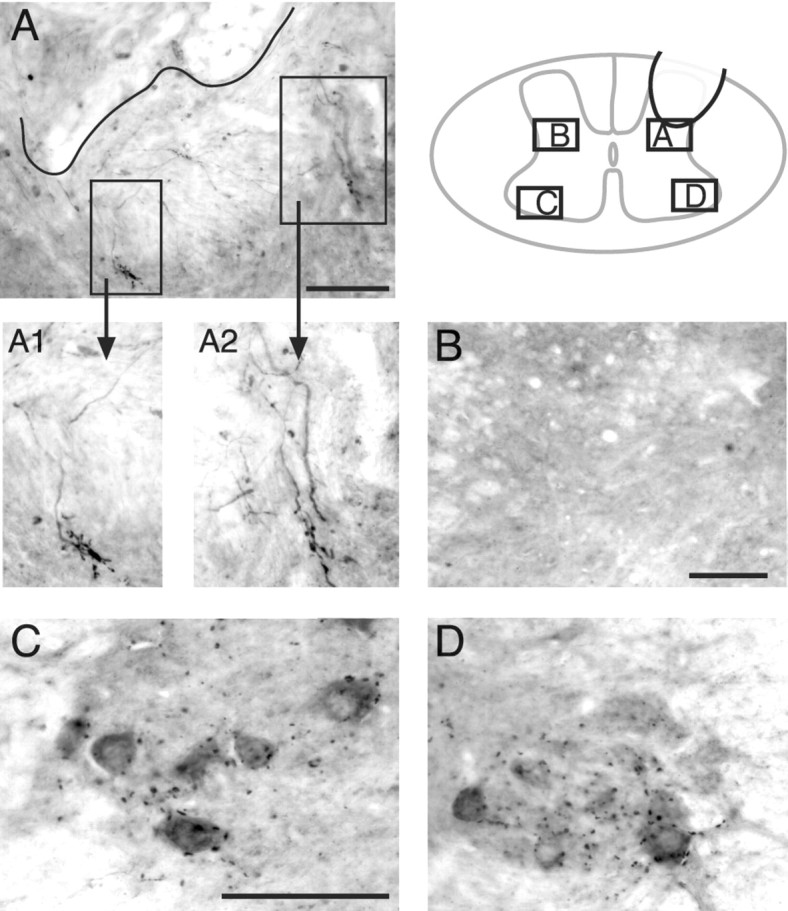
VAT-labeled synapse-like profiles were observed on regenerating T13 motor axons in the intermediate zone. Axons and terminals from the inserted T13 nerve were immunostained with an antibody to VAT. The schematic (inset) shows the location of the various micrographs in relation to the gray matter. A, The approximate border of the T13 nerve and gray matter is indicated by the black line. Rectangles enclose regions that contain large VAT-positive terminals connected by labeled axons to the implant site. A1 and A2 show these terminals at higher magnification. B, View of the homotopic contralateral intermediate zone, which does not contain any labeled axons or varicosities. C, D, Views of the contralateral and ipsilateral motor nuclei. Note that puncta of VAT labeling in the motor nuclei are not aggregated like those at the nerve insertion site (A). Scale bars: (in A) A, 100 μm; A1, A2, 50 μm; B, 100 μm; (in C): C, D, 100 μm.
Figure 7.
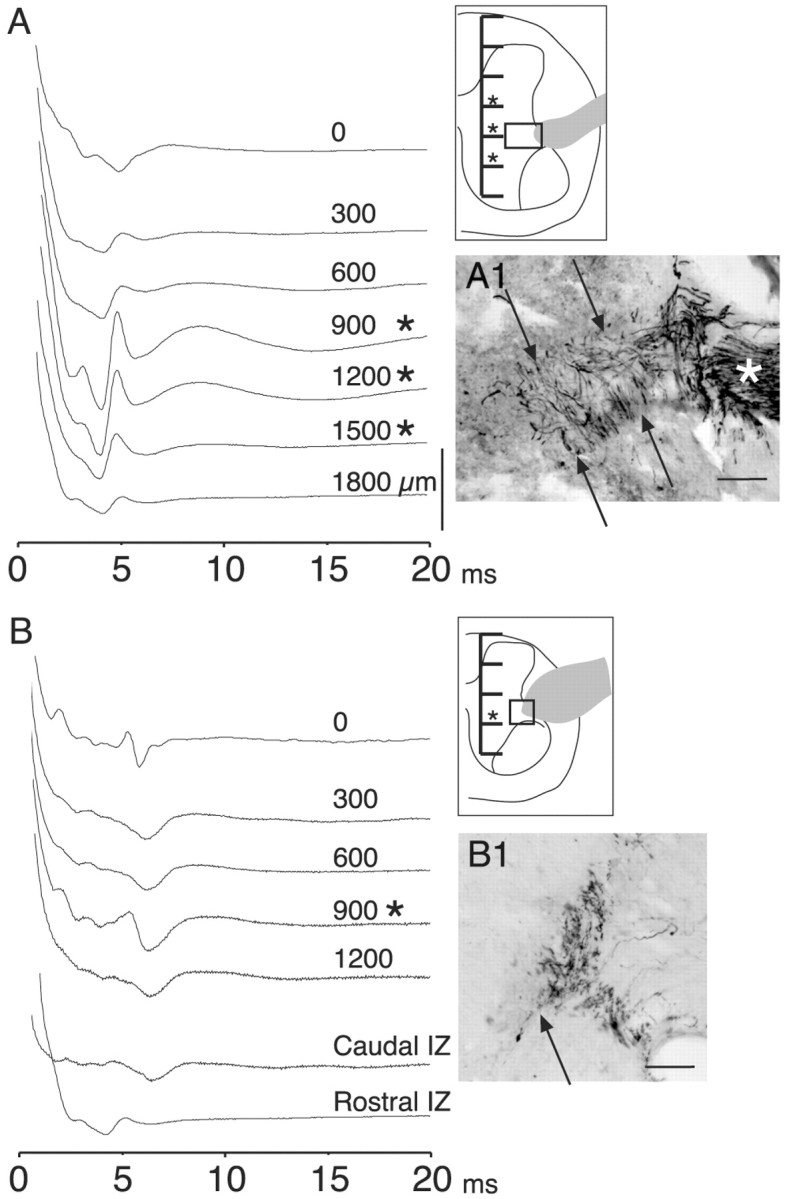
T13 nerve stimulation evoked short-latency potentials from the intermediate zone and ventral horn. A, Experiment during which recordings (ensemble averages, 10 stimuli each) were made from the surface (just beneath the pia) of the cord and at 300 μm intervals (see inset) through the gray matter and into the ventral white matter to determine the locus of activation. T13 had been inserted 28 weeks earlier. Asterisks mark depths at which the evoked local field potentials became disproportionately large relative to more dorsal and ventral sites. The gray profile in the inset corresponds to the inserted nerve, and the box in the inset corresponds to the location of the micrograph in A1. The micrograph in A1 shows ChAT-labeled axons in the inserted nerve (asterisk) and in the white and gray matter (between arrows). B, Similar to A, but from another animal, 26 weeks after nerve insertion. The traces marked IZ were recorded at a depth of 900 μm beneath the pial surface 1 mm caudal and rostral, respectively, to the recordings in the upper part of B (0-1200 μm). B1 shows ChAT-labeled axons at the junction of the white and gray matter dorsolateral to the ventral horn. Calibration: A, B, 200 μV. Scale bars: A1, B1, 100 μm.
Histochemistry, immunocytochemistry, and histology
After appropriate survival periods (1 or more months for DiI, 1 week after BDA injection; 1 d after WGA-HRP or Neurobiotin injection), animals were deeply anesthetized with a mixture of ketamine (60 mg/kg, i.p.) and xylazine (5 mg/kg, i.p.) and perfused transcardially with warm saline (300 ml at 39°C). Heparin was injected (100 U, i.v.) at the onset of the saline perfusion. For DiI, Neurobiotin, and BDA histochemistry and immunocytochemistry, this was followed by perfusion with 500 ml of 4% paraformaldehyde in 0.1 m phosphate buffer (PB; pH 7.3-7.4 at 4°C), initially at 70 ml/min and then more slowly to produce a total perfusion time of 20 min. The brain and spinal cord were removed, postfixed in the same fixative at 4°C for 30 min to 3 hr, and then transferred to 20% sucrose in PB overnight, which was sufficient for the tissue to sink to the bottom of the container. For WGA-HRP, we used a mixture of 1.25% paraformaldehyde and 0.2% glutaraldehyde and postfixed the tissue only if necessary. Otherwise, the perfusion protocol was the same. Frozen transverse sections (40 μm) through the lumbosacral spinal cord and horizontal sections through the T13 motor nucleus or the lesion were cut and processed. Alternate sections were stained for Nissl substance to identify nuclei and to establish the extent of spinal hemisection.
For BDA and Neurobiotin histochemistry, we followed the manufacturer's recommendations and incubated tissue in the avidin-biotin complex (ABC) reagent (Vector Laboratories) and 0.2% Triton X-100 for 2 hr at room temperature. After rinsing, the tissue was incubated with the chromogen solution [10 mg of diaminobenzidine (DAB); Sigma-Aldrich) and 12 ml H2O2 in 15 ml 0.01 m TBS] for 6-30 min (Li and Martin, 2001). Tissue containing WGA-HRP was processed according to a modified tetramethylbenzidine method (Mesulam, 1982) similar to what we have used previously (Martin et al., 1999).
Antibodies against ChAT and VAT were diluted 1:2000 before use and were detected with a biotinylated donkey anti-goat secondary antibody (dilution, 1:200) at room temperature and incubated for 1 hr, followed by incubation in the ABC reagent (Vector Laboratories). When the tissue had been treated to detect BDA or Neurobiotin, ChAT and VAT were processed using a peroxidase-conjugated secondary antibody and DAB at room temperature for 6-30 min. We routinely intensified the DAB reaction using nickel ammonium sulfate. Although this resulted in an increase in background staining, especially cell bodies, it produced a strong black intra-axonal reaction product (see Figs. 2C, 4). Traced and immunolabeled axons were visualized using differential interference contrast (Nomarski) optics, which have a narrower depth of focus than conventional optics and therefore effectively reduced the imaging plane.
Figure 2.
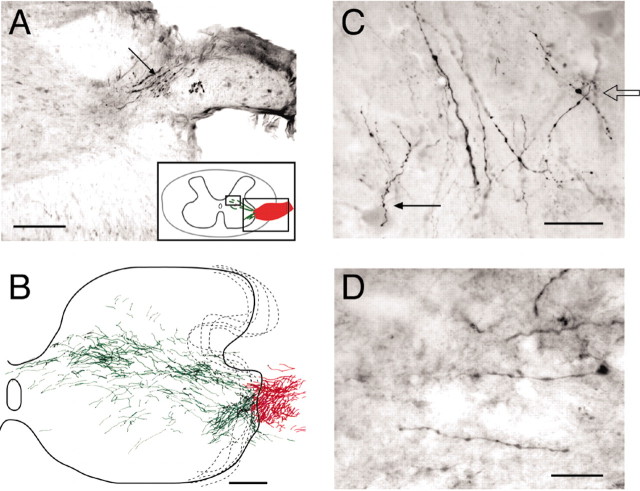
Anterograde tracing shows regenerating axons growing into the intact lumbosacral spinal cord. A, Neurobiotin was injected directly into the T13 nerve (8 weeks after insertion) 2 mm rostral to the insertion site in an animal without spinal hemisection. Labeled axons (arrow) are shown coursing from the nerve to the lateral ventral horn. Other sections (data not shown) showed labeled axons more proximally in the nerve. The schematic (inset) shows the nerve insertion site (red) and regenerating axons in the gray matter (green). The large rectangle corresponds to the location of the main micrograph in A, and the small rectangle shows the location of the micrograph in D. B, Reconstruction of labeling across 33 sections (each 40 μm thick) from the experiment in A. Red indicates labeling in the inserted nerve (largely in the white matter). Green indicates gray-matter label. C, Extensive numbers of Neurobiotin-labeled axons (1100 μm from the insertion site) contacting large ventral horn neurons (presumably motoneurons; arrows) 8 weeks after insertion. The neurons were revealed by increased background staining attributable to the nickel intensification process. The open arrow shows a labeled axon overlying a dendrite of a large ventral horn neuron. The filled arrow shows a labeled axon overlying a cell body and a dendrite of a large ventral horn neuron. D, Labeled preterminal axons within the ventromedial dorsal horn. The location of this field corresponds to the small box in the inset in A. Scale bars: A, B, 200 μm; C, 100 μm; D, 80 μm.
Hindlimb behavioral and muscle assessments
To evaluate motor recovery after T13 nerve insertion, we compared hindlimb posture in animals with L2/3 spinal hemisection (see above) with and without the inserted nerve. Animals were videotaped while locomoting in an open field environment and while their hindquarters were suspended by holding the tail to produce a standardized hindlimb posture. During weeks 3 and 4, the flexor force at the knee was measured in 8 of the 12 animals (4 test and 4 control animals; conducted during a second series of experiments). For these measurements, we tied a string to the leg just proximal to the ankle and attached the other end of the string to a linear strain gauge. The knee was extended until a criterion force of 20 gm was reached. We videotaped the test and measured the knee angle at 20 gm of extensor force. We selected portions of the video records for measurement of the knee, ankle, and digit (metatarsal-phalangeal) angles using the following criteria: First, each limb must have been in full view (showing the digits, ankle, knee, and hip region) for a sufficient length of time to obtain an adequate record. Second, bony prominences corresponding to the lateral margin of the upper femur (i.e., the hip joint mark) had to be apparent. The hip joint was usually revealed by a bump on the skin surface marking the region of the trochanter, which became more apparent as the animals lost muscle mass during the weeks after the lesion. The knee joint corresponded to the lateral condyle of the femur and the ankle to the lateral malleolus of the fibula. Generally, the hip and knee joint centers were marked with a permanent marker. See Figures 11 and 12 for the angles measured. Note that the measured knee angle was subtracted from 90° in Figure 12A so that the direction of the angle changes over time was the same as for the other joints. Because of the small size of the digits, we used a categorical scale: 1 = extended compared with normal (∼180°); 2 = normal partially flexed posture (∼45°); 3 = partial flexion (∼90°); and 4 = maximal flexion (digits tightly clenched). Several measurements were made directly from a flat-panel video screen using the program NIH Image, and the average was used for the analysis. In the same animals, we also dissected and weighed the following muscles on the lesioned and unlesioned sides: gluteus maximus, gluteus minimus, semitendinosus, biceps femoris, semimembranosus, caudofemoralis, gastrocnemius, and soleus.
Figure 11.
L2/3 spinal hemisection produces flexion of hindlimb joints. A, Control animal with hemisection alone. Dots and lines mark joint centers and segments; from proximal to distal: hip, leg, knee, distal leg, ankle, proximal foot, metatarsal-phalangeal joints, and distal phalanx. Note that the knee, ankle, and digits are flexed maximally. B, Animal with hemisection and T13 nerve inserted caudal to hemisection. Similar to A but the knee, ankle, and digits are flexed significantly less. C, Time-lapse photographic montage, created by superimposing sequential video frames, of an animal with spinal hemisection and T13 nerve insertion. Knee joint mobility is extensive (white arrow). Mobility of the contralateral hindlimb appeared normal (black arrow).
Figure 12.
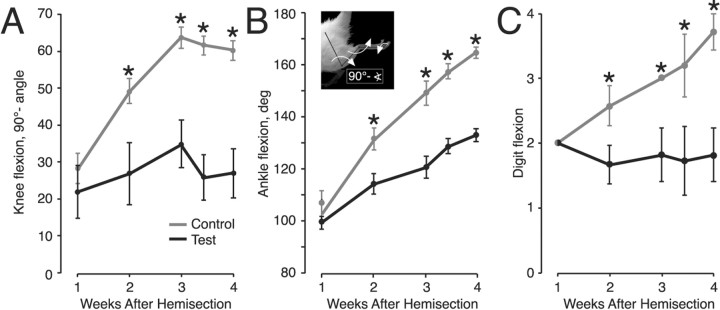
Insertion of the T13 nerve ameliorates the signs of spasticity after L2/3 spinal hemisection. Each graph shows the relationship between joint angle changes and time after spinal hemisection. Gray lines (and error bars) plot control data (hemisection only) and black lines (and error bars) plot data from animals with combined hemisection and T13 nerve insertion. A, Mean ± SE knee angles. B, Mean ± SE ankle angles. Inset shows scheme for measuring joint angles. Note that the measured knee angle in A was subtracted from 90° so that the direction of angle changes over time was the same as for the other joints. C, Digit flexion category scale (see Materials and Methods). Significant differences are indicated by asterisks.
Results
Experimental paradigm and origins of T13 axons
We detached the T13 spinal nerve from its target abdominal muscles and inserted the cut end into the spinal cord (Fig. 1A). Severing T13 does not produce any apparent loss of function, perhaps because neighboring synergistic muscles compensate by generating more force (Pearson et al., 1999). The T13 nerve contains a significant population of somatic motor axons because attaching a cuff containing 5% WGA-HRP to the distal cut end in two animals resulted in retrograde labeling of somatic motoneurons in the T13 motor nucleus (Fig. 1B). A horizontal section through the nucleus revealed 63 somatic motoneurons in one animal (Fig. 1B) and 93 in the other. Labeling was also present in the dorsal horn and dorsal columns, indicating transganglionic transport of the tracer. Table 1 presents a summary of experiments conducted in test (i.e., with T13 nerve inserted) and control (no nerve inserted) animals.
Table 1.
Summary of experiments
|
Survival, weeks |
Number |
Spinal cord hemisection |
Axon traced |
Spinal potential |
Motor |
Behavioral testinga |
|---|---|---|---|---|---|---|
| Test | ||||||
| 4 | 5 | 4 | 3 | 4 | 4 | 3 |
| 5 to 8 | 5 | 2 | 4 | 2 | 2 | 1 |
| 9 to 12 | 2 | 2 | 2 | 2 | 2 | |
| 13 to 16 | 7 | 1 | 3 | 5 | 1 | |
| 17 to 20 | 2 | 1 | 2 | |||
| 21 to 24 | ||||||
| 25 to 28 | 4 | 4 | 4 | |||
| >28 | 2 | 1 | 2 | 2 | ||
| Total | 27 | 10 | 11 | 21 | 15 | 6 |
| Controls | ||||||
| 4 | 4 | 4 | 4 | |||
| 11 | 2 | 2 | 2 | |||
| 13 | 2 | |||||
| 15 | 2 | |||||
| Total |
10 |
6 |
|
|
|
6 |
Behavioral testing for all animals was complete at week 4; tissue processing for three of six animals was 1 to 5 weeks later.
Axons from T13 regenerate into the intact spinal cord
We used anterograde tracers in six animals to determine whether axons regenerated from the inserted nerve into the spinal cord. In the example shown in Figure 2, we waited 8 weeks after T13 insertion and then injected the T13 nerve with Neurobiotin ∼2 mm proximal to the insertion point. Neurobiotin-labeled axons can be seen coursing into the ventral horn (Fig. 2A, arrow).
We determined the direction of the growth in the gray matter and/or the rostrocaudal extent of labeling in four of the animals. In the result shown in Figure 2B (same case as in Fig. 2A), a composite of 33 adjacent sections revealed extensive outgrowth of Neurobiotin-labeled axons from the inserted nerve into the gray matter of the ventral horn. Labeled T13 axons within the nerve are in red, whereas axons from the nerve that entered the gray matter are in green. The axons in this experiment exited T13 in a single dorsoventral plane near the gray matter-white matter border, and we could follow 81 axons that had regenerated into the gray matter. The total rostrocaudal extent of T13 axonal growth in this case was 1.32 mm. Many other axons grew as far as 600 μm from the insertion site into the medial intermediate zone. The density of regenerating axons was markedly higher in the motor nucleus in the lateral ventral horn (lamina 9), in the lateral intermediate zone (lamina 7), and in the medial portion of the deep laminas of the dorsal horn (laminas 4-6), suggesting that these areas were targets. In contrast, axons did not enter laminas 1-3 of the dorsal horn. Three additional experiments with anterograde tracers yielded a similar topography of regenerating axons. None of the regenerating axons crossed the midline to the contralateral side in any of these experiments.
Higher magnification of Neurobiotin-labeled axons show en passant varicosities in the motor nucleus 1100 μm from the nerve insertion site (Fig. 2C, different case from Fig. 2A,B,D) and in the ventromedial dorsal horn, 550 μm from the nerve insertion site (Fig. 2D, same case as Fig. 2A,B). Importantly, Figure 2C shows labeled T13 axons coursing directly over the cell body of a large ventral horn neuron (presumably a motoneuron; filled arrow) and over a dendrite (open arrow) in the lumbosacral enlargement. The presence of varicosities in close proximity to spinal neurons (examined under Nomarski optics; see Materials and Methods) suggested that regenerating T13 axons form synapses.
T13 contains sensory axons, but they do not appear to regenerate into the spinal cord. We injected BDA into the T13 dorsal root ganglion in several experiments and found labeled axons that made hairpin turns at the nerve-spinal cord junction but that did not exit the nerve. A representative section is shown in Figure 3.
Figure 3.
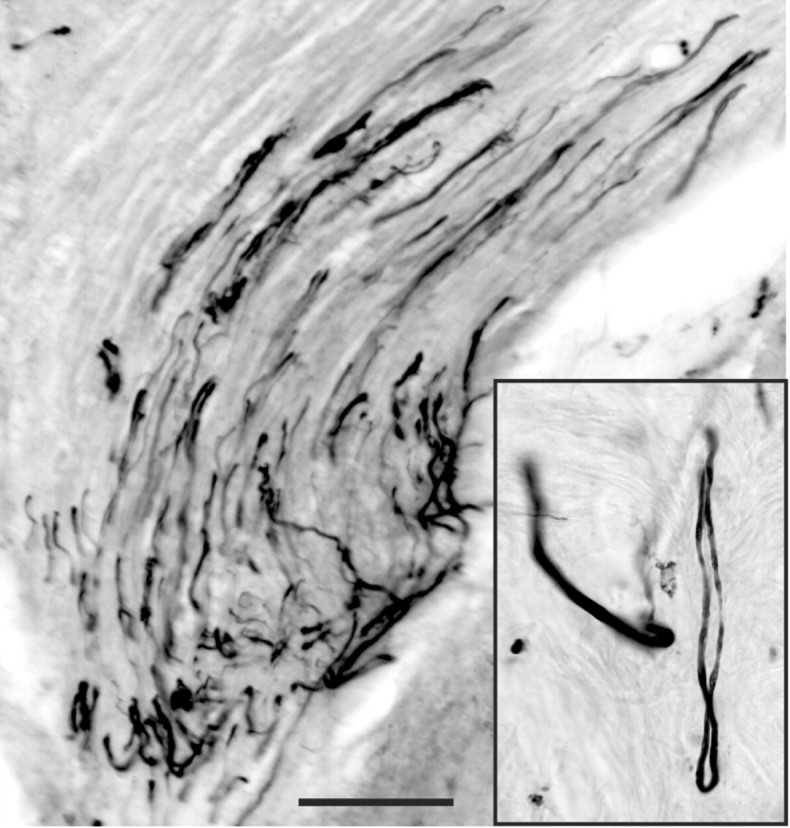
T13 sensory axons do not regenerate into the spinal cord. BDA injected into the T13 dorsal root ganglion labeled axons in the inserted nerve that did not regenerate from the nerve into the lumbar cord. Labeled axons can be seen turning near the nerve-spinal cord junction to grow back into the nerve. The inset shows such a nerve making a hairpin turn near the spinal cord. Scale bar, 100 μm.
Some of the regenerating axons are cholinergic
The fact that Neurobiotin injections into the inserted T13 nerve retrogradely labeled T13 motoneuron cell bodies suggested that many of the regenerating T13 axons were cholinergic. We therefore stained sections through the insertion site with an antibody to ChAT. In all eight experiments we observed ChAT-labeled axons coursing from the insertion site into the gray matter of the ventral horn and intermediate zone. Figure 4 shows a remarkable example in which ChAT axons (asterisk) from the T13 insertion site near the dorsal horn are seen coursing toward the lumbar motor nucleus (Fig. 4, bottom left). At higher magnification (Fig. 4, inset), ChAT-positive axons are seen to contain numerous axonal swellings in the lateral intermediate zone that resemble the en passant and terminal varicosities labeled with Neurobiotin in the experiment described above (Fig. 2C).
We have strong evidence that these terminals are associated with motor axons from T13. First, ChAT staining was associated with nerve insertion because staining in control sections outside the motor nuclei was very low. Second, the staining did not come from spinal neurons: although the ChAT antibody recognized lumbar motoneurons (Fig. 4, bottom left), processes from these neurons did not extend near the T13 nerve insertion site (also see Materials and Methods for criteria). Furthermore, Neurobiotin injected into T13 in four animals (and WGA-HRP injected in two animals) labeled an occasional neuron in the intermediate zone and dorsal horn, but did not label lumbar motoneurons, which would have occurred had the processes of these neurons grown into the inserted nerve. Third, the ChAT antibody did not label putative sensory axons (those making hairpin turns at the nerve-spinal junction).
To identify presynaptic cholinergic sites, we used an antibody to the VAT, which is present primarily in preterminal axons and terminals of cholinergic neurons that contain the presynaptic protein marker synaptophysin (Arvidsson et al., 1997). The VAT antibody stained terminal axons and varicosities of regenerating axons. For example, a micrograph through the base of the dorsal horn (Fig. 5A) shows gray matter containing VAT-positive axons from the inserted nerve. Although most of the varicosities were en passant, some terminal varicosities were aggregated into distinctive configurations (Fig. 5A1,A2) that were observed only in the T13 terminal fields. They were not seen in controls or in the homotopic contralateral cord (Fig. 5B), and the VAT labeling in the motor nuclei (Fig. 5C,D) and at other sites in the gray matter was punctate, not aggregated. The recognition of regenerating axons and terminals by antibodies to cholinergic markers affirms their origin from somatic motor neurons.
Stimulation of the inserted T13 nerve elicits potentials on the surface of the spinal cord
Next, we investigated the consequences of activating the axons that had regenerated from T13 into the cord. In 17 cases ranging from 4 to 28 weeks after insertion, the T13 nerve was exposed and stimulated while we mapped surface potentials over the insertion segment and adjoining portions of the rostral and caudal segments of the lumbosacral cord. We cut the T13 nerve between the recording site and its spinal origin in these and other physiology experiments (Fig. 6, inset, arrow and open circle) to ensure that all recorded potentials were the result of activating axons only within the inserted nerve ending. The distal end of the cut nerve was viable for several hours, as noted by evoked spinal activation at short latency after stimulation (also see Materials and Methods).
Figure 6.
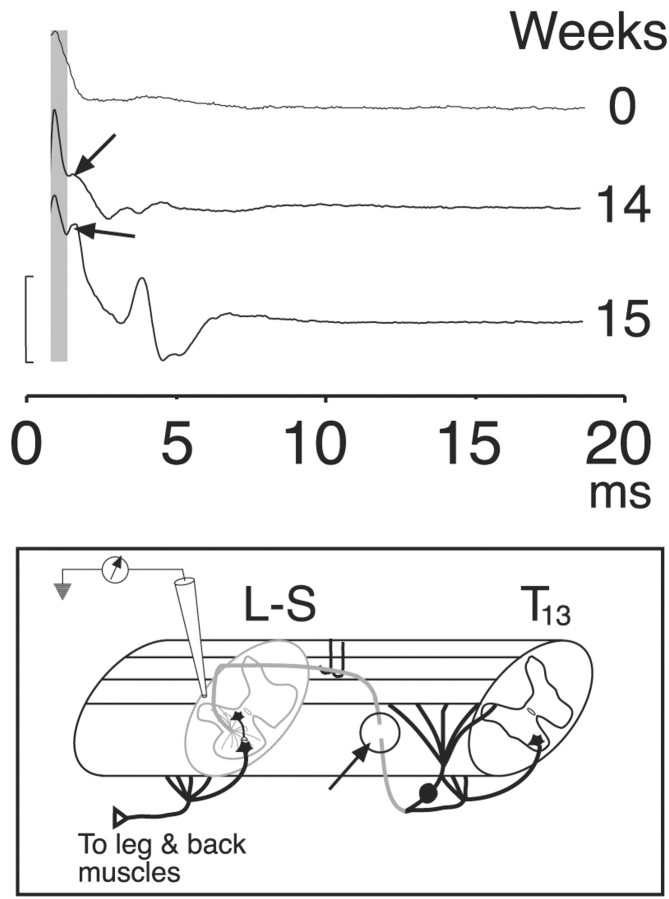
Electrical stimulation of the inserted T13 nerve evokes spinal neural activity. Surface recordings are shown from three representative experiments: immediately after nerve insertion (top tracing, 0 weeks), 14 weeks after insertion (middle tracing), and 15 weeks after insertion (bottom tracing). A short-latency volley was recorded in all three experiments (shaded column), but longer-latency, presumably postsynaptic, responses (arrows), were recorded only after the inserted nerve was allowed to regenerate. Inset, Schematic showing the recording configuration. We cut the T13 nerve between its origin and insertion (arrow and circle) to eliminate any contributions of antidromic activation. Calibration, 160 μV.
Stimulation of T13 immediately after insertion produced a single short-latency (mean, 0.8 msec), initially positive potential at the insertion site (Fig. 6, 0 weeks). This potential is consistent with the conducted volley of action potentials. Based on classical field potential analysis (Lorente de Nó, 1947), the initial positive potential is consistent with outward conductances at the recording site in response to distant inward conductances. The later inversion of the potential (i.e., toward negativity) is attributable to recording local inward conductances because impulses are propagated near or at the recording site. This is similar to recording stimulation-evoked volleys in spinal pathways. In 94% (16 of 17) of cases, multipeaked surface potentials were recorded over a range of latencies, with the first typically <1-2 msec, and the latest, 10 msec. In four cases the shortest latencies were similar to the volley (Fig. 6, shaded column) seen in the acute insertions. For example, compare volleys at 14 and 15 weeks with those at week 0 (Fig. 6). The onset of the initial potential in these animals was between 0.5 and 1.7 msec (mean, 1.12 ± 0.3 msec). The mean interval between the volley and the next phasic potential was 0.64 ± 0.06 msec in the cases in which a distinct initial volley was observed. However, in most recordings the second potential was further delayed or there was a large shock artifact (attributable to the close proximity between stimulation and recording sites) that obscured the earliest potential, making assessment of initial synaptic delays impossible. We also noticed that stimulation of the inserted nerve in these experiments elicited movements of muscles in the leg and back, and these are described in detail below.
Stimulation of an inserted T13 nerve evokes localized field potentials in the intermediate zone and ventral horn of the intact cord
We next asked whether the surface potentials originated from within the intermediate zone and ventral horn, which are the termination fields of regenerating T13 axons (Fig. 2). We recorded at 300 μm intervals from the surface of the cord to the ventral gray matter border in five rats. Two representative cases are shown in Figure 7. In one, the local field potential grew in amplitude within the intermediate zone and ventral horn, and the depth of the maximal response corresponded to the depth of nerve insertion (Fig. 7A, inset). In the other, the dorsoventral distribution of the local field potential was more localized and limited primarily to the intermediate zone (Fig. 7B). Recordings in the intermediate zone 1 mm rostral and caudal (Fig. 7B, IZ) resulted in small potentials.
We used immunostaining for ChAT to determine whether the peak of activity evoked in the spinal cord in the two experiments above corresponded to the depth of axons that had regenerated from the inserted T13 nerve. In the experiment that yielded the recordings in Figure 7A, a dense band of ChAT-positive axons could be traced from the insertion point through the white matter (Fig. 7A1, asterisk, and between arrows) and into the intermediate zone and ventral horn of the gray matter, the exact areas that yielded the recordings. A similar correlation between focal T13 potentials and ChAT labeling was obtained in three other animals. In the other example (Fig. 7B) there was less growth of ChAT-positive axons from the insertion site (Fig. 7B1). Nevertheless, growth was sufficient to form functional connections because T13 nerve stimulation produced contraction of the caudal back muscles (see below).
T13 nerve stimulation evokes muscle contraction consistent with the site of insertion
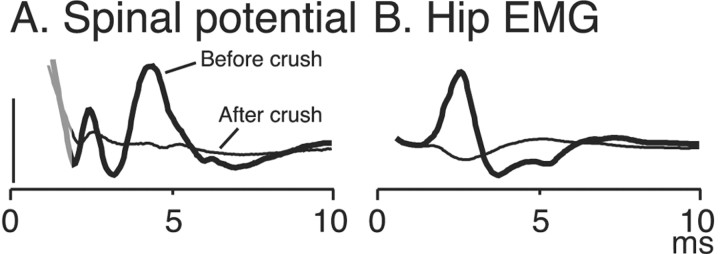
We found that stimulation of the T13 nerve 5-28 weeks after insertion evoked muscle contraction in the hip, leg, or back in 54% (7 of 13) of animals tested. Figure 8 shows a typical example of a spinal potential (A) and a phasic EMG response (B) evoked by stimulating the T13 nerve, which was inserted into the lumbosacral enlargement. Unfortunately, the earliest spinal potentials were obscured by the stimulus artifact. The supplementary material shows a brief movie of hip flexion evoked by T13 nerve stimulation (although in this case the animal received spinal hemisection at the time of T13 nerve insertion).
Figure 8.
Spinal surface potentials (A) and the EMG response (B) were mostly eradicated when the T13 nerve was crushed between the stimulation and insertion sites. The thick, dark traces show the responses (ensemble averages; n = 10) before crushing, and the thin, light traces, after crushing. The residual potentials could be mediated by surviving axons. The gray portion of the trace in A corresponds to the end of the stimulus artifact. Calibration: A, 200 μV.
We performed two experimental procedures to ensure that these responses were elicited by the excitation of axons that had regenerated in the lumbosacral cord. First, before stimulation, we cut the proximal portion of the inserted T13 nerve (Fig. 2). This eliminates any possible antidromic activation of motor axons or orthodromic activation of somatic sensory axons. Second, after we documented that stimulation evoked spinal or lumbar muscle activity, we crushed or transected the nerve between the stimulation and insertion sites and found in all five animals that this essentially eradicated both the large phasic spinal potentials (Fig. 8A) and the EMG activity (Fig. 8B).
There was a clear correspondence between the level of T13 nerve insertion and the muscles that were activated. Thus, insertion into the lumbar cord rostral to the enlargement levels, which does not contain a dorsolateral somatic motor nucleus, evoked contractions of the caudal portion of the erector spinae muscle in six of seven animals. The contractions are appropriate to the site because electrical stimulation of the ventral gray matter at this level in two control animals (no nerve inserted) caused effects that were identical to those observed with stimulation of the T13 nerve inserted into the rostral lumbar cord (i.e., caudal erector spinae muscle contraction). When, in one animal, we inserted T13 into the lumbar enlargement, which contains a dorsolateral motor nucleus, stimulation produced quadriceps muscle contraction. Furthermore, when we inserted T13 into the lumbosacral enlargement in five hemisected animals, stimulation produced leg and hip muscle contraction in each case (see below).
These findings indicate that we can target different populations of spinal motor neurons by inserting the nerve at specific levels. Moreover, the muscle contractions evoked by stimulating T13 were consistent with the localized origin of the action potentials within the cord (Fig. 7) and with the distribution of T13 axons using anterograde tracers and immunocytochemistry (Figs. 2, 4, 7).
Axons regenerate from T13 nerves inserted caudal to spinal hemisection
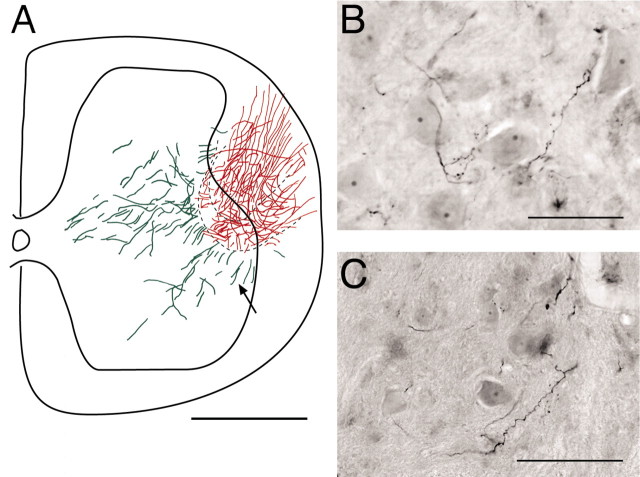
Next, we investigated whether similar effects would be obtained when the T13 nerve was inserted caudal to a spinal injury. We hemisected the spinal cord in 10 animals at the L2/3 segment and inserted T13 at the L4/5 level (Fig. 1A). We followed the hemisected animals for as long as 28 weeks after nerve insertion (Table 1) and injected Neurobiotin directly into the nerve in six cases. A representative example of one of these cases, 4 weeks after nerve insertion (Fig. 9A), shows a composite of all labeled axons on six sections, which spanned a rostrocaudal extent of 960 μm. Labeled T13 axons extend into the deeper portion of the dorsal horn, intermediate zone, and ventral horn. This pattern is very similar to that observed after Neurobiotin labeling (Fig. 2A) or ChAT staining (Figs. 4, 7) of T13 inserted into the intact cord. Figure 9, B and C, shows examples of labeled T13 axons in the lumbosacral motor nuclei below the hemisection. Again, the proximity to the large ventral horn neurons is similar to that seen in Figure 2C. These experiments demonstrate that T13 axons regenerate into the spinal gray matter below a hemisection and that the topography of the regenerating axons is similar to that after T13 insertion into the intact cord.
Figure 9.
T13 axon regeneration into the lumbosacral cord of rats with spinal hemisection. A, Reconstruction of labeling present on six sections (across 960 μm) in an animal 4 weeks after T13 nerve insertion. Red indicates labeling in the inserted nerve (primarily in the white matter). Green indicates gray-matter label. The dotted lines show the limits of the border of the inserted nerve, drawn from two sections. B, C, Two examples of Neurobiotin-labeled axons in the ventral horn 500 μm from the nerve-insertion site in animals 4 weeks after T13 insertion. Note the varicosities and proximity to large neurons in the ventral horn. Scale bars: A, 500 μm; B, C, 100 μm.
Insertion of T13 caudal to spinal hemisection ameliorates signs of spasticity and increases joint mobility
To determine whether the insertion of T13 caudal to a spinal injury promotes recovery of hindlimb motor function, we repeated the hemisection and T13 nerve insertion described above. In six test animals, the hemisection was paired with T13 nerve insertion. In six control animals, the cord was hemisected and T13 was disconnected from the abdominal wall, but the distal end was ligated and not inserted into the cord. Animals were videotaped at weekly intervals both in an open field and while suspending the animal's hindquarters to elicit spontaneous hindleg movements or to produce a standardized hindleg posture. The Basso-Beattie-Bresnahan assessment method (Basso et al., 1995) was not useful for these experiments because neither the test nor the control animals used the hindleg ipsilateral to the lesion during locomotion.
Spinal hemisections were complete in all animals. This was determined by examining horizontal sections through the lesion from the dorsal to the ventral surfaces. Representative Nissl-stained sections through the upper ventral horn are shown in Figure 10. Ipsilateral (right side of figure) degeneration and gliosis extended to and, in the case of the test animal, beyond the midline.
Control and test animals dragged their ipsilateral hindleg the day after surgery, and the contralateral hindlegs showed clumsy movements, which improved after several days. During the first postoperative week, the ipsilateral hindlimb had an extended posture. Alternating flexion and extension movements of the contralateral hindleg were not obviously associated with rhythmic ipsilateral hindleg movements. During the second week, the ipsilateral hindleg of control animals began to show tonic flexure at the knee, ankle, and digits. The degree of flexure progressed during the remainder of the 4 week experimental period. Significantly, ipsilateral hindlimb joint flexure was not as pronounced in the animals in which the T13 nerve was inserted.
For both test and control animals, the increased flexed joint angle was accompanied by an increased flexor tone (see below) that became noticeably greater as the limb was passively extended (i.e., spring-like). Passive extension was met with resistance and often evoked muscle spasms. This flexed joint posture and increased flexor tone resembled spasticity and is likely caused by the loss of inhibitory propriospinal neurons as a result of the hemisection at L2/3 (Cavallari and Pettersson, 1989; see Discussion).
We determined that the affected limb in the six test animals exhibited noticeably less limb flexion and less resistance to passive joint extension and maintained greater mobility. Figure 11, A and B, shows single video frames from a control (hemisection only; A) and a test (hemisection plus T13 nerve insertion; B) animal 4 weeks after hemisection. The stick figures mark the hindleg segments defined by the hip, knee, ankle, metatarsal-phalangeal joint, and digit tips. The affected limb in the control was locked into maximal knee and ankle flexion. The digits were tightly clenched. In contrast, the test animal shows noticeably less flexion at the knee and elbow, and the digits were held open. Figure 11C presents a time-lapse video montage showing hindlimb mobility 4 weeks after spinal hemisection and T13 nerve insertion. Although not as extensive as the contralesional leg (black arrow), the affected leg (white arrow) could move spontaneously at the knee over an extensive path.
We quantitated these differences in flexion by measuring joint angles and using a categorical scale (see Materials and Methods). Figure 12 shows mean knee angle (A), ankle angle (B), and digit flexion (C) for test and control animals. Mean knee joint angles in test and control animals did not differ at week 1 (t = 0.919; p = 0.379) but differed progressively more between weeks 2 and 4 (week 2, t = 3.431, p = 0.006; week 3, p = 4.476, p = 0.0009; week 4, t = 5.675, p = 0.0008). Surprisingly, the knee joint angle in the test animals remained within normal limits between weeks 1 and 4 (Fig. 12A) (F = 0.724; p = 0.585), whereas knee joint angles in the control animals differed significantly (F = 24.18; p < 0.0001). For the ankle and digits, differences between test and control animals also were significant only after week 1 (ankle: week 1, t = 1.037, p = 0.324; week 2, t = 5.18, p = 0.0003; week 3, t = 7.26, p < 0.0001; week 4, t = 13.49, p < 0.0001; digits: week 1, all data values = 2; week 2, t = 2.757, p = 0.01; week 3, t = 4.132, p = 0.0017; week 4, t = 3.671, p = 0.008). Similar to the knee joint, mean digit flexion in the test animals between weeks 1 and 4 was within normal limits (F = 0.145; p = 0.964), but digit flexion increased significantly in controls (F = 11.497; p < 0.0001).
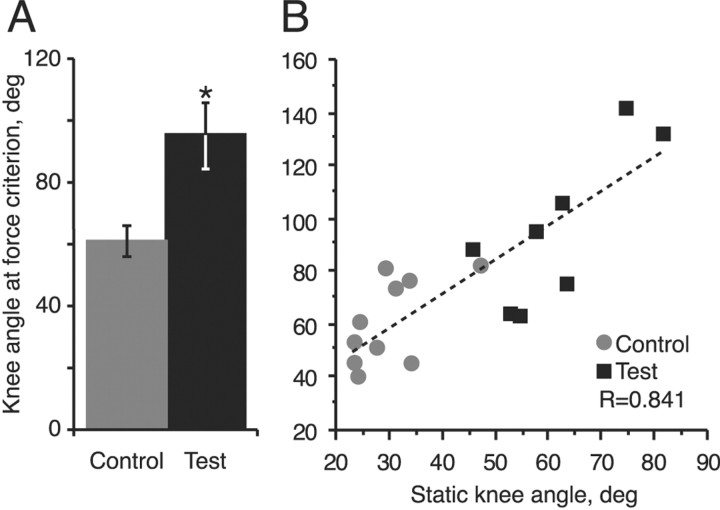
We next determined whether the increased resistance with passive joint extension in test and control animals differed. We tested animals at weeks 3 and 4. A strain gauge was attached to the leg immediately proximal to the ankle, and we passively extended the knee until a flexor restoring force of 20 gm was reached. We then measured (on video) this knee angle and found that the knee joint could be extended to a much greater degree in test animals than in controls (Fig. 13). Because the mean values at weeks 3 and 4 were not different, we pooled the data. Mean knee flexor angle in the test and control animals differed significantly (week 3, t = 4.132, p = 0.0017; week 4, t = 3.671, p = 0.008; combined, t = 5.405, p < 0.0001). The angle at which the flexor force criterion was achieved correlated significantly with the static knee angle posture for each measurement (Fig. 13B) (p < 0.001). This is consistent with the idea that the static hindlimb posture we recorded was caused by an increase in flexor force that drove the knee into flexion.
Figure 13.
Twenty grams of extensor force extends the hindlimb farther in test animals than in control animals with hemisection only. A, Bar graphs showing the difference between knee angle at the flexor force criterion (20 gm) in spinal hemisected controls (gray column) and in test animals with T13 nerve insertion at the time of hemisection (black column). Measurements were collected during weeks 3 and 4 and combined because mean forces at these two survival times were not significantly different. B, Regression of static knee angle (data from weeks 3 and 4) and knee angle at the force criterion of 20 gm.
Stimulation of regenerating T13 axons evoked leg movements in hemisected animals with abated spastic signs
Of the six test animals examined above, we were able to stimulate the inserted T13 nerve in five during a terminal physiology experiment (the sixth animal died while preparing the nerve for tracer injection). Threshold stimulation evoked contraction of leg muscles in each animal: in two, stimulation evoked contraction of knee extensors and, in addition in one, hip movement (see video clip in supplementary material; available at www.jneurosci.org); in two others, digit movement, and in one, ankle movement. Figure 14 shows a representative example of an ensemble average (n = 9 stimuli; top trace) of an EMG recording made from an extrinsic digit muscle, and the raster below shows the individual responses (thin traces). A typical burst of activity with multiple peaks was evoked in response to stimulation (light gray column). Surprisingly, the evoked burst was followed by a 10-30 msec period in which there was no EMG activity (evoked or spontaneous). Suppression of EMG activity was revealed because of the high level of spontaneous activity present in the spinal-injured animal. This suggests that regenerating T13 axons form synapses on inhibitory interneurons in the lumbosacral cord, in addition to activating neurons to produce muscle contraction.
In all animals (including the one not tested physiologically) we confirmed the presence of the inserted nerve within the lumbosacral cord, using anterograde tracing (n = 2 rats) or staining for ChAT (n = 4). In the latter cases, the inserted nerve stained heavily for ChAT, and we could follow stained axons into the surrounding tissue (similar to Figs. 4 and 7A1,B1). Importantly, tracing of Neurobiotin-stained axons confirmed that the hemisection and insertion did not promote the growth of processes from spinal neurons into T13.
We had an additional animal (not included in Table 1) that received a spinal hemisection and inserted T13 nerve, but which developed robust spastic signs like those of the controls. Thus, at week 4 the knee angle was 60.3°, the ankle angle was 160.4°, and digit flexion was a category 4. These are all similar to values in animals without T13 nerve insertion. When we exposed and stimulated T13 as usual, no muscle contractions were elicited, and an anterograde tracer showed that no axons had entered the spinal cord. This serves as an additional control for the effects of nerve insertion. As a consequence we eliminated this animal from the test group.
These findings show that the presence of the regenerating T13 nerve inserted into the lumbosacral gray matter, verified physiologically and histologically, significantly reduces the spasticity-like signs (increased flexor force) associated with spinal hemisection. The 2 week delay in the beneficial effects is consistent with the time necessary for T13 axon regeneration and synapse formation.
Insertion of T13 below a spinal cord lesion reduced muscle wasting
The presence of a T13 nerve insertion correlated with the activation of hindlimb muscles, and this should contribute to maintaining muscle tone. Although we noticed that spinal hemisection caused muscle wasting in the ipsilateral hindleg in both the control and test animals, visual inspection suggested that there was less wasting in the test animals. To determine whether this was correct, we dissected and weighed eight hindlimb muscles on each side (i.e., ipsilateral and contralateral to the principal side of the spinal lesion; see Materials and Methods) after each animal was killed. We computed an index of muscle wasting for each muscle. This corresponded to the difference between the weight of the muscle on the lesioned side and the weight of the same muscle on the unlesioned side, divided by the weight of the muscle on the unlesioned side. Comparison of the mean muscle wasting index for all muscles for the two groups showed significantly less wasting in the test group (combined mean for test animals = 41.1%; mean for control animals = 64.7%; t = 6.535; p < 0.0001).
Discussion
The most significant findings in this report are that: (1) axons of T13 motor neurons readily regenerate into motor areas within the spinal cord; (2) electrical stimulation of T13 axons evokes robust contractions of lumbosacral muscles in animals with either an intact or hemisected spinal cord; (3) regenerating T13 axons can be targeted to sites that activate specific muscle groups; and (4) the presence of regenerating T13 axons in hemisected animals was associated with a significant reduction in aberrant spasticity-like flexor tone, greater hindlimb mobility, and reduced muscle wasting on the ipsilateral side caudal to the spinal injury. These data indicate that novel spinal circuits can be fashioned by exploiting the regenerative capabilities of motor neurons. This approach can be used to bypass a spinal cord injury by redirecting motor axons from a site rostral to the level of injury to a site caudal to injury. Furthermore, this approach is well suited for chronic spinal injury because it does not depend on achieving regeneration before scar formation, as do methods for promoting axon regeneration through the lesion site.
Axons from an inserted T13 nerve regenerate into the spinal cord
Morphological studies showed that motor axons from T13 regenerate into the spinal gray matter. The growth appeared to be directed because many of the axons grew into the lumbar ventral horn (Fig. 2), which contains the motor neurons that drive leg muscles. The regenerating axons were recognized by an antibody to ChAT (Fig. 4), indicating that they are from motor neurons, the only major cholinergic axons in T13, and the presence of VAT-stained varicosities and en passant type endings on and near ventral horn motor neurons indicated that some of the axons had formed functional cholinergic synapses. Some of these resembled the large “C”-type terminals on somatic motoneurons (Arvidsson et al., 1997). Cholinoreceptive neurons are present in the intermediate zone and ventral horn (Gillberg et al., 1988), which are target zones of regenerating T13 axons. Interestingly, cholinoreceptive neurons are also present in the superficial dorsal horn (Gillberg et al., 1988), yet the regenerating T13 axons spared this region. This is additional evidence for targeting, along with the observation that T13 axons did not cross the midline.
Although T13 sensory axons were affected by barriers that restrict axon growth into the CNS, the regenerating cholinergic T13 axons were not. These barriers are both molecular (Davies et al., 1999; Fawcett and Asher, 1999; Ramer et al., 2001a), which can be partially overcome by administering growth factors (Ramer et al., 2001b) or by elevating cAMP levels (Neumann et al., 2002; Qiu et al., 2002), and physical, such as cavitation. Given these constraints, there are two potential explanations for the substantial regeneration of the T13 axons. First, T13 insertion caused minimal damage and cavitation, and dissociated DRG neurons can regenerate in an undamaged spinal cord (Davies et al., 1997; Davies et al., 1999). Second, the peripheral axon of motor neurons, because it would normally never be exposed to the CNS environment, might be less sensitive to the spinal inhibitory factors.
Activation of regenerated T13 axons elicits electrical responses in the spinal cord and evokes appropriate muscle contraction
T13 nerve stimulation elicited localized field potentials in the ventral horn, as well as from other areas containing regenerating T13 axons (Fig. 7). Given these findings, it was perhaps not surprising that stimulation also evoked muscle contractions in regions innervated by lumbosacral motoneurons. What was striking was that the ability to drive specific sets of muscles depended on the site at which T13 was inserted. This meant that regenerating T13 motor axons target specific sets of motoneurons. Moreover, the high degree of success in evoking leg and back movements in response to T13 stimulation suggests that a relatively small number of axons is sufficient to activate intrinsic motor circuits. We propose that synapses form between regenerating T13 motor axons and lumbar spinal neurons. Although this is remarkable, given that motoneurons normally direct muscle contraction and not the activity of other neurons, motoneurons do synapse on cholinoreceptive neurons in the CNS via recurrent axon collaterals (Lagerback et al., 1981). Therefore, they are inherently capable of forming synapses on neurons. Motoneurons contain agrin, a key organizing molecule of the developing central and neuromuscular synapses (Burgess et al., 2000), which might be able to organize formation of the novel synapses between regenerating T13 axons and spinal neurons.
Insertion of T13 below a spinal cord hemisection reduces spastic signs and muscle wasting and increases joint mobility
Our goal was to use the nerve insertion procedure to bypass a spinal cord injury, and fortunately, the T13 motor axons readily regenerated into the hemisected spinal cord. A representative reconstruction revealed extensive growth of T13 axons into the cord below the hemisection, and labeling studies showed that the axons had varicosities within lumbar motor nuclei. Thus, the distribution and morphology of the regenerating fibers was indistinguishable from that observed after T13 insertion into the intact spinal cord (compare Figs. 2 and 4 with Fig. 9). Movement at the hip, knee, ankle, and digits (Fig. 14; supplementary material; available at www.jneurosci.org) was evoked by T13 stimulation across the animals in the behavioral experiments. The diversity of effects is consistent with the organization of the lumbosacral motor pools. For example, motor nuclei for five ankle and digit muscles are located in a 1 mm portion of the L4/5 junction, and knee motoneurons are present in rostral L4 (Peyronnard et al., 1986). Thus, T13 axons would have to regenerate only short distances to contact motoneurons innervating all major leg joints.
A surprising finding was that the hemisection produced a flexed joint angle and an increase in flexor tone, resembling spasticity, and that this was markedly reduced in animals with regenerating T13 axons. Why did our lesion produce spastic signs when others failed (Ashby and McCrea, 1987)? The most likely reason is that the hemisection interrupts descending connections of inhibitory L2 propriospinal neurons that project to the lumbosacral cord (Cavallari and Pettersson, 1989). Bennett et al. (1999, 2001a,b) proposed that the spastic signs they observed in rat tail muscles after sacral lesions were caused by the interruption of these propriospinal connections. The lesion we made, which was at L2/3, also could have disrupted the intrinsic circuitry that organizes features of rhythmic hindlimb movements (i.e., central pattern generator). Although this could lead to the absence of ipsilateral hindlimb movements, it also could have contributed to development of the spastic signs.
T13 nerve insertion procedure has advantages over other bridging and grafting approaches
We have shown that it is possible to engineer the formation of novel synaptic connections by using regenerating peripheral motor axons to engage intrinsic spinal circuits that control limb and trunk muscles. These circuits are stable because they persisted for a year after the insertion, which is the longest period that we examined. Our protocol is an extension of the nerve bypass approach that was pioneered by David and Aguayo (1981) and that was modified recently by Gauthier et al. (2002). Liu et al. (1999) have also used this approach to promote motor axon growth directly to muscles paralyzed by spinal lesion. Each of these groups used an isolated peripheral nerve segment as a conduit to direct axons from one spinal cord level to another. Our approach is designed specifically to restore motor functions lost because of a spinal injury and differs significantly from the Aguayo approach, in two ways. First, the inserted T13 nerve is the source of the regenerating motor axons; it does not require growth of spinal neurons into the nerve. Neither the number nor the phenotype of the axons that enter an isolated nerve segment can be regulated. Second, the regenerating T13 motor axons are not constrained to contact neurons close to the insertion site (Gauthier et al., 2002), but clearly navigate within the spinal cord to seek cholinoreceptive targets. Recovery of locomotor-like behaviors in neonatal and adult animals has been achieved by implanting embryonic neural tissue caudal to an injury (Miya et al., 1997; Barbeau et al., 1999; Ribotta et al., 2000; Rossignol et al., 2001; Orsal et al., 2002). The implants in adults are thought to supply missing neurotransmitters, notably monoamines. Although embryonic neurons can regenerate axons into motor regions of the lumbar cord (Ribotta et al., 2000), they cannot form functional neural circuits with neurons rostral to the spinal section. In contrast, the regenerating T13 axons form rudimentary circuits (stimulation evokes muscle contraction) and the T13 motoneurons retain supraspinal control because they are rostral to the hemisection. The latter is especially important. The well documented ability of higher motor centers to adapt to changes in peripheral innervation (Donoghue and Sanes, 1988) leads us to propose that these centers can learn to transmit signals to the regenerated nerve, thereby reestablishing voluntary control of movements below an injury to the spinal cord.
Footnotes
This work was supported by Grant C016887 from the New York State Department of Health Spinal Cord Injury Research Board, by The Christopher Reeve Foundation, and by National Institutes of Health Medical Scientist Training Program Grant 5 T32 GM 07367-27. We thank Dr. Q. Li for help with the initial anterograde tracer experiments and Dr. G. Gaal for help with the retrograde label experiments, Dr. Sam Schacher for many helpful discussions, Dr. Gerry Fischbach for comments on a previous version of this manuscript, XiuLi Wu and M. Anwar for immunocytochemistry and histochemistry, Michelle Choy for help with behavioral experiments, and Dr. Mo Osman for veterinary care.
Correspondence should be addressed to Dr. John H. Martin, Center for Neurobiology and Behavior, Columbia University, 1051 Riverside Drive, New York, NY 10032. E-mail: jm17@columbia.edu.
Copyright © 2004 Society for Neuroscience 0270-6474/04/242090-12$15.00/0
References
- Arvidsson U, Riedl M, Elde R, Meister B (1997) Vesicular acetylcholine transporter (VAChT) protein: a novel and unique marker for cholinergic neurons in the central and peripheral nervous systems. J Comp Neurol 378: 454-467. [PubMed] [Google Scholar]
- Ashby P, McCrea DA (1987) Neurophysiology of spinal spasticity. In: Handbook of the spinal cord (Davidoff RA, ed), pp 119-143. New York: Dekker.
- Barbeau H, McCrea DA, O'Donovan MJ, Rossignol S, Grill WM, Lemay MA (1999) Tapping into spinal circuits to restore motor function. Brain Res Brain Res Rev 30: 27-51. [DOI] [PubMed] [Google Scholar]
- Basso DM, Beattie MS, Bresnahan JC (1995) A sensitive and reliable locomotor rating scale for open field testing in rats. J Neurotrauma 12: 1-21. [DOI] [PubMed] [Google Scholar]
- Behar O, Mizuno K, Neumann S, Woolf CJ (2000) Putting the spinal cord together again. Neuron 26: 291-293. [DOI] [PubMed] [Google Scholar]
- Bennett DJ, Li Y, Siu M (2001a) Plateau potentials in sacrocaudal motoneurons of chronic spinal rats, recorded in vitro. J Neurophysiol 86: 1955-1971. [DOI] [PubMed] [Google Scholar]
- Bennett DJ, Li Y, Harvey PJ, Gorassini M (2001b) Evidence for plateau potentials in tail motoneurons of awake chronic spinal rats with spasticity. J Neurophysiol 86: 1972-1982. [DOI] [PubMed] [Google Scholar]
- Bennett DJ, Gorassini M, Fouad K, Sanelli L, Han Y, Cheng J (1999) Spasticity in rats with sacral spinal cord injury. J Neurotrauma 16: 69-84. [DOI] [PubMed] [Google Scholar]
- Brushart TM, Hoffman PN, Royall RM, Murinson BB, Witzel C, Gordon T (2002) Electrical stimulation promotes motoneuron regeneration without increasing its speed or conditioning the neuron. J Neurosci 22: 6631-6638. [DOI] [PMC free article] [PubMed] [Google Scholar]
- Burgess RW, Skarnes WC, Sanes JR (2000) Agrin isoforms with distinct amino termini: differential expression, localization, and function. J Cell Biol 151: 41-52. [DOI] [PMC free article] [PubMed] [Google Scholar]
- Cavallari P, Pettersson L-G (1989) Tonic suppression of reflex transmission in low spinal cats. Exp Brain Res 77: 201-212. [DOI] [PubMed] [Google Scholar]
- David S, Aguayo AJ (1981) Axonal elongation into peripheral nervous system “bridges” after central nervous system injury in adult rats. Science 214: 931-933. [DOI] [PubMed] [Google Scholar]
- Davies SJ, Fitch MT, Memberg SP, Hall AK, Raisman G, Silver J (1997) Regeneration of adult axons in white matter tracts of the central nervous system. Nature 390: 680-683. [DOI] [PubMed] [Google Scholar]
- Davies SJ, Goucher DR, Doller C, Silver J (1999) Robust regeneration of adult sensory axons in degenerating white matter of the adult rat spinal cord. J Neurosci 19: 5810-5822. [DOI] [PMC free article] [PubMed] [Google Scholar]
- Donoghue JP, Sanes JN (1988) Organization of adult motor cortex representation patterns following neonatal forelimb nerve injury in rats. J Neurosci 8: 3221-3232. [DOI] [PMC free article] [PubMed] [Google Scholar]
- Fawcett JW, Asher RA (1999) The glial scar and central nervous system repair. Brain Res Bull 49: 377-391. [DOI] [PubMed] [Google Scholar]
- Fu SY, Gordon T (1997) The cellular and molecular basis of peripheral nerve regeneration. Mol Neurobiol 14: 67-116. [DOI] [PubMed] [Google Scholar]
- Gauthier P, Rega P, Lammari-Barreault N, Polentes J (2002) Functional reconnections established by central respiratory neurons regenerating axons into a nerve graft bridging the respiratory centers to the cervical spinal cord. J Neurosci Res 70: 65-81. [DOI] [PubMed] [Google Scholar]
- Gillberg PG, d'Argy R, Aquilonius SM (1988) Autoradiographic distribution of [3H]acetylcholine binding sites in the cervical spinal cord of man and some other species. Neurosci Lett 90: 197-202. [DOI] [PubMed] [Google Scholar]
- Keirstead SA, Rasminsky M, Fukuda Y, Carter DA, Aguayo AJ, Vidal-Sanz M (1989) Electrophysiologic responses in hamster superior colliculus evoked by regenerating retinal axons. Science 246: 255-257. [DOI] [PubMed] [Google Scholar]
- Lagerback PA, Ronnevi LO, Cullheim S, Kellerth JO (1981) An ultrastructural study of the synaptic contacts of alpha-motoneurone axon collaterals. I. Contacts in lamina IX and with identified alpha-motoneurone dendrites in lamina VII. Brain Res 207: 247-266. [DOI] [PubMed] [Google Scholar]
- Li Q, Martin JH (2001) Postnatal development of corticospinal axon terminal morphology in the cat. J Comp Neurol 435: 127-141. [DOI] [PubMed] [Google Scholar]
- Liu S, Kadi K, Boisset N, Lacroix C, Said G, Tadie M (1999) Reinnervation of denervated lumbar ventral roots and their target muscle by thoracic spinal motoneurons via an implanted nerve autograft in adult rats after spinal cord injury. J Neurosci Res 56: 506-517. [DOI] [PubMed] [Google Scholar]
- Lorente de Nó RA (1947) A study of nerve physiology: studies from Rockefeller Institute for Medical Research. New York: Institute for Medical Research. [PubMed]
- Martin JH, Kably B, Hacking A (1999) Activity-dependent development of cortical axon terminations in the spinal cord and brain stem. Exp Brain Res 125: 184-199. [DOI] [PubMed] [Google Scholar]
- Mesulam M-M (1982) Principles of horseradish peroxidase neurohistochemistry and their applications for tracing neural pathways axonal transport, enzyme histochemistry, and light microscopic analysis. In: Tracing neural connections with horseradish peroxidase (Mesulam M-M, ed), pp 1-151. New York: Wiley.
- Miya D, Giszter S, Mori F, Adipudi V, Tessler A, Murray M (1997) Fetal transplants alter the development of function after spinal cord transection in newborn rats. J Neurosci 17: 4856-4872. [DOI] [PMC free article] [PubMed] [Google Scholar]
- Neumann S, Bradke F, Tessier-Lavigne M, Basbaum AI (2002) Regeneration of sensory axons within the injured spinal cord induced by intraganglionic cAMP elevation. Neuron 34: 885-893. [DOI] [PubMed] [Google Scholar]
- Orsal D, Barthe JY, Antri M, Feraboli-Lohnherr D, Yakovleff A, Gimenez y Ribotta M, Privat A, Provencher J, Rossignol S (2002) Locomotor recovery in chronic spinal rat: long-term pharmacological treatment or transplantation of embryonic neurons? Prog Brain Res 137: 213-230. [DOI] [PubMed] [Google Scholar]
- Pearson KG, Fouad K, Misiascek JE (1999) Adaptive changes in motor activity associated with functional recovery following muscle denervation in walking cats. J Neurophysiol 82: 370-381. [DOI] [PubMed] [Google Scholar]
- Peyronnard JM, Charron LF, Lavoie J, Messier JP (1986) Motor, sympathetic and sensory innervation of rat skeletal muscles. Brain Res 373: 288-302. [DOI] [PubMed] [Google Scholar]
- Qiu J, Cai D, Dai H, McAtee M, Hoffman PN, Bregman BS, Filbin MT (2002) Spinal axon regeneration induced by elevation of cyclic AMP. Neuron 34: 895-903. [DOI] [PubMed] [Google Scholar]
- Ramer MS, McMahon SB, Priestley JV (2001a) Axon regeneration across the dorsal root entry zone. Prog Brain Res 132: 621-639. [DOI] [PubMed] [Google Scholar]
- Ramer MS, Duraisingam I, Priestley JV, McMahon SB (2001b) Two-tiered inhibition of axon regeneration at the dorsal root entry zone. J Neurosci 21: 2651-2660. [DOI] [PMC free article] [PubMed] [Google Scholar]
- Ribotta MG, Provencher J, Feraboli-Lohnherr D, Rossignol S, Privat A, Orsal D (2000) Activation of locomotion in adult chronic spinal rats is achieved by transplantation of embryonic raphe cells reinnervating a precise lumbar level. J Neurosci 20: 5144-5152. [DOI] [PMC free article] [PubMed] [Google Scholar]
- Rossignol S (2000) Locomotion and its recovery after spinal injury. Curr Opin Neurobiol 10: 708-716. [DOI] [PubMed] [Google Scholar]
- Rossignol S, Giroux N, Chau C, Marcoux J, Brustein E, Reader TA (2001) Pharmacological aids to locomotor training after spinal injury in the cat. J Physiol (Lond) 533: 65-74. [DOI] [PMC free article] [PubMed] [Google Scholar]


