

Abstract
The effects of behavioral training on early visual representations have been elusive when assessed with firing rates. Learning-induced changes in performance, however, suggest that representations should encompass early cortical stages. Here, we address the question of whether training-induced effects are pertinent to neuronal activity outside the task proper, which is a requirement if subsequent perceptional processes should profit from training. To search for a neuronal signature of training effects beyond firing rates, we measured local field potentials, multiunit and isolated spike activity during passive viewing of previously learned stimulus response associations (S+ and S-) in areas 17/18 and 21a of two alert cats. Evoked potential responses as well as gamma oscillations even during the first 200 msec were found to be stronger for S+ in both areas. Most importantly, the later parts of the response (>200 msec) not only exhibit a highly significant difference in coherent gamma oscillations for S+ and S- both within and across areas, but are also characterized by a pronounced preference in firing rate for S+ in area 21a, whereas primary cortex shows a nonsignificant trend for weaker spike responses. From these results, we conclude that training-induced plasticity occurs in adult visual cortex for behaviorally relevant stimuli by changing primarily the temporal structure of neuronal activity at early stages of cortical processing, whereas later stages of cortical processing express the increased coherence of their input in elevated firing rates.
Keywords: gamma, oscillations, synchrony, rate coding, training, vision, recognition
Introduction
Evidence for cortical plasticity in adult animals has been reported in various primary sensory areas. In the somatosensory (Recanzone et al., 1992) and auditory cortices (Recanzone et al., 1993), plasticity is driven by behavioral training. In the visual system, such a relationship has been investigated by measuring firing rates. However, although one study reported subtle effects (Schoups et al., 2001), another study could not observe them (Ghose et al., 2002). In contrast, evidence is available that plasticity occurs at higher stages (Logothetis et al., 1995; Kobatake et al., 1998). Presently, it is not resolved whether and how changes at lower and higher levels are related.
A new perspective on the interaction of different processing levels during visual perception emphasizes the role of neuronal oscillations and their synchronization (Engel et al., 2001). According to this view, during active vision, cortical areas at different processing levels interact continuously on the basis of oscillatory activity that synchronizes dynamically depending on the behavioral context (Roelfsema et al., 1997; von Stein et al., 2000). Such a synchronization may be a mechanism to integrate multiple features of stimuli to form a coherent percept (Singer, 2001). The temporal structure of neuronal activity directly relates to synaptic plasticity as demonstrated on the level of single neurons (Markram et al., 1997), known by the name of spike time-dependent plasticity (Gerstner et al., 1996). Similarly, the plasticity of visual representations on a population level is dependent on precise stimulus timing (Schuett et al., 2001; Yao and Dan, 2001; Fu et al., 2002). This raises the question of how changes in the synchronization of neuronal activity relate to the plasticity of sensory representations at different levels of the hierarchy.
These considerations also provide a framework for the emerging view on attentional mechanisms. Synchronization of neuronal activity is modulated according to the attentional demand, attended representations being more synchronized than nonattended (Steinmetz et al., 2000; Fries et al., 2001). Although attentional effects on neuronal responses are more pronounced in higher areas, they also operate at the level of the primary visual cortex (Ito and Gilbert, 1999; Pessoa et al., 2003). Attentional mechanisms, learning, and the resulting changes in neuronal representations therefore seem to be closely related.
Here, we study the plasticity of neuronal representations in the cat visual system as expressed by the amplitude of the neuronal response and the interaction of populations of neurons. We investigate training effects on local field potentials, multiunit and isolated unit activity in primary (area 17/18) and secondary (area 21a) visual cortices. The animals first learn to discriminate orthogonal drifting gratings (S+ and S- for bar press required and not required, respectively). We then compare the dynamics of evoked, oscillatory, synchronous, and spiking activity outside of the task proper, which consisted in passive viewing of S+ and S- stimuli with appropriate food delivery. Two controls check for context effects, using additional distractors and no food delivery, and for stimulus specificity, using gratings of higher spatial frequency. A subsequent and last phase investigates extinction of training effects on neuronal activity.
Materials and Methods
Animals. Two 1-year-old female cats were used in this study. Animals were socially housed in a rich environment under natural light/dark conditions. Access to food was possible only in the experimental room and during the behavioral training. All of the procedures were in accordance with the Zurich cantonal guidelines for the use of experimental animals and conformed to the American National Institutes of Health and Society for Neuroscience regulations.
Behavioral habituation and training. The cats were placed in a 0.3 × 0.3 × 0.8 m box. The box was equipped with a lever and a cavity where liquid food (Whiskas mixed with water) was delivered by a pump (1500 XL; EFD, East Providence, RI). A transparent window prevented the animal from getting close to the monitor, which was situated ∼0.5 m from the usual position of the animal's head.
A pretraining procedure consisted in conditioning the animal to face the monitor and to press the bar (less than three failures of bar pressing in two consecutive sessions). This was achieved by using operant conditioning principles and by manually reinforcing the desired sequence of behaviors. Pretraining lasted ∼1 week.
Then, the animals were trained on a go/no-go task consisting of discriminating between two visual stimuli. These were drifting gratings, either horizontally or vertically oriented, with spatial and temporal frequencies of 0.16 cycles/° and 1.6 cycles/sec, respectively. The assignment of stimuli (S+, S-) was balanced across the two subjects. The animals were trained to indicate the presence of S+ by pressing the lever during the presentation of the stimulus (maximum duration, 6.0 sec). After correct responses, food was immediately delivered. Incorrect responses were followed by flashing lights, a loud train of tones, and a restart of the trial with the same stimulus. The stimulus sequence was random, and stimuli were separated by uniform gray screens. The length of such blanks varied randomly between 4.0 and 7.0 sec. A session ended when the cat stopped performing the task, and usually consisted of 30-60 stimulus presentations. The cats were trained daily until they reached a stable performance level (>75%), which took ∼2 months.
Two weeks before surgery, the animals were daily habituated to the restraining procedure and the recording setup
Surgery. A microdrive, containing four movable electrodes (nichrome wire; 500-1000 kΩ impedance at 1 kHz), was implanted under aseptic conditions. The animals were anesthetized using ketamine hydrochloride (20 mg/kg; Narketan, Chassot, Bern, Switzerland) and xylazine hydrochloride (1.1 mg/kg; Rompun, Bayer, Leverkusen, Germany). They were intubated, ventilated (30% O2 and 70% NO2), and continuously anesthetized with isoflurane (0.4-1.5%). Body temperature, end-expiratory CO2, and blood oxygenation were continuously monitored and kept in the desired physiological ranges (37-38°C; 3-4%; and 90-100%, respectively). The animals were continuously infused with Ringer-lactate solution (10 ml/hr) and received intramuscular injections of steroids and analgesics. Eight titanium screws were fixed in the skull to anchor the implant. Reference and ground electrodes were placed between dura and skull in separate holes. Two small craniotomies (3 mm diameter) were made over areas 17/18 and 21a of one hemisphere according to stereotaxic coordinates [anteroposterior, -3; lateral, 2-4; and lateral, 8-10, respectively (Tusa et al., 1978; Tusa and Palmer, 1980)]. After removing the dura, the microdrive was positioned so that the electrodes, two in each area, 1.0 mm apart, were approximately in the cortex. Using dental acrylic (Stoelting, Wood Dale, IL), the implant was fixed to the skull and screws. The cavities in the craniotomies were filled with silicon oil (Dow Corning, New Bedford, MA). Holding screws, later used to fix the animal's head in the recording setup, were inserted into the implant with acrylic cement. Recording sessions began only after the animal had fully recovered, usually after 4 d.
Recording procedures and experimental protocol. For recordings, the animals were put in a sleeve, which was equipped with adjustable Velcro fasteners. The restrained animal was placed in an acrylic tube allowing stable positioning. The tube was adjusted within a Faraday cage, and the head of the animal was fixed using the holding screws. With this procedure, body movements were limited. A small cavity could be adjusted to feed the animal in the recording setup using the same pump as for the go/no-go task.
During the main phase of the experiments, recording sessions consisted of three parts. The principal part consisted in a similar presentation of the stimulus paradigm used in the go/no-go task. The other parts used either a varying context of the reinforced stimuli or a variation of stimulus parameters. The three parts are referred to as passive viewing, context control, and stimulus control, respectively. These parts lasted 10, 5, and 5 min, respectively. Passive viewing was always second in the sequence, whereas context control and stimulus control were either first or last in the sequence (Fig. 1). Passive viewing consisted in presenting the identical stimuli (S+ and S-) as in the go/no-go task for 3.0 sec in a pseudorandom sequence. No response by the subject was required, and S+ was immediately followed by food delivery. The context control consisted in presenting S+ and S- for a shorter duration (1.0 sec) and interspaced with 10 distractors in a pseudorandom sequence. The distractors were drifting gratings of the same spatial and temporal frequencies as the trained stimuli. The directions of movement of all 12 stimuli were distributed evenly over 360°. The stimulus control consisted in presenting a total of 12 drifting gratings (six orientations evenly spread over 360° with the two drifting directions) with higher spatial (0.5 cycles/°) and temporal (2.0 cycles/sec) frequencies than for the basic paradigm. In both the context control and stimulus control, no food was given to the subjects, and stimuli were separated by a blank with identical luminance as in the basic paradigm, but with a shorter, fixed duration (0.5 sec). During this first phase, the position of all of the electrodes was changed by steps of 75-125 μm every few days. After having moved the electrodes for a total of 750 μm into the cortex, the reinforced stimuli were subject to extinction. S+ and S- were shown as during passive viewing, but with S- followed by food. During this final phase, the position of the electrodes was kept constant.
Figure 1.

Phases of a recording session. A recording session includes passive viewing, context control, and a stimulus control. The respective durations of the three conditions were 10, 5, and 5 min. During passive viewing, food was delivered after the S+, which was either a horizontal or vertical grating depending on the cat. During context control, S+ and S- were presented with various distractors and without food delivery. The stimulus control was a series of drifting gratings having different parameters than the stimuli on which the cat had been trained. Blanks were presented between each stimulus. S+ and S- correspond to the respective go and no-go stimulus used for training.
Stimulus presentation. Stimuli were presented on a 19 inch Hitachi (Tokyo, Japan) cathode ray tube monitor (120 Hz refresh rate) 0.5 m in front of the animal in a darkened room. The stimuli were generated by a personal computer. Passive viewing and extinction stimuli were presented using Matlab (Mathworks, Natick, MA) code based on the Psychophysics Toolbox extensions (Brainard, 1997; Pelli, 1997). Context control and stimulus control stimuli were presented using Microsoft (Redmond, WA) Windows media player (version 7.01.00.3055).
Signal processing and data analysis. Signals picked up by the electrodes were first passed through a 24-channel preamplifier (Neurotrack; 10× amplification), and then amplified and digitized using a Synamps system (Neuroscan, El Paso, TX) at a temporal resolution of 20 kHz.
Off-line analysis of the local field potentials was performed in Matlab. The local field potential was extracted by low-pass filtering the recorded signals <1 kHz (Fig. 2 A). Each recording session was divided into single trials consisting of a stimulus presentation and the preceding blank. If the maximal amplitude of the recorded signals on any channel exceeded eight times the SD of the signal (over the entire session), the trial was discarded. The amplitude of neuronal oscillations was quantified by the power spectrum of the local field potential. Because the gamma range of these oscillations is suggested to have different functions than lower frequencies (Siegel et al., 2000; von Stein and Sarnthein, 2000), we first analyzed the amplitude variation relative to the frequency. For each trial during passive viewing, the time-localized Fourier spectrum (Fig. 2B, spectrogram) was computed using windows of 100 msec length overlaid with a Hanning window and zero-padded to 1000 msec. The overlap of neighboring windows was 50 msec. Neuronal responses have been dissociated in various phases involving usually a stimulus-locked phase involving transient activity and a later phase involving sustained activity. The precise distinction between these phases varies according to the authors but is usually within a range of a couple of hundred milliseconds from stimulus onset (Bertrand and Tallon-Baudry, 2000; Rols et al., 2001). Therefore, we chose to use two different time windows in which the stimulus activity was averaged: the transient phase (from stimulus onset to 200 msec) and sustained phase (from 200 to 3000 msec after stimulus onset). The percentage of modulation of the power at each frequency, in the following referred to as a modulation curve, was calculated as the activity during stimulation normalized by the activity during the blank period (averaged for 200 msec up to 50 msec before stimulus onset). In other words, the stimulus activity was first subtracted and divided by the blank activity, and second, multiplied by 100 (Fig. 2B, right).
Figure 2.
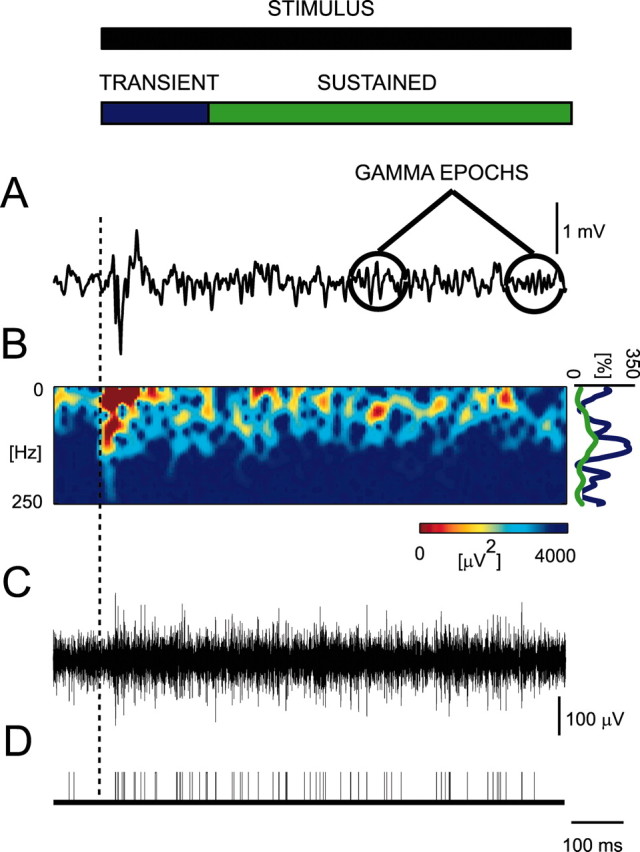
Example of 1.0 sec of recording of a single trial. From the local field potential (A), a spectrogram (B) is computed, and a modulation curve (B, right-hand side of the spectrogram) is computed for the transient (blue; <200 msec) and sustained (green; >200 msec) phases. Multiunit activity is sometimes found in the same electrode (C). Using threshold discrimination and other criteria described in Materials and Methods, spike times are measured (D). The time scale in D is the same as in other panels. Note that, in the local field potentials, gamma oscillations are not continuous within single trials but occur as epochs. The occurrence of these gamma epochs varies among the trials, and only if the spectrograms are averaged over all of the trials does the gamma activity appear as continuous (data not shown).
Multiunit activity was analyzed after high-pass filtering the data at 1 kHz (Fig. 2C). Possible action potentials were identified by applying a minimum threshold of 3 SDs of the signal (Fig. 2D). A maximum threshold of 8 SDs was applied to filter out artifacts. The signal-to-noise ratio was computed with the maximum of the mean waveform as the level of the signal and the mean SD 1.0 msec before and after the event as the noise. The modulation was characterized as the mean firing rate 100 msec after onset and divided by the mean firing rate during the blank (for 200 msec, from 250 msec before onset). Multiunits were included in the analysis if their signal-to-noise ratio exceeded 2.5, their mean firing rate was >1.0 spikes/sec, and their firing rate modulation exceeded 1.5. Multiunit identification was applied separately for the passive viewing, context control, and stimulus control. If the number of multiunit sites was too small (n < 3) for any given condition, the data were not included because of the difficulty of interpretation.
Subpopulations of multiunit having similar waveforms for their spikes could be isolated using the software Spiker (http://www.cns.caltech.edu/~gabriel/academia/spike_sorting.html). The principal component analysis was performed on waveforms of 1.0 msec length. The dimensionality of the data set was reduced by keeping only the eigenvectors capturing 50% of the total variance. We used equal weights for all of the data points and seven iterations. Signals were considered to be representing isolated units if the first versus the second and/or the third component showed clear clustering (Fig. 3A). In addition, the action potential waveform was subjectively checked for all of the selected units (Fig. 3B).
Figure 3.

Isolation of a subpopulation of units. Occasionally, units are isolated using a principal component analysis on the basis of the spike waveform. Units are considered to be isolated if they show clear clustering of their spikes (A) compared with the rest of the population (on the projection between the first and the second and/or third principal components). Then, we visually check their spike waveform (B).
Statistical comparisons of stimuli, areas, and control conditions rest on ANOVA. Main effects of factors were interpreted as a significant influence of the underlying variable. Significant interactions of factors were interpreted as different reactions of cortical areas to the stimuli and control conditions.
Results
In each animal and session, four sites were simultaneously recorded, two in area 17/18 and two in area 21a. We recorded a total of 31 sessions, and for each measure, data obtained from a similar recording site during different sessions were averaged to count as a single measure for this cortical site. The results include data from a total of 92 different sites, 46 in each area (28 from cat S and 18 from cat L). Independent multiunit activity was found in 59 sites, 36 in area 17/18 and 23 in area 21a. From these 59 sites, 17 subpopulations of units could be isolated according to their waveforms.
Effects of training during passive viewing
Evoked potential
The evoked potential is a classical measure used in electroencephalogram studies to quantify cortical activity. To test whether the responses to the positively (S+) and negatively (S-) reinforced stimuli differ, we compute the evoked potential for each session of a passive viewing phase by averaging the local field potential of all of the trials. This stimulus-locked potential is characterized by a minimum and a maximum, and its latency is defined as the time from the stimulus onset to the occurrence of the first extremum independently of its sign. An ANOVA reveals no significant effects of stimuli on the evoked potential latency (F(1,90) = 1.639; p = 0.20), a tendency for area 17/18 to have shorter evoked potential latencies than area 21a (mean, 35 and 40 msec, respectively; F(1,90) = 2.674; p = 0.10) and no significant interaction between these two factors (F(1,90) = 0.808; p = 0.37). When the absolute amplitude of the evoked potential is averaged over the 200 msec after stimulus onset and normalized by the stronger amplitude between the two stimuli, we find significantly higher absolute amplitude for S+ than for S- (F(1,90) = 5.798; p < 0.05). This effect on the absolute amplitude is attributable to the late phase of the evoked potentials as shown in Figure 4. No effect attributable to area (F(1,90) = 0.175; p = 0.68) and no significant interaction were found (F(1,90) = 0.786; p = 0.38). Thus, during passive viewing, the occurrence and the amplitude of the first extremum of the evoked potential do not differ between S+ and S-, whereas the mean absolute amplitude does (for a summary, see Table 1).
Figure 4.

Representative examples of evoked potentials during passive viewing. The horizontal bar represents the presence of the stimulus. For the population statistics (Table 1), the evoked potentials are averaged within 200 msec (shaded area) independently of the sign and normalized to the maximum. Note that the difference between S+ and S- evoked potentials is primarily attributable to the late part of the response.
Table 1.
Percentage of average evoked potentials and modulation strength (±SEM) during passive viewing
|
|
Transient phase (<200 msec) |
Sustained phase (>200 msec) |
|
||||
|---|---|---|---|---|---|---|---|
|
|
S+ |
S− |
S+ |
S− |
n
|
||
| Evoked potentials | |||||||
| Area 17/18 | 94.3 ± 1.6 | 86.8 ± 2.0 | 46 | ||||
| Area 21a | 91.8 ± 1.7 | 88.3 ± 2.0 | 46 | ||||
| Power | |||||||
| Area 17/18 | 66.86 ± 4.76 | 56.97 ± 3.61 | 41.86 ± 2.50 | 29.81 ± 1.40 | 46 | ||
| Area 21a | 52.28 ± 5.12 | 35.47 ± 2.87 | 39.03 ± 3.76 | 23.52 ± 1.76 | 46 | ||
| Coherence | |||||||
| Area 17/18 | 12.89 ± 2.64 | 7.99 ± 2.61 | 7.64 ± 2.71 | 2.54 ± 1.21 | 23 | ||
| Area 21a | 23.19 ± 4.09 | 29.71 ± 4.05 | 19.58 ± 2.35 | 13.42 ± 2.38 | 23 | ||
| Coherence 17/18 and 21a | 13.50 ± 3.31 | 5.15 ± 1.85 | 7.16 ± 1.69 | −6.98 ± 2.24 | 23 | ||
| Firing rates | |||||||
| Area 17/18 | 213.73 ± 29.48 | 256.88 ± 36.65 | 68.13 ± 12.96 | 84.17 ± 12.97 | 36 | ||
| Area 21a |
151.32 ± 17.96 |
130.90 ± 20.42 |
109.78 ± 16.95
|
58.79 ± 10.12
|
23 |
||
Averages are computed from all data involving a total of 92 different recording sites from both areas. The transient and sustained phases correspond to before and after 200 msec after stimulus onset, respectively. Bold type indicates significant differences between S+ and S− (p<0.05). Italic type indicates differences close to significance (p<0.06).
Power
To better characterize the frequency range in which the local field oscillations differ between the stimuli, we compute the power spectrum of each trial during the entire stimulus period and average them for each recording site. The distribution of these averaged power spectra is represented in Figure 5. We observe that the difference between stimuli occurs approximately between 20 and 130 Hz for cat L (Fig. 5, insets) and between 20 and 50 Hz for cat S (insets). We choose the larger frequency range for the following analysis and to treat the data of the two animals similarly.
Figure 5.

Distribution of power spectra for all of the recording sites during passive viewing. The median, involving both areas and separately for each animal, is shown in continuous line for S+ (in dark) and S- (in gray). The dashed lines in the insets represent the 25th and 75th percentiles. Note that S+ induces stronger oscillations in a frequency range including the gamma range, but that this range varies according to the animal.
Examples of simultaneous local field potentials in areas 17/18 and 21a for S+ and S- are shown in Figure 6A. For each of these trials, a spectrogram is computed and modulation curves are calculated for the transient and sustained phases (Fig. 6A, right-hand side of the spectrograms). When the modulation curves are averaged over all of the trials for each recording site, this recording site is represented by this averaged modulation curve (Fig. 6B,C). We can already observe that the stimulus modulates the local field potential primarily in frequencies including the gamma range. In some recording sites, independently of the cortical area, distinct peaks of activity can be observed approximately around 45 and 110 Hz, but this is not a general rule. For statistical analysis, we compute the modulation strength in the frequency range between 20 and 130 Hz as explained above.
Figure 6.
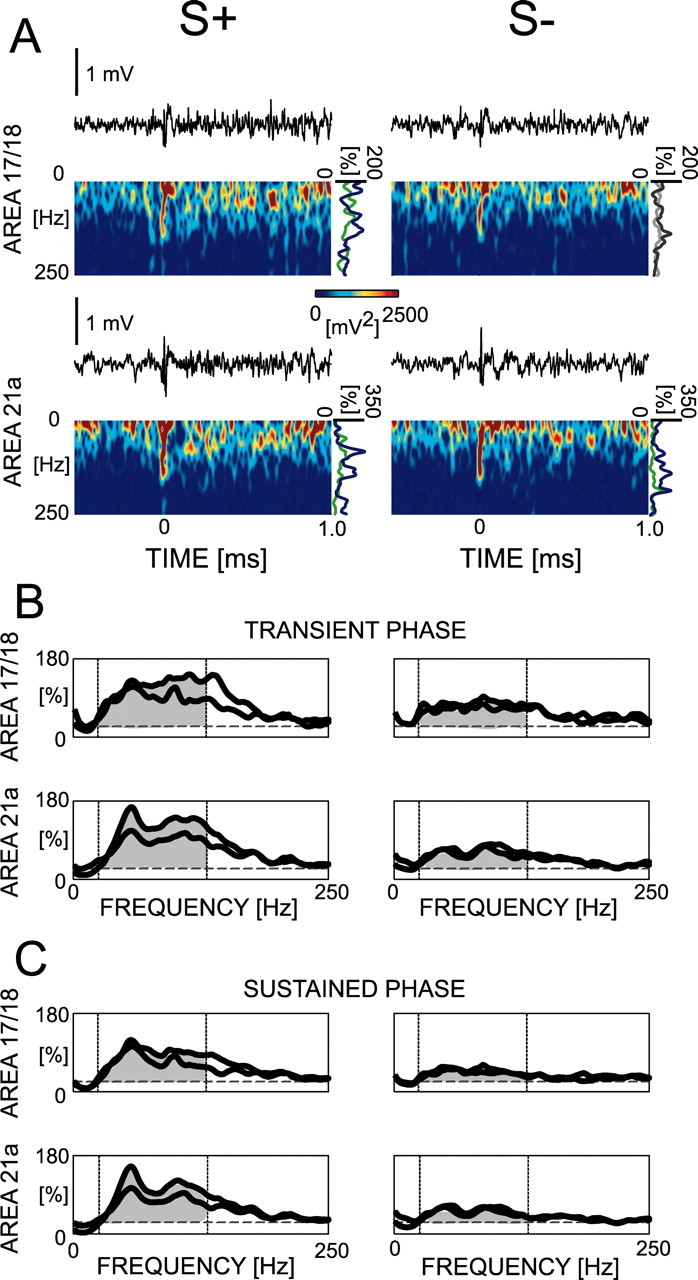
Computation of modulation curves for the power of the local field potential during passive viewing. The modulation curves are computed on single trials for the transient and sustained phases (A). Examples of such curves are presented (A, right-hand side of the spectrograms) in which part of the raw traces of two simultaneously recorded sites (one in each area) are shown for single S+ and S- trials with their respective spectrogram. The modulation curves are averaged for all of the trials to represent each recorded site. Examples of representative curves of four simultaneously recorded sites are shown for the transient (B) and sustained (C) phases. The dashed lines correspond to the 20 and 130 Hz limits used for averaging in the population statistics (Table 1). Two of these sites correspond to the same sites as in A.
For the transient phase, an ANOVA on the modulation strength yields significantly stronger modulation for S+ than for S- (F(1,90) = 24.658; p < 0.0001), between areas (F(1,90) = 11.665; p < 0.01), but no interaction between factors (F(1,90) = 1.655; p = 0.20). The effect of areas is attributable to higher activity in area 17/18 (mean, 61%) compared with area 21a (mean, 44%). For the sustained phase, the ANOVA yields a significantly stronger modulation for S+ than for S- (F(1,90) = 48.691; p < 0.0001), but no difference between areas (F(1,90) = 2.344; p = 0.13) and no interaction between factors (F(1,90) = 0.765; p = 0.38). Thus, passive viewing produces a higher amplitude of gamma neuronal activity for S+ than for S-. This difference occurs as early as the transient phase and does not differ between areas (for a summary, see Table 1).
Coherence
We assess synchronization of neuronal activity within areas as well as between areas based on the coherence of the local field potentials. We calculate the change of the coherence amplitude following presentation of S+ and S-. For each pair of recording sites, the time-localized coherence spectrum between two electrodes is computed using windows of 100 msec length overlaid with a Hanning window and zero-padded to 1000 msec. The overlap of neighboring windows is 50 msec. Intracortical coherences are computed from the coherence spectrum between the two electrodes in the area (for an example, see Fig. 7A). Coherences are averaged over time for both the transient and the sustained phase using the same time windows and the same normalization as for the power (for examples, see Fig. 7B,C).
Figure 7.
Computation of modulation curves for the intra-area coherences of the local field potential during passive viewing. An averaged spectrum of coherences (cohgram) (A) is computed for each pair of recorded sites, and the modulation curves are computed for the transient (B) and sustained (C) phases. The dashed lines correspond to the 20 and 130 Hz limits used for averaging in the population statistics (Table 1). This set of data is derived from the same sites as in Figure 6.
During the transient phase, S+ tends to induce more modulation of coherence in area 17/18 than S-, and independently of stimuli, area 21a shows overall more modulation strength than area 17/18. An ANOVA yields a significant effect of areas (F(1,44) = 13.710; p < 0.001), no overall effect of stimuli (F(1,44) = 0.136; p = 0.71), and an interaction between the factors (F(1,44) = 6.743; p < 0.05). The interaction is attributable to higher modulation strength for S+ than S- within area 17/18 (p = 0.0576; t test) and to an opposite tendency in area 21a, albeit not reaching significance (p = 0.09; t test). During the sustained phase, modulation strength within area 21a is on average higher than within area 17/18 (F(1,22) = 20.584; p < 0.0001). In addition, a significant effect of stimuli shows that S+ has higher modulation strength than S- in both area 17/18 and 21a (F(1,22) = 8.542; p < 0.01). No significant interaction is found (F(1,22) = 0.074; p = 0.79). Altogether, within area 17/18, S+ elicits a higher modulation of coherence than S- during both phases, whereas in area 21a, such a difference is found only during the sustained phase. In a couple of cases, we checked the phase lag between local field potentials and noticed that, even if it varies over time and frequencies, it is usually distributed around zero. No clear patterns of phase lags were distinguishable in these cases. Thus, in area 17/18, coherent activity of the local field potentials in the gamma range is stronger for S+ than for S- and occurs as early as the transient phase. Such a difference could be detected in area 21a only after 200 msec (for a summary, see Table 1).
The coherence between areas 17/18 and 21a is computed from the mean coherence spectrum between the four possible interarea combinations of electrodes (Fig. 8A). During both the transient and the sustained phase (Fig. 8B,C), an ANOVA on the modulation strength yields significantly higher coherence for S+ than for S- (F(1,22) = 12.108 and 34.572; p < 0.01 and p < 0.0001, respectively). Interestingly, specific to the sustained phase, S- produced a negative modulation (for an example, see Fig. 8C). We also checked the phase lag between local field potentials in a couple of cases and noticed that it is usually distributed around zero. Our data show that passive viewing produces higher coupling between areas 17/18 and 21a for S+ than for S-. This effect already occurs during the transient phase and is accentuated over time by the decoupling of the neuronal activity in the two areas after S- presentation (for a summary, see Table 1).
Figure 8.

Computation of modulation curves for the interarea coherences of the local field potential during passive viewing. A cohgram (A) is computed from the four possible interarea cohgrams. From this averaged cohgram, modulation curves are calculated for the transient (B) and sustained (C) phases. The dashed lines correspond to the 20 and 130 Hz limits used for averaging in the population statistics (Table 1). Note the negative modulation during the sustained phase for S- (C). This set of data is derived from the same sites as in Figure 7.
Multiunit activity
The local field potential is a population measure involving various neuronal processes including subthreshold activity. In the following, we assess spiking activity during passive viewing by recording multiunit activity. For the transient and sustained phases, firing rate modulations were derived from the peristimulus time histogram using the same time windows as for the local field potential (for an example of simultaneously recorded multiunit sites, see Fig. 9A).
Figure 9.
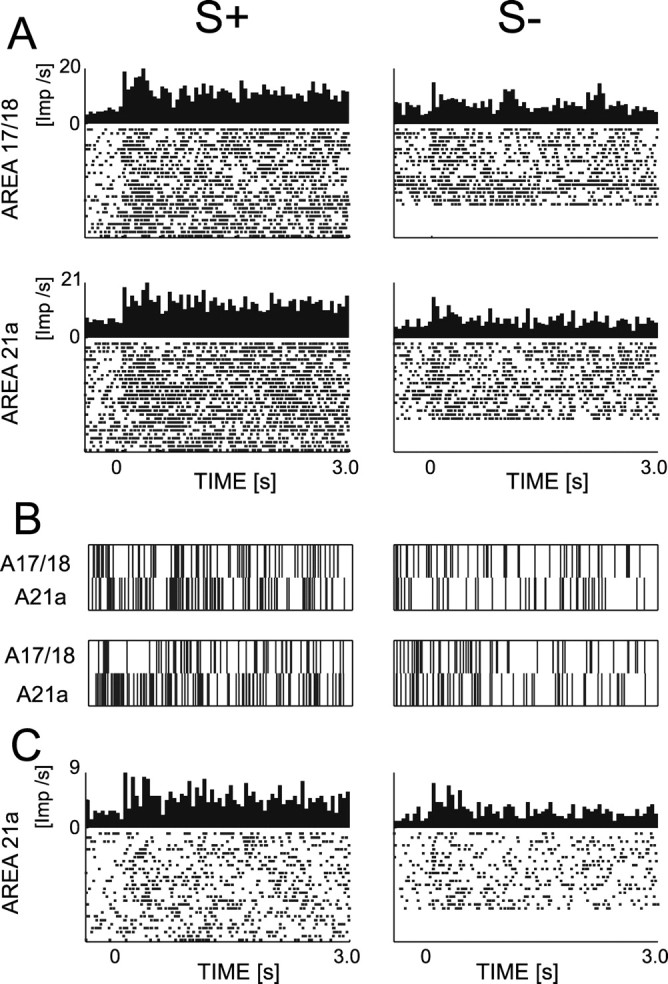
Spiking activity of multiunit and isolated unit during passive viewing. The peristimulus time histogram and raster plot of two simultaneously recorded multiunit sites are shown in A. Two single trials from these sites are shown for their simultaneous spikes in B. Even if the site in area 17/18 suggests a higher firing rate for S+ compared with S-, this effect is not observed in the population statistics (Table 1). However, such an effect is observed in area 21a during the sustained phase as shown for both the multiunit site (A) and its isolated unit (C).
A total of 59 multiunit sites are analyzed. During the transient phase, these sites have higher increases of firing rates, compared with blanks, in area 17/18 (mean increase of 235%) than in area 21a (mean, 140%; F(1,57) = 7.696; p < 0.01). No difference between S+ and S- (F(1,57) = 0.157; p = 0.69) and no interaction of factors (F(1,57) = 1.226; p = 0.27) is found. During the sustained phase, an ANOVA yields a significant interaction between stimuli and areas (F(1,57) = 4.257; p < 0.05), but no main effects (F(1,57) = 1.155 and 0.534; p = 0.29 and p = 0.49, respectively). The interaction is attributable to the significantly higher firing rate (t test; n = 23; p < 0.05) in area 21a for S+ compared with S-. This difference is not observed within area 17/18 (t test; n = 36; p = 0.48). An example of simultaneous spike trains in area 17/18 and 21a is shown in Figure 9B. Thus, in primary visual cortex, we do not find a difference in the modulation of multiunit activity on presentation of S+ and S-. However, in area 21a, firing rates are differentially modulated for S+ relative to S- during the sustained phase (for a summary, see Table 1).
In area 21a, we find that two of six isolated units have significant higher mean firing rates for S+ than for S- (t test; p < 0.0001), and that this increase is more than twofold, and appear to be primarily attributable to the sustained phase (for an example, see Fig. 9C). In area 17/18, 5 of 11 isolated units significantly increase their firing rate for S+ relative to S- (t test; p < 0.05), but this increase reached twofold only in one of these isolated units. Two other isolated units had significant opposite behavior (t test; p < 0.01), and one of them reaches a twofold increase in firing rate. Thus, if we take into account the amplitude of the discriminatory response, their properties are consistent with the results obtained by multiunit recordings as described above.
Eye movements
Eye movements were measured during several sessions. However, because of the technical difficulty of combining an optical eye-tracking technique (Körding et al., 2001) with the food delivery and the associated licking of the cats, only one session yielded reliable eye movement traces. Nevertheless, the number of eye movements during this session is comparable between the two stimuli (mean, 1.87 and 2.06 per presentation of S+ and S-, respectively), and furthermore, training effects are still observed during this session. In this session, in the transient response, two of the four recorded sites express training effects as shown by the difference between S+ and S-. In area 17/18, the difference between stimuli is 15.93%, which is compatible with the population data (mean difference, 9.89). In area 21a, this difference is 3.98%, which is smaller but has the same sign as the population data (mean difference, 16.81). In the sustained phase, three of four sites show training effects. In area 17/18, the difference between stimuli is 13.94%, which is compatible with the population data (mean difference, 12.05). In area 21a, the difference is 6.05 and 1.79%, which are both smaller than the population data but have a positive sign (mean difference, 15.51). Thus, with regards to electrophysiology, this recording session is a representative example. The different responses to S+ and S- are observed, although the eye movements for those stimuli are comparable.
Context control and stimulus control
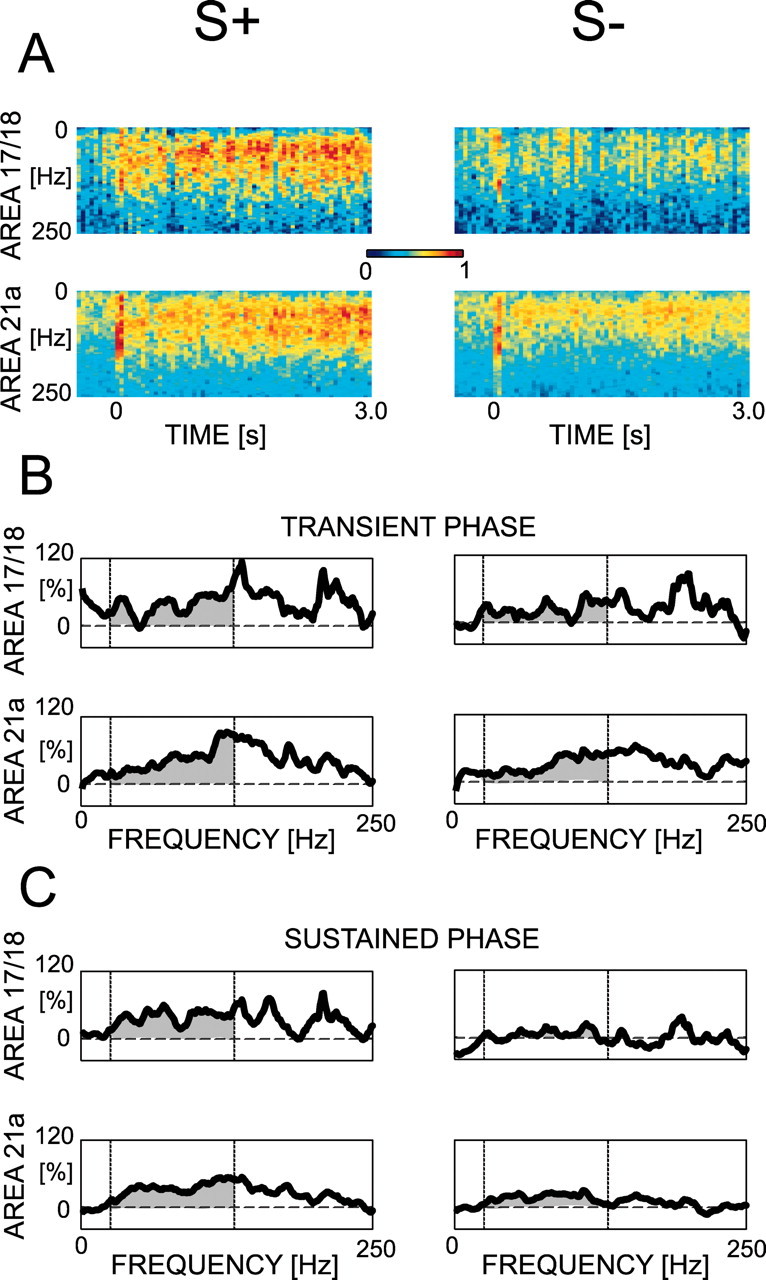
To further elucidate whether the observed effects are context dependent or stimulus specific, we employ several controls. In the context control, S+ and S- were presented mixed with 10 other distractors, and no food was delivered. By mixing S+ and S- with other stimuli and not giving food deliveries, the behavioral context is changed, and arousal and attention involvements are diminished. Thus, if the training effects are not a temporary modulation of activity, we expect to still observe them in this control. In the stimulus control, 12 drifting gratings with different spatial and temporal frequencies than those used for training were presented. By changing the parameters of the trained stimuli, the identities of the stimuli are changed, but the orientation of the stimuli is maintained. Thus, if the observed effects are a consequence of training and not of the tuning properties of the recording sites, we expect to lose the observed effects in this control. To compare passive viewing and the context control, we use the difference of modulation strength of power and coherence on presentation of S+ and S-. In the stimulus control, we computed the difference between horizontally and vertically drifting gratings (i.e., those orientations matching S+ and S- in the passive-viewing paradigm). For simplification and because all of the training effects are observed during the sustained phase, the analysis is only performed for the sustained phase and for the entire duration of the stimulus presentation.
Power
Figure 10A shows an example with increased local field potential power during S+ compared with S- in the context control, but not in the stimulus control. The distribution of S+ and S- differences among all of the sites is significantly different from zero during the passive viewing (one sample t test; p < 0.0001), and close to significance during the context control (p = 0.055), but not in the stimulus control (p = 0.24). An ANOVA on the modulation strength of power, based on recording sites showing training effects (n = 69) as assessed by passive viewing, yields a significant effect of conditions (F(2,201) = 42.151; p < 0.0001), but not of areas (F(1,201) = 1.767; p = 0.19) and no interaction between factors (F(2,201) = 1.853; p = 0.16). Passive viewing, context control, and stimulus control significantly differ from each other (post hoc Fisher's PLSD; p < 0.01). Thus, S+ and S- difference in local field potential activity is observed not only during the specific stimulus paradigm that was used in the go/no-go training, but also (to a lesser degree) when these stimuli are shown in a different context with many other stimuli and without any food delivery. However, varying a stimulus parameter like the spatial and temporal frequency abolishes such effects (for a summary, see Table 2).
Figure 10.

Examples of modulation curves calculated for four cortical sites during the context and stimulus controls. From these sites, the percentage of modulation of power (A), intra-area coherence (B), and interarea coherence (C) are shown. The vertical dashed lines show the frequency range over which, for each stimulus, the modulation is averaged. Then, the S- modulation strength is subtracted from the S+ modulation strength, and this measure is used for the population statistics (Table 2).
Table 2.
Percentage of differences between S+ and S− modulation strength (±SEM)
|
|
CC |
SC |
PV |
n |
|---|---|---|---|---|
| Power | ||||
| Area 17/18 | 9.34 ± 2.90 | 2.15 ± 1.52 | 25.31 ± 1.88 | 31 |
| Area 21a | 8.79 ± 2.46 | 2.76 ± 1.02 | 18.27 ± 2.40 | 38 |
| Coherence | ||||
| Area 17/18 | 6.89 ± 2.52 | −2.65 ± 2.42 | 10.84 ± 2.69 | 15 |
| Area 21a | 0.65 ± 2.80 | 2.731 ± 2.28 | 10.56 ± 2.35 | 19 |
| Coherence 17/18 and 21a |
12.04 ± 2.00
|
0.53 ± 1.40
|
18.20 ± 1.80
|
19 |
Averages are computed only for the data that showed training effects, that is, if S+ activity is greater than S− activity during passive viewing. Comparisons between conditions were performed only for the sustained phase. Bold type indicates significant differences with all other conditions (p < 0.05). Italic type indicates differences close to significance (p < 0.06). CC, Context control; SC, stimulus control; PV, passive viewing.
Coherence
Figure 10B shows an example of intra-area coherences for S+ and S- in context control and stimulus control. Across recording sites, the difference between S+ and S- coherent activity is significantly different from zero during passive viewing (one-sample t test; p < 0.01), close to significantly different during the context control (p = 0.053), but not significantly different during stimulus control (p = 0.88). An ANOVA based on data that show training effects during passive viewing (n = 34) yields a significant effect of conditions (F(2,96) = 9.022; p < 0.01), no effect of areas (F(1,96) = 0.033; p = 0.86), and no interaction between factors (F(2,96) = 2.600; p = 0.08). Post hoc Fisher's PLSD shows that the condition effect is attributable to significant differences between passive viewing with both context control (p < 0.01) and stimulus control (p < 0.0001). The context control induces a larger difference in coherences than the stimulus control, but this difference does not reach significance (p = 0.23). These data show that the higher intra-area coherence for S+ than for S- is still visible, although not reaching significance, when these stimuli are presented with many other distractors and in the absence of food (for a summary, see Table 2).
Figure 10C shows an example in which S+ induces higher coherence between areas than S- in the context control but not in the stimulus control. The distribution of the S+/S- difference is significantly different from zero during passive viewing (one-sample t test; p < 0.0001), during context control (p < 0.0001), but not during stimulus control (p = 0.41). An ANOVA on the modulation strength of interarea coherences that show training effects during passive viewing (n = 19) reveals a significant effect of conditions (F(2,54) = 26.067; p < 0.0001). Post hoc Fisher's PLSD yields significant differences between passive viewing and stimulus control (p < 0.0001) and between context control and stimulus control (p < 0.0001). Passive viewing and context control tend to differ (p = 0.053). Thus, stronger interarea coherences for S+ than for S- are also expressed when these stimuli are shown with distractors and without food delivery (for a summary, see Table 2).
Extinction
If the observed effects depend on the reinforcement state of the stimuli, we expect those effects to be maintained throughout the recording days for passive viewing but to disappear if the contingencies of the stimuli are reversed. For the power of the gamma oscillations over the days of passive viewing, an ANOVA on S+ and S- modulation strength differences yields neither an effect of days (F(8,48) = 1.207; p = 0.315), nor of area (F(1,48) = 0.1; p = 0.7621), nor an interaction between those factors (F(8,48) = 0.816; p = 0.591). However, on the basis of recording sites that show training effects during the last day of passive viewing (n = 7), differences between S+ and S- in the modulation strength of power decreased over the days of extinction in both areas (Fig. 11A). An ANOVA yields a significant effect of the repeated measure, difference in power between S+ and S- (F(7,35) = 3.982; p < 0.01), but no difference between areas (F(1,35) = 0.006; p = 0.94) and no interaction (F(7,35) = 0.482; p = 0.84). To check whether this effect is attributable to a linear decrease, we computed a regression and find that a significant linear relation (F(1,55) = 12.106; p < 0.01) and a slope of -1.64 significantly different from zero (p < 0.01). Similarly, the intra-area coherence differences between S+ and S- decrease over the days of extinction (Fig. 11B), but this effect does not reach significance with the usual ANOVA (F(7,14) = 0.874; p = 0.549). There is also no effect attributable to areas (F(1,14) = 0.005; p = 0.95), nor is there any interaction (F(7,14) = 0.618; p = 0.73). Nevertheless, if a regression is computed, then the linear relation is significant (F(1,31) = 4.731; p < 0.05) and the slope of -1.70 is significantly different from zero (p < 0.05), which shows a linear decrease. However, neither the usual ANOVA (F(1,7) = 0.624; p = 0.73) nor the linear regression (F(1,15) = 1.665; p = 0.21) shows a decrease of interarea coherence. Thus, changing the contingencies of the trained stimuli extinguishes the training effects observed in the gamma oscillations.
Figure 11.

Mean percentage of difference between the modulation strength of S+ and S- during extinction for the power (A) and coherence (B) modulations. The error bars correspond to the SEM.
Discussion
We find that stimuli that had different behavioral significance during the task induce different dynamics of neuronal activities both within and between area 17/18 and area 21a even outside of the behavioral task. These effects are expressed in the stimulus-locked and in the not-stimulus-locked local field potentials in both areas and in the discharge rate of unit activity in area 21a. The averaged evoked potential is broader for the previously reinforced stimulus (S+) than for the negatively reinforced one (S-). As early as the transient phase (<200 msec), gamma oscillations within areas and coherent activity between areas are stronger for S+ compared with S-. Later, during the sustained phase (>200 msec), coherence of the local field potential and spiking activity within area 21a is higher for S+ than for S-. When the trained stimuli are presented with distractors and without food delivery, S+, compared with S-, still induces higher power of gamma oscillations within both areas and higher coherence of activity between areas. If the spatial and temporal frequencies of the stimuli are changed, no differences between the neuronal responses are observed. Finally, gamma oscillations extinguish if the reinforced state of the stimuli is modified.
One issue related to chronic electrode implantation is that the number of penetrations is restricted to the number of electrodes implanted. This limits the number of cortical locations where activity is sampled, which is the case in the present study. We compensate for this disadvantage by increasing the number of sites sampled at different depths. Because the electrodes were implanted without any previous knowledge of cortical maps, the recorded locations may be in any orientation preference column as suggested by the results obtained from the stimulus control. Our unit responses support this argument, because first, we do not observe a general stimulus preference in area 17/18, and second, isolated units preferring S- were found. Thus, the results are not attributable to a pure effect of an accidental orientation bias.
An additional issue is the potential effect of eye movements. It is conceivable that the statistics of eye movements differ between the stimulus conditions. This could lead to a different retinal stimulation and thus to a different cortical response. In those recordings in which eye movements and electrophysiological data were collected simultaneously, we did not observe a difference in the eye movements. Nevertheless, the neuronal activity was comparable with the population data. We cannot exclude that subtle changes of eye movements influence the results obtained; however, our present analysis gives no indication in this direction.
Variations of attentional level (Engel and Singer, 2001; Engel et al., 2001; Fries et al., 2001) and arousal states (Munk et al., 1996; Herculano-Houzel et al., 1999) have been related to increases in the power of gamma oscillations. Obviously, during training, the animals were attentive when performing the task. However, during passive viewing, no behavioral response was required, and thus, there were no attentional demands. Therefore, we do not expect differences in attentional level for different stimulus orientations. Supporting this view, most training-induced changes are still observed in the presence of distractors and without delivery of food. Of course, this does not prove a lack of attentional processes, but it does show that their influences during the recordings are small. Furthermore, considering the precautions taken in the studies to increase attentional involvement [e.g., a discrimination task close to threshold level as in Fries et al. (2001)], we are confident that attentional processes are not on their own sufficient to provide an explanation of the training effects reported in the present study.
The results presented here relate directly to some recent studies in primate primary visual cortex (Crist et al., 2001; Schoups et al., 2001; Schwartz et al., 2002). After training monkeys to discriminate oriented gratings, a small fraction of neurons modified their receptive field properties so that the discriminatory potential for the orientations used for training was increased (Schoups et al., 2001). However, such changes in the response properties of single neurons are still controversial. Using a comparable paradigm, a lack of effect was reported by Ghose et al. (2002). A complementary and recent hypothesis is that the training effects are primarily expressed at the level of the population and in the manner neurons interact with each other. Such a possibility is supported by Crist et al. (2001). These researchers trained monkeys in a bisection task and investigated training effects on cortical representations and on the receptive field properties of neurons. No effects were found on these measures. However, the surround receptive field of the recorded neurons were modified. The authors take this as an indication of the flexibility of the neurons in the way they interact with other. A similar conclusion has been drawn in a recent functional magnetic resonance imaging study of the human primary visual cortex (Schwartz et al., 2002). Thus, in primary visual cortex, the effect of training on neuronal activity is primarily expressed in interactions between neurons. The data of the present study on local field potentials are compatible with this emerging view and suggest that these interactions lead to synchronous and oscillatory activity of the population of neurons very early in the neuronal response.
In higher visual areas, training-induced modifications of receptive field properties have previously been observed (Logothetis et al., 1995; Kobatake et al., 1998). Our data on the modification of firing rates are consistent with these results and generalize the effects to cat area 21a. Because changes of coherent activity and subsequent changes in firing rates have been observed in different areas of the same animals, it suggests that these two mechanisms interact at various cortical stages. This raises the question of a causal relationship between these mechanisms. In area 21a, we found discriminative changes in firing rates only during the sustained phase, which is consistent with other studies in monkeys' visual cortices (Roelfsema et al., 1998, 2003; Fries et al., 2001). In contrast, an increase in gamma oscillations and coherence between areas was detectable earlier on, compatible with a previous report (Roelfsema et al., 1997; Fries et al., 2001; Super et al., 2003). This can be taken as an indication that modifications of synchronous and oscillatory activity, within lower areas and between areas, precede and induce changes in firing rates of higher areas.
How can we understand the mechanisms underlying the observed changes in dynamics of neuronal activity observed after training? The prevailing view is that learning is implemented by synaptic plasticity in the cortex. Indeed, the temporal structure of neuronal activity is closely related to such changes of synaptic efficacy by means of spike time-dependent plasticity. In seminal theoretical and experimental studies, the dependence of long-term potentiation on the relative timing of presynaptic and postsynaptic action potentials has been described (Gerstner et al., 1996; Markram et al., 1997). Indeed, it has been observed that, during synchronous firing, optimally activated neurons fire systematically before suboptimally activated neurons even during the sustained response (König et al., 1995). Thus, synchronous activity can serve as a reference frame for the relative timing of neuronal activity and facilitates learning. Interestingly, a comparable neuronal phenomenon for attentional processes involving gamma oscillations has been reported (Steinmetz et al., 2000; Fries et al., 2001). And surely, attention is crucial to process the relevant information during the learning of perceptual tasks. Such attentional signals are relayed in a top-down manner, leading to a progression of learning from higher areas to lower areas (Ahissar and Hochstein, 1997). Thus, it is tempting to speculate that increased attention leads to a change in the temporal structure of neuronal dynamics, facilitating synaptic plasticity and leading to subsequent structural changes that maintain these altered dynamics (Körding and König, 2000; Kitano et al., 2002), even in the absence of increased attention.
Our data support the conclusion that cortical plasticity driven by behavioral training is observed in the primary visual cortex of adult animals. The expression of this plasticity is observed in the synchronous and oscillatory activity. After prolonged training, stimuli associated with a behavioral response increase synchronous and oscillatory activity in lower areas and between areas. Such changes are accompanied by an increase in discharge rates in higher areas. These changes are robust; they are observed even if a behavioral response is not required. Such an ability to modify these mechanisms may be an important property of visual systems to increase the performance of routine recognition tasks.
Footnotes
This work was funded by the Swiss National Science Foundation (Grant 31-65415.01) and by the Neuroscience Center of Zurich. We thank G. Moeller for her help with the training of one animal and for her assistance with anesthesia during surgery and A. M. Whatley and H.-P. Frey for their comments on this manuscript. Furthermore, we thank the referees for their constructive comments.
Correspondence should be addressed to Dr. Rodrigo F. Salazar, Institute of Neuroinformatics, Winterthurerstrasse 190, CH-8057 Zurich, Switzerland. E-mail: salazar@ini.phys.ethz.ch.
Copyright © 2004 Society for Neuroscience 0270-6474/04/241627-10$15.00/0
References
- Ahissar M, Hochstein S (1997) Task difficulty and the specificity of perceptual learning. Nature 387: 401-406. [DOI] [PubMed] [Google Scholar]
- Bertrand O, Tallon-Baudry C (2000) Oscillatory gamma activity in humans: a possible role for object representation. Int J Psychophysiol 38: 211-223. [DOI] [PubMed] [Google Scholar]
- Brainard DH (1997) The Psychophysics Toolbox. Spat Vis 10: 433-436. [PubMed] [Google Scholar]
- Crist RE, Li W, Gilbert CD (2001) Learning to see: experience and attention in primary visual cortex. Nat Neurosci 4: 519-525. [DOI] [PubMed] [Google Scholar]
- Engel AK, Singer W (2001) Temporal binding and the neural correlates of sensory awareness. Trends Cogn Sci 5: 16-25. [DOI] [PubMed] [Google Scholar]
- Engel AK, Fries P, Singer W (2001) Dynamic predictions: oscillations and synchrony in top-down processing. Nat Rev Neurosci 2: 704-716. [DOI] [PubMed] [Google Scholar]
- Fries P, Reynolds JH, Rorie AE, Desimone R (2001) Modulation of oscillatory neuronal synchronization by selective visual attention. Science 291: 1560-1563. [DOI] [PubMed] [Google Scholar]
- Fu YX, Djupsund K, Gao H, Hayden B, Shen K, Dan Y (2002) Temporal specificity in the cortical plasticity of visual space representation. Science 296: 1999-2003. [DOI] [PubMed] [Google Scholar]
- Gerstner W, Kempter R, van Hemmen JL, Wagner H (1996) A neuronal learning rule for sub-millisecond temporal coding. Nature 383: 76-81. [DOI] [PubMed] [Google Scholar]
- Ghose GM, Yang T, Maunsell JH (2002) Physiological correlates of perceptual learning in monkey V1 and V2. J Neurophysiol 87: 1867-1888. [DOI] [PubMed] [Google Scholar]
- Herculano-Houzel S, Munk MH, Neuenschwander S, Singer W (1999) Precisely synchronized oscillatory firing patterns require electroencephalographic activation. J Neurosci 19: 3992-4010. [DOI] [PMC free article] [PubMed] [Google Scholar]
- Ito M, Gilbert CD (1999) Attention modulates contextual influences in the primary visual cortex of alert monkeys. Neuron 22: 593-604. [DOI] [PubMed] [Google Scholar]
- Kitano K, Cateau H, Fukai T (2002) Self-organization of memory activity through spike-timing-dependent plasticity. NeuroReport 13: 795-798. [DOI] [PubMed] [Google Scholar]
- Kobatake E, Wang G, Tanaka K (1998) Effects of shape-discrimination training on the selectivity of inferotemporal cells in adult monkeys. J Neurophysiol 80: 324-330. [DOI] [PubMed] [Google Scholar]
- König P, Engel AK, Roelfsema PR, Singer W (1995) How precise is neuronal synchronization? Neural Comput 7: 469-485. [DOI] [PubMed] [Google Scholar]
- Körding KP, König P (2000) A learning rule for dynamic recruitment and decorrelation. Neural Netw 13: 1-9. [DOI] [PubMed] [Google Scholar]
- Körding KP, Kayser C, Betsch BY, König P (2001) Non-contact eye-tracking on cats. J Neurosci Methods 110: 103-111. [DOI] [PubMed] [Google Scholar]
- Logothetis NK, Pauls J, Poggio T (1995) Shape representation in the inferior temporal cortex of monkeys. Curr Biol 5: 552-563. [DOI] [PubMed] [Google Scholar]
- Markram H, Lübke J, Frotscher M, Sakmann B (1997) Regulation of synaptic efficacy by coincidence of postsynaptic APs and EPSPs. Science 275: 213-215. [DOI] [PubMed] [Google Scholar]
- Munk MH, Roelfsema PR, König P, Engel AK, Singer W (1996) Role of reticular activation in the modulation of intracortical synchronization. Science 272: 271-274. [DOI] [PubMed] [Google Scholar]
- Pelli DG (1997) The VideoToolbox software for visual psychophysics: transforming numbers into movies. Spat Vis 10: 437-442. [PubMed] [Google Scholar]
- Pessoa L, Kastner S, Ungerleider LG (2003) Neuroimaging studies of attention: from modulation of sensory processing to top-down control. J Neurosci 23: 3990-3998. [DOI] [PMC free article] [PubMed] [Google Scholar]
- Recanzone GH, Merzenich MM, Jenkins WM, Grajski KA, Dinse HR (1992) Topographic reorganization of the hand representation in cortical area 3b owl monkeys trained in a frequency-discrimination task. J Neurophysiol 67: 1031-1056. [DOI] [PubMed] [Google Scholar]
- Recanzone GH, Schreiner CE, Merzenich MM (1993) Plasticity in the frequency representation of primary auditory cortex following discrimination training in adult owl monkeys. J Neurosci 13: 87-103. [DOI] [PMC free article] [PubMed] [Google Scholar]
- Roelfsema PR, Engel AK, König P, Singer W (1997) Visuomotor integration is associated with zero time-lag synchronization among cortical areas. Nature 385: 157-161. [DOI] [PubMed] [Google Scholar]
- Roelfsema PR, Lamme VA, Spekreijse H (1998) Object-based attention in the primary visual cortex of the macaque monkey. Nature 395: 376-381. [DOI] [PubMed] [Google Scholar]
- Roelfsema PR, Khayat PS, Spekreijse H (2003) Subtask sequencing in the primary visual cortex. Proc Natl Acad Sci USA 100: 5467-5472. [DOI] [PMC free article] [PubMed] [Google Scholar]
- Rols G, Tallon-Baudry C, Girard P, Bertrand O, Bullier J (2001) Cortical mapping of gamma oscillations in areas V1 and V4 of the macaque monkey. Vis Neurosci 18: 527-540. [DOI] [PubMed] [Google Scholar]
- Schoups A, Vogels R, Qian N, Orban G (2001) Practising orientation identification improves orientation coding in V1 neurons. Nature 412: 549-553. [DOI] [PubMed] [Google Scholar]
- Schuett S, Bonhoeffer T, Hübener M (2001) Pairing-induced changes of orientation maps in cat visual cortex. Neuron 32: 325-337. [DOI] [PubMed] [Google Scholar]
- Schwartz S, Maquet P, Frith C (2002) Neural correlates of perceptual learning: a functional MRI study of visual texture discrimination. Proc Natl Acad Sci USA 99: 17137-17142. [DOI] [PMC free article] [PubMed] [Google Scholar]
- Siegel M, Körding KP, König P (2000) Integrating top-down and bottom-up sensory processing by somato-dendritic interactions. J Comput Neurosci 8: 161-173. [DOI] [PubMed] [Google Scholar]
- Singer W (2001) Consciousness and the binding problem. Ann NY Acad Sci 929: 123-146. [DOI] [PubMed] [Google Scholar]
- Steinmetz PN, Roy A, Fitzgerald PJ, Hsiao SS, Johnson KO, Niebur E (2000) Attention modulates synchronized neuronal firing in primate somatosensory cortex. Nature 404: 187-190. [DOI] [PubMed] [Google Scholar]
- Super H, van der Togt C, Spekreijse H, Lamme VA (2003) Internal state of monkey primary visual cortex (V1) predicts figure-ground perception. J Neurosci 23: 3407-3414. [DOI] [PMC free article] [PubMed] [Google Scholar]
- Tusa RJ, Palmer LA (1980) Retinotopic organization of areas 20 and 21 in the cat. J Comp Neurol 193: 147-164. [DOI] [PubMed] [Google Scholar]
- Tusa RJ, Palmer LA, Rosenquist AC (1978) The retinotopic organization of area 17 (striate cortex) in the cat. J Comp Neurol 177: 213-235. [DOI] [PubMed] [Google Scholar]
- von Stein A, Sarnthein J (2000) Different frequencies for different scales of cortical integration: from local gamma to long range alpha/theta synchronization. Int J Psychophysiol 38: 301-313. [DOI] [PubMed] [Google Scholar]
- von Stein A, Chiang C, König P (2000) Top-down processing mediated by interareal synchronization. Proc Natl Acad Sci USA 97: 14748-14753. [DOI] [PMC free article] [PubMed] [Google Scholar]
- Yao H, Dan Y (2001) Stimulus timing-dependent plasticity in cortical processing of orientation. Neuron 32: 315-323. [DOI] [PubMed] [Google Scholar]