

Abstract
Oxidative mechanisms of injury are important in many neurological disorders, including hypoxic-ischemic brain damage. Cerebral palsy after preterm birth is hypothesized to be caused by hypoxic-ischemic injury of developing oligodendrocytes (OLs). Here we examined the developmental sensitivity of OLs to exogenous hydrogen peroxide (H2O2) with stage-specific rat oligodendrocyte cultures. We found that H2O2 itself or that generated by glucose oxidase was more toxic to developing than to mature OLs. Mature OLs were able to degrade H2O2 faster than developing OLs, suggesting that higher antioxidant enzyme activity might be the basis for their resistance. Catalase expression and activity were relatively constant during oligodendrocyte maturation, whereas glutathione peroxidase (GPx) was upregulated with a twofold to threefold increase in its expression and activity. Thus, it appeared that the developmental change in resistance to H2O2 was caused by modulation of GPx but not by catalase expression. To test the relative roles of catalase and GPx in the setting of oxidative stress, we measured enzyme activity in cells exposed to H2O2 and found that H2O2 induced a decrease in catalase activity in developing but not in mature OLs. Inhibition of GPx by mercaptosuccinate led to an increase in the vulnerability of mature OLs to H2O2 as well as a reduction in catalase activity. Finally, H2O2-dependent inactivation of catalase in developing OLs was prevented by the GPx mimic ebselen. These data provide evidence for a key role for GPx-catalase cooperativity in the resistance of mature OLs to H2O2-induced cell death.
Keywords: hydrogen peroxide, oxidative stress, cell death, glutathione peroxidase, catalase, oligodendrocyte, white matter, cerebral palsy
Introduction
Ischemia/reperfusion injury to the developing brain is a major cause of neurological disorders in the perinatal period. Neurological deficits in infants surviving hypoxic-ischemic insult include mental retardation, seizures, and cerebral palsy. The neuropathology of perinatal brain injury is complex, and involves gray and white matter to varying degrees, depending on the gestational age and the developmental stage of cerebral vascularity (Kinney and Armstrong, 1997). Periventricular leukomalacia (PVL) involves injury to the cerebral white matter resulting in a chronic disturbance of myelination; it is the predominant underlying pathology of cerebral palsy in premature infants (Volpe, 1997, 2001). During the maturational period of peak vulnerability to PVL, the white matter is predominantly populated with premyelinating oligodendrocytes (OLs) (Back et al., 2002).
In human PVL, there is now emerging evidence that oxidative stress plays a key role in the pathogenesis of the white-matter injury (Haynes et al., 2003). Previous work has shown that developing OLs are more vulnerable than mature OLs to endogenous oxidative stress caused by the depletion of intracellular glutathione (GSH). (Oka et al., 1993; Yonezawa et al., 1996; Back et al., 1998, 2001). However, the sensitivity of OLs at specific stages of development to exogenous sources of oxidative stress remains unknown.
Peroxides, including hydrogen peroxide (H2O2), are one of the main reactive oxygen species (ROS) leading to oxidative stress (Halliwell and Gutteridge, 1999). H2O2 is continuously generated by several enzymes (including superoxide dismutase, glucose oxidase, and monoamine oxidase) and must be degraded to prevent oxidative damage. The cytotoxic effect of H2O2 is thought to be caused by hydroxyl radicals generated from iron-catalyzed reactions, causing subsequent damage to DNA, proteins, and membrane lipids (Halliwell, 1992). Recently, both glutathione peroxidase and catalase, the two main enzymes involved in H2O2 detoxification, have been shown to be implicated in the disposal of exogenous H2O2 by astrocytes (Dringen and Hamprecht, 1997). Both have been found in the brain (De Marchena et al., 1974; Gaunt and de Duve, 1976; Brannan et al., 1981) and in astrocytes and oligodendrocytes (Dringen and Hamprecht, 1997; Hirrlinger et al., 2002). Catalase is known to be of special importance when the clearance of H2O2 in high concentrations is required. More recently, a higher capacity for the degradation of H2O2 has been demonstrated in myelin basic protein (MBP) expressing oligodendrocytes than in astrocytes, microglia, or neurons (Hirrlinger et al., 2002). However, the developmental variation in the vulnerability of OLs to H2O2 has not been investigated.
In the present work, we investigated the sensitivity of OLs to H2O2 at specific developmental stages of maturation. Developing OLs appeared to be more vulnerable to H2O2 than were mature OLs. In pursuing the basis for this difference in vulnerability, we found that GPx expression was upregulated in mature OLs. Although catalase expression was unchanged through development, this enzyme in developing OLs was inactivated by exposure to H2O2. The vulnerability of catalase to H2O2 appeared to depend on the level of GPx activity. In mature OLs, the upregulation of glutathione peroxidase maintains the catalase activity at a high level in the presence of H2O2.
Materials and Methods
Materials. DMEM, HBSS, Earle's balanced salt solution (EBSS), fetal bovine serum, penicillin, and streptomycin were purchased from Invitrogen (Rockville, MD). Unless otherwise specified, all other chemicals were from Sigma (St. Louis, MO).
Oligodendrocyte cultures. Primary rat OLs were prepared from the cerebral hemispheres of Sprague Dawley rats at postnatal day 1-2 using a shaking method (McCarthy and de Vellis, 1980; Oka et al., 1993) with modifications, as described previously (Li et al., 2003). Briefly, forebrains free of meninges were chopped into 1 mm3 blocks and placed into HBSS containing 0.01% trypsin and 10 μg/ml DNase. After digestion for 15 min at 37°C, the tissue was collected by centrifugation and triturated in the plating medium (DMEM 20% serum) containing DMEM, 20% fetal bovine serum, 40 IU/ml penicillin, and 40 μg/ml streptomycin, and passed through a 70 μm sieve. Cells were plated onto polylysine-coated 75 cm2 flasks at a density of 1 pup brain per flask. Cultures were fed with fresh DMEM 20S medium every other day for 10-11 d at 37°C in a humid atmosphere of 5% CO2 and 95% air.
To isolate OLs, the mixed glial cultures were shaken for 1 hr at 200 rpm at 37°C to remove adherent microglia/macrophages, and the cultures were washed with the same medium and subjected to shaking at 200 rpm overnight (18-22 hr) to separate OLs from the astrocyte layer. The suspension was plated onto uncoated Petri dishes and incubated for 1 hr at 37°C to further remove residual microglia and astrocytes that adhere to the dishes. The OLs were then collected by passing through a 15 μm sieve, followed by centrifugation. Isolated OLs were plated onto poly-d-ornithine (50 μg/ml)-coated 96 well culture plates (at density of 3.3 × 10³ cells per well for cell-survival assay), 24 well plates with glass coverslips (1.74 × 10⁴ cells per well for imaging), and 60 mm plates (2.75 × 10⁵ cells per plate for enzyme assays). Purified OLs were cultured for 7-8 d in a serum-free basal defined medium (BDM): DMEM, 0.1% bovine serum albumin, 50 μg/ml apo-transferrin, 50 μg/ml insulin, 30 nm sodium selenite, 10 nm d-biotin, 10 nm hydrocortisone, 200 μm l-cystine, 10 ng/ml platelet-derived growth factor, and 10 ng/ml basic fibroblast growth factor. At 7-8 d, the cultures were composed primarily of progenitors and pre-OLs (A2B5+, O4+, O1-, MBP-negative). After 7 d, culture medium was changed to serum-free BDM containing 10 ng/ml ciliary neurotrophic factor and 15 nm 3,3′,5-triiodo-l-thyronine for 14 additional days until cells were differentiated into mature OLs (MBP+). The purity of OL cultures was consistently >95% OLs with <5% astrocyte contamination.
Oxidative stress in cell cultures. The BDM solution in each well was replaced with fresh BDM that contained a known concentration of H2O2 diluted from a 9.8 m stock solution. Unless otherwise specified, the cells were incubated for 24 hr before being assayed for cell survival. Alternatively, H2O2 was generated in OL cultures by the addition of glucose oxidase (20 mU/ml) to the medium (BDM; 25 mm glucose) (Kim and Kim, 1991). The cells were incubated for 24 hr followed by Alamar blue assay (Southern Biotechnology, Birmingham, AL) for cell viability.
Cell-survival assay. Cell survival was determined after treatment for 24 hr using Alamar blue, a tetrazolium dye that is reduced by living cells to a fluorescent product. This assay is similar in principle to the 3-(4,5-dimethyldiazol-2-yl)-2,5-diphenyl tetrazolium bromide cell viability assay and has been previously validated as an accurate measure of survival of OLs (Back et al., 1999). For the H2O2 challenge, the results from the Alamar blue assay were matched by a calcein-based assay (Molecular Probes, Eugene, OR) (data not shown). All results of cell death assays were confirmed by visual inspection using phase-contrast microscopy. Briefly, culture medium in the 96 well plate was aspirated, and cells were incubated with 200 μl of assay solution prepared by diluting 100× stock solution of Alamar blue into EBSS for 2 hr at 37°C. The fluorescence of the assay solution, reflecting cell viability, was measured with a fluorescence plate reader (FluoroCount, Packard Instrument, Meridan, CT) using an excitation wavelength of 560 nm and an emission wavelength of 590 nm. All survival assays were performed at least in triplicate.
Intracellular free radical accumulation measurement. Intracellular free radical generation was evaluated with dichlorohydrofluorescein diacetate (DCFA) (C-2938; Molecular Probes) (Wang and Joseph, 1999). DCFA was prepared as a 100 mm stock in dimethylsulfoxide, and stored in the dark at -20°C. The cells were loaded with 100 μl of a 100 μm DCFA solution and incubated for 20 min at 37°C. Next, the cells were washed again in EBSS to remove all excess DCFA that had not penetrated the cells. The baseline fluorescence was measured at the excitation and emission wavelengths of 485 and 530 nm, respectively, using a multiwell fluorescence plate reader. The fluorescence response of the cells was compared across stages at various concentrations of H2O2 by calculating the percent increase in fluorescence, comparing baseline with 1 hr of exposure.
H2O2 colorimetric assay. A method described previously was used to characterize the kinetics of H2O2 depletion from the culture medium. The OLs were plated in polyornithine-coated 24 well plates. H2O2 depletion was monitored by a colorimetric assay that involved the oxidation of o-dianisidine dihydrochloride (o-DD) in the presence of horseradish peroxidase (Yakes and Van Houten, 1997). At the start of the experiment, H2O2 was added to each well containing 500 μl EBSS to yield 400 μm. In this medium, the hydrogen peroxide concentration remained constant over the period studied in wells lacking any cells. As the experiment progressed, 100 μl aliquots of the treatment medium were removed at specific time points. These aliquots were then incubated with 2.5 U/ml of horseradish peroxidase and 250 μm o-DD for 1 hr at 37°C. The absorbance was then measured at 470 nm against a blank containing EBSS without the addition of H2O2. The amount of H2O2 remaining in the medium was determined from a standard curve generated by using known concentrations of H2O2. The initial rate of H2O2 clearance was obtained manually from the plotted results.
Immunocytochemistry, Tdt-mediated dUTP nick end labeling, and immunofluorescence microscopy. Cells were washed in cold PBS and fixed with 4% paraformaldehyde for 10 min at room temperature, washed three times with PBS, and blocked with PBS containing 5% goat serum for 1 hr at room temperature. The coverslips were incubated for 1 hr with mouse monoclonal antibodies O4 and O1 (1:100 dilution; gifts of Dr. Steven E. Pfeiffer, University of Connecticut Health Center, Farmington, CT), MBP (1:500 dilution; Boehringer Mannheim, Indianapolis, IN). After three to four washes at 15 min each, the appropriate secondary antibody conjugated with Alexa red (1:1000 dilution; Molecular Probes) was added to the coverslips and incubated for 1 hr. After extensive washes, cells were again exposed briefly to 4% paraformaldehyde in PBS for 5 min at room temperature. After several rinses in PBS, the coverslips were then incubated for 2 hr with PBS containing 5% goat serum and 0.1% Triton X-100 containing rabbit polyclonal anti-catalase (1:500 dilution; Abcam, Cambridge, UK) antibodies. After three washes, the appropriate secondary antibody conjugated with Oregon green (1:500 dilution; Molecular Probes) was incubated with cells for 1 hr. Nuclei were finally stained by adding Hoechst 33258 at a final concentration of 2 μg/ml for 1 min. After three more washes, the coverslips were mounted onto glass slides with FluoroMount (Southern Biotechnology, Birmingham, AL) and kept in the dark at 4°C.
Terminal deoxynucleotidyl transferase-mediated biotinylated UTP nick end labeling (TUNEL) staining was performed using the In Situ Cell Death detection kit from Roche (Indianapolis, IN) and following the protocol for cell culture.
Cell images were captured with a fluorescence microscope (Eclipse E800; Nikon, Tokyo, Japan) equipped with a Spot RT digital camera (Diagnostic Instruments, Sterling Heights, MI).
Protein extracts and Western blot. OLs were rinsed with cold PBS and scraped into lysis buffer containing the following: 150 mm NaCl, 50 mm Tris, 0.5% Triton X-100, and 1× protease inhibitor mixture (Roche). For Western blotting, samples were boiled for 5 min in the presence of β-mercaptoethanol and SDS; 10 μg of protein from the cell lysates were separated by electrophoresis using a 12% polyacrylamide gel. After electroblotting to a polyvinylidene difluoride membrane and blocking of nonspecific binding sites, membranes were exposed either to anti-catalase (1:500 dilution; Abcam, Cambridge, UK) or to anti-GPx-1 (1:100 dilution; Novus Biological, Littleton, CO) antibodies followed by appropriate secondary antibodies conjugated with horseradish peroxidase and detection by chemiluminescence (PerkinElmer, Wellesley, MA).
Catalase, GPx, and glutathione reductase enzyme activity assays; glutathione chemical assay. Briefly, cells were harvested and in a lysate buffer containing 0.1% Triton X-100, then centrifuged to remove the supernatant for assay. Catalase activity measurement was based on the reaction of the enzyme with methanol in the presence of an optimal concentration of H2O2. The formaldehyde produced was measured spectrophotometrically at 540 nm. One unit of catalase was defined as the formation of 1 nmol of formaldehyde per minute per milligram of protein. GPx activity was measured indirectly by a coupled reaction with glutathione reductase. Oxidized glutathione produced on reduction of hydroperoxide by GPx was recycled to its reduced form by the oxidation of NADPH to NADP+, which was accompanied by a decrease in absorbance at 340 nm. Under conditions of the assay, the rate of decrease in the absorbance at 340 nm was directly proportional to the GPx activity in the sample. One unit of GPx was defined as the amount of enzyme causing the oxidation of 1 nmol of NADPH per minute and per milligram of protein. Catalase and GPx activities were measured using kits from Cayman Chemical (Ann Harbor, MI). Glutathione reductase activity was assayed in the presence of 1 mm oxidized GSH (GSSG) by measuring the rate of NADPH oxidation, which is accompanied by a rapid decrease in absorbance at 340 nm. The assay temperature is 25°C. Results were expressed similarly to those of the GPx assay.
Total intracellular reduced GSH was measured by a fluorometric method as described previously (Wang and Joseph, 1999).
Data analysis. Data collected was analyzed using GraphPad Prism version 3.00 for Windows (GraphPad Software, San Diego, CA). Unless otherwise indicated, the results shown are from one experiment representative of three to six experiments. Either Student's t test, one-way ANOVA, or two-way ANOVA with the Bonferroni post-test comparison were performed for statistical analyses.
Results
Maturation-dependent vulnerability of OLs to H2O2
The initial question motivating this study was whether OLs would demonstrate maturation-dependent vulnerability to exogenous reactive oxygen species as had been demonstrated previously for endogenous ROS in a glutathione-depletion paradigm (Oka et al., 1993; Yonezawa et al., 1996; Back et al., 1998). Both authentic H2O2 and a glucose oxidase system for generating H2O2 induced a greater loss of cell viability in developing OLs than in MBP expressing OLs (Fig. 1A,B). The EC50 values for the toxicity of H2O2 at 24 hr were found to be significantly different for developing OLs (O4+, O1-, MBP-; 148 ± 136 μm) and mature OLs (O4+, O1+, MBP+; 688 ± 131 μm; p < 0.001). Glucose oxidase induced significant cell death after only 4 hr compared with the control (data not shown). The toxicity observed was not caused by depletion of the glucose substrate within the cell medium because there was no detectable change in glucose concentration during the experiments.
Figure 1.
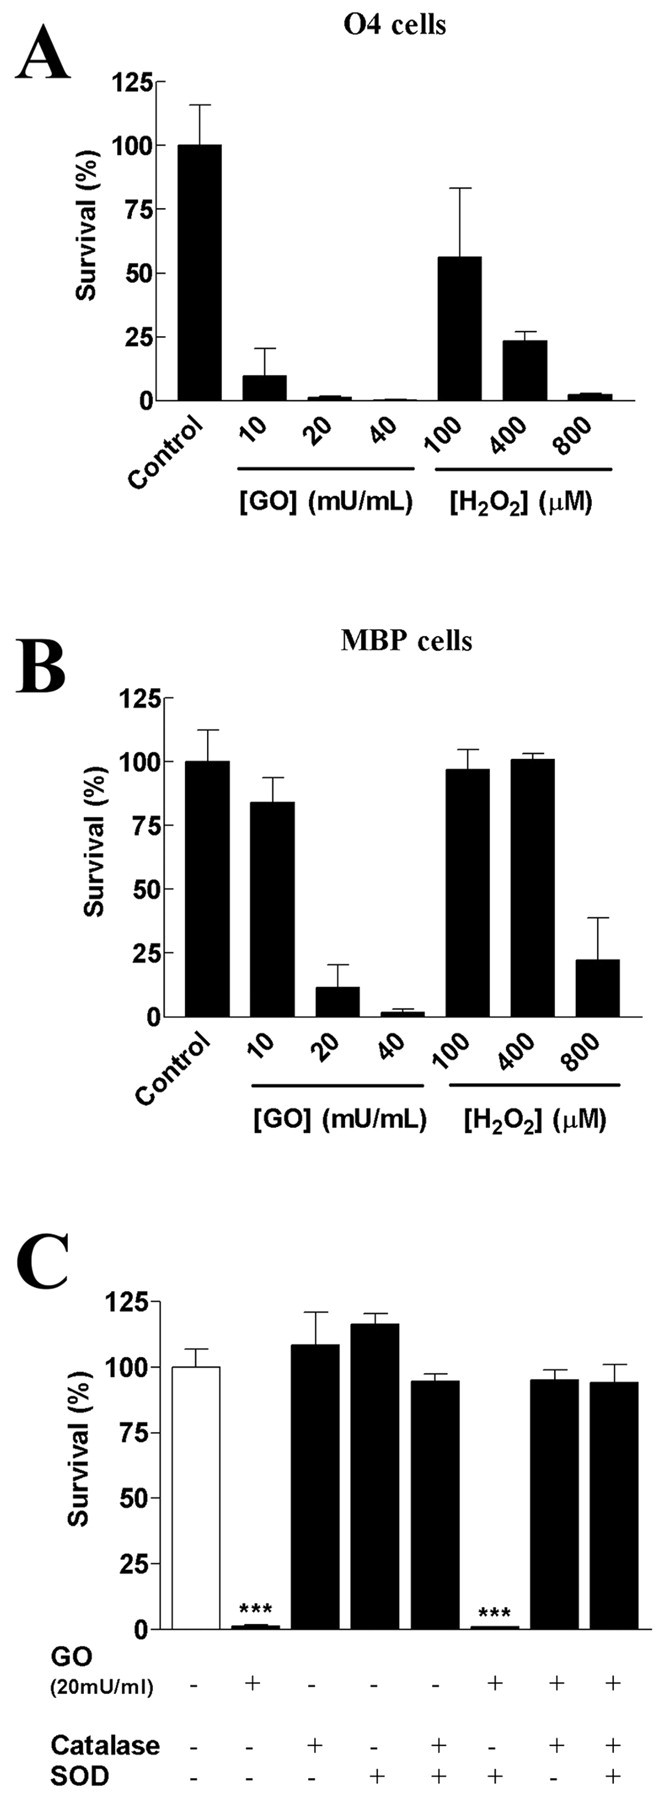
Maturation dependence of H2O2 toxicity to rat OLs in culture. A, Developing OLs (O4+) were subjected to increasing concentrations of either glucose oxidase in the presence of 25 mm glucose or authentic H2O2 for 24 hr and then assayed for cell survival. B, Mature myelinated OLs (MBP+) were subjected to similar concentrations of glucose oxidase or H2O2. After 24 hr of incubation, mature cells demonstrated an increased resistance to H2O2 compared with developing OLs. C, The toxic effect of H2O2 generated by 20 mU/ml glucose oxidase (GO) to developing OLs was completely blocked by the presence of 1000 U/ml catalase with or without 250 U/ml Cu/Zn SOD. In contrast, SOD alone did not protect cells against H2O2. Values represent means ± SD, and data are representative of three experiments. ***p < 0.001, using one-way ANOVA with Bonferroni post-test comparison.
We next investigated the effect of antioxidant enzymes on glucose oxidase-induced cell death (Fig. 1C). Neither extracellular superoxide dismutase (SODs) (250 U/ml) nor catalase (1000 U/ml) had any toxic effect on developing OLs under basal conditions. When SOD was added to the glucose oxidase system, cell survival was not improved. In contrast, when catalase was added, either alone or in combination with SOD, the cells were protected from the toxic effects of glucose oxidase (Fig. 1C). Thus, only the addition of catalase significantly increased cell survival, indicating that glucose oxidase toxicity to OLs was attributable to H2O2 formation.
H2O2-induced cell death occurs rapidly and leads to TUNEL+ labeling
We further characterized the time course of cell death after H2O2 exposure in developing OLs. Most of the cell loss occurred within 3 hr after the beginning of the challenge, followed by a persistence of the remaining surviving cells, assessed by Alamar blue (Fig. 2A). Similar findings were obtained using the calcein as a marker of plasma membrane integrity. One hour after H2O2 was added to the cells, we found that most cells appeared markedly swollen, with pyknotic nuclei (Fig. 2B, phase contrast). At 24 hr, almost all cells still present on the coverslips were strongly labeled by TUNEL staining (Fig. 2B, bottom).
Figure 2.
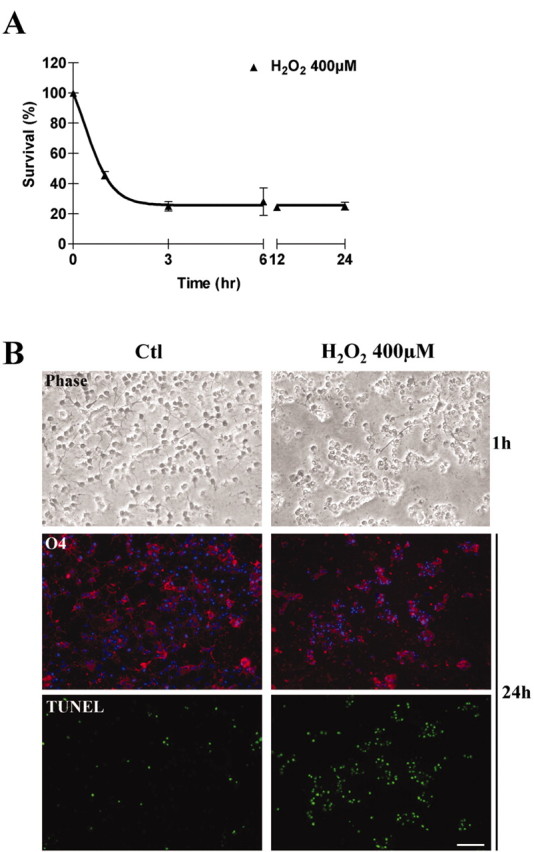
Characterization of H2O2-induced cell death. A, Time course of H2O2-induced cell death in developing OLs. O4+ cells were subjected to 400 μm H2O2 and cell survival was then assayed at various time points. Most of the cell loss occurred within 3 hr after the challenge was started. Values represent means ± SD, and are representative of three experiments. B, Representative photomicrographs of morphology and immunostaining for O4 antigen and TUNEL in developing OLs under basal conditions (Ctl) or subjected to 400 μm H2O2 for 1 hr (phase contrast) and 24 hr (O4 labeling and TUNEL). Magnification, 20×. Scale bar, 50 μm.
Mature OLs dispose of H2O2 faster and produce less peroxides than do developing OLs
Given the differences between oligodendrocyte stages in vulnerability to H2O2, we analyzed the kinetics of H2O2 clearance from the culture medium by developing and mature OLs (Fig. 3A). The initial H2O2 concentration within the medium was 400 μm. H2O2 concentrations in the media were assayed at 0, 2.5, 5, 15, and 30 min. Control experiments showed that H2O2 was stable in the incubation medium in the absence of cells (Fig. 3A); thus, elimination of H2O2 in the medium in subsequent experiments was caused by a cell-specific effect. Our results showed that developing OLs displayed a lower rate of H2O2 clearance than the mature cells (Fig. 3A), and, in addition, the clearance of H2O2 in medium in contact with developing OLs did not go to zero H2O2 but appeared to reach a plateau. The initial rate for developing OLs was 31.2 ± 12 μmol/l/min. The initial rate for mature MBP+ cells was >250 μmol/l/min but could not be accurately determined because of the difficulty of obtaining data at intervals shorter than 2.5 min. Thus, mature cells possessed at least eightfold greater antioxidant capacity than developing cells. This result was consistent with our finding that mature cells were more resistant to H2O2 (Fig. 1A).
Figure 3.

H2O2 is degraded faster and induces formation of less intracellular reactive oxygen species in mature than in developing OLs. A, Comparison of disposal of extracellular H2O2 between developing (O4+) and mature (MBP+) OLs. Cells were incubated in EBSS containing 400 μm H2O2 and the amount of H2O2 remaining at selected time points was determined. The experiment was performed on three independently prepared cultures with comparable results. Data represent a typical experiment with means ± SD of triplicate values. B, Comparison of reactive oxygen species generation in developing and mature OLs subjected to increasing concentrations of H2O2. Cells were loaded with 100 μm DCFA solution and incubated for 20 min at 37°C. Results represent the percentage increase in the fluorescence measured at excitation and emission wavelengths of 485 and 530 nm between baseline and after 1 hr of H2O2 exposure. Data represent means ± SD of a representative experiment replicated three times. **p < 0.01; ***p < 0.001, using two-way ANOVA with Bonferroni post-test comparison.
We used DCFA to test the response of the cells to H2O2. (Fig. 3B). Data represent the percent increase in fluorescence in developing and mature OLs in response to increasing concentrations of H2O2 at 60 min compared with baseline. Statistical analysis revealed that O4+ cells were significantly higher in fluorescence (p < 0.01 to p < 0.001), demonstrating greater intracellular peroxide accumulation compared with the MBP+ cells (Fig. 3B).
Catalase expression is similar in developing and mature OLs
We hypothesized that the decline in vulnerability to H2O2 with maturation occurring in the oligodendrocyte lineage could be caused by upregulation of one or both of the principal enzymes involved in the degradation of H2O2, catalase, and GPx. A rabbit anti-catalase antibody was used to detect the catalase expression in developing and mature OLs by Western blot analysis (Fig. 4A). A single band corresponding to the 60 kDa subunit of catalase was found and was of similar intensity in the two cell types.
Figure 4.

Catalase expression and activity are not different in developing and mature OLs. A, Western blot analysis of catalase expression in O4+ and MBP+ OLs showing a single specific band of 60 kDa with no significant difference between the two cell types. Cat, Recombinant catalase. B, Immunostaining for either oligodendroglial markers in red (O4 or MBP) or catalase in green in developing or mature OLs (nuclei were stained using Hoechst 33258, in blue). Intracytoplasmic punctate staining was detected in both types of cells with a similar intensity and intracellular distribution. Magnification, 40×. Scale bar, 20 μm. C, Higher magnification of the intracytoplasmic peroxisomal localization of catalase in a developing OL. Magnification, 100×. Scale bar, 5 μm. D, Enzymatic activity assay for catalase in homogenates of developing and mature OLs. The catalase activity was normalized to the total protein concentration. One unit is defined as the formation of 1 nmol of formaldehyde per minute. NS, Not significant, using Student's t test.
In both developing and mature OLs, strong immunoreactivity for catalase was seen (Fig. 4B). The staining was completely abolished when the primary antibody was omitted or when the primary antibody was preincubated with bovine liver catalase (data not shown). The small fraction of contaminating astrocytes (<5%) or microglial cells (<1%) in these cultures did not display strong immunoreactivity. A punctate staining was detected in the cytoplasm of OLs, suggesting that catalase expression is not homogeneously distributed throughout the cell but rather is localized in organelles (Fig. 4C). This finding is consistent with the fact that catalase is known to be a peroxisomal enzyme in the brain (Singh et al., 2000).
Consistent with the results of catalase immunoreactivity, catalase enzymatic activity in cell homogenates was not found to be different between developing and MBP expressing OLs in five experiments (Fig. 4D).
GPx is upregulated in mature OLs
In contrast with catalase expression, we found that GPx was upregulated in mature MBP+ OLs compared with developing O4+ OLs (Fig. 5). Western blot analysis revealed a major band corresponding to the 23 kDa monomeric subunit in addition to a band of 60 kDa related to a low level of anti-catalase cross-reactivity of the antibodies used, and a band of 92 kDa, corresponding to the entire GPx protein consisting of the four 23 kDa subunits (Fig. 5A). The 23 kDa band showed a threefold increase in its intensity in MBP expressing OLs (Fig. 5A). Enzymatic activity for GPx was ∼2.5-fold higher in mature OLs than in developing OLs (Fig. 5B).
Figure 5.
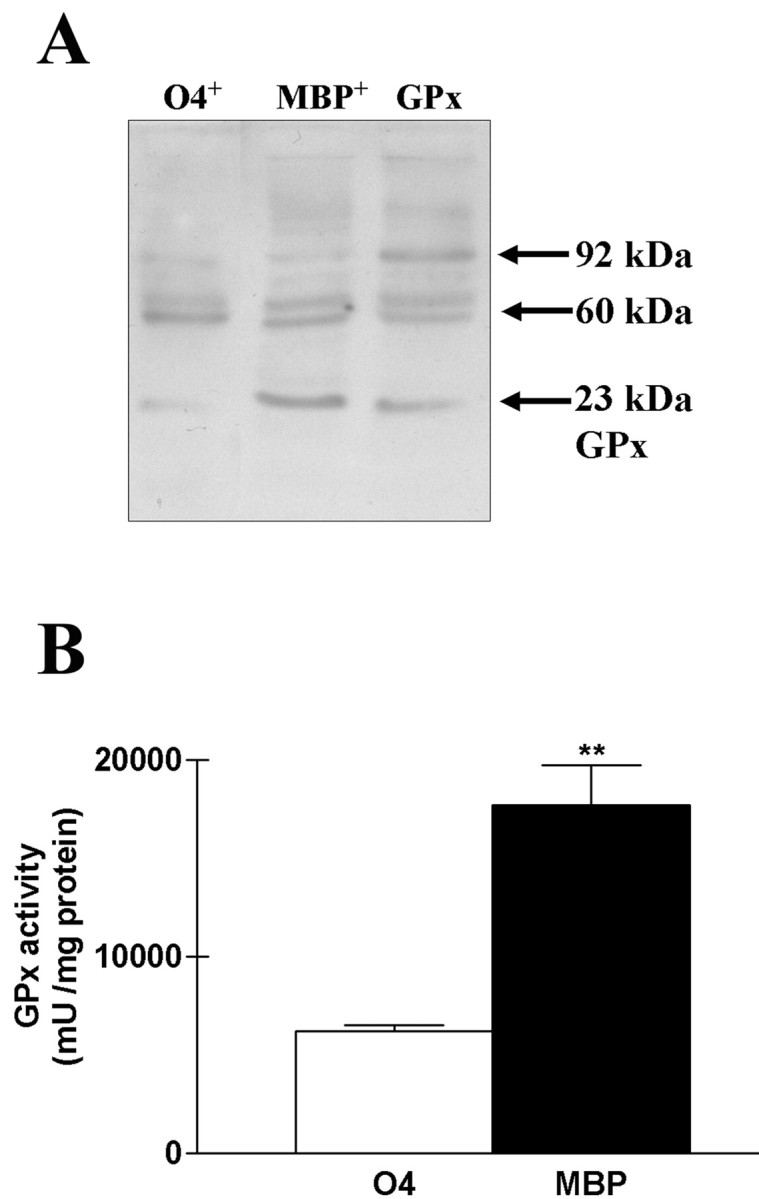
Upregulation of GPx in mature OLs. A, Western blot analysis of GPx protein expression in O4 and MBP OLs showing upregulation of a band at 23 kDa corresponding to the subunit size of the enzyme. Arrows show a band at 60 kDa caused by a low level of anti-catalase cross-reactivity of the antibodies used and a band at 92 kDa corresponding to the multimeric enzyme. GPx, Recombinant GPx. B, Enzymatic activity assay for GPx in homogenates of developing and mature OLs. The GPx activity was normalized to the total protein concentration. One unit is defined as the amount of enzyme causing the oxidation of 1 nmol of NADPH per minute. **p < 0.01, using Student's t test.
H2O2 exposure is associated with a decrease in catalase activity
The findings that GPx exhibited a developmental regulation and catalase did not suggest that the differences between mature and developing OLs with respect to vulnerability and antioxidant capacity are caused by GPx and not catalase. This possibility was perplexing, however, because catalase (EC 1.11.1.6) has one of the highest turnover rates of any known enzyme (9.8 × 10⁵ molecules per minute; Claiborne and Fridovich, 1979); therefore, its expression in developing OLs would be expected to be sufficient to protect these cells against H2O2. However, auto-inactivation of catalase by H2O2 in vitro and in non-cellular systems has been well documented, and has been shown to involve the conversion of the active catalase complex I into the inactive complexes II or III (Aebi, 1984). It seemed possible, therefore, that there might be a dissociation between catalase expression and catalase activity in developing OLs encountering H2O2.
To pursue this possibility further, we next measured the activity of catalase in developing and mature OLs with and without previous treatment of cells with H2O2. We found that catalase activity in developing and MBP cells was the same, normalized to protein content (Fig. 6A). However, after 60 min of exposure to 100 μm H2O2, catalase activity was significantly reduced in developing OLs, but not in MBP expressing cells (Fig. 6A). At 400 μm H2O2, a decrease in catalase activity was seen in both types of cultures, but the decrease was greater (p < 0.01) in the developing OLs. In contrast, no significant modification in GPx activity was observed in either developing or mature OLs, at either concentration of H2O2 studied (100 or 400 μm) (Fig. 6B).
Figure 6.

Effect of H2O2 exposure on catalase and GPx activities in OLs. Catalase activity (A) but not GPx activity (B) was decreased by pre-exposure to H2O2. O4 or MBP cells were incubated in culture medium containing either 100 or 400 μm H2O2, and enzymatic activities were assayed after 1 hr. Activities were normalized to the protein content of each dish. Raw control values for catalase were 24,000 and 21,000 mU/mg protein in O4 and MBP cells, respectively. Raw control values for GPx were 6000 and 15,000 mU/mg protein in O4 and MBP cells, respectively. Values represent means ± SEM pooled from three experiments. *p < 0.05; **p < 0.001, using one-way ANOVA with Bonferroni post-test; NS, not significant.
Resistance to H2O2 in OLs is dependent on GPx and glutathione
The catalase activity measurements suggested that GPx might protect catalase against the inactivating effect of H2O2. If this were true, the resistance of mature cells would be expected to be compromised by a GPx inhibitor, and the vulnerability of developing OLs would be expected to be reduced by a GPx mimic. We found that toxicity of H2O2 to MBP-expressing OLs was potentiated by inhibiting GPx with 10 mm mercaptosuccinate (MS) (Sokolova et al., 2001), which was not itself toxic to MBP+ cells (Fig. 7A). Conversely, preincubating developing OLs for 12 hr with 10 μm Ebselen (Ebs), a GPx mimic (Maiorino et al., 1988), was associated with full protection against a toxic concentration (400 μm) of H2O2 (Fig. 7B). Consistent with these observations, GPx activity in mature OLs subjected to preincubation with MS for 12 hr was found to be decreased by 60%, whereas GPx in O4 cells preincubated with Ebselen was increased by ∼10-fold (Fig. 7C). Thus, the sensitivity of OLs toward H2O2 appears to be closely related to the level of GPx activity. Additional evidence for the involvement of GPx in the sensitivity of OLs to H2O2 is the effect of glutathione depletion on H2O2 toxicity. Glutathione depletion was achieved by pretreating the culture with cystine-deficient culture medium for 24 hr. Previously under these conditions we demonstrated a progressive and similar decline in the glutathione content in mature and developing OLs (Back et al., 1998). Here, we found that either reducing the cystine concentration to 3 μm in the culture medium or using cystine-deficient culture media potently increased cell death in mature OLs subjected to a nontoxic concentration (100 μm) of H2O2 (Fig. 7D).
Figure 7.

Glutathione system requirement for the H2O2 disposal in OLs. H2O2 toxicity was potentiated by preincubating mature cells with 10 mm MS, a GPx inhibitor (A), and was prevented by preincubating developing OLs with 10 μm Ebs, a glutathione peroxidase mimic, for 12 hr (B). Values represent means ± SD, and data are representative of three experiments. ***p < 0.001, using two-way ANOVA with Bonferroni post-test. C, GPx activity after preincubation with Ebs or MS in developing and mature OLs, respectively. Values represent means ± SEM of two to three experiments. D, H2O2 toxicity was potentiated in mature OLs by depletion of intracellular glutathione content using cystine-depleted culture medium for 24 hr [either 3 μm (Cys3) or 0 μm (Cys-) instead of 200 μm in regular culture medium]. Values represent means ± SD, and data are representative of three experiments. ***p < 0.001, using two-way ANOVA with Bonferroni post-test comparison.
Catalase activity is necessary for OL survival and is dependent on GPx activity
We next asked whether the upregulation of GPx activity in mature OLs could explain the reduced susceptibility of catalase to H2O2 in these cells (Fig. 6A). Aminotriazole (AT) at 10 mm, a potent irreversible inhibitor of catalase (Halliwell and Gutteridge, 1999), significantly potentiated H2O2 toxicity in MBP expressing cells (Fig. 8A). Thus, H2O2 toxicity in mature OLs is dependent not only on GPx activity but also on catalase activity. Consistent with this observation, a similar reduction in H2O2 clearance was observed after mature OLs had been preincubated for 12 hr either with 10 mm mercaptosuccinate or aminotriazole (Fig. 8B). Comparing catalase and GPx activities in mature OLs preincubated separately with these two inhibitors under basal conditions, we found that mercaptosuccinate decreased GPx activity by ∼50%, and aminotriazole decreased catalase activity by >90% (Fig. 8C). When cells were challenged with 100 μm H2O2 for 1 hr, mercaptosuccinate preincubation led to a 50% decrease in catalase activity, whereas aminotriazole had no effect on GPx activity compared with control cells (Fig. 8C). In unchallenged mature OLs, 12 hr pretreatment with mercaptosuccinate had a small nonsignificant effect on catalase activity (Fig. 8C).
Figure 8.

GPx dependence of catalase activity in OLs exposed to H2O2. A, H2O2 toxicity was potentiated by preincubating mature cells with AT, an irreversible inhibitor of catalase, at a concentration of 10 mm. In the presence of aminotriazole, toxicity was potentiated to the level seen with 10 mm MS alone (400 + MS). Data are representative of three experiments. ***p < 0.001, using two-way ANOVA with Bonferroni post-test comparison. B, H2O2 clearance was strongly suppressed by both inhibitors in MBP OLs. C, Variations in catalase and GPx activities in mature OLs in the presence of H2O2 with no pretreatment (0) or after preincubation with 10 mm MS or AT. MS induced a reduction of both GPx and catalase activities in the presence of H2O2, whereas AT was able to inhibit only catalase (C). Results shown are means ± SD, and data are representative of three experiments. *p < 0.05; **p < 0.01, using two-way ANOVA with Bonferroni post-test comparison. D, Variations in catalase and GPx activities in developing OLs in the presence of H2O2 with no pretreatment (0) or after preincubation with 10 μm Ebs. Ebselen induced a large rise in GPx activity with no significant effect on catalase activity under basal conditions. In contrast, Ebselen was able to fully protect developing OLs against a H2O2-induced decrease in catalase activity. Values represent means ± SEM of three experiments. *p < 0.05, using one-way ANOVA with Bonferroni post-test comparison. Raw control values for catalase and GPx activities in O4 and MBP cells were similar to those indicated in Figure 6. E, Changes in catalase activity were not related to the regulation of protein expression, as assessed by Western blot.
When developing OLs were preincubated with 10 μm Ebs under basal conditions, GPx activity increased, but catalase activity did not change significantly (Fig. 8D). Consistent with the hypothesis that glutathione peroxidase activity protects catalase against inactivation, Ebs was able to protect developing OLs fully against the H2O2-induced decrease in catalase activity (Fig. 8D). Similar findings were obtained with a more stringent challenge (400 μm H2O2) (data not shown). Western blot analysis revealed no significant difference in catalase protein levels between untreated, challenged, and/or preincubated cells (Fig. 8E). Together, the data demonstrate that auto-inactivation of catalase in response to H2O2 is dependent on the level of GPx activity. These findings suggest that upregulation of GPx in mature OLs may attenuate H2O2 toxicity through protection of catalase activity.
GPx activity appears to be the limiting step in the H2O2 detoxification system
Finally, because reduced GSH is the principal substrate of GPx, we compared the GSH content in developing and mature OLs. Consistent with findings reported previously (Back et al., 1998), we found no difference in GSH content between O4+ and MBP+ cells under basal conditions. As reported previously (Dringen and Hamprecht, 1997), H2O2 exposure induced a rapid oxidation of glutathione, with a decline in its intracellular reduced form by >70% within the first 3 min. This decrease was not different in developing and mature cells subjected to 100 μm H2O2 (Fig. 9A). Similarly, the activity of glutathione reductase, the enzyme recycling oxidized glutathione to its reduced form, was similar in the two cell types, suggesting that glutathione availability is not limiting for GPx activity in developing OLs (Fig. 9B).
Figure 9.

Glutathione availability is not different between developing and mature OLs. A, A rapid drop in intracellular reduced glutathione content was observed after H2O2 exposure. No difference between developing and mature OLs has been detected. Values represent means ± SEM from three experiments. NS, Not significant, using one-way ANOVA with Bonferroni post-test comparison. B, Enzymatic activity assay for glutathione reductase in homogenates of developing and mature OLs. The glutathione reductase activity was normalized to the total protein concentration. One unit is defined as the amount of enzyme causing the oxidation of 1 nmol of NADPH per minute. NS, Not significant, using Student's t test.
Discussion
Previous work has shown a profound difference between developing OLs and MBP expressing OLs in their vulnerability to intracellular glutathione depletion in vitro and in vivo (Back et al., 1998, 2002). The mechanism of toxicity in this paradigm involves the intracellular accumulation of ROS (Oka et al., 1993; Yonezawa et al., 1996; Back et al., 1998). The aim of the current study was to determine whether OLs also show a developmental difference in their vulnerability to an exogenous source of ROS and, further, to delineate the basis for this changing vulnerability. We found that developing OLs were more sensitive than mature OLs to H2O2. This acquired resistance to oxidative stress could be caused by intrinsic factors, such as a failure to activate death pathways in mature cells, or to the presence of protective pathways lacking in developing OLs, such as antioxidant enzyme systems that destroy ROS before they can act on the cells. In this report, we present evidence for the latter possibility.
In most cells, H2O2 can be detoxified by two different enzymes, catalase and GPx (Fig. 10). The glutathione peroxidase superfamily consists of at least four types of selenium-containing peroxidases that are encoded by separate genes and that could contribute to the detoxification of H2O2: GPx-1, a nearly ubiquitous enzyme found in most cells; an extracellular GPx found in plasma designated pGPx; a phospholipid hydroperoxide GPx, designated PHGPx; and a GPx found in cells lining the gastrointestinal tract, designated giGPx (Halliwell and Gutteridge, 1999). GPx-1, pGPx, and giGPx are tetrameric enzymes, whereas PHGPx is a monomeric protein. The antibody used in the present study is directed against GPx-1. We have documented here an increase in GPx-1 with maturation in the oligodendrocytes lineage, but have not excluded the possibility that other GPxs might be present, upregulated, and contribute to the protection observed in the mature OLs.
Figure 10.
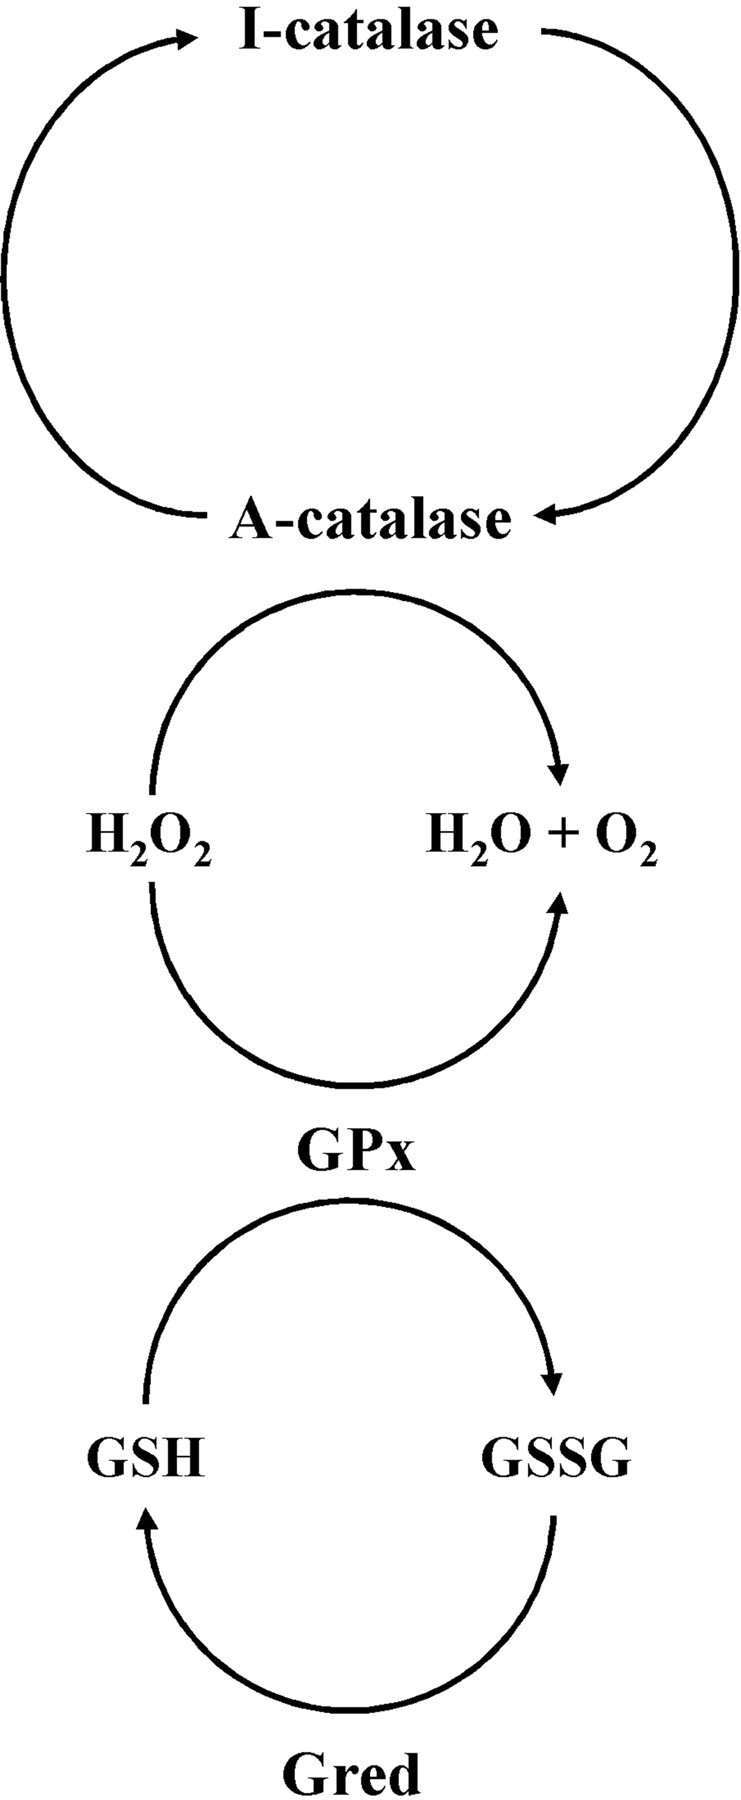
Schematic diagram describing the system for the detoxification of H2O2 in OLs in culture. Catalase and GPx are able to dispose of H2O2. In developing OLs, GPx appears to be limiting for the degradation of H2O2. Reduced GSH is oxidized into GSSG and recycled by glutathione reductase (GRed). Auto-inactivation of catalase (I-catalase) by H2O2 is prevented by GPx, which maintains catalase in active form (A-catalase).
Developmental studies of whole brain have demonstrated independent regulation in the expression of antioxidant enzymes in the murine brain (Mavelli et al., 1982). Catalase immunoreactivity and activity were found to be higher in the neonatal rat than in the adult (Del Ma3stro and McDonald, 1987; Moreno et al., 1995; Hamby-Mason et al., 1997). In contrast, GPx was shown to undergo a 70% increase in activity in rat whole brain between birth and adulthood (Brannan et al., 1981). Interestingly, this increase was reported to occur mainly after the first 10 d of postnatal life, corresponding to the period of cerebral myelination (Del Maestro and McDonald, 1987). However, discrepancies exist in the literature, and potential differences between various cell types populating the telencephalon during development were not taken into account. Interestingly, GPx-1 expression has been reported to be regulated by the transcription factor PU.1 during the maturation of another cell type, the neutrophil (Throm and Klemsz, 2003). Additional study is needed to assess the possibility of involvement of PU.1 in the upregulation of GPx-1 during OLs lineage progression. We extend and focus the investigation of antioxidant enzyme development in the CNS with a culture model system allowing the comparison of various developmental stages in the oligodendrocyte lineage. We found that catalase expression is constant throughout OL development but that GPx expression is very low in developing OLs and upregulated in mature OLs. These data regarding MBP expressing OLs are consistent with a recent report (Hirrlinger et al., 2002). Given an equivalent expression of catalase in developing and mature OLs, it was not clear why catalase activity was not sufficient to protect both developing and mature OLs. Catalase is located in peroxisomes that are responsible for the synthesis of plasmalogens, which constitute one-third of myelin phospholipids, suggesting an important role for these organelles in myelin formation (Adamo et al., 1986). In contrast, GPx is found mainly in the cytosol (only ∼10% in the matrix of mitochondria) (Halliwell and Gutteridge, 1999). This subcellular compartmentalization is undoubtedly important for H2O2 detoxification. In addition, the Km of catalase (EC 1.11.1.6) (up to 25 mm)is >4000-fold higher than the Km of GPx (EC 1.11.1.9) (6 μm) (Charmagnol et al., 1983; Mozaffar et al., 1986). Thus, because of its localization in peroxisomes and low affinity, catalase would seem to be an ineffective barrier against extracellular H2O2 concentrations between 100 and 1000 μm. However, Dringen and Hamprecht (1997) demonstrated that, in astrocytes, GPx and catalase are able to substitute for each other functionally in H2O2 detoxification. In contrast, we found here that both GPx and catalase inhibitors are able to potentiate H2O2 toxicity in mature OLs, thereby suggesting that both enzymes are required for H2O2 clearance. Thus, GPx and catalase are not each in themselves sufficient to confer protection to MBP expressing OLs, but rather their cooperative interaction appears to be required.
In OLs, we found that catalase but not GPx activity is affected by pre-exposure to H2O2. This finding is in agreement with the lesser sensitivity of GPx to H2O2-induced inactivation reported previously (Tappel, 1984; Pigeolet et al., 1990). H2O2 acts as a “suicide substrate” at high concentrations (>100 μm), leading to an irreversible inactivation of catalase (Lardinois et al., 1996). In contrast, low concentrations of H2O2 are associated with a reversible inhibition. Therefore, it appears that the simplest explanation for our results is that, in the presence of high concentrations of H2O2, catalase is dependent on GPx activity to prevent inactivation. Consistent with our results, auto-inactivation of catalase has been observed in astrocytes with a compromised glutathione system (Sokolova et al., 2001).
An essential role for GPx-catalase cooperativity could account for the maturation dependence of resistance to H2O2 in the OL lineage, and suggests that this cooperativity might play an important physiological and pathophysiological role in the development of white matter. For example, the cooperative interaction between catalase and GPx, developmentally regulated, could explain the increase in brain injury, related to H2O2 accumulation, observed after hypoxia-ischemia in the transgenic neonatal mouse overexpressing Cu/Zn SOD, in contrast with the neuroprotection described in the transgenic adult (Ditelberg et al., 1996; Fullerton et al., 1998). An important role for GPx-catalase cooperativity in handling the wide range of H2O2 concentrations encountered by cells has been proposed, in which GPx, with much higher affinity for H2O2, operates at low concentrations, and catalase, with low affinity, is recruited at high concentrations (Halliwell and Gutteridge, 1999). However, a novel aspect of cooperativity in maintaining the activity of catalase is reported here: namely, that GPx is required to maintain H2O2 concentrations below the level at which catalase inactivation occurs. We are aware that there are other, more complicated explanations for the protective effect of GPx on catalase activity involving direct or indirect interaction between the enzymes. In any case, the vulnerability of developing OLs to H2O2 appears to be caused specifically by the vulnerability to inactivation of the catalase in these cells. In the presence of aminotriazole, H2O2 clearance appears to slow (Fig. 8B). Because H2O2 exposure per se does not cause GPx-1 inactivation (Fig. 8C), it is possible that the slowing of clearance observed in Figure 8B is caused by the consumption of glutathione, on which GPx-1 is dependent for its activity. This observation suggests another aspect of the cooperativity between GPx-1 and catalase: namely, that the participation of catalase in H2O2 clearance limits the depletion of intracellular glutathione that would, in itself, compromise the action of GPx-1.
We found that GPx activity itself likely represents the limiting factor in the glutathione antioxidant system (Fig. 10) because we failed to find maturational differences in the levels of GSH or the activity of glutathione reductase. The rapid oxidation of glutathione after exposure to H2O2 was not found to be different in the two stages. The process of reduction of oxidized GSH (GSSG) to reduced GSH requires glucose to ensure the continuous generation of NADPH through the pentose phosphate pathway (Delgado-Esteban et al., 2000). The depletion of intracellular GSH in cells exposed to H2O2 may be caused by a defect in NADPH production or glutathione reductase activity, to the rate of oxidation of GSH exceeding the rate of reduction of GSSG, or to the elimination of glutathione from cells by the transport of GSSG out of cells and into the extracellular medium. Interestingly, although it has been found recently that vitamin K has a potent protective effect on oxidative injury induced by intracellular glutathione depletion (Li et al., 2003), no effect was found of vitamin K on H2O2 toxicity (data not shown). This finding suggests that the glutathione depletion induced by H2O2 is not itself the direct cause of the toxicity observed. The lower GPx activity in developing OLs, secondary to lower expression, together with the depletion of GSH, further lowering GPx activity, may lead to accumulation of the inactive form of catalase unable to clear exogenous H2O2 efficiently.
The mechanism of H2O2 toxicity in our model remains in question. It is hypothesized that H2O2 itself is much less toxic than reactive hydroxyl radicals, whose formation is catalyzed by the presence of iron (Halliwell, 1992; Dringen and Hamprecht, 1997). However, in developing OLs we found that 100 μm deferoxamine, a potent iron chelator, had no effect on H2O2 toxicity (data not shown). Similarly, 12-lipoxygenase activation, shown previously to be involved in glutathione-depletion-evoked toxicity to immature neurons (Li et al., 1997), did not seem to be involved, because two inhibitors of 12-lipoxygenase, AA861 and BMD-122, did not block the H2O2-induced cell death induced by exogenous H2O2 or glucose oxidase (data not shown). A previous report suggested an important role for lipids in the resistance of H2O2-induced apoptotic cell death (Brand et al., 2001). Although a direct attack of H2O2 on membrane lipids is the most plausible hypothesis, the observations in the present study that H2O2 causes intracellular glutathione depletion and that intracellular antioxidant enzymes can clear H2O2 from the extracellular medium suggest that H2O2 enters the cells and therefore may set in motion one or more toxic pathways in developing OLs.
The developmental variation in vulnerability to H2O2 observed in OL cultures may be of particular relevance to health because white matter damage in the human has been recognized to occur predominantly during a window of gestational age between 24 and 32 weeks (Volpe, 2001), a time when developing OLs predominate (Back et al., 2001). Concentrations of H2O2 leading to OL toxicity in our model were consistent with those reported for toxicity in astrocytes and neurons (Desagher et al., 1996; Sokolova et al., 2001). For comparison, the endogenous rate of H2O2 production by normal rat liver has been estimated to be ∼82 nmol H2O2/min/g of tissue (Oshino et al., 1973).
In summary, we describe a developmentally regulated vulnerability of OLs to H2O2 injury. GPx upregulation in mature OLs is likely to account for the increased resistance of mature OLs to H2O2. We demonstrate for the first time the pathophysiological relevance of the dependence of catalase activity on GPx activity for H2O2 disposal. Our long-term goal is to find potential interventions to interrupt the mechanisms of injury to the developing brain. Our results suggest a new approach to develop potential preventive strategies focused on the dynamic interaction between antioxidant enzymes.
Footnotes
This work was supported by National Institutes of Health Grants HD18655 and NS38475 (J.J.V.), United Cerebral Palsy Foundation Research Grant R-737 (J.L.), and Institut National de la Santé et de la Recherche Médicale (O.B.). We thank Ling Dong for his excellent technical assistance.
Correspondence should be addressed to Dr. Paul A. Rosenberg, Department of Neurology, Enders 3, Children's Hospital, 300 Longwood Avenue, Boston, MA 02115. E-mail: Paul.Rosenberg@tch.harvard.edu.
Copyright © 2004 Society for Neuroscience 0270-6474/04/241531-10$15.00/0
References
- Adamo AM, Aloise PA, Pasquini JM (1986) A possible relationship between concentration of microperoxisomes and myelination. Int J Dev Neurosci 4: 513-517. [DOI] [PubMed] [Google Scholar]
- Aebi HE (1984) Catalases. In: Methods of enzymatic analysis, Vol 3 (Bergmeyer HU, Bergmeyer J, Grassi M, eds), pp 273-286. Weinheim, Germany: Verlag Chemie. [Google Scholar]
- Back SA, Gan X, Li Y, Rosenberg PA, Volpe JJ (1998) Maturation-dependent vulnerability of OLs to oxidative stress-induced death caused by glutathione depletion. J Neurosci 18: 6241-6253. [DOI] [PMC free article] [PubMed] [Google Scholar]
- Back SA, Khan R, Gan X, Rosenberg PA, Volpe JJ (1999) A new Alamar Blue viability assay to rapidly quantify oligodendrocyte death. J Neurosci Methods 91: 47-54. [DOI] [PubMed] [Google Scholar]
- Back SA, Luo NL, Borenstein NS, Levine JM, Volpe JJ, Kinney HC (2001) Late oligodendrocyte progenitors coincide with the developmental window of vulnerability for human perinatal white matter injury. J Neurosci 21: 1302-1312. [DOI] [PMC free article] [PubMed] [Google Scholar]
- Back SA, Han BH, Luo NL, Chricton CA, Xanthoudakis S, Tam J, Arvin KL, Holtzman DM (2002) Selective vulnerability of late oligodendrocyte progenitors to hypoxia-ischemia. J Neurosci 22: 197-211. [DOI] [PMC free article] [PubMed] [Google Scholar]
- Brand A, Gil S, Seger R, Yavin E (2001) Lipid constituents in oligodendroglial cells alter susceptibility to H2O2-induced apoptotic cell death via ERK activation. J Neurochem 76: 910-918. [DOI] [PubMed] [Google Scholar]
- Brannan TS, Maker HS, Raes IP (1981) Regional distribution of catalase in the adult rat brain. J Neurochem 36: 307-309. [DOI] [PubMed] [Google Scholar]
- Charmagnol F, Sinet PM, Jerome M (1983) Selenium-dependent and non-selenium-dependent glutathione peroxidases in human tissue extracts. Biochim Biophys Acta 759: 49-57. [DOI] [PubMed] [Google Scholar]
- Claiborne A, Fridovich I (1979) Purification of the o-dianisidine peroxidase from Escherichia coli B: physicochemical characterization and analysis of its dual catalatic and peroxidatic activities. J Biol Chem 254: 4245-4252. [PubMed] [Google Scholar]
- Delgado-Esteban M, Almeida A, Bolanos JP (2000) d-Glucose prevents glutathione oxidation and mitochondrial damage after glutamate receptor stimulation in rat cortical primary neurons. J Neurochem 75: 1618-1624. [DOI] [PubMed] [Google Scholar]
- Del Maestro R, McDonald W (1987) Distribution of superoxide dismutase, glutathione peroxidase and catalase in developing rat brain. Mech Ageing Dev 41: 29-38. [DOI] [PubMed] [Google Scholar]
- De Marchena O, Guarnieri M, McKhann G (1974) Glutathione peroxidase levels in brain. J Neurochem 22: 773-776. [DOI] [PubMed] [Google Scholar]
- Desagher S, Glowinski J, Premont J (1996) Astrocytes protect neurons from hydrogen peroxide toxicity. J Neurosci 16: 2553-2562. [DOI] [PMC free article] [PubMed] [Google Scholar]
- Ditelberg JS, Sheldon RA, Epstein CJ, Ferriero DM (1996) Brain injury after perinatal hypoxia-ischemia is exacerbated in copper/zinc superoxide dismutase transgenic mice. Pediatr Res 39: 204-208. [DOI] [PubMed] [Google Scholar]
- Dringen R, Hamprecht B (1997) Involvement of glutathione peroxidase and catalase in the disposal of exogenous hydrogen peroxide by cultured astroglial cells. Brain Res 759: 67-75. [DOI] [PubMed] [Google Scholar]
- Fullerton HJ, Ditelberg JS, Chen SF, Sarco DP, Chan PH, Epstein CJ, Ferriero DM (1998) Copper/zinc superoxide dismutase transgenic brain accumulates hydrogen peroxide after perinatal hypoxia ischemia. Ann Neurol 44: 357-364. [DOI] [PubMed] [Google Scholar]
- Gaunt GL, de Duve C (1976) Subcellular distribution of d-amino acid oxidase and catalase in rat brain. J Neurochem 26: 749-759. [DOI] [PubMed] [Google Scholar]
- Halliwell B (1992) Reactive oxygen species and the central nervous system. J Neurochem 59: 1609-1623. [DOI] [PubMed] [Google Scholar]
- Halliwell B, Gutteridge JMC (1999) Antioxidant defence enzymes: the glutathione peroxidase family. In: Free radicals in biology and medicine, Ed 3, pp 140-146, 170-172. Oxford, UK: Oxford UP.
- Hamby-Mason R, Chen JJ, Schenker S, Perez A, Henderson GI (1997) Catalase mediates acetaldehyde formation from ethanol in fetal and neonatal rat brain. Alcohol Clin Exp Res 21: 1063-1072. [PubMed] [Google Scholar]
- Haynes RL, Folkerth RD, Keefe RJ, Sung I, Swzeda LI, Rosenberg PA, Volpe JJ, Kinney HC (2003) Nitrosative and oxidative injury to premyelinating OLs in periventricular leukomalacia. J Neuropathol Exp Neurol 62: 441-450. [DOI] [PubMed] [Google Scholar]
- Hirrlinger J, Resch A, Gutterer JM, Dringen R (2002) Oligodendroglial cells in culture effectively dispose of exogenous hydrogen peroxide: comparison with cultured neurones, astroglial and microglial cells. J Neurochem 82: 635-644. [DOI] [PubMed] [Google Scholar]
- Kim Y, Kim S (1991) Oligodendroglial cell death induced by oxygen radicals and its protection by catalase. J Neurosci Res 29: 100-106. [DOI] [PubMed] [Google Scholar]
- Kinney HC, Armstrong DD (1997) Perinatal neuropathology. In: Greenfield's neuropathology (Graham DI, Lantos PL, eds), pp 537-600. London: Arnold.
- Lardinois OM, Mestdagh MM, Rouxhet PG (1996) Reversible inhibition and irreversible inactivation of catalase in presence of hydrogen peroxide. Biochim Biophys Acta 1295: 222-238. [DOI] [PubMed] [Google Scholar]
- Li J, Lin JC, Wang H, Peterson JW, Furie BC, Furie B, Booth SL, Volpe JJ, Rosenberg PA (2003) Novel role of vitamin K in preventing oxidative injury to developing OLs and neurons. J Neurosci 23: 5816-5826. [DOI] [PMC free article] [PubMed] [Google Scholar]
- Li Y, Maher P, Schubert D (1997) A role for 12-lipoxygenase in nerve cell death caused by glutathione depletion. Neuron 19: 453-463. [DOI] [PubMed] [Google Scholar]
- Maiorino M, Roveri A, Coassin M, Ursini F (1988) Kinetic mechanism and substrate specificity of glutathione peroxidase activity of ebselen (PZ51). Biochem Pharmacol 37: 2267-2271. [DOI] [PubMed] [Google Scholar]
- Mavelli I, Rigo A, Federico R, Ciriolo MR, Rotilio G (1982) Superoxide dismutase, glutathione peroxidase and catalase in developing rat brain. Biochem J 204: 535-540. [DOI] [PMC free article] [PubMed] [Google Scholar]
- McCarthy KD, de Vellis J (1980) Preparation of separate astroglial and oligodendroglial cell cultures from rat cerebral tissue. J Cell Biol 85: 890-902. [DOI] [PMC free article] [PubMed] [Google Scholar]
- Moreno S, Mugnaini E, Ceru MP (1995) Immunocytochemical localization of catalase in the central nervous system of the rat. J Histochem Cytochem 43: 1253-1267. [DOI] [PubMed] [Google Scholar]
- Mozaffar S, Ueda M, Kitatsuji K, Shimizu S, Osumi M, Tanaka A (1986) Properties of catalase purified from a methanol-grown yeast, Kloeckera sp. 2201. Eur J Biochem 155: 527-531. [DOI] [PubMed] [Google Scholar]
- Oka A, Belliveau MJ, Rosenberg PA, Volpe JJ (1993) Vulnerability of oligodendroglia to glutamate: pharmacology, mechanisms, and prevention. J Neurosci 13: 1441-1453. [DOI] [PMC free article] [PubMed] [Google Scholar]
- Oshino N, Chance B, Bucher T (1973) The role of H2O2 generation in perfused rat liver and the reaction of catalase compound I and hydrogen donors. Arch Biochem Biophys 154: 117-131. [DOI] [PubMed] [Google Scholar]
- Pigeolet E, Corbisier P, Houbion A, Lambert D, Michiels C, Raes M, Zachary MD, Remacle J (1990) Glutathione peroxidase, superoxide dismutase-, and catalase inactivation by peroxides and oxygen derived free radicals. Mech Ageing Dev 51: 283-297. [DOI] [PubMed] [Google Scholar]
- Singh I, Carillo O, Namboodiri A (2000) Isolation and biochemical characterization of peroxisomes from cultured rat glial cells. Neurochem Res 25: 197-203. [DOI] [PubMed] [Google Scholar]
- Sokolova T, Gutterer JM, Hirrlinger J, Hamprecht B, Dringen R (2001) Catalase in astroglia-rich primary cultures from rat brain: immunocytochemical localization and inactivation during the disposal of hydrogen peroxide. Neurosci Lett 297: 129-132. [DOI] [PubMed] [Google Scholar]
- Tappel AL (1984) Selenium-glutathione peroxidase: properties and synthesis. Curr Top Cell Regul 24: 87-97. [PubMed] [Google Scholar]
- Throm SL, Klemsz MJ (2003) PU.1 regulates glutathione peroxidase expression in neutrophils. J Leukoc Biol 74: 111-117. [DOI] [PubMed] [Google Scholar]
- Volpe JJ (1997) Brain injury in the premature infant: from pathogenesis to prevention. Brain Dev 19: 519-534. [DOI] [PubMed] [Google Scholar]
- Volpe JJ (2001) Neurobiology of periventricular leukomalacia in the premature infant. Pediatr Res 50: 553-562. [DOI] [PubMed] [Google Scholar]
- Wang H, Joseph JA (1999) Quantifying cellular oxidative stress by dichlorofluorescein assay using microplate reader. Free Rad Biol Med 27: 612-616. [DOI] [PubMed] [Google Scholar]
- Yakes FM, Van Houten B (1997) Mitochondrial DNA damage is more extensive and persists longer than nuclear damage in human cells following oxidative stress. Proc Natl Acad Sci USA 94: 514-519. [DOI] [PMC free article] [PubMed] [Google Scholar]
- Yonezawa M, Back SA, Gan X, Rosenberg PA, Volpe JJ (1996) Cystine deprivation induces oligodendroglial death: rescue by free radical scavengers and by a diffusible glial factor. J Neurochem 67: 566-573. [DOI] [PubMed] [Google Scholar]