

Abstract
INTRODUCTION:
Extensive tumor sequencing efforts have transformed the way in which cancer driver genes are identified. Appropriate statistical modeling is crucial for distinguishing true drivers from passenger events that accumulate during tumorigenesis but provide no fitness advantage to cancer cells. A central assumption used in discovering driver genes and specific driver mutations is that exact positional recurrence is unlikely by chance: Seeing exactly the same DNA base pair mutated recurrently across patients is taken as proof that the mutation must be under functional selection for contributing to tumor fitness. The assumption is that mutational processes, being essentially random, are unlikely to hit the exact same base pair over and over again. However, although functional selection is clearly a key cause of recurrent mutations in cancers, whether it is the only prominent cause is not known.
RATIONALE:
To distinguish driver mutations from passengers, it is critical to understand the landscape of background mutations in cancer genomes. Recent pan-cancer mutation analyses have revealed rules of mutation distribution at the smallest (one to three base pairs) and largest (megabase) scales. At the small scale, mutational processes such as those attributable to sunlight, cigarette smoke, or random DNA copying errors generate patterns known as mutational signatures at the trinucleotide level. At the opposite extreme, the cell’snucleus is organized into two large compartments known as A and B, each consisting of multi-megabase chromatin domains. Compartment A contains gene-rich, open, active, early-replicating euchromatin. Compartment B contains gene-poor, closed, inactive, and late-replicating heterochromatin. Mutation frequency is generally higher in compartment B. Cancer genomes have been studied in detail at these two opposite scales, but less attention has been paid so far to the intervening “mesoscale.”
RESULTS:
We investigated the influence of mesoscale genomic features on mutational recurrence. We found that mutagenesis by the cytidine deaminase APOBEC3A is uniquely sensitive to mesoscale features, specifically the ability of DNA to adopt particular “hairpin” (stem-loop) structures while transiently single-stranded. Identifying DNA loci that can form hairpins requires sequence analysis at the mesoscale (~30–base pair) level. Combining biochemistry and bioinformatics, we deduced the features of APOBEC3A’s optimal DNA substrates, revealing that cytosine bases presented in a short loop at the end of a strongly paired stem can be mutated up to 200 times as frequently as nonhairpin sites. Analyzing the most frequent APOBEC mutations in protein-coding regions of cancer genomes, we identified numerous recurrent mutations at optimal hairpins in genes unconnected to cancer. Conversely, we found that mutational hotspots at nonoptimal sites are enriched in known cancer driver genes.
CONCLUSION:
Our results indicate that there are multiple possible routes to mutational hotspots in cancer. Functional mutations in oncogenes or tumor suppressors can rise to prominence through positive selection. These driver hotspots are not restricted to the “favorite” sites of any particular mutagen. In contrast, DNA sites that happen to be perfect substrates for a mutagen can give rise to “passenger hotspot mutations” that owe their prevalence to substrate optimality, not to any effects on tumor fitness. In light of these findings, we recommend caution in interpreting the long lists of putative novel cancer driver hotspots being produced by high-throughput sequencing projects.
Cancer drivers require statistical modeling to distinguish them from passenger events, which accumulate during tumorigenesis but provide no fitness advantage to cancer cells. The discovery of driver genes and mutations relies on the assumption that exact positional recurrence is unlikely by chance; thus, the precise sharing of mutations across patients identifies drivers. Examining the mutation landscape in cancer genomes, we found that many recurrent cancer mutations previously designated as drivers are likely passengers. Our integrated bioinformatic and biochemical analyses revealed that these passenger hotspot mutations arise from the preference of APOBEC3A, a cytidine deaminase, for DNA stem-loops. Conversely, recurrent APOBEC-signature mutations not in stem-loops are enriched in well-characterized driver genes and may predict new drivers. This demonstrates that mesoscale genomic features need to be integrated into computational models aimed at identifying mutations linked to diseases.
Graphical Abstract
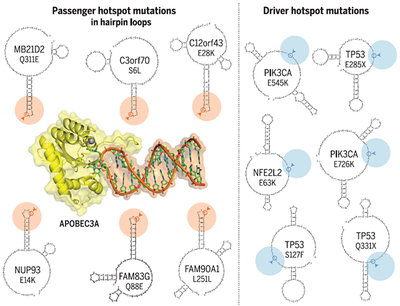
APOBEC3A has a taste for hairpins. The APOBEC cytidine deaminase enzymes are a prominent cause of mutations in cancer. Analysis of mutational patterns at the mesoscale (~30–base pair) level reveals that APOBEC3A strongly prefers “hairpin” substrates. These stem-loop DNA structures can form via intrastrand base pairing. Cytosine bases presented at the end of a stable hairpin are exceptionally vulnerable to attack by APOBEC3A, leading to recurrent mutations in the absence of any selective benefit (“passenger hotspots,” left). In contrast, APOBEC mutational hotspots in known cancer driver genes (“driver hotspots,” right) are not restricted to any particular kind of DNA structure.
A major challenge of cancer genomics has been the identification of cancer driver mutations and driver genes. Complicating this task is the huge number of causally neutral “passenger” mutations also found in tumors. Statistical methods for identifying driver genes have relied on the gold standard of recurrence across patients. Any gene mutated significantly more frequently than expected by chance is a candidate cancer driver gene (1,2). Moreover, seeing exactly the same DNA base pair mutated recurrently across patients has been taken as incontrovertible proof that the mutation must be under functional selection for contributing to tumor fitness (3). However, although functional selection is clearly a key cause of recurrent mutations in cancers, whether it is the only prominent cause is not known.
To distinguish driver mutations from passengers, it is critical to understand the landscape of background mutations in cancer genomes. Recent pan-cancer mutation analyses revealed rules of mutation distribution at a very small scale [1 to 3 base pairs (bp)] and a very large scale (1 to 10 megabases). At the small scale, various mutational processes generate characteristic patterns of mutations in the genome, termed “signatures” (1,4,5). These mutational signatures are defined by the trinucleotide neighborhood of the mutated base, plus the change made in the specific base via mutation. More than 30 distinct mutational signatures have been characterized, reflecting endogenous and exogenous mutagenic processes (4). At the large scale, chromatin is organized into topologically associating domains (TADs) (6). The nucleus is organized into two large-scale compartments known as A and B. Compartment A is made up of TADs that contain gene-rich, actively transcribed, early-replicating euchromatin, whereas TADs in compartment B tend to be gene-poor, repeat-rich, transcriptionally repressed, late-replicating heterochromatin (7, 8). Mutation frequency is generally higher in compartment B (1,9). Understanding this large-scale determinant of mutation frequencies improved the accuracy of statistical algorithms for identifying cancer driver genes (2).
Cancer genomes have been studied at these two opposite scales: the small scale of trinucleotides, and the large scale of multi-megabase chromatin domains. However, less attention has been paid to the “mesoscale” regime bridging the two extremes. Recent studies have revealed the influence of nucleosome positioning—which induces periodicity at the 10-bp scale (10,11)—and of noncanonical DNA structures (12–14). We and others showed that a specific cancer mutation signature accumulates preferentially on the lagging-strand template during DNA synthesis (15–17), raising the possibility that certain mesoscale DNA features associated with single-stranded DNA (ssDNA) contribute to mutagenesis. Here, we systematically investigated the influence of mesoscale features on mutational recurrence, revealing the existence of “passenger hotspot mutations” that owe their prevalence to the structural preference of a specific cancer mutagen, but not to their contributions to tumor fitness.
Cancer mutational landscape at small and large scales
Combining data from The Cancer Genome Atlas (TCGA) and other projects (1,2,4,13,15), we assembled mutation calls from a collection of 1686 tumor-normal pairs subjected to whole-genome sequencing (WGS) (table S1) and surveyed their mutational landscape at different scales: large-scale (Fig. 1, A and B, and fig. S1A), mesoscale (Fig. 1, C and D, and fig. S1B), and small-scale (Fig. 1, E and F, and fig. S1C). At the small scale, mutational signatures are defined by trinucleotide context (Fig. 1E), and analysis by nonnegative matrix factorization (1, 4, 5) revealed a set of mutational signatures (Fig. 1F and fig. S1C) corresponding to known mutational processes such as APOBEC enzyme activity, exposure to ultraviolet radiation (UV), loss of DNA polymerase e proofreading activity (POLE), and loss of mismatch repair leading to microsatellite instability (MSI).
Fig. 1. The mutational background in cancer shows variation at all scales.

(A) At the large scale, the genome is organized into multi-megabase chromatin domains roughly corresponding to nuclear compartment A (gene-rich, highly transcribed, early-replicating, low-mutation frequency) versus compartment B (gene-poor, repeat-rich, low-transcription, late-replicating, high-mutation frequency). Cancer driver genes tend to occupy compartment A, whereas frequently mutated genes in compartment B are more likely to be passengers. (B) Mutations are generally enriched in late-replicating DNA, whereas APOBEC mutation frequency is unresponsive to large-scale covariates. Error bars denote 95% confidence intervals. (C) At the mesoscale, local DNA secondary structures can also influence mutation frequency; for example, nucleotides exposed in the loop of a DNA hairpin may suffer increased vulnerability to mutagens. (D) For each mutational signature, relative mutation frequency in hairpin loops is shown as a function of how strongly the hairpin is base-paired. APOBEC-associated mutation frequency increases markedly at nucleotides exposed in stable hairpin loops. In contrast, other mutational signatures show little effect of hairpins. Error bars denote 95% confidence intervals. (E) At the small scale, mutational signatures have been defined by the relative abundance of mutations across trinucleotide contexts. (F) Mutational signatures reflect the action of mutagens such as APOBEC activity, UV irradiation, loss of polymerase proofreading (POLE), or failed mismatched repair (MSI). Each signature is displayed using two equivalent visual conventions: The upper rectangles show “fingerprint plots” (4, 5), whereas the lower three-dimensional bar plots show “Lego plots” (1), in which the APOBEC mutational signature can be seen at a glance to occupy the “back-row” TpC motif.
We also analyzed the WGS dataset at the large scale. Figure 1A shows the entire chromosome 17 for illustration (see data S1 for all chromosomes). Plotted along the length of the chromosome in red is the noncoding mutation frequency, summed across patients of all tumor types. This represents an approximation of the background mutation frequency, with exons excluded to minimize the impact of driver mutations. Strikingly, the most prominent cancer driver genes on this chromosome— TP53, NF1, ERBB2 (Her2), and BRCA1—are all located in regions with the lowest frequency of background mutation. Superimposed on the mutation frequency profile are two covariates explored previously (1): The blue line shows DNA replication timing (18), and the green line shows average RNA expression level measured across a panel of 91 cell lines in the Cancer Cell Line Encyclopedia (19). Also superimposed in yellow is the first principal component of variation extracted from chromosome conformation capture (Hi-C) analysis of the threedimensional structure of chromatin in the nucleus. The two extremes of this metric have been shown to correspond to regions of DNA in compartments A and B of the nucleus (7). These four metrics— replication timing, RNA expression level, chromatin compartment, and mutation frequency—are strongly mutually correlated. They clearly divide the genome into actively transcribed, early-replicating regions of low background mutation frequency inhabited by cancer driver genes, and late-replicating, transcriptionally quiet, mutation-dense regions that contain genes (e.g., DNAH9, ASIC2, KTF2B, ABCA5) potentially enriched for passenger mutations.
To understand whether the small- and large-scale features of the mutation landscape are associated, we stratified patients by their dominant mutational signatures and measured the dependence of mutation frequency on DNA replication timing, a representative large-scale covariate. For mutations associated with UV radiation, POLE proofreading loss, or MSI, we observed a strong trend of increasing mutation frequency with later DNA replication time (Fig. 1B and table S2). This trend was also observed for mutations associated with smoking, aging, the “ESO” signature, or the “BRCA” signature (fig. S1A). In contrast, the frequency of mutations associated with APOBEC enzyme activity showed no dependence on replication timing (Fig. 1B and table S2). APOBEC mutagenesis is unique in this respect, raising the possibility that the distribution of APOBEC-signature mutations is regulated by mechanisms undetectable at the large scale.
Cancer mutational background at the mesoscale: DNA hairpins
We next turned to the mesoscale. We showed that APOBEC-signature mutations are preferentially enriched on the lagging-strand template of DNA replication (15), raising the possibility that intrastrand secondary structures forming in transiently exposed ssDNA might influence APOBEC mutation frequency (14). In particular, the formation of “hairpin” structures might “flip out” bases located in the hairpin loop (20), increasing their exposure to solvent and, potentially, to mutagens (Fig. 1C). Indeed, increased mutability has been observed at palindromic sequences (13,14). We systematically identified potential hairpin sites genome-wide by classifying each nucleotide in the genome according to the extent of any flanking palindromic sequences that might form base pairs. We restricted this initial analysis to the smallest possible loops [3 to 5 nucleotides (nt)] because they have the maximal probability of flipping out bases (20). Relative hairpinforming potential was quantified as “stem strength,” defined as the number of AT base pairs plus 3 times the number of GC base pairs (21). Genomic positions were binned by hairpin-forming potential, and mutation frequency was computed in each bin (Fig. 1D and fig. S1B). Most positions had no hairpin-forming flanking sequences; the “no-hairpin” baseline mutation frequency was computed from these positions. For most mutational processes (UV, POLE, MSI, smoking, aging, BRCA, ESO), mutation frequency varied little across bins, indicating minimal impact of hairpinforming potential. However, for the APOBEC mutational signature, we observed an increase in mutation frequency for nucleotides in potential hairpin loops: In the strongest hairpins, APOBEC mutation frequency increased by a factor of 8 above baseline. This result establishes APOBEC mutagenesis as uniquely targeted to nucleotides in DNA hairpin loops, a mesoscale DNA feature. It is consistent with observations of palindromic sequences flanking APOBEC mutation hotspots in breast tumors (13) and APOBEC3A’s preference for hairpin substrates in RNA (22).
APOBEC3A prefers substrate sites in DNA stem-loops
The statistical enrichment of APOBEC-signature mutations at hairpin sites led us to investigate which APOBEC enzyme(s) are responsible for this pattern. Previous work has linked the APOBEC mutational signature, which is specifically enriched at TpC (T followed by C) dinucleotides (1, 4, 5, 23), to APOBEC3A (A3A) (24) and APOBEC3B (A3B) (24–27), and more recently to APOBEC3H haplotype I (A3H-I) (28). We used an in vitro biochemical assay to measure the efficiency of cytosine deamination mediated by A3A, A3B, and A3H-I in a synthetic DNA substrate derived from a recurrently mutated TpC site in the NUP93 gene (Fig. 2, A and B). APOBEC-mediated DNA breakage was observed in extracts of cells expressing A3A and A3B but not A3H-I (fig. S2, A to C), which suggests that A3H-I has a relatively low enzymatic activity. Using purified proteins, we detected the activities of A3A, A3B, and A3H-I (figs. S2D and S3). In all in vitro assays, DNA breakage was dependent on APOBEC activity (fig. S2, A to D).
Fig. 2. Enzymatic activity of APOBEC3A is enhanced in the loop of a DNA hairpin.

(A) In vitro assay for APOBEC cytidine deamination activity. A labeled DNA substrate is incubated with APOBEC enzyme, which can deaminate C to U. Subsequent activity of the enzyme uracil-DNA glycosylase (UNG) generates an abasic site that can be cleaved by heating. (B) Naturally occurring DNA hairpin in the gene NUP93, and a modified version (“NUP93-noHP”) in which one side of the hairpin has been replaced with PolyA, abrogating the secondary structure. (C) Time course of APOBEC3A deamination activity on the NUP93 and NUP93-noHP substrates. APOBEC3A shows a preference for the hairpin-containing substrate. Error bars denote SD. (D) Comparison of deamination activity across three APOBEC3 family members. Whereas APOBEC3A (A3A) prefers the hairpin-containing substrate, APOBEC3B (A3B) shows no such preference, and APOBEC3H haplotype I (A3H-I) shows preference for nonhairpins.
The NUP93 substrate forms a stem-loop (Fig. 2B; see also fig. S5, A and B). To test whether A3A, A3B, or A3H-I preferentially targets DNA stem-loops, we replaced one side of the stem in the NUP93 substrate with all A’s, disrupting the hairpin (NUP93-noHP; Fig. 2B). A3A displayed stronger activity on the wild-type NUP93 substrate than on the no-hairpin version NUP93-noHP (Fig. 2, C and D, and fig. S3, B and D). In contrast, A3B showed comparable activity on both substrates (Fig. 2D and fig. S3, B and D), whereas A3H-I displayed a clear preference for NUP93-noHP over NUP93 (Fig. 2D and fig. S2D). The preference of A3A for NUP93 over NUP93-noHP was observed with a range of concentrations of cell extracts (fig. S2E). Furthermore, A3A displayed a preference for NUP93 over the nonhairpin PolyA-TC (a substrate oligo with a TpC dinucleotide embedded in a sequence of mostly A’s) (fig. S2E). These results suggest that A3A, but not A3B or A3H-I, preferentially targets DNA stem-loop structures. This conclusion was confirmed at other recurrently mutated hairpin TpC sites in subsequent analyses (see fig. S11).
Consistent with the in vitro data, in tumors dominated by the A3B signature (25), the dependence of mutation frequency on hairpin potential disappeared (fig. S4). In contrast, APOBEC+ tumors homozygous for a deletion polymorphism (28,29) that removes A3B but generates an A3A/B fusion protein identical to A3A behaved as typical A3A-dominated samples, showing the same preference for hairpin sites (fig. S4). These results confirm that A3A and not A3B is the main cause of recurrent APOBEC mutations in DNA stem-loops in tumors. They are consistent with observations of a U-shaped conformation adopted by DNA bound to A3A (30–32).
Structural features of DNA stem-loops regulating APOBEC3A and mutation accumulation in tumors
To further refine the structural preferences of A3A, we next systematically varied the length of the NUP93 stem. Hairpin formation was confirmed with native gels (fig. S5, A and B) and exonuclease T (Exo T), which cleaves ssDNA from the 3′ end (fig. S5, C and D). A3A activity was not significantly affected by the decrease of stem length from 7 to 3 bp, but was reduced by further shortening of the stem (Fig. 3A). This is consistent with hairpin formation being dependent on having a stem of ≥3 bp. To test how stem strength (and consequently hairpin stability) might affect APOBEC mutation frequency in tumors, we used the APOBEC+ WGS dataset to identify all locations in the genome with the potential to form a hairpin with a 4-nt loop (as in the NUP93 site) and binned them by hairpin stem strength. Consistent with the preference of A3A for stable stems in vitro, we found that APOBEC mutation frequency in tumors increases with stem strength. In stems with the strongest pairing, mutation frequency showed a factor of 15 increase above the no-hairpin baseline (Fig. 3B). We also stratified hairpins by the position of the TpC within the loop (different colors in Fig. 3B). TpC sites in the 5′ half of the loop (dark and light blue bars) showed no increase in mutation frequency, whereas those at the 3′-most position (yellow bars) and position 3 (green bars) displayed increased mutation frequency, suggesting that A3A prefers TpC sites at specific positions in the loop.
Fig. 3. Data from in vitro enzymology and tumor bioinformatics converge to illustrate the substrate preferences of APOBEC3A.

(A) A series of NUP93 hairpin substrate analogs in which the base-paired stem is progressively weakened shows that APOBEC3A (A3A) activity depends on the presence of a DNA hairpin. (B) Analysis of APOBEC-dominated tumors sequenced by WGS recapitulates the pattern observed with synthetic substrates: TpC sites exposed in a DNA hairpin loop are mutated at higher frequencies, increasing as the stem base-pairing becomes stronger. Furthermore, the position of the C in the loop affects mutability, with the highest frequencies observed for C’s at the 3′-most position in the loop. No increase in frequency was observed for C’s in the 5′ half of the loop. (C) The naturally occurring NUP93 hairpin site has a 4-nt loop and is an efficient substrate in the in vitro A3A activity assay. Increasing the size of the loop decreases the observed rate of A3A activity. Conversely, a substrate with a 3-nt loop (“NUP93-L3”) shows even stronger activity than the natural hairpin. (D) Statistics from human APOBEC+ tumors confirm this trend: Hairpins with 3-nt loops show the highest mutation frequency, and the increase is observed only when the C is at the 3′-most position of the loop (in other words, the Tof the TpC is centered in the loop). Hairpins with longer loops show decreasing APOBEC mutation frequency. Hairpins with TpC centered in the loop show the strongest increase. (E) The precise sequence context around the TpC site can drastically affect substrate fitness for A3A activity. A version of the NUP93 substrate with the TpC moved to the middle of the loop shows lower activity in the in vitro A3A activity assay. However, a single-nucleotide change from T to C (blue arrowheads) restores activity. (F) These findings are mirrored by statistical trends in APOBEC+ tumors. For each type of hairpin loop, mutation frequency is influenced by the identity of the other nucleotide(s) in the loop and the stem’s closing base pair. The globally optimal DNA substrate for APOBEC3A is a strongly base-paired hairpin with the 3-nt loop TTC and a C-G closing base pair; in APOBEC+ human cancers, these sites are mutated ~200 times as frequently as nonhairpin TpC sites. Error bars in (B), (D), and (F) denote 95% confidence intervals.
To test whether the loop size of hairpins affects A3A activity, we systematically varied the loop size of the NUP93 construct from 3 to 7 nt (fig. S5, B and E). We observed a decrease of A3A activity with increasing loop size (Fig. 3C). Consistent with this in vitro preference of A3A for small loops, APOBEC mutation frequency in tumors was maximal for 3-nt loops and decreased with increasing loop length (Fig. 3D). Again, the effect of TpC positioning within the loop was observed. For each loop size, maximal mutation frequency was seen when the T of the TpC is positioned in the center of the loop (Fig. 3, B and D, fig. S6A, and table S3), indicating that specific positioning of this T residue is a crucial feature of how A3A binds to its optimal substrates.
Sequence contexts regulating APOBEC3A and mutation accumulation in tumors
We next investigated whether A3A prefers hairpin TpC sites in a specific sequence context. Previous genomic studies (25) suggested that A3A has a predilection for cytosines in the motifs YTCA or YTCG (Y = C or T), but these motifs have not been tested in the context of hairpins. We systematically varied the nucleotides surrounding the TpC site in the NUP93 stem-loop. Purines are preferred by A3A 3′ to the TpC site (fig. S7A). In contrast, a guanine 5′ to the TpC site is disfavored, whereas an adenine is modestly unfavorable (fig. S7B). These results indicate that the YTCR (R = A or G) motif makes a preferred substrate for A3A. To test whether this sequence preference of A3A affects APOBEC mutation frequency in tumors, we identified 53 TpC sites in NUP93-type hairpins (4-nt loops, TpC at position 4) that are mutated in three or more APOBEC+ tumors. The YTCR motif is clearly enriched at these mutation sites (fig. S7C), which suggests that the sequence preference of A3A drives the recurrence of APOBEC mutations at this motif in tumors.
Because the position of the TpC in the loop is important for A3A activity, we asked whether the sequence preference of A3A remains the same for TpC sites at different positions. When the TpC of NUP93 was moved from position 4 of the loop to position 3 without altering the surrounding nucleotides, A3A activity was reduced (Fig. 3E). However, a T-to-C change 5′ to the TpC restored A3A activity (Fig. 3E), suggesting that A3A has distinct sequence preferences for TpC sites at different positions. To test whether this biochemical feature of A3A affects APOBEC mutation frequency in tumors, we identified all hairpins containing 4-nt loops with the TpC at position 4 or 3, and stratified them by the sequence of the other two bases in the loop and the closing base pair (Fig. 3F and table S5). We measured mutation frequency in each of these 64 possible sequence contexts and found that it varied, ranging from ~1× to ~30×, relative to the nohairpin baseline (Fig. 3F, left set of bars shows selected contexts). TpC sites at position 4 of the loop associate with higher mutation frequency than those at position 3. Furthermore, distinct surrounding sequences were enriched at TpC sites at positions 4 and 3. Consistent with the in vitro experiments, the wild-type NUP93 sequence context (Fig. 3F, #1) is associated with high mutation frequency in tumors (~30× over baseline). When the TpC is at position 3 (#2), mutation frequency is reduced by a factor of 9. When the TpC at position 3 is preceded by a C instead of a T (#3), mutation frequency is restored by a factor of 3. These results strongly suggest that the biochemical preference of A3A drives APOBEC mutations at different loop positions.
Finally, we investigated the sequence context of 3-nt loops having the TpC at position 3 of the loop, which showed the highest increase in mutation frequency of any loop structure (Fig. 3, C and D). We stratified these hairpins by the identity of the other base in the loop and the closing base pair (16 possible sequence contexts) (fig. S6B and table S4). Although strong increases over baseline (≥10×) were seen for all possible contexts, a TTC loop closed by a C-G base pair showed a factor of ~200 increase of mutation frequency, representing the globally ideal DNA substrate for A3A (Fig. 3F, right). Notably, in various sequence contexts, the mutational frequencies of TpC sites in 3-nt loops displayed a remarkable correlation with the A3A activity in vitro (fig. S8).
Defining the optimal substrates of APOBEC3A
Our results establish that A3A mutation frequency in hairpins depends on stem strength, loop size, positioning of the TpC site within the loop, and the identity of the surrounding nucleotides. We combined these features into a quantitative model for predicting relative A3A mutation frequency on the basis of observed mutation frequencies in the WGS dataset, restricted to noncoding regions (33) (fig. S9). To train our model, we binned TpC sites by stem strength, loop size, TpC positioning, and the identity of the bases immediately preceding and following the TpC site. For each bin, the number of sites in the genome matching those characteristics was tabulated, and the number of mutations occurring at those sites in the APOBEC+ WGS cohort was counted; this provided a denominator and numerator for calculating the mutation frequency of that category of TpC sites, which was then normalized to the no-hairpin baseline.
To validate our model, we trained the model on half of the data and tested it on the other half. Observations closely matched predictions when splitting the patients in half (fig. S10A) or splitting the genome in half (fig. S10B). We note that only a small amount of data is required for establishing the model’s parameters. To illustrate this, we trained a model on just the single most or second-most APOBEC+ patient, and prediction performance remained strong (fig. S10, C and D). Testing the predictions of the model on the coding sites of the WGS cohort (a completely nonoverlapping set of sites) also showed an excellent fit between predicted and observed relative mutation frequencies (fig. S10E). Finally, the model also performed well in predicting relative mutation frequencies at coding sites in the much larger whole-exome sequencing (WXS) TCGA cohort (fig. S10F). For all subsequent analyses, we defined an “optimal substrate” as one having a predicted relative mutation frequency of ≥4× above the nonhairpin baseline.
Mesoscale features distinguish between APOBEC-associated driver and passenger hotspots
Having learned the mesoscale genomic features directing A3A activity, we applied these insights to analysis of coding mutations in our APOBEC+ cohort of 2572 WXS patients. We ranked each TpC site in the exome by the number of mutated patients in this cohort, as well as by the A3A substrate optimality, defined as the predicted relative mutation frequency above the nonhairpin baseline. The top two most frequent APOBEC mutation sites were two hotspots in the well-known cancer driver gene PIK3CA (Fig. 4 and table S6). These two PIK3CA hotspots are not optimal A3A sites: They have substrate optimalities of 1.9× and 1.2×, respectively. Hotspots in the driver gene TP53 make up another three of the top 10 APOBEC hotspots. These sites are not optimal A3A sites either: They have substrate optimalities of 1.3×, 1.4×, and 1.2×, barely exceeding the nonhairpin baseline. Two other hotspots occur in C3orf70 and MROH2B, two genes not known to be associated with cancer. These hotspots are mutated in 18 and 11 patients, and they are highly optimal A3A substrates, with predicted relative mutation frequencies of 12× and 21×, respectively. NUP93, which is mutated in five patients but not known to be a cancer driver, has a substrate optimality of 38x. In general, we find that hotspots occurring in A3A’s optimal hairpin substrates tend to be outside known cancer genes: out of the top 100 TpC hotspots, 55 are in known cancer driver genes (34, 35), and none of these are at optimal A3A sites except for one, a hotspot in the gene MB21D2, which we discuss below. The other 45 TpC hotspots are in genes not known to be cancer drivers; of these, 29 (64%) are at optimal A3A sites. These results suggest that many hotspots in nondriver genes may in fact be “passenger hotspots” rising to prominence because they are easily generated by A3A activity, in contrast to driver hotspots arising at ordinary sites that confer clonal advantage to mutated cells.
Fig. 4. Mesoscale APOBEC mutational background features allow cancer drivers to be distinguished from passengers.

Shown are the top 100 most frequently mutated coding TpC hotspots in a set of 2572 APOBEC+ human cancers sequenced by WXS. Each dot is a hotspot: y-axis position indicates the number of patients mutated at that particular base pair, and x-axis position indicates the substrate optimality, expressed as the relative mutation frequency predicted from the position’s mesoscale features, namely the ability to fold into a hairpin that ideally exposes the mutated position in a short loop, as explored in Fig. 3. Hotspots in known cancer genes (34,35) are colored blue. Hotspots in other genes are colored either red (<4) or gray (>4) by substrate optimality. Hotspots fall into two clear groups: Hotspots at APOBEC3A’s optimal substrates (gray) tend to be in genes unconnected to cancer; many of these are likely to be passenger hotspots. In contrast, hotspots at sites that are not APOBEC3A optimal substrates tend to be in known cancer driver genes. The exceptions (red) represent potential novel drivers. Conversely, MB21D2, currently annotated as a known cancer gene on the strength of a single highly recurrent mutational hotspot, may not play any role in driving cancer, instead merely harboring an APOBEC3A-driven passenger hotspot.
We next sought to test whether the putative passenger hotspots are indeed driven by A3A. We selected five of the most recurrently mutated TpC sites that are not in known cancer driver genes, plus the one in MB21D2, and tested them for the activities of different APOBEC enzymes in vitro. Five of these six sites are present in optimal A3A hairpins, whereas the sixth site (TBC1D12) is not. In vitro assays confirmed that all five of the sites in optimal hairpins were efficient A3A substrates, whereas the TBC1D12 site was a poor A3A substrate (fig. S11, A and B). Furthermore, the high prevalence of mutations at the five optimal hairpin sites correlated with A3A activity but not with A3B or A3H-I activities. If these passenger hotspot mutations arise from A3A substrate optimality, disrupting their structural features should specifically compromise A3A activity (but not A3B and A3H-I activities) at these sites. Indeed, disrupting the stems or optimal sequence contexts of C12orf43 and RARS2 reduced A3A activity (fig. S11, C and D). In contrast, the A3B and A3H-I activities on these sites were generally unchanged or even increased. Notably, the high mutation frequency at the TBC1D12 site did not correlate with A3A activity, which suggests that it arises from a different mechanism and/or through selection as a mutation in a novel driver gene; this mutation has been implicated in impacting the choice of start codon in translation (36).
Discussion
Although cancer genomes have been extensively analyzed at the small and large genomic scales, less is known about the mutational landscape of tumors at the mesoscale. Because mesoscale mutational processes can target unique stretches of DNA that occur infrequently in the genome, they can lead to individual base pairs becoming recurrently mutated across many patients, imitating the effects of functional selection, and masquerading as driver hotspots. Using APOBEC-signature mutations as an example, we have shown that DNA stem-loops, a mesoscale genomic feature, are associated with recurrence of mutations outside of known cancer drivers. This finding not only challenges the presumption that recurrent mutations must be drivers, but also highlights the importance of incorporating mesoscale features into the analysis of cancer genomes.
Guided by our systematic biochemical analysis of the substrate preference of APOBEC, we identified a large set of highly recurrent APOBEC mutational hotspots at optimal stem-loop structures in genes unconnected to cancer (as well as many outside genic regions). Some may be “passenger hotspots,” contributing no advantage to cancer cells but observed at high frequency because of the ease with which they are generated. Statistical approaches for identifying driver genes need to carefully consider this possibility. For example, MB21D2, currently considered a cancer driver gene on the strength of its Gln311 hotspot, is frequently altered by either Gln311 → Glu (Q311E) missense mutations or Q311X nonsense mutations, which result from C→G or C→T mutations (both consistent with APOBEC activity) at the same TpC site. Our results indicate that this site is a highly optimal A3A substrate, with a mutation frequency of 39× (relative to the nohairpin baseline), nominating it as a passenger hotspot. Although MB21D2 may not be a cancer driver gene, its recurrent Q311E mutation may, like other passenger mutations, be a potent neoantigen (37). A number of additional highly optimal A3A hotspots have recently been nominated as novel cancer drivers on the basis of mesoscale-naïve statistical analyses—for example, NUP93 E14K (3) and C3orf70 S6L/W/X (3,38). These sites have respective mutation frequencies of 38× and 12× above the no-hairpin baseline, which suggests that they may be passenger hotspots, and their being observed as recurrently mutated across patients is likely due to substrate optimality, not functional selection. Thus, a mesoscale genomic feature can help to distinguish recurrent passengers from drivers.
Notably, many APOBEC-signature mutations in driver genes are not in optimal hairpins. In these cases, the recurrence of APOBEC mutations is likely driven by functional selection, not by A3A substrate optimality. Multiple mutagenic mechanisms, including A3A, A3B, and other mutational processes, may contribute to these driver mutations. In addition to the known drivers, recurrent nonhairpin APOBEC mutations were found in the genes encoding the guanosine triphosphatase (GTPase) TBC1D12 (36), the retinoid receptor RXRA (39), the aryl hydrocarbon receptor AHR (40), the ubiquitin ligase CUL1 (41), the transcriptional activator KLF5 (42), and the RAS-related GTPase RHOB (43), which suggests that these may be novel drivers. This illustrates how a mesoscale genomic feature can help to distinguish drivers from recurrent passengers.
Although the most highly recurrent driver genes have likely been discovered, it is expected that many more cancer drivers are rare and remain unknown (44). Given that a comprehensive catalog of all drivers is essential, both for our understanding of tumorigenesis and the interpretation of clinical data, devising the most efficient strategy for the discovery of cancer driver genes and functionally relevant mutations is crucial. We anticipate that other cryptic variations in mesoscale mutation frequency remain to be discovered (45–47) and, together with new mathematical models (48), will further improve our ability to distinguish driver hotspots from passenger hotspots.
Materials and methods
Cell culture
HEK-293T was maintained in Dulbecco’s modified Eagle’s medium (DMEM) supplemented with 10% fetal bovine serum (FBS) and 1% penicillin/streptomycin.
Plasmids
APOBEC3A, APOBEC3B, and APOBEC3H-I cDNA were synthesized by GenScript with a β-globin intron and a Flag tag in C terminus. The plasmids expressing GFP-APOBEC3A-Flag, GFP-APOBEC3B-Flag, or GFP-APOBEC3H-Flag were generated by inserting the cDNA into the pcDNA-DEST53 vector (Gateway Cloning System, Thermo Fisher Scientific). The plasmids expressing APOBEC3A-Flag or APOBEC3B-Flag were generated by inserting the cDNA into the pBABE vector (Gateway Cloning System, Thermo Fisher Scientific). The catalytically dead mutants APOBEC3A-E72A, APOBEC3B-E68A/E255A, and APOBEC3H-I-E56A were constructed by site-directed mutation.
Antibodies
The antibodies used in this study were GAPDH polyclonal antibody (EMD Millipore), GFP polyclonal antibody (Thermo Fisher Scientific), and Flag-M2 monoclonal antibody (Sigma-Aldrich).
Cell extracts
The A3A deamination assays were performed with cell extracts derived from HEK-293T cells transiently expressing A3A, A3B, or A3H-I as described (26,49). Cells were lysed in 25 mM HEPES (pH 7.9), 10% glycerol, 150 mM NaCl, 0.5% Triton X-100, 1 mM EDTA, 1 mM MgCl2, RNase A (0.2 ¼g/ml), 1 mM ZnCl2 and protease inhibitors. Cell lysates were sonicated, incubated for 30 min at 4°C, and then centrifuged 10 min at 13,000 rpm at 4°C. Protein concentration of the supernatant was determined by Bradford assay (Bio-Rad).
APOBEC purification
The deamination assays were performed with A3A, A3B, or A3H-I purified from transfected HEK-293T cells as described (28). A3A-, A3B-, or A3H-I-expressing cells were collected and resuspended in lysis buffer [50 mM Tris-HCl (pH 7.5), 150 mM NaCl, 1 mM EDTA, and 0.5% Igepal] containing protease inhibitors (P8340, Sigma) and phosphatase inhibitors [NaF (5 mM) and Na3VO4 (1 mM)], incubated for 5 min on ice, and lysed by sonication. Insoluble material was removed by high-speed centrifugation (13,000 rpm at 4°C). RNase A (0.2 mg/ml) was added and incubated for 30 min at 4°C and insoluble material was removed by high-speed centrifugation (13,000 rpm at 4°C). Then, 50 ¼l of M2 anti-Flag affinity gel (Thermo Fisher Scientific) was added to the soluble extract for 2 hours 30 min at 4°C. The beads were then washed three times with washing buffer (50 mM Tris-HCl, pH 7.5,350 mM NaCl, 2 mM EDTA, and 0.5% Igepal) followed by two additional washes with elution buffer [25 mM HEPES (pH 7.9), 10% glycerol, 150 mM NaCl, 1 mM EDTA, 1 mM MgCl2, 1 mM ZnCl2]. Finally, A3A, A3B, or A3H-I was eluted in 200 ¼l of elution buffer containing 3×Flag peptide (500 ¼g/ml) for 2 hours at 4°C. A3A, A3B, or A3H-I purification was validated by silver staining and by Western blotting. Purified A3H-I was aliquoted and stored at −80°C.
DNA deaminase activity assay
The deamination assays were performed as described (26,49). Reactions (50 μl) containing 8 μl of a normalized amount of cell extracts (expressing A3A, A3B, or A3H-I) or purified proteins were incubated at 37°C during the indicated time in a reaction buffer (42 μl) containing a DNA oligonucleotide [20 pmol of DNA oligonucleotide, 50 mM Tris (pH 7.5), 1.5 units of uracil DNA glycosylase (New England BioLabs), RNase A (0.1 ¼g/ml), and 10 mM EDTA] followed by 40 min at 95°C. Formamide was added to the reaction (50% final) and the reaction was incubated at 95°C for 10 min followed by 5 min at 4°C. DNA cleavage was monitored on a 20% denaturing acrylamide gel (8 M urea, 1× TAE buffer) and run at 60°C for 80 min at 150 V. In addition, indicated samples were loaded on a 20% native-PAGE acrylamide gel (1× TAE buffer) using a sample loading buffer (25% glycerol) and run for 120 min at 150 V. DNA oligonucleotide probes were synthetized by Thermo Fisher Scientific. See (33) for sequences of DNA oligonucleotide probes.
Exonuclease T degradation assay
The exonuclease T degradation assays were performed as described by the manufacturer (New England BioLabs). Reactions (20 ¼l) containing 1 ¼M of DNA and indicated concentration of Exo T were incubated for 30 min at 25°C in a reaction buffer (20 mM Tris-Ac pH 7.9, 50 mM KAc, 10 mM MgCl2, 1 mM DTT) followed by 10 min at 95°C. DNA degradation was monitored on a 20% denaturing acrylamide gel (8 M urea, 1× TAE buffer) and run at 60°C for 100 min at 160 V.
Bioinformatic analyses
Mutation calls from WXS were obtained from the TCGA Unified Ensemble “MC3” Call Set (50), the public, open-access dataset of somatic mutation calls produced by the MC3 calling effort (“Multi-Center Mutation Calling in Multiple Cancers”), downloaded from www.synapse.org/#!Synapse:syn7214402/wiki/405297. (The results here are in whole or part based on data generated by the TCGA Research Network, http://cancergenome.nih.gov/, as outlined in the TCGA publications guidelines, http://cancergenome.nih.gov/publications/publicationguidelines.)
Following the filtering procedure that was used for the PanCanAtlas project, the MC3 dataset was filtered to include only “PASS” variants, which removes patients that were subjected to whole-genome amplification (WGA), as well as the acute myeloid leukemia (LAML) cohort. This yielded a final cohort of 9023 patients covering 32 tumor types. Mutation calls from WGS were combined from TCGA and other projects (1, 2, 4,13,15), restricting to somatic single-nucleotide variants (SSNVs) and excluding patients with fewer than 500 SSNVs in the genome, yielding a final WGS dataset comprising 1686 unique patients spanning 27 tumor types.
Mutations were analyzed by non-negative matrix factorization (NMF) as described (1,4,5), usingk = 8. NMF discovered a set of signatures corresponding to known mutational processes associated with (i) APOBEC enzyme activity; (ii) UV radiation exposure; (iii) POLE proofreading loss; (iv) MSI, microsatellite instability due to loss of mismatch repair; (v) tobacco smoking; (vi) ESO, a mutational process of unknown etiology first observed in esophageal cancer; (vii) normal cellular aging, associated with spontaneous deamination of methylated cytosines in CpG dinucleotides; and (viii) BRCA, a relatively “flat” signature associated with loss of homologous recombination repair.
A quantitative model of hairpin loop TpC mutation frequency was constructed by binning hairpins according to the following characteristics: stem strength (computed as 3 times the number of G-C base pairs plus the number of A-T base pairs), loop size (3 to 11 nt), TpC positioning within the loop (ranging from 1 to loop size), and the identity of the nucleotides directly preceding and following the TpC site. For each bin, the number of sites in the genome matching its parameters was determined, and the number of observed mutations in the APOBEC+ cohort was tallied. This provided a denominator and numerator for computing mutation frequency, which was then normalized to the “no-hairpin” baseline to provide a relative mutation frequency. See (33) for full details.
Supplementary Material
ACKNOWLEDGMENTS
We thank H. D. Nguyen and J. Sullivan for technical assistance; J. Hess and other members of the Zou, Lawrence, Benes, Getz, and Dyson laboratories for helpful discussions; and anonymous reviewers for constructive suggestions.
Funding: Supported by NIH Pathway to Independence Award 1K99CA212154 (R.B.), NIH grants GM076388 and CA197779 (L.Z.), and MGH CCR startup funds (M.S.L.).
Footnotes
Competing interests: L.Z. has consulted for EMD Serono.
Data and materials availability: Code used in data analysis has been deposited at the following links: http://github.com/alangenb/apobec and http://doi.org/10.5281/zenodo.2594090.
REFERENCES AND NOTES
- 1.Lawrence MS et al. , Mutational heterogeneity in cancer and the search for new cancer-associated genes. Nature 499, 214–218 (2013). doi: 10.1038/nature12213; [DOI] [PMC free article] [PubMed] [Google Scholar]
- 2.Lawrence MS et al. , Discovery and saturation analysis of cancer genes across 21 tumour types. Nature 505, 495–501 (2014). doi: 10.1038/nature12912; [DOI] [PMC free article] [PubMed] [Google Scholar]
- 3.Chang MT et al. , Identifying recurrent mutations in cancer reveals widespread lineage diversity and mutational specificity. Nat. Biotechnol 34, 155–163 (2016). doi: 10.1038/nbt.3391; [DOI] [PMC free article] [PubMed] [Google Scholar]
- 4.Alexandrov LB et al. , Signatures of mutational processes in human cancer. Nature 500, 415–421 (2013). doi: 10.1038/nature12477; [DOI] [PMC free article] [PubMed] [Google Scholar]
- 5.Nik-Zainal S et al. , Mutational processes molding the genomes of 21 breast cancers. Cell 149, 979–993 (2012). doi: 10.1016/j.cell.2012.04.024; [DOI] [PMC free article] [PubMed] [Google Scholar]
- 6.Dixon JR, Gorkin DU, Ren B, Chromatin Domains: The Unit of Chromosome Organization. Mol. Cell 62, 668–680 (2016). doi: 10.1016/j.molcel.2016.05.018; [DOI] [PMC free article] [PubMed] [Google Scholar]
- 7.Lieberman-Aiden E et al. , Comprehensive mapping of long-range interactions reveals folding principles of the human genome. Science 326, 289–293 (2009). doi: 10.1126/science.1181369; [DOI] [PMC free article] [PubMed] [Google Scholar]
- 8.Stamatoyannopoulos JA et al. , Human mutation rate associated with DNA replication timing. Nat. Genet 41, 393–395 (2009). doi: 10.1038/ng.363; [DOI] [PMC free article] [PubMed] [Google Scholar]
- 9.Hodgkinson A, Eyre-Walker A, Variation in the mutation rate across mammalian genomes. Nat. Rev. Genet 12, 756–766 (2011). doi: 10.1038/nrg3098; [DOI] [PubMed] [Google Scholar]
- 10.Pich O et al. , Somatic and Germline Mutation Periodicity Follow the Orientation of the DNA Minor Groove around Nucleosomes. Cell 175, 1074–1087. e18 (2018). doi: 10.1016/j.cell.2018.10.004; [DOI] [PubMed] [Google Scholar]
- 11.Sabarinathan R, Mularoni L, Deu-Pons J, Gonzalez-Perez A, Lopez-Bigas N, Nucleotide excision repair is impaired by binding of transcription factors to DNA. Nature 532, 264–267 (2016). doi: 10.1038/nature17661; [DOI] [PubMed] [Google Scholar]
- 12.Georgakopoulos-Soares I, Morganella S, Jain N, Hemberg M, Nik-Zainal S, Noncanonical secondary structures arising from non-B DNA motifs are determinants of mutagenesis. Genome Res. 28, 1264–1271 (2018). doi: 10.1101/gr.231688.117; [DOI] [PMC free article] [PubMed] [Google Scholar]
- 13.Nik-Zainal S et al. , Landscape of somatic mutations in 560 breast cancer whole-genome sequences. Nature 534, 47–54 (2016). doi: 10.1038/nature17676; [DOI] [PMC free article] [PubMed] [Google Scholar]
- 14.Zou X et al. , Short inverted repeats contribute to localized mutability in human somatic cells. Nucleic Acids Res. 45, 11213–11221 (2017). doi: 10.1093/nar/gkx731; [DOI] [PMC free article] [PubMed] [Google Scholar]
- 15.Haradhvala NJ et al. , Mutational Strand Asymmetries in Cancer Genomes Reveal Mechanisms of DNA Damage and Repair. Cell 164, 538–549 (2016). doi: 10.1016/j.cell.2015.12.050; [DOI] [PMC free article] [PubMed] [Google Scholar]
- 16.Hoopes JI et al. , APOBEC3A and APOBEC3B Preferentially Deaminate the Lagging Strand Template during DNA Replication. Cell Rep. 14, 1273–1282 (2016). doi: 10.1016/j.celrep.2016.01.021; [DOI] [PMC free article] [PubMed] [Google Scholar]
- 17.Seplyarskiy VB et al. , APOBEC-induced mutations in human cancers are strongly enriched on the lagging DNA strand during replication. Genome Res. 26, 174–182 (2016). doi: 10.1101/gr.197046.115; [DOI] [PMC free article] [PubMed] [Google Scholar]
- 18.Chen CL et al. , Impact of replication timing on non-CpG and CpG substitution rates in mammalian genomes. Genome Res. 20, 447–457 (2010). doi: 10.1101/gr.098947.109; [DOI] [PMC free article] [PubMed] [Google Scholar]
- 19.Barretina J et al. , The Cancer Cell Line Encyclopedia enables predictive modelling of anticancer drug sensitivity. Nature 483, 603–607 (2012). doi: 10.1038/nature11003; [DOI] [PMC free article] [PubMed] [Google Scholar]
- 20.Bischerour J, Chalmers R, Base-flipping dynamics in a DNA hairpin processing reaction. Nucleic Acids Res. 35, 2584–2595 (2007). doi: 10.1093/nar/gkm186; [DOI] [PMC free article] [PubMed] [Google Scholar]
- 21.SantaLucia J Jr.., A unified view of polymer, dumbbell, and oligonucleotide DNA nearest-neighbor thermodynamics. Proc. Natl. Acad. Sci. U.S.A 95, 1460–1465 (1998). doi: 10.1073/pnas.95.4.1460; [DOI] [PMC free article] [PubMed] [Google Scholar]
- 22.Sharma S, Baysal BE, Stem-loop structure preference for site-specific RNA editing by APOBEC3A and APOBEC3G. PeerJ 5, e4136 (2017). doi: 10.7717/peerj.4136; [DOI] [PMC free article] [PubMed] [Google Scholar]
- 23.Roberts SA et al. , An APOBEC cytidine deaminase mutagenesis pattern is widespread in human cancers. Nat. Genet 45, 970–976 (2013). doi: 10.1038/ng.2702; [DOI] [PMC free article] [PubMed] [Google Scholar]
- 24.Leonard B et al. , APOBEC3B upregulation and genomic mutation patterns in serous ovarian carcinoma. Cancer Res. 73, 7222–7231 (2013). doi: 10.1158/0008-5472.CAN-13-1753; [DOI] [PMC free article] [PubMed] [Google Scholar]
- 25.Chan K et al. , An APOBEC3A hypermutation signature is distinguishable from the signature of background mutagenesis by APOBEC3B in human cancers. Nat. Genet 47, 1067–1072 (2015). doi: 10.1038/ng.3378; [DOI] [PMC free article] [PubMed] [Google Scholar]
- 26.Burns MB et al. , APOBEC3B is an enzymatic source of mutation in breast cancer. Nature 494, 366–370 (2013). doi: 10.1038/nature11881; [DOI] [PMC free article] [PubMed] [Google Scholar]
- 27.Burns MB, Temiz NA, Harris RS, Evidence for APOBEC3B mutagenesis in multiple human cancers. Nat. Genet 45, 977–983 (2013). doi: 10.1038/ng.2701; [DOI] [PMC free article] [PubMed] [Google Scholar]
- 28.Starrett GJ et al. , The DNA cytosine deaminase APOBEC3H haplotype I likely contributes to breast and lung cancer mutagenesis. Nat. Commun 7, 12918 (2016). doi: 10.1038/ncomms12918; [DOI] [PMC free article] [PubMed] [Google Scholar]
- 29.Gansmo LB et al. , APOBEC3A/B deletion polymorphism and cancer risk. Carcinogenesis 39, 118–124 (2018). doi: 10.1093/carcin/bgx131; [DOI] [PMC free article] [PubMed] [Google Scholar]
- 30.Silvas TV et al. , Substrate sequence selectivity of APOBEC3A implicates intra-DNA interactions. Sci. Rep 8, 7511 (2018). doi: 10.1038/s41598-018-25881-z; [DOI] [PMC free article] [PubMed] [Google Scholar]
- 31.Shi K et al. , Structural basis for targeted DNA cytosine deamination and mutagenesis by APOBEC3A and APOBEC3B. Nat. Struct. Mol. Biol 24, 131–139 (2017). doi: 10.1038/nsmb.3344; [DOI] [PMC free article] [PubMed] [Google Scholar]
- 32.Kouno T et al. , Crystal structure of APOBEC3A bound to single-stranded DNA reveals structural basis for cytidine deamination and specificity. Nat. Commun 8, 15024 (2017). doi: 10.1038/ncomms15024; [DOI] [PMC free article] [PubMed] [Google Scholar]
- 33.See supplementary materials.
- 34.Sondka Z et al. , The COSMIC Cancer Gene Census: Describing genetic dysfunction across all human cancers. Nat. Rev. Cancer 18, 696–705 (2018). doi: 10.1038/s41568-018-0060-1; [DOI] [PMC free article] [PubMed] [Google Scholar]
- 35.“Known cancer genes” are defined as those listed in the Sanger Institute’s Cancer Gene Census, the latest version of which (Census_allTue Mar 5 12_59_32 2019.tsv) was downloaded on 3 March 2019 from. https://cancer.sanger.ac.uk/cosmic/census/all?home=y&name=all&export=tsv.;
- 36.Rheinbay E et al. , Recurrent and functional regulatory mutations in breast cancer. Nature 547, 55–60 (2017). doi: 10.1038/nature22992; [DOI] [PMC free article] [PubMed] [Google Scholar]
- 37.Campbell JD et al. , Distinct patterns of somatic genome alterations in lung adenocarcinomas and squamous cell carcinomas. Nat. Genet 48, 607–616 (2016). doi: 10.1038/ng.3564; [DOI] [PMC free article] [PubMed] [Google Scholar]
- 38.Martincorena I et al. , Universal Patterns of Selection in Cancer and Somatic Tissues. Cell 171, 1029–1041. e21 (2017). doi: 10.1016/j.cell.2017.09.042; [DOI] [PMC free article] [PubMed] [Google Scholar]
- 39.Halstead AM et al. , Bladder-cancer-associated mutations in RXRA activate peroxisome proliferator-activated receptors to drive urothelial proliferation. eLife 6, e30862 (2017). doi: 10.7554/eLife.30862; [DOI] [PMC free article] [PubMed] [Google Scholar]
- 40.Xue P, Fu J, Zhou Y, The Aryl Hydrocarbon Receptor and Tumor Immunity. Front. Immunol 9, 286 (2018). doi: 10.3389/fimmu.2018.00286; [DOI] [PMC free article] [PubMed] [Google Scholar]
- 41.Wang W et al. , Synergistic role of Cul1 and c-Myc: Prognostic and predictive biomarkers in colorectal cancer. Oncol. Rep 38, 245–252 (2017). doi: 10.3892/or.2017.5671; [DOI] [PubMed] [Google Scholar]
- 42.Ma D et al. , KLF5 promotes cervical cancer proliferation, migration and invasion in a manner partly dependent on TNFRSF11a expression. Sci. Rep 7,15683 (2017). doi: 10.1038/s41598-017-15979-1; [DOI] [PMC free article] [PubMed] [Google Scholar]
- 43.Calvayrac O et al. , The RAS-related GTPase RHOB confers resistance to EGFR-tyrosine kinase inhibitors in non-small-cell lung cancer via an AKT-dependent mechanism. EMBO Mol. Med 9, 238–250 (2017). doi: 10.15252/emmm.201606646; [DOI] [PMC free article] [PubMed] [Google Scholar]
- 44.Garraway LA, Lander ES, Lessons from the cancer genome. Cell 153, 17–37 (2013). doi: 10.1016/j.cell.2013.03.002; [DOI] [PubMed] [Google Scholar]
- 45.Eyre-Walker A, Eyre-Walker YC, How much of the variation in the mutation rate along the human genome can be explained? G3 4, 1667–1670 (2014). doi: 10.1534/g3.114.012849; [DOI] [PMC free article] [PubMed] [Google Scholar]
- 46.Hodgkinson A, Eyre-Walker A, The genomic distribution and local context of coincident SNPs in human and chimpanzee. Genome Biol. Evol. 2, 547–557 (2010). doi: 10.1093/gbe/evq039; [DOI] [PMC free article] [PubMed] [Google Scholar]
- 47.Hodgkinson A, Ladoukakis E, Eyre-Walker A, Cryptic variation in the human mutation rate. PLOS Biol. 7, e1000027 (2009). doi: 10.1371/journal.pbio.1000027; [DOI] [PMC free article] [PubMed] [Google Scholar]
- 48.Hess JM et al. , Passenger Hotspot Mutations in Cancer. bioRxiv 675801 [preprint]. 19 June 2019. [DOI] [PMC free article] [PubMed] [Google Scholar]
- 49.Stenglein MD, Burns MB, Li M, Lengyel J, Harris RS, APOBEC3 proteins mediate the clearance of foreign DNA from human cells. Nat. Struct. Mol. Biol 17, 222–229 (2010). doi: 10.1038/nsmb.1744; [DOI] [PMC free article] [PubMed] [Google Scholar]
- 50.Ellrott K et al. , Scalable Open Science Approach for Mutation Calling of Tumor Exomes Using Multiple Genomic Pipelines. Cell Syst. 6, 271–281. e7 (2018). doi: 10.1016/j.cels.2018.03.002; [DOI] [PMC free article] [PubMed] [Google Scholar]
Associated Data
This section collects any data citations, data availability statements, or supplementary materials included in this article.