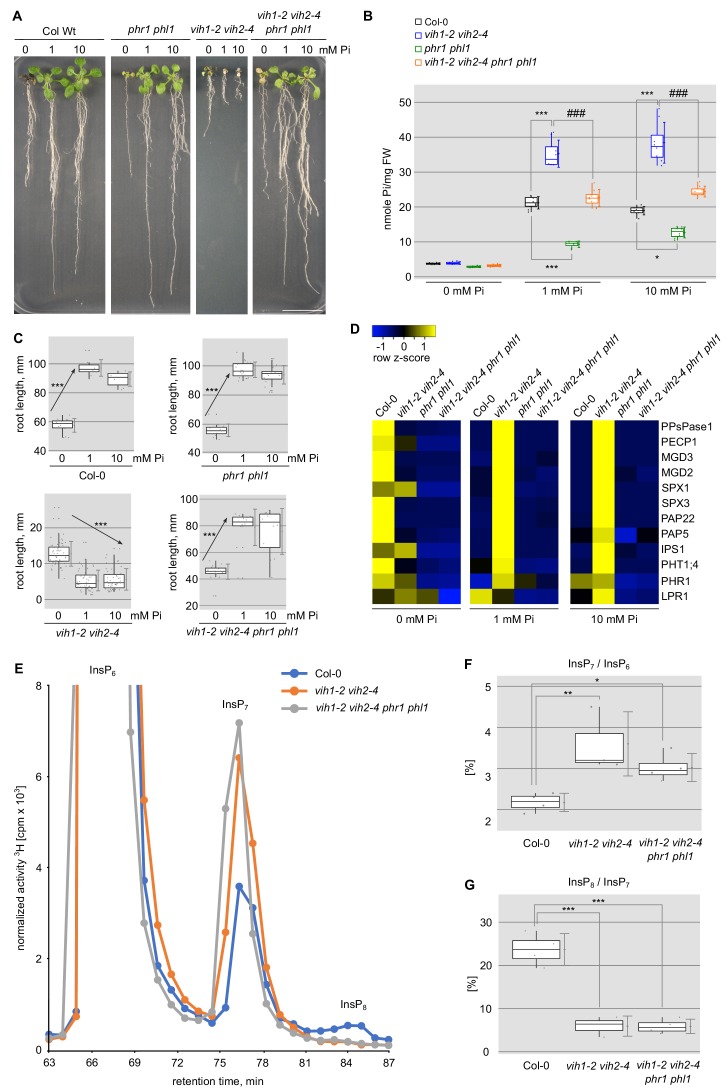
Figure 3. Deletion of PHR1 and PHL1 rescues vih1-2 vih2-4 growth phenotypes.
(A) Growth phenotype of Col-0, phr1 phl1, vih1-2 vih2-4, and vih1-2 vih2-4 phr1 phl1 seedlings grown in different Pi conditions. Seedlings 7 DAG were transplanted from 1/2MS plates to Pi-deficient 1/2MS liquid supplemented with 0 mM, 1 mM or 10 mM Pi, and grown for additional 6 d. (B) Cellular Pi content of seedlings 14 DAG described in (A). For each Pi concentration, at least four independent plants were measured with two technical replicates each. (C) Root length of seedlings 14 DAG described in (A). For each Pi concentration, seedlings from at least three independent plates were analyzed. (D) qRT-PCR quantification of the PSI marker genes in seedlings shown in (A). Expression levels are represented as Z-scores. The original data of qRT-PCR are shown in Supplementary file 3c. (E) Normalized HPLC profiles of [3H] inositol-labeled Col-0 (blue line), vih1-2 vih2-4 double mutant (orange line) and vih1-2 vih2-4 phr1 phl1 quadruple mutant (gray line). The InsP6, InsP7 and InsP8 regions are shown (termed as such, as specific PP-InsP5/(PP)2-InsP4 regioisomers cannot be resolved using this method). Fractions were collected each minute (solid dots) for radioactivity determination. The experiment was repeated at least three times with similar results, and representative profiles from one experiment are shown. The InsP7 / InsP6 ratio is plotted in (F) and the InsP8 / InsP7 ratio in (G).


