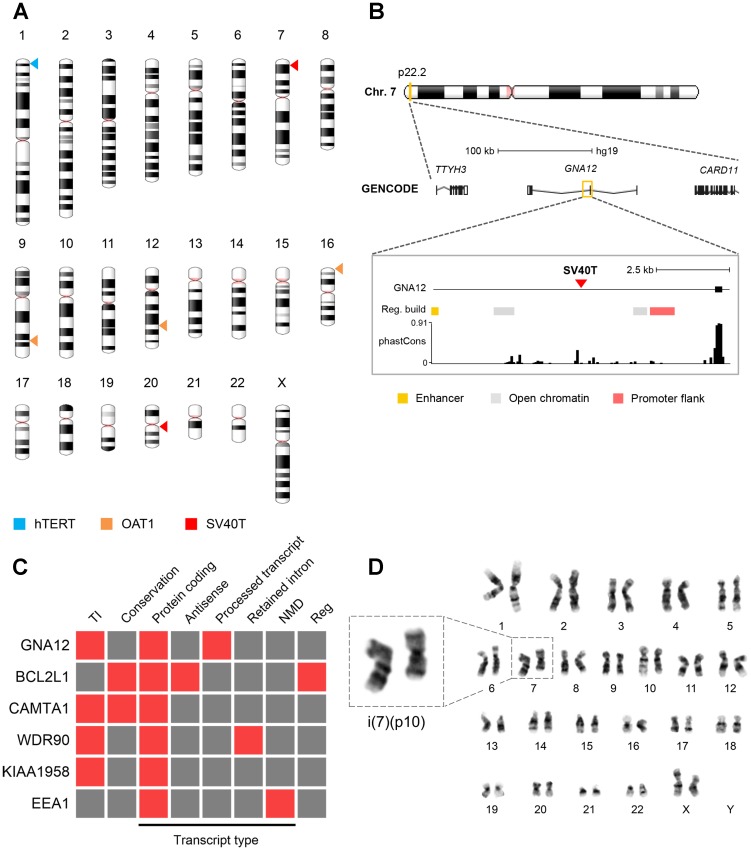
Figure 5. Viral integration sites and chromosomal stability.
(A) Chromosomal distribution of the viral integration sites of the SV40T, hTERT and OAT1 transgenes. (B) Schematic representation of the integration of SV40T gene into GNA12. See Supplementary Figures 2–4 for schematic representation of remaining affected genes. Gene legend: untranslated region (empty box), exon (filled box), intron (line). (C) Functional consequence prediction of the viral integration sites. Presence and absence of a specific feature is shown in red and grey, respectively. Legend: TI = transcriptional interference, NMD = nonsense-mediated decay, reg = regulatory features. The phastCons P100 database was used to identify evolutionary conserved regions. (D) Cytogenetic analysis of ciPTEC-OAT1 at passage number 52. Representative female karyotype of a diploid cell showing an isochromosome for the short arm of chromosome 7.

