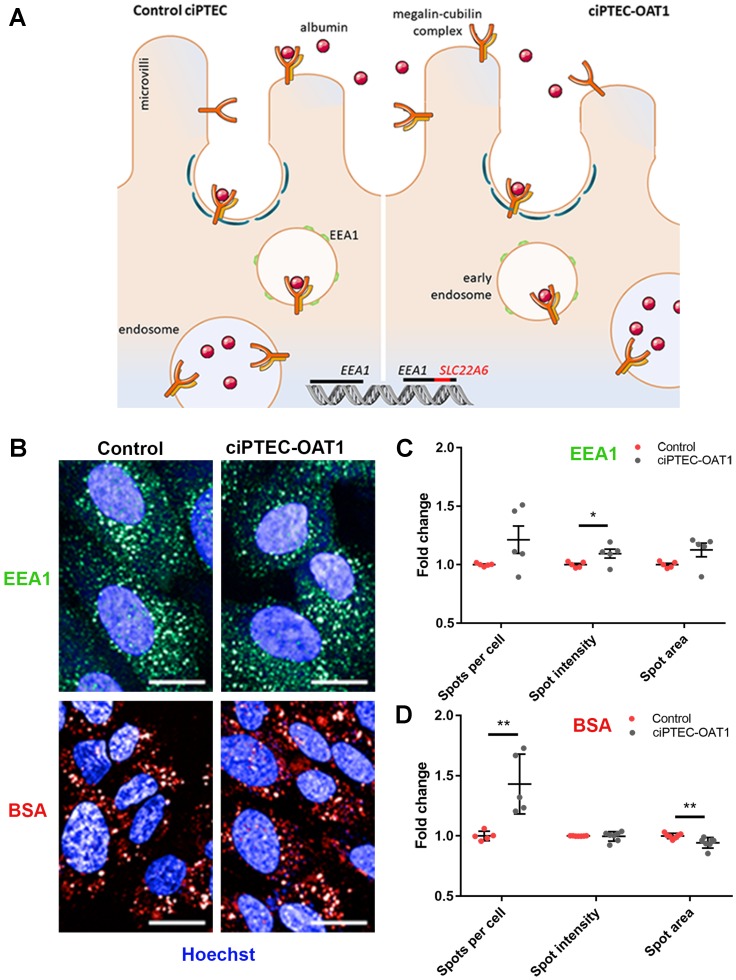
Figure 6. Endocytotic capacity of ciPTEC-OAT1.
(A) Schematic representation of receptor-mediated endocytosis of albumin by control ciPTEC and ciPTEC-OAT1, showing the integration of OAT1-encoding gene (SLC22A6) within EEA1. (B) Representative immunofluorescence images of EEA1 expression and endocytotic uptake of Alexa Fluor 647 labelled bovine serum albumin (BSA). Scale bars denote 20 μm. Quantification of the (C) EEA1 expression and (D) BSA uptake by ciPTEC-OAT1 compared to control (parent ciPTEC). Values are normalized against control and expressed as the mean ± SEM of three independent experiments performed in triplicate. * p < 0.05, ** p < 0.01 (unpaired two-tailed Student’s t-test).

