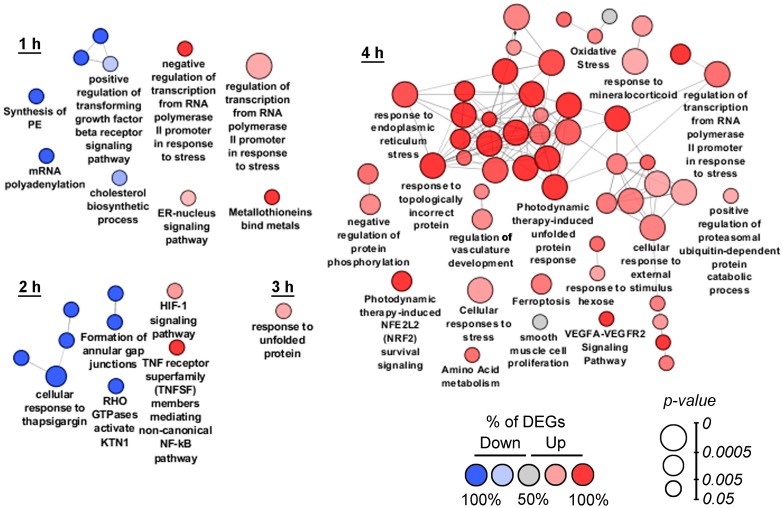
Figure 2. Functional analysis of DEGs detected at 1–4 h time points.
Enrichment for Gene Ontology (biological processes), KEGG, REACTOME and Wikipathways terms were performed using the ClueGO plugin in Cytoscape. Functionally grouped networks with terms as nodes were linked based on their kappa score. The labels of the most significant terms per groups are shown. The size and color of nodes represent the term enrichment significance and the percentage of down- and up-regulated DEGs (fold change > 1.5) in the functional term, respectively. Only pathways with p < 0.05 after Bonferroni step down correction for multiple testing were included in the networks. Functionally related groups partially overlap.

