

Abstract
In cystic fibrosis (CF) airways, the opportunistic pathogen Pseudomonas aeruginosa evolves from an acute to a chronic infection phenotype. Yet, the in vivo factors influencing the evolutionary trajectory of P. aeruginosa are poorly understood. This study aimed at understanding the role of the CF lung microbiome in P. aeruginosa evolution. Therefore, we investigated the in vitro biofilm evolution of an early CF P. aeruginosa isolate, AA2, in the presence or absence of a synthetic CF lung microbiome. Whole genome sequencing of evolved populations revealed mutations in quorum sensing (QS) genes (lasR, pqsR) with and without the microbiome. Phenotypic assays confirmed decreased production of the QS molecule 3-O-C12-homoserine lactone, and QS-regulated virulence factors pyocyanin and protease. Furthermore, a mixture of lasR and lasR pqsR mutants was found, in which double mutants showed less pyocyanin and protease production than lasR mutants. While the microbial community did not influence the production of the tested P. aeruginosa virulence factors, we observed a trend towards more mutations in the transcriptional regulators gntR and mexL when P. aeruginosa was grown alone. P. aeruginosa developed resistance to β-lactam antibiotics during evolution, when grown with and without the microbiome. In conclusion, in an experimental biofilm environment, the early P. aeruginosa CF isolate AA2 evolves towards a CF-like genotype and phenotype, and most studied evolutionary adaptations are not impacted by CF microbiome members.
Subject terms: Experimental evolution, Biofilms, Microbiome
Introduction
Pseudomonas aeruginosa is a Gram-negative, versatile, opportunistic pathogen that causes chronic lung infections in cystic fibrosis (CF) patients1–3. Because of its large genome – over 6 Mb and almost 6000 genes – it is able to quickly adapt to, and hence thrive in, different environments and stress conditions4,5. In the CF airways, a characteristic evolutionary adaption of P. aeruginosa is observed with a gradual transition from an ‘acute’ phenotype (characterized by motility, protease production, and type III secretion) to a ‘chronic’ phenotype (characterized by biofilm formation, decreased antibiotic susceptibility, loss of virulence factor production, altered pro-inflammatory effect, and hypermutability)5–12. This adaptation is thought to be due to a combination of selective pressures present in the CF lungs, i.e. viscous mucus, hyperinflammation, prolonged antibiotic treatment, the presence of bacteriophages and a complex microbial community4,7. Moreover, an intra-patient phenotypic diversity of P. aeruginosa isolates has been observed in CF patients13–16, which is possibly due to regional adaptation in the spatially heterogeneous lung environment5,17,18.
One of the key features of P. aeruginosa evolution in the CF lung is the emergence of mutations in the las quorum sensing (QS) system, which are associated with a loss in production of virulence factors, such as proteases and exotoxins19–21. QS in P. aeruginosa consists of multiple interrelated signalling circuits. There are three acyl-homoserine lactone responsive transcription factors, LasR, RhlR, and QscR; and a quinolone-responsive transcripton factor called PqsR. The las system sits at the top of this complex hierarchy22. Multiple other pathoadaptive mutations have also been associated with chronic P. aeruginosa infection, such as mutations in gacS, retS, rpoN, ampR, mexT and mucA5. During in vitro planktonic and biofilm evolution studies, mutations in the lasR gene, coding for the transcriptional regulator of the las QS system, have repeatedly been observed and these have been associated with increased antibiotic resistance8,23–26. However, most of these studies have focused solely on the evolution of P. aeruginosa in single culture, and do not take into account the complex bacterial community present in the CF airways in vivo27–29. This CF lung microbiome can contain various pathogens besides P. aeruginosa (e.g. Staphylococcus aureus, Haemophilus influenzae. Burkholderia cenocepacia, Achromobacter xylosoxidans, Streptococcus milleri group bacteria and Stenotrophomonas maltophilia) as well as other non-pathogenic bacteria (including Rothia mucilaginosa and Gemella haemolysans)28,30–32. However, whether the characteristic phenotypic and genotypic adaptation of P. aeruginosa in the course of chronic infection of the respiratory tract of people with CF, including hallmark mutations in the QS system, is influenced by the presence of this complex microbial community is unclear. This is of particular importance since the QS system is involved in the competitive behaviour of P. aeruginosa33,34. Production of many virulence factors, such as pyocyanin, hydrogen cyanide, elastase and rhamnolipids, that exert antimicrobial activity against other bacteria, are QS-regulated33,35–38. In addition, QS partially contributes to the regulation of siderophores (such as pyoverdine) that are important in competition for iron.
We performed a biofilm evolution study using the early CF P. aeruginosa isolate AA2. P. aeruginosa was cultured in vitro in a biofilm during 54 days (18 cycles of 72 h biofilm formation) in the absence and presence of a microbial community comprised of commonly isolated species in the CF lung. Whole genome sequencing (WGS) was performed to unravel genotypic differences and phenotypic tests were carried out to investigate changes in production of various virulence factors (i.e. phenazines, proteases, rhamnolipids), antibiotic susceptibility, growth, motility, and competitive behaviour. Furthermore, the pro-inflammatory response of human epithelial cells to evolved versus unevolved P. aeruginosa strains was examined in a differentiated 3-D lung epithelial cell model.
Materials and Methods
Bacterial strains and culturing conditions
Bacterial strains used are shown in Table S1 and were cultured on solid media as described before39. For the evolution study, liquid cultures of each bacterial strain were grown until stationary phase in BHI broth (37 °C, 250 rpm; Table S1). S. anginosus and G. haemolysans cultures were incubated in microaerophilic conditions (CampyGen Compact system, Thermo Fisher Scientific, USA).
For phenotypic testing and sequencing of evolved populations originating from the biofilm evolution experiment, an aliquot of the frozen biofilm (stored as glycerol stock at −80 °C) was plated on LB agar and incubated overnight at 37 °C. The entire growth on the agar plate was then divided into two Microbank cryovials with beads (Pro-Lab Diagnostics) and frozen at −80 °C. A single bead was then used to inoculate 5 ml LB broth (incubated at 37 °C, 250 rpm, 16 hours) to serve as inoculum for phenotypic tests and DNA extraction. These cultures are designated “evolved populations” throughout the text for the sake of clarity.
Biofilm evolution model set-up
A Multiscreen 96-well system (Millipore, Merck KGaA, Germany) consisting of a sterile filter plate with 0.22 µm PVDF filter membranes and a transport receiver plate (sterilized by 1 hour exposure to UV light) was used for biofilm formation of P. aeruginosa AA2 in the absence or presence of the other microbiome members (Fig. 1A). All bacterial suspensions were diluted in BHI medium supplemented with 2.5% lysed horse blood (BHI + LYS) (Biotrading, The Netherlands; lysed horse blood stock according to EUCAST protocol40). For the initiation of the evolution study (first cycle, T1), 100 µL of P. aeruginosa suspension (approx. 5 × 10⁶ CFUs of starting/unevolved culture) was transferred to the upper filter plate, and 300 µL of microbiome community culture (containing approx. 5 × 10⁶ CFUs of each strain, i.e. S. aureus, S. anginosus, A. xylosoxidans, R. mucilaginosa, and G. haemolysans) or 300 µL of medium (control) was transferred to the receiver plate. This way, no physical contact between P. aeruginosa and the other bacterial species occurred, yet medium containing soluble secreted products could migrate through the 0.22 µm low protein-binding filter. Then, cultures were incubated in microaerophilic conditions (±5% O2, ±15% CO2; CampyGen Compact system, Thermo Fisher Scientific) for 72 hours (3 days). After 3 days of culture, P. aeruginosa AA2 biofilm cells were removed from the filter plate. First, a wash step with physiological saline (PS; 0.9% [w/v] NaCl in MilliQ water) was performed after which two rounds of vortexing and sonication resulted in homogenized P. aeruginosa biofilm cells, as described before39. The colony forming units (CFU) in the biofilm were quantified by microdilution plating on LB agar. A fraction of the biofilm was stored at −80 °C (in PS containing a final concentration of 20% glycerol) until further genomic and phenotypic experiments were conducted. To initiate the second cycle and for each cycle hereafter (T2 – T18), the homogenized biofilm was diluted 1/40 in BHI + LYS (resulting in ±5 × 10⁶ CFUs) and transferred to the filter plate. The microbial community was added to the transport receiver plate as described above for the first cycle. This was repeated 18 cycli representing a total of 54 days. Three independent lineages were cultured in parallel which were started from three different P. aeruginosa AA2 stationary phase cultures; each lineage was cultured in the presence and absence of the microbiome members (Fig. 1B).
Figure 1.

Multiscreen evolution model set-up and experiment overview. (A) The bottom transport receiver plate was sterilized by exposure to UV-light and contained either medium (control condition) or a mixed bacterial community of S. aureus, S. anginosus, A. xylosoxidans, R. mucilaginosa, and G. haemolysans (microbiome condition). The sterile (0.22 µm PDFV) filter plate contained P. aeruginosa AA2 and was placed in the receiver plate, with the filters being emerged in the medium. A sterile lid secluded the set-up. (B) Pa AA2: P. aeruginosa AA2. Three independent overnight cultures were used to start three independent evolution samples = lineages (L1, L2, L3). For each lineage, P. aeruginosa biofilms were evolved in the absence (control) or presence of the CF microbial community (microbiome). Sa: S. aureus, Sag: S. anginosus, Ax: A. xylosoxidans, Rm: R. mucilaginosa, and Gh: G. haemolysans. T0 is the planktonic overnight culture at the start of the experiment, T1 (timepoint 1) is the P. aeruginosa biofilm (BF) obtained after 72 hours of microaerobic growth. 18 cycles of 72 hours ended in T18 (timepoint 18) after 54 days.
DNA extraction and sequencing
Genomic DNA extraction: glass-bead protocol
Genomic DNA was extracted from 2 mL planktonic stationary phase cultures of the unevolved strain (T0, initial culture) or evolved populations of P. aeruginosa AA2. After centrifugation, the pellet was resuspended in 200 µL TE buffer (10 mM Tris-HCl pH 8 + 1 mM EDTA pH 8). Of this, 100 µL was added to lysis tubes containing 500 µL acid-washed glass beads (Sigma-Aldrich, USA) and 500 µL lysis buffer (50 mM Tris-HCl pH 8, 70 mM EDTA pH 8, 1% sodium dodecyl sulfate) with 0.5 µg/mL pronase (Roche, Germany). After vortexing, the tubes were incubated at 37 °C for 1 hour and then pulse-spinned. Afterwards, 200 µL saturated ammonium acetate was added, vortexed again, and spinned for 2 minutes. 600 µL chloroform was added, the mixture was vortexed, and then centrifuged for 5 minutes to separate the phases. Then, 400 µL of the top aqueous phase was transferred to a new tube containing 1 mL 100% ethanol. This was mixed by inversion and centrifuged for 5 minutes. The supernatant was removed, washed with 70% ethanol, and air-dried. The resulting DNA was dissolved in low-EDTA-TE buffer (10 mM Tris-HCl pH 8 + 0.1 mM EDTA pH 8 + 0.5 µg/mL RNase A (Qiagen, Germany)) and the concentration measured using the BioDrop µLITE (Isogen Life Science, The Netherlands).
Whole genome sequencing (WGS) and bioinformatics analysis
WGS libraries were prepared with the NEBNext kit (New England Biolabs, Ipswich, USA) and sequenced on the Illumina Nextseq 500 platform (Oxford Genomics Center, University of Oxford, United Kingdom), yielding 5 to 9 million 150 bp paired end reads per sample. Demultiplexed raw reads were imported into CLC Genomics Workbench 11.0.1 (QIAGEN Bioinformatics, Aarhus, Denmark) for all further analysis steps. Reads were quality-trimmed (error probability limit 0.05, reads < 15 nt were discarded) and the input strain sample (T0) was de novo assembled (word size 22, bubble size 55, mismatch cost 2, insertion and deletion cost 2, length fraction 0.5, similarity fraction 0.8), generating 92 contigs (total length 6244190, N50 = 210536, max length 471773, average coverage 123.5). The RAST annotation engine41 was used to annotate the consensus sequence of contigs. The reads derived from the evolved populations were then mapped to all contigs, with cut-offs 0.5 for length fraction, and 0.8 for similarity fraction for mapped reads. Mapping parameters were: match score 1, mismatch cost 2, insertion and deletion cost 3. The Basic Variant Detection tool was used to detect single nucleotide polymorphisms (SNPs) with a minimum coverage of 10 and a minimum reference-to-variant ratio of 35%. Genes that were mutated in at least one sample at a frequency above 35% in T18 were then further analysed in T0, T1, T10 and T18 using the Low Frequency Variant Analysis tool of CLC Genomics Workbench at a frequency threshold of 2%. All SNPs were then manually screened for false positives in regions containing repetitive sequences or hairpins, which caused poor mapping, or for erroneous reads. The InDels and Structural Variants tool was used to detect insertions and deletions, with a p-value threshold of 0.0001. The output was manually screened on mapping patterns of un-aligned read ends and only entries with a single breakpoint and identical sequences in the un-aligned read ends were reported. The consensus sequence of the un-aligned read ends was then used to confirm the deletion or to identify the nature of the inserted sequence. The sequencing raw data is deposited at Array Express under accession number E-MTAB-7331.
Sanger sequencing
To verify mutations observed in the WGS data, Sanger sequencing of the lasR and pqsR genes of 10 isolates obtained from single colonies was performed. Two primer pairs (Table S2) that amplified 900–1200 base pair regions were designed targeting the mutated region identified by WGS. After PCR amplification, the amplicons were purified using the NucleoSpin Gel and PCR Clean-up kit (Macherey-Nagel, Germany) and sequenced at GATC Biotech (Eurofins Genomics, Germany). Resulting sequences were then inspected visually for specific mutations using the Chromas software program (Technelysium Pty Ltd, Australia).
Bacterial growth curves
To compare planktonic growth of all P. aeruginosa AA2 populations, liquid stationary phase cultures were diluted to approx. 5 × 10⁵ CFU/mL (based on OD590nm) in LB. Of each culture, 100 µL was transferred to a PVC 96-well plate (Thermo Fisher Scientific) in triplicate. The 96-well plate was incubated statically at 37 °C in the EnVision Multilabel Plate Reader (Perkin Elmer, USA) and OD590nm was measured every 30 min for 24 hours. After 24 hours, end-point cultures were diluted and plated on LB agar to determine the number of CFU.
Quantification of biofilm colony forming units and biomass
P. aeruginosa cultures were diluted in LB medium to OD590nm 0.08 (corresponding to ±5 × 10⁷ CFU/mL), where after 100 µL of each culture was transferred in triplicate to the wells of a flat PVC 96-well plate, and then incubated at 37 °C for 24 hours. Afterwards, biofilms were washed and harvested in PS by two cycles of vortexing (5 min, 900 rpm) and sonication (5 min; Branson Ultrasonic bath, Hach Company, USA). The resulting cell suspensions were diluted and plated on LB plates; after overnight incubation at 37 °C the number of CFU was determined. Biomass of biofilms was quantified by crystal violet staining as described previously42,43.
Antibiotic susceptibility testing
Minimal inhibitory concentrations (MIC) for ceftazidime (Sigma-Aldrich), aztreonam (TCI Europe), ciprofloxacin (Sigma-Aldrich), colistin (TCI Europe) and tobramycin (TCI Europe) were determined according to the EUCAST guidelines by the microdilution broth method as described elsewhere44,45.
Biofilm competition experiment
P. aeruginosa cultures were co-cultured with S. aureus for 24 hours. Both were diluted in LB medium to OD590nm 0.08 and 0.2 respectively, corresponding to ±5 × 10⁷ CFU/mL. 100 µL of mixed culture (50 µL of each) was transferred in triplicate to the wells of a flat PVC 96-well plate, and then incubated at 37 °C for 24 hours. Afterwards, the resulting biofilms were loosened and diluted as described above, and plated onto selective media to quantify the separate strains. P. aeruginosa and S. aureus were quantified on LB medium supplemented with 1.25 mg/L triclosan and LB medium supplemented with 7.5% NaCl respectively39.
Motility assays
Bacterial cultures were diluted to OD590nm = 1 after which three types of motility were tested by using media with different agar concentrations: swimming (0.3%), twitching (1.5%) and swarming (0.5%) as described before46. Briefly, for determination of swimming and swarming motility, 1 µL of bacterial culture was spotted on the surface of LB plates with 0.3% agar or 0.8% nutrient plates with 0.5% glucose and 0.5% agar respectively. For twitching motility, regular LB agar (1.5%) plates were stab-inoculated to the bottom of the petri dish with 1 µL of bacterial suspension. All plates were incubated at 37 °C for 48 hours after which bacterial migration diameters were measured for swimming and swarming. Twitching was visualized by crystal violet staining as previously described46.
Pyoverdine quantification
For pyoverdine quantification, overnight cultures were grown in LB, centrifuged, and the resulting supernatant filter-sterilized (0.22 µm). 100 µL of filtered supernatant was transferred to a flat PVC 96-well plate and absorbance at 405 nm was measured in the EnVision Multilabel Plate Reader, as previously described47.
Pyocyanin quantification
For pyocyanin quantification, liquid cultures were grown in LB broth for 24 hours in a shaking warm water bad (37 °C). Supernatants were collected after centrifugation and then filter-sterilized (0.22 µm Merck-Millipore filters). Afterwards, a chloroform-HCl extraction was performed to determine pyocyanin levels, as described previously48.
Rhamnolipid detection
Semi-quantitative detection of rhamnolipid production by all populations was assessed by inoculating 70 µL of bacterial suspension into wells cut out from minimal medium agar plates supplemented with 0.05 mg/L methylene blue and 2 mg/L cetyl trimethylammonium bromide (CTAB)49,50. Sizes of blue halos were measured after 48 hour incubation at 30 °C and incubation at 4 °C for 48 hours.
Quantification of protease activity
Overnight cultures were grown for 16 hours in LB. Cultures were centrifuged and the supernatant filter-sterilized, where after proteolytic activity was determined using an azocasein assay51,52.
Quantification of N-3-oxododecanoyl-L-homoserine lactone production
Homoserine lactone (HSL) signal molecules were first extracted using ethyl acetate as described previously53. Afterwards, 10 µL of concentrated HSL molecules was added to 100 µL overnight culture of Escherichia coli (stationary phase culture in LB; OD 0.3) containing the reporter plasmid pUCP22NotI-PlasB::gfp(ASV)Plac::lasR which expresses GFP (green fluorescent protein) in response to N-3-oxododecanoyl-L-homoserine lactone (3-O-C12-HSL)54,55. Cultures were incubated in a black 96-well plate for 24 hours at 37 °C and fluorescence was measured in the EnVision Multilabel Plate Reader. The increase in fluorescence over 24 hours is related to the amount of 3-O-C12-HSL present.
Quantification of epithelial cell viability
Cytotoxicity of the bacterial populations was assessed by infection of an in vivo-like 3-D alveolar epithelial cell culture model (A549 cell line)56–59 and quantified by staining with annexin V and propidium iodide, which allows to evaluate host cell apoptosis and necrosis (Alexa Fluor® 488 Annexin V/Dead Cell Apoptosis Kit, Thermo Fisher Scientific). On the day of infection, 3-D cell aggregates were transferred to a 48-well plate at a concentration of 2.5 × 10⁵ cells/well in GTSF-2 medium (Hyclone, USA) supplemented with 1.5 g/L sodium bicarbonate (Sigma-Aldrich) and 2.5 mg/L insulin transferring sodium selenite (Lonza). The bacterial suspension was then added to each well, to obtain a targeted MOI (multiplicity of infection) of 10:1. After 6 hours of infection, epithelial cells were washed with HBSS (Hank’s Balanced Salt Solution, Life Technologies, Thermo Fisher Scientific) and dissociated from the microcarrier bead scaffolds by incubation with 250 µL trypsin (0.25%, Life Technologies) for 3 minutes followed by thorough pipetting. The trypsinisation reaction was stopped by adding 250 µL GTSF-2 medium with 10% fetal bovine serum (FBS) (Life Technologies, Thermo Fisher Scientific). Cells were then harvested by centrifugation and subsequently stained by adding 5 µL Alexa Fluor® 488 annexin V and 2 µL propidium iodide (100 µg/mL), according to the manufacturer’s instructions. Viability of cells – differentiating between live, necrotic, and apoptotic cells – was analysed by flow cytometry (Attune NxT Flow Cytometer, Thermo Fisher Scientific), using excitation at 488 nm and measuring fluorescence emission at 530 nm and 575 nm for annexin V and PI, respectively.
Quantification of the NF-κB - mediated inflammatory response
The NF-κB – mediated inflammatory response was tested in the above described in vivo-like 3-D alveolar epithelial cell culture model, using NF-κB-luciferase-transfected A549 cells (BPS Bioscience, USA). Bacterial cultures and 3-D aggregates were diluted in the above-described cell culture medium to result in an MOI of 10:1 and transferred to a 48-well plate. After 4 hours of incubation, the supernatant was removed and the 3-D aggregates were transferred to a black PVC 96-well plate. The epithelial cells were then lysed and the luciferase substrate added using the ONE-Step Luciferase Assay system (BPS Bioscience) according to the manufacturer’s instructions. Luminescence was measured in the EnVision Multilabel Plate Reader.
Statistical analysis
Statistical analysis was performed in SPSS 24.0. Normality of the data was examined via the Shapiro-Wilk test. Normally distributed data were then assessed by an independent samples t-test or one-way ANOVA. Not normally distributed data were evaluated using a Mann-Whitney or Kruskal-Wallis non-parametric test. Statistical significance of data is assumed when p-values are ≤0.05.
Results
P. aeruginosa AA2 biofilm evolution model
Biofilms grown in the filter plate model (Fig. 1) were investigated at different time points (24 h, 48 h, 72 h) to determine how long it was possible to co-culture all microbiome members (i.e. without losing one or more). As all members of the CF synthetic microbiome remained present at the tested time points (Fig. S1), the 72 h co-culture time was selected.
At the end of each 72 h cycle (18 in total), P. aeruginosa AA2 biofilm cells were harvested directly from the filter plate and CFUs were immediately determined. For two out of three lineages (L1 and L3), a trend towards increased biofilm formation over time was observed, regardless of whether other species were present (Fig. S2). When pooling the data of the three lineages, a significant increase in biofilm formation was observed when comparing the first (T1) and last (T18) cycle, both in the presence and absence of the microbiome (p < 0.01) (Fig. S8A).
We also determined biofilm formation in a conventional PVC microtiter plate starting from preserved cultures of the unevolved strain (T0) or evolved populations (T1, T18) of P. aeruginosa AA2, using plating and crystal violet staining of biomass (Fig. S3). The evolved populations (T18) did not show significant increases in biofilm formation after 24 hours in LB. However, when pooling the data of the three lineages, a significant decrease in biofilm formation was observed between T1 and T18 (p < 0.01) both with and without the microbiome (Fig. S8B). Biomass was also significantly reduced in T18 compared to T1 for the pooled samples without the microbiome (p < 0.01) (Fig. S8C).
LasR and pqsR mutations occur in the presence and absence of the CF microbial community
At the beginning (T1), middle (T10) and at end of the evolution experiment (T18), WGS was performed for all evolved P. aeruginosa populations and these sequences were compared to that of the unevolved T0 strain (Table S3). Only six genes were found to be mutated at a frequency of ≥ 35% at T18 (Table 1) in at least one lineage, all of these were present in at least two lineages when the lower threshold for frequency was applied. Nine genes were mutated at < 35% frequency at T18 (Table S4), and none of these occurred in more than one lineage.
Table 1.
Whole genome sequencing data for evolved (T18) P. aeruginosa populations compared to the starting planktonic culture strain (T0).
| Sample name | Gene name | PA number | Mutation type | Nucleotides | Position (contig) nt |
Amino acids affected | Relative abundance (%) |
|---|---|---|---|---|---|---|---|
| T18 L1 C | lasR | PA1430 | Del | ΔG | (2) 294159 | K182RfsX27*a | 100 |
| pqsR | PA1003 |
In In |
+A transposase |
(11) 20879 (11) 20654 |
L98FfsX34 H173transpos*b |
81 5 |
|
| gntR | PA4132 |
SNP SNP SNP |
C → G A → C G → A |
(34) 41825 (34) 41176 (34) 40992 |
Y349X D133A V72M |
41 4 2 |
|
| mexL | PA3678 | SNP | G → A | (12) 221690 | A26T | 23 | |
| sahH | PA0432 | SNP | G → A | (1) 95660 | 297 nt upstream*c | 99 | |
| pilA | PA4525 | Del | CTACCA | (6) 118729 | T154_T155del | 97 | |
| T18 L1 M | lasR | PA1430 | Del | ΔG | (2) 294159 | K182RfsX27 | 100 |
| pqsR | PA1003 |
Del In Del |
ΔTTGAT + A ΔCGAGCTGACCGC |
(11) 20762 (11) 20879 (11) 21061 |
I136AfsX208 L98FfsX34 A34_S37del*d |
69 11 7 |
|
| sahH | PA0432 | SNP | G → A | (1) 95660 | 297 nt upstream | 56 | |
| pilA | PA4525 | Del | CTACCA | (6) 118729 | T154_T155del | 92 | |
| T18 L2 C | lasR | PA1430 | In | +A | (2) 294001 | S129KfsX104 | 94 |
| pqsR | PA1003 | SNP | C → T | (11) 20505 | D223H | 38 | |
| mexL | PA3678 |
duplication SNP SNP |
35 nt T → G C → A |
(12) 222153 (12) 221786 (12) 222105 |
E192GfsX0 F58T A164D |
24 17 12 |
|
| sahH | PA0432 | Del | ΔG | (1) 95633 | 271 nt upstream | 32 | |
| pilA | PA4525 | Del | CTACCA | (6) 118729 | T154_T155del | 98 | |
| T18 L2 M | lasR | PA1430 |
In Del |
+A ΔG |
(2) 294001 (2) 294159 |
K182RfsX27 |
59 31 |
| pqsR | PA1003 | SNP | A → T | (11) 21047 | L42Q | 59 | |
| pqsA-phnA | PA0996-PA1001 | Del | Δ(4618 nt) | (11) 13454–18072 |
V306(pqsA)_S2(phnA) del fsX69*e |
10 | |
| mexL | PA3678 | SNP | G → C | (12) 221695 | K27N | 23 | |
| pilA | PA4525 | Del | CTACCA | (6) 118729 | T154_T155del | 49 | |
| T18 L3 C | lasR | PA1430 |
In Del |
+A ΔG |
(2) 294001 (2) 294159 |
S129KfsX104 K182RfsX27 |
89 10 |
| pqsR | PA1003 |
In SNP |
+G T → G |
(11) 20642 (11) 20645 |
L178VfsX168 H176P |
74 9 |
|
| gntR | PA4132 |
SNP In In |
A → C + CTG + C |
(34) 41988 (34) 41357 (34) 40926 |
T404P L194_L195insL*f G52RfsX260 |
9 9 2 |
|
| mexL | PA3678 |
SNP SNP SNP |
T → G G → A G → T |
(12) 222042 (12) 221744 (12) 221842 |
M143R A44T Q76H |
46 9 6 |
|
| sahH | PA0432 | SNP | G → A | (1) 95660 | 297 nt upstream | 77 | |
| pilA | PA4525 | Del | CTACCA | (6) 118729 | T154_T155del | 87 | |
| T18 L3 M | lasR | PA1430 |
Del In |
ΔG + A |
(2) 294159 (2) 294001 |
K182RfsX27 S129KfsX104 |
89 12 |
| pqsR | PA1003 |
In Del |
transposase ΔAG |
(11) 21137 (11) 20400 |
F12transpos Y258TfsX131 |
33 5 |
|
| sahH | PA0432 | SNP | G → A | (1) 95660 | 297 nt upstream | 10 | |
| pilA | PA4525 | Del | CTACCA | (6) 118729 | T154_T155del | 93 |
In: insertion (+), Del: deletion (Δ), SNP: single nucleotide polymorphism (→). nt: nucleotide. QS: quorum sensing. T18: timepoint 18 (final evolved population). L1, L2, L3: lineage 1, 2, 3. C: control (=evolution in the absence of the microbiome), M: microbiome (=evolution in the presence of the microbiome). PA number: Pseudomonas aeruginosa PAO1 homologue number. This table lists genes that were mutated in at least one sample at a frequency above 35%.
*aK182RfsX27: K at position 182 is the first amino acid residue affected, it is changed to R followed by a frameshift of 27 codons in total, including the next stop codon.
*bH173transpos: the codon H at position 173 is interrupted by a transposase.
*cThe mutations relating to sahH are located in the intergenic region upstream of the start of the gene.
*dA34_S37del: the amino acids 34 to 37 are deleted.
*eV306(pqsA)_S2(phnA)del fsX69: the deletion affects V in position 306 of pqsA to S in position 2 of phnA, followed by a frameshift of 69 codons including the stop codon.
*fL194_L195insL: L is inserted between position 194 and 195.
In all P. aeruginosa populations that evolved in the presence and absence of the CF microbial community, mutations were found in the lasR QS regulator gene (P. aeruginosa PAO1 homologue designation: PA1430), with a frequency (relative abundance of affected reads in the population) of up to 100% already present at T1 (Table S3). Re-mapping the reads for T0 strain to the AA2 assembly revealed that mutations in lasR were already present with a cumulative frequency of 33% in the starting culture (Table S3). These mutations in lasR were the only mutations present in T0 or T1.
Mutations in pqsR (PA1003), another QS regulator gene, were found in all samples at frequencies of up to 93% at T10 and T18, these were not found at T1 or T0 (Tables 1, S3). The types of mutations in lasR and pqsR include insertions of A/G or a transposase, several deletions, and different SNPs (single nucleotide polymorphisms).
Mutations were also found in two other transcriptional regulators. The tetR gene encoding MexL (PA3678, part of the TetR protein family), a specific transcriptional repressor of the multidrug efflux operon mexJK60,61, was mutated at T18 in all samples that evolved in the absence of the microbiome (at frequencies up to 61%), and only in one sample that evolved in the presence of the microbiome. Most mutations in tetR were SNPs. Furthermore, in two control samples grown without the microbiome (T18 L1 C; T18 L3 C), mutations in the gntR gene (PA4132) were found at frequencies of up to 47% at T18, which were SNPs or insertions. gntR presumably encodes a DNA-binding transcriptional regulator from the MocR family and contains an aminotransferase domain, although it has not been fully characterised yet. The mexL, mexJK, and gntR genes have all been shown to be QS-activated22.
A deletion was also found in pilA (PA4525), the major pilin of the type IV pili, in all lineages regardless of the presence of the microbiome at T10 and T18, at frequencies of up to 97% (Tables 1, S3).
Finally, in all but one (T18 L2 M) samples, a mutation (SNP of G to A, or deletion of G) upstream of sahH (PA0432), encoding an adenosylhomocysteinase, was found (Table 1). This mutation consistently occurred at lower frequency in the presence of the microbiome (L1: 56 vs 99%, L2: 0 vs 32%, and L3: 10 vs 77%).
Often, different types of mutations occurred in the same gene for the same sample. Yet, it could not be determined if (or what fraction of) a population contained one or multiple mutations.
Nine genes with low frequency mutations (<35%) were observed at T18 and included the surface attachment sensor SagS, two flagellar genes and a type III secretion protein (Table S4).
3-O-C12-HSL and QS-regulated virulence factor production is reduced in evolved populations
After our discovery of the mutations found in the gene encoding lasR, we measured production of 3-O-C12-HSL by the T1 and evolved T18 populations using an E. coli biosensor strain expressing GFP in response to this QS molecule. Production of 3-O-C12-HSL was significantly reduced in the evolved populations (T18) compared to the populations at T1 in all lineages (Fig. 2). This showed that the observed mutations led to a null phenotype for the population only at T18, although lasR is already mutated at T1. Pooling the data from three lineages confirmed this observation (Fig. S8D).
Figure 2.
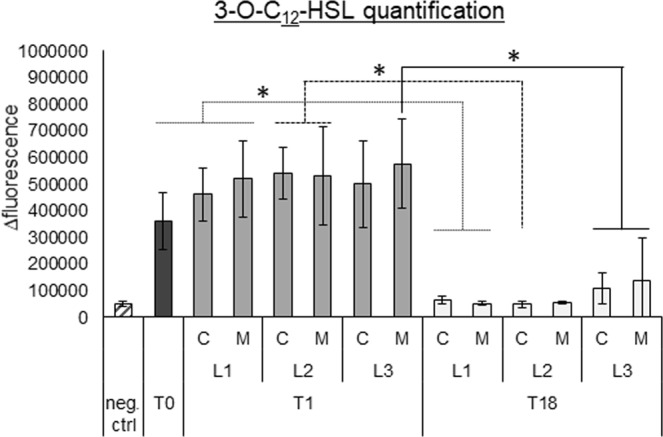
Quantification of 3-O-C12-HSL production using an E. coli biosensor strain (expressing GFP in response to this molecule). The data is presented as delta fluorescence, by measuring the difference in fluorescence at 24 h compared to the start of the experiment, to normalize for autofluorescence. Graphs show means, error bars indicate standard deviations. n = 3, *p ≤ 0.05. T0: timepoint 0, planktonic culture. T1: timepoint 1, 72 h biofilm cells. T18: timepoint 18, biofilm cells after 18 cycles (54 days). L1: lineage 1, L2: lineage 2, L3: lineage 3. C: control P. aeruginosa evolved without microbiome, M: P. aeruginosa evolved with microbiome. Neg. ctrl: negative control, pure E. coli culture.
To evaluate whether the observed mutations in the QS system resulted in downstream differences at the phenotypic level, production of QS-regulated virulence factors was quantified (Fig. 3). Pyocyanin production and protease activity were significantly reduced in the evolved populations (T18) for all lineages compared to T0 and/or T1 (both in the absence and presence of microbiome members) (p ≤ 0.05) (Fig. 3), and when all lineages were pooled (p ≤ 0.01) (Fig. S8E,F). In the evolved population of lineage 3, rhamnolipid production was also significantly reduced (p ≤ 0.05), and when data of all lineages was pooled a significantly lower rhamnolipid production was observed between T1 and T18 (Fig. S8G). However, no significant differences in pyoverdine production were observed (Figs 3, S8H) and swimming, swarming, and twitching motility were also not affected (Figs S4 and S8I–K).
Figure 3.
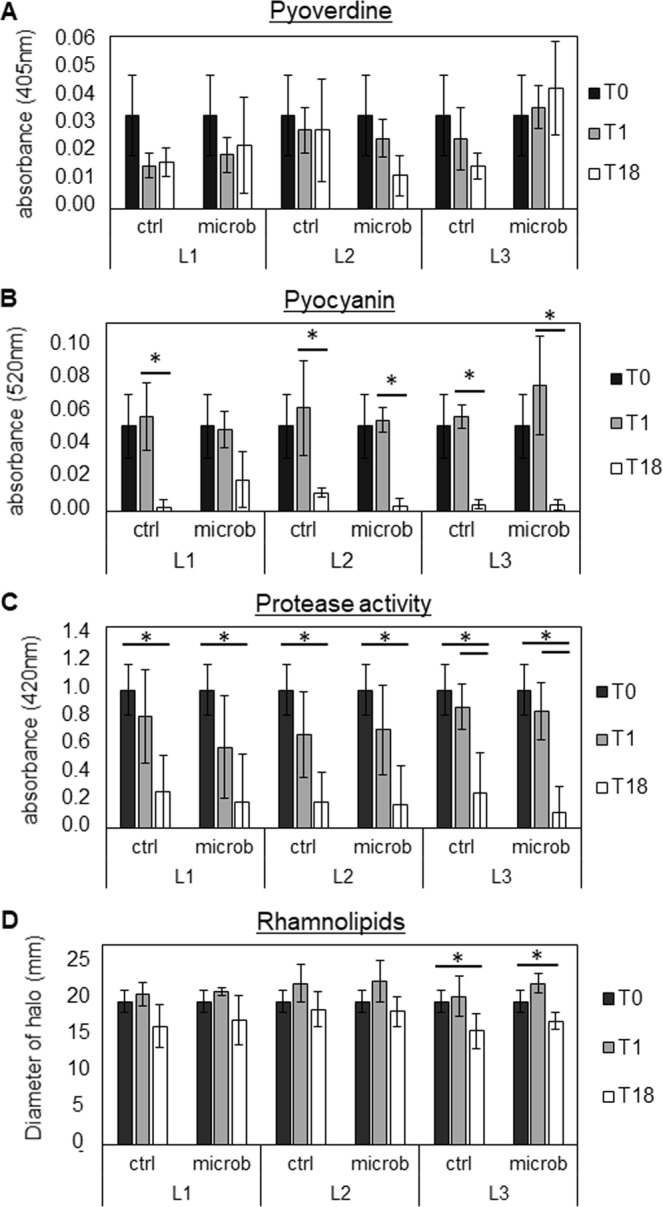
Determination of pyoverdine (A), pyocyanin (B), protease (C), and rhamnolipid (D) production by unevolved and evolved P. aeruginosa AA2 populations. Graphs show means, error bars indicate standard deviations. n ≥ 3, *p ≤ 0.05. T0: timepoint 0, planktonic culture. T1: timepoint 1, 72 h biofilm cells. T18: timepoint 18, biofilm cells after 18 cycles (54 days). L1: lineage 1, L2: lineage 2, L3: lineage 3. C: control single-culture, M: microbiome.
In order to examine whether the differences in virulence factor production were due to potential differences in growth, growth curves were determined for evolved and unevolved populations (Figs S5, S8L). In all lineages, no differences in growth were observed between all populations in the lag and exponential phases. However, in the stationary growth phase, significant differences in absorbance values could be observed between T0 and populations from T1 compared to the evolved populations at T18 (p ≤ 0.05). Nevertheless, this could not be linked to a change in CFUs (Figs S6, S8M).
Finally, the activation of the pro-inflammatory NF-κB pathway was evaluated following exposure of an in vivo-like 3-D lung epithelial model to the evolved or unevolved populations. NF-κB pathway activation was observed for all populations and no significant differences in activation were observed (p > 0.05) (Figs S7A, S8N). Host cell viability was approximately 80% for all infected samples (Figs S7B, S8O).
A mix of lasR and lasR pqsR mutants is present in evolved biofilms
One evolved biofilm (T18 L2 C) was plated and ten single colonies (C1–C10) were investigated further for mutations in lasR and pqsR using Sanger sequencing of the region that was found to be affected by WGS. Theoretically, almost all isolates should have the mutation (insertion) in lasR, while only 38% should have the pqsR mutation (SNP), according to the WGS data. While Sanger sequencing indeed confirmed that all isolates had a mutation in the lasR gene (10/10, 100%), six out of ten (60%) isolates also had a pqsR mutation (Table S5).
lasR pqsR mutants exert lower production of pyocyanin and protease than lasR mutants
Pyocyanin and protease production was quantified in two lasR pqsR (C1, C2) and two lasR mutant strains (C3, C9) isolated from the evolved control biofilm (T18 L2) in order to assess the role of pqsR in the production of these virulence factors. Both pyocyanin production and protease activity were significantly lower (p ≤ 0.05) in the isolates that contained both mutations (Fig. 4), consistent with previous reports of a regulatory role of PQS in pyocyanin and protease production, that are independent of LasR62,63.
Figure 4.

Pyocyanin production (A) and protease activity (B) of 2 sets of single isolates (C1 and C2: ΔlasRΔpqsR. C3 and C9: ΔlasR) from an evolved strain without microbiome presence (T18 L2 ctrl), selected depending on the presence and absence, respectively, of a mutation in pqsR (determined via Sanger sequencing). All isolates contained a mutation in lasR. Graphs show means, error bars indicate standard deviations. n ≥ 3, *p ≤ 0.05. (C) Photos of isolates C1, C2, C3, and C9 on LB agar showing the visible colour difference in the single isolates containing the different mutations.
Evolved populations show a decreased susceptibility to β-lactam antibiotics
The influence of P. aeruginosa evolution in a biofilm in the presence or absence of microbiome members on antibiotic resistance was evaluated by testing the susceptibility of unevolved and evolved populations to four antibiotics commonly used to treat CF lung infections, each representing a different antibiotic class (Table S6). An increase in the MIC for ceftazidime and aztreonam was observed for evolved populations in all lineages, while no differences were noticed for ciprofloxacin, colistin, or tobramycin (Fig. 5).
Figure 5.

MIC values for ceftazidime (CEF) and aztreonam (AZT) in all lineages, for control (ctrl) and microbiome (microb) samples. T0: timepoint 0, planktonic start culture. T1: timepoint 1, 72 h biofilm cells. T18: timepoint 18, biofilm cells after 18 cycles (54 days). L1: lineage 1, L2: lineage 2, L3: lineage 3.
The decreased susceptibility to ceftazidime and aztreonam mostly occurred early in the evolution study with an increase in MIC often already observed in T1 compared to T0. In two out of three lineages for both antibiotics, the decreased susceptibility was less pronounced in the presence of the microbiome.
The competitive behaviour of evolved populations towards S. aureus is diminished
The fraction of P. aeruginosa and S. aureus present in 24 h dual-species biofilms was quantified on selective media. It was observed that in co-culture with evolved P. aeruginosa populations, S. aureus was significantly more present than with unevolved populations (T18 compared to T0 and T1) (Figs 6, S8P). Moreover, unevolved P. aeruginosa populations (T1) could outcompete S. aureus completely, showing no S. aureus growth in the biofilm, while S. aureus growth up to 7 log CFU/mL was observed in biofilms with the evolved populations.
Figure 6.
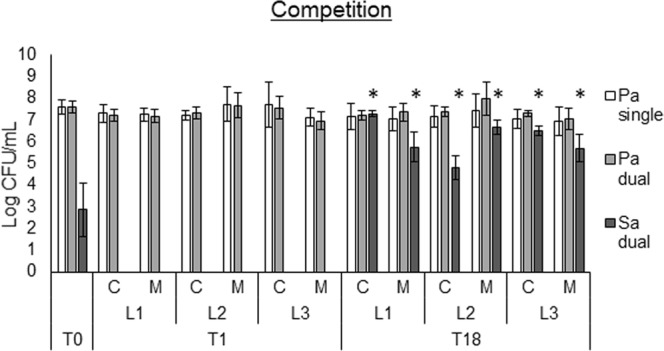
Determination of competition via dual-species biofilms of P. aeruginosa strains with S. aureus SP123. Pa single: P. aeruginosa strains as single-species biofilm, Pa dual: fraction of P. aeruginosa in the dual-species biofilm with S. aureus. Sa dual: fraction of S. aureus in the dual-species biofilm with P. aeruginosa. Graphs show means and error bars indicate standard deviations. n ≥ 3, *p ≤ 0.05 (S. aureus T18 versus T0 and T1). T0: timepoint 0, planktonic start culture. T1: timepoint 1, 72 h biofilm cells. T18: timepoint 18, biofilm cells after 18 cycles (54 days). L1: lineage 1, L2: lineage 2, L3: lineage 3. C: control single-culture. M: microbiome.
Discussion
In the present study, an early CF P. aeruginosa strain (AA2)64 was used to assess the evolution of biofilms in the absence or presence of the common CF lung microbiome members S. aureus, S. anginosus, A. xylosoxidans, R. mucilaginosa, and G. haemolysans. Since the CF lung microbiome is typically more diverse prior to P. aeruginosa colonization65, it is likely that early colonizers will co-exist with members of the microbiome, which could influence their evolution. Various phenotypic changes were observed after 18 evolution cycles, including decreased production of virulence factors (i.e. pyocyanin, protease, and rhamnolipids). These changes were mostly independent of the presence of other bacterial species and are similar to evolutionary changes observed for P. aeruginosa in chronic lung infections in CF patients.
Mutations were discovered in the genes lasR and pqsR, the regulators of two of the QS systems of P. aeruginosa66. The mutations in LasR were already present in the starting culture, and their frequency increased to nearly 100% in all lineages as early as cycle 1. The in vitro and in vivo loss of function of LasR has been described before in adapted P. aeruginosa strains both in planktonic and biofilm cultures6,8,19,23–26, and early genotypic and phenotypic changes during experimental evolution of P. aeruginosa have been reported as well67,68. Mutations in lasR only occurred after 30 days of biofilm culture in synthetic CF medium for strain PAO168, which is in contrast with the results obtained in the present study for a CF clinical isolate. The presence of mutations in lasR at the start of the evolution study for the CF isolate used in the present study is presumably at the origin of differences with the study by Azimi et al.
Despite LasR probably being non-functional at T1, QS-regulated virulence factors (incl. proteases and pyocyanin), and 3-O-C12-HSL were still produced by these cultures. In stationary phase, lasR mutants in clinical isolate PA14 have been shown to activate QS regulated phenotypes by the rhl QS system replacing the las QS system and restoring the production of HSL, virulence factors, and Pseudomonas quinolone signal (PQS)69. It was also shown (for PAO1) that PQS production was delayed, but not abolished in a lasR mutant70. Furthermore, recent studies described a rewiring of the QS system in CF clinical isolates of P. aeruginosa, where RhlR can activate quorum-sensing-dependent genes independently of LasR19.
A subpopulation of P. aeruginosa developed mutations in pqsR, in addition to the mutations in lasR, at later stages of evolution. Mutations in pqsR have not been reported as part of the frequent adaptations in the CF lung, but have previously been observed in vitro67,71. Mutations in pqsR were associated with a pronounced effect on pyocyanin and protease production in our study, which is consistent with a previously described but unresolved mechanism by which PQS can activate transcription of these genes in a LasR-independent manner62,63.
PilA, the major pilin of the type IV pilus, was mutated in all lineages, with or without microbiome. Type IV pili are involved in biofilm formation in P. aeruginosa, they mediate attachment to surfaces and surface motility72. Klausen et al.73 demonstrated (in strain PAO1) that in a pilA/wt mixed biofilm the mutant was only present in the stalks of the mushrooms-shaped structures, whereas the wild type formed the caps. Furthermore, a pilApqsA double mutant in P. aeruginosa PAO1 only formed surface attached microcolonies and no mushroom-shaped structures74. Interestingly, in our study the mutations in pqsR and in pilA seemed to develop in parallel.
The pilA mutation reported in this study is a deletion of a 6 nt duplicated sequence, leading to the deletion of two threonine residues out of stretch of four threonines located at the C-terminal of this protein, 3 amino acids upstream of the stop codon. PilA in P. aeruginosa AA2 has only 41% similarity to PilA in PAO1, it is more similar to PilA in P. aeruginosa K122-4, a clinical isolate from a CF patient in Toronto75. The stretch of threonines in which the deletion occurs is not present in the PAO1 PilA. It is therefore unknown if the deletion in PilA of strain AA2 has an effect on biofilm phenotype. Nonetheless, the slight decrease in biofilm formation of evolved populations (which was observed when pooling the data of all lineages), as well as the low frequency of mutations in flagellar genes and SagS point to a modulation of attachment and biofilm formation in evolved populations. While the ability of the evolved population to form new biofilms was decreased (probably due to the described genotypic changes), the biofilm formation during evolution increased over time. We speculate that this could be due to phenotypic alterations, such as accumulation of extracellular matrix components during transfers when starting new biofilm cycles.
A decrease in susceptibility to the β-lactam antibiotics ceftazidime and aztreonam was observed for all evolved P. aeruginosa populations. Evolution of antibiotic resistance in response to continuous antibiotic stress is common76,77. However, in our study set-up, no antibiotics were present. Davies et al.78 and D’Argenio et al.8 also observed this increase in MIC for ceftazidime with evolved P. aeruginosa strains in the absence of antibiotics. This was attributed to an elevated production of β-lactamases by QS mutant strains. Although no mutations were found in either ampC or poxB, the described co-regulation between AmpR, a β-lactamase expression regulator, and LasR could explain the observed increase in resistance8,79,80. Additionally, in the WGS data, a mutation was observed in the gene encoding MexL, a TetR family repressor of the multidrug efflux pump MexJK. This mutation was more frequently observed in lineages that evolved in the absence of the microbiome, and could possibly explain the more pronounced increase in the MIC of β-lactam antibiotics under these conditions. Nevertheless, MexJK has only been shown to transport tetracycline, erythromycin, and triclosan in P. aeruginosa60,61, and the potential transport of β-lactam antibiotics by the MexJK efflux pump remains to be investigated.
Finally, the competitive behaviour of P. aeruginosa in a dual-species biofilm with S. aureus was investigated, showing that unevolved populations outcompete S. aureus, while evolved populations allowed ample S. aureus biofilm growth. Co-cultures of P. aeruginosa and S. aureus have been studied extensively and mostly show P. aeruginosa outcompeting S. aureus in vitro (reviewed in81). Yet, in vivo, concomitant infections of both pathogens are often seen82. Here, we show that evolutionary adaptation of P. aeruginosa leads to a less competitive phenotype. These results can most likely be explained by the observed mutations in lasR and pqsR and downstream effects on the production of QS molecules and virulence factors (such as proteases, pyocyanin), which have been shown to affect S. aureus growth and/or viability81. For example, mutations in P. aeruginosa leading to impaired 2-hydroxy-4-alkylquinolone production – which is regulated by the PQS QS system - reduced the growth inhibition of S. aureus, normally inflicted by the wild-type strains83,84.
In a recent evolution study by Tognon et al.24, P. aeruginosa and S. aureus were co-cultured as dual-species biofilms, but a lasR mutation was only observed in monocultures of P. aeruginosa, and not in co-cultured samples. In our study, lasR mutations increased in frequency regardless of whether other species were present. However, in our model the community was more diverse and no direct interactions occurred between different species, in contrast to previous studies. As the spatial organization of complex communities influences metabolism and co-evolution of multispecies communities85, this could explain differences between the present study and previous work24. However, the lack of direct contact may be more reflective of the in vivo situation in the CF lungs, as bacteria are often found as separate single species microcolonies in sputum of CF patients, rather than as truly intermixed communities4,86.
In the present study, we performed phenotypic and genotypic analysis of the whole evolved population. With this approach, possible effects of evolution on population diversification in the presence or absence of the microbiome were not considered. Phenotypic diversity in the CF lung environment is frequently observed for P. aeruginosa and other CF pathogens5,87, which is possibly related to regional adaptation18. In vitro evolution studies have also reported P. aeruginosa diversification during biofilm growth, with variation in antibiotic resistance and colony morphology being observed78,88. Whether interspecies interactions between the members of the microbiome could influence P. aeruginosa population diversity remains to be determined.
In conclusion, we showed that in vitro evolution of P. aeruginosa AA2 biofilms can lead to pathoadaptive mutations and phenotypes commonly found in in vivo chronic infections. The most noticeable genotypic and phenotypic changes, which are related to the las and pqs QS machineries, occurred regardless of the presence of other members of the CF microbiome. Understanding the in vivo factors that drive and/or modulate the evolutionary behaviour of P. aeruginosa may lead to novel therapeutic avenues to direct evolution towards a genotype/phenotype that is susceptible to treatment.
Supplementary information
Acknowledgements
The authors would like to thank Ian Vandenbussche, Charlotte Rigauts, Sara Van den Bossche, Lisa Ostyn and Petra Rigole for the practical assistance. We are grateful to Lars Jelsbak (Technical University of Denmark) and Nico Boon (Ghent University) for fruitful discussions. We thank the Oxford Genomics Centre at the Wellcome Centre for Human Genetics (funded by Wellcome Trust grant reference 203141/Z/16/Z) for the generation and initial processing of the sequencing data. This work was funded by an Odysseus grant of the Research Foundation Flanders (G.0.E53.14 N).
Author Contributions
A.C. and E.V. conceptualized the study. E.V., A.S., A.A.D., T.C. and A.C. designed the experimental set-up. E.V. and A.L. performed the experiments. E.V., A.S. and A.C. were involved in data analysis. E.V., A.C., A.S. and T.C. wrote the main manuscript text with input from all authors. All authors reviewed the manuscript.
Data Availability
All data is available in this manuscript, the Supplemental Information or deposited in databases, as described in the manuscript.
Competing Interests
The authors declare no competing interests.
Footnotes
Publisher’s note: Springer Nature remains neutral with regard to jurisdictional claims in published maps and institutional affiliations.
Supplementary information
Supplementary information accompanies this paper at 10.1038/s41598-019-49371-y.
References
- 1.Hoiby N, et al. Diagnosis of biofilm infections in cystic fibrosis patients. APMIS: acta pathologica. microbiologica. et immunologica Scandinavica. 2017;125:339–343. doi: 10.1111/apm.12689. [DOI] [PubMed] [Google Scholar]
- 2.Bhagirath AY, et al. Cystic fibrosis lung environment and Pseudomonas aeruginosa infection. BMC pulmonary medicine. 2016;16:174. doi: 10.1186/s12890-016-0339-5. [DOI] [PMC free article] [PubMed] [Google Scholar]
- 3.Gellatly SL, Hancock RE. Pseudomonas aeruginosa: new insights into pathogenesis and host defenses. Pathogens and disease. 2013;67:159–173. doi: 10.1111/2049-632X.12033. [DOI] [PubMed] [Google Scholar]
- 4.Sousa AM, Pereira MO. Pseudomonas aeruginosa Diversification during Infection Development in Cystic Fibrosis Lungs-A Review. Pathogens (Basel. Switzerland) 2014;3:680–703. doi: 10.3390/pathogens3030680. [DOI] [PMC free article] [PubMed] [Google Scholar]
- 5.Winstanley C, O’Brien S, Brockhurst MA. Pseudomonas aeruginosa Evolutionary Adaptation and Diversification in Cystic Fibrosis Chronic Lung Infections. Trends in microbiology. 2016;24:327–337. doi: 10.1016/j.tim.2016.01.008. [DOI] [PMC free article] [PubMed] [Google Scholar]
- 6.Smith EE, et al. Genetic adaptation by Pseudomonas aeruginosa to the airways of cystic fibrosis patients. Proceedings of the National Academy of Sciences of the United States of America. 2006;103:8487–8492. doi: 10.1073/pnas.0602138103. [DOI] [PMC free article] [PubMed] [Google Scholar]
- 7.Cullen L, McClean S. Bacterial Adaptation during Chronic Respiratory Infections. Pathogens (Basel. Switzerland) 2015;4:66–89. doi: 10.3390/pathogens4010066. [DOI] [PMC free article] [PubMed] [Google Scholar]
- 8.D’Argenio DA, et al. Growth phenotypes of Pseudomonas aeruginosa lasR mutants adapted to the airways of cystic fibrosis patients. Molecular microbiology. 2007;64:512–533. doi: 10.1111/j.1365-2958.2007.05678.x. [DOI] [PMC free article] [PubMed] [Google Scholar]
- 9.Hogardt M, Heesemann J. Adaptation of Pseudomonas aeruginosa during persistence in the cystic fibrosis lung. International journal of medical microbiology: IJMM. 2010;300:557–562. doi: 10.1016/j.ijmm.2010.08.008. [DOI] [PubMed] [Google Scholar]
- 10.Folkesson A, et al. Adaptation of Pseudomonas aeruginosa to the cystic fibrosis airway: an evolutionary perspective. Nature reviews. Microbiology. 2012;10:841–851. doi: 10.1038/nrmicro2907. [DOI] [PubMed] [Google Scholar]
- 11.Cigana C, et al. Tracking the immunopathological response to Pseudomonas aeruginosa during respiratory infections. Sci Rep. 2016;6:21465. doi: 10.1038/srep21465. [DOI] [PMC free article] [PubMed] [Google Scholar]
- 12.LaFayette, S. L. et al. Cystic fibrosis-adapted Pseudomonas aeruginosa quorum sensing lasR mutants cause hyperinflammatory responses. Science advances1 (2015). [DOI] [PMC free article] [PubMed]
- 13.Mowat E, et al. Pseudomonas aeruginosa population diversity and turnover in cystic fibrosis chronic infections. American journal of respiratory and critical care medicine. 2011;183:1674–1679. doi: 10.1164/rccm.201009-1430OC. [DOI] [PubMed] [Google Scholar]
- 14.Darch SE, et al. Recombination is a key driver of genomic and phenotypic diversity in a Pseudomonas aeruginosa population during cystic fibrosis infection. Sci Rep. 2015;5:7649. doi: 10.1038/srep07649. [DOI] [PMC free article] [PubMed] [Google Scholar]
- 15.Ashish A, et al. Extensive diversification is a common feature of Pseudomonas aeruginosa populations during respiratory infections in cystic fibrosis. Journal of cystic fibrosis: official journal of the European Cystic Fibrosis Society. 2013;12:790–793. doi: 10.1016/j.jcf.2013.04.003. [DOI] [PMC free article] [PubMed] [Google Scholar]
- 16.Clark ST, et al. Phenotypic diversity within a Pseudomonas aeruginosa population infecting an adult with cystic fibrosis. Scientific reports. 2015;5:10932. doi: 10.1038/srep10932. [DOI] [PMC free article] [PubMed] [Google Scholar]
- 17.Manfredi P, Jenal U. Bacteria in the CF Lung: Isolation Drives Diversity. Cell host & microbe. 2015;18:268–269. doi: 10.1016/j.chom.2015.08.013. [DOI] [PubMed] [Google Scholar]
- 18.Jorth P, et al. Regional Isolation Drives Bacterial Diversification within Cystic Fibrosis Lungs. Cell Host Microbe. 2015;18:307–319. doi: 10.1016/j.chom.2015.07.006. [DOI] [PMC free article] [PubMed] [Google Scholar]
- 19.Feltner, J. B. et al. LasR Variant Cystic Fibrosis Isolates Reveal an Adaptable Quorum-Sensing Hierarchy in Pseudomonas aeruginosa. mBio7 (2016). [DOI] [PMC free article] [PubMed]
- 20.Hoffman LR, et al. Pseudomonas aeruginosa lasR mutants are associated with cystic fibrosis lung disease progression. Journal of cystic fibrosis: official journal of the European Cystic Fibrosis Society. 2009;8:66–70. doi: 10.1016/j.jcf.2008.09.006. [DOI] [PMC free article] [PubMed] [Google Scholar]
- 21.Bjarnsholt T, et al. Quorum sensing and virulence of Pseudomonas aeruginosa during lung infection of cystic fibrosis patients. PloS one. 2010;5:e101155. doi: 10.1371/journal.pone.0010115. [DOI] [PMC free article] [PubMed] [Google Scholar]
- 22.Schuster M, Greenberg EP. A network of networks: quorum-sensing gene regulation in Pseudomonas aeruginosa. International journal of medical microbiology: IJMM. 2006;296:73–81. doi: 10.1016/j.ijmm.2006.01.036. [DOI] [PubMed] [Google Scholar]
- 23.Sandoz KM, Mitzimberg SM, Schuster M. Social cheating in Pseudomonas aeruginosa quorum sensing. Proceedings of the National Academy of Sciences of the United States of America. 2007;104:15876–15881. doi: 10.1073/pnas.0705653104. [DOI] [PMC free article] [PubMed] [Google Scholar]
- 24.Tognon M, et al. Co-evolution with Staphylococcus aureus leads to lipopolysaccharide alterations in Pseudomonas aeruginosa. The ISME journal. 2017;11:2233–2243. doi: 10.1038/ismej.2017.83. [DOI] [PMC free article] [PubMed] [Google Scholar]
- 25.Heurlier K, et al. Quorum-sensing-negative (lasR) mutants of Pseudomonas aeruginosa avoid cell lysis and death. Journal of bacteriology. 2005;187:4875–4883. doi: 10.1128/JB.187.14.4875-4883.2005. [DOI] [PMC free article] [PubMed] [Google Scholar]
- 26.Lujan AM, Moyano AJ, Segura I, Argarana CE, Smania AM. Quorum-sensing-deficient (lasR) mutants emerge at high frequency from a Pseudomonas aeruginosa mutS strain. Microbiology (Reading. England) 2007;153:225–237. doi: 10.1099/mic.0.29021-0. [DOI] [PubMed] [Google Scholar]
- 27.Surette MG. The cystic fibrosis lung microbiome. Annals of the American Thoracic Society. 2014;11(Suppl 1):S61–65. doi: 10.1513/AnnalsATS.201306-159MG. [DOI] [PubMed] [Google Scholar]
- 28.Huang YJ, LiPuma JJ. The Microbiome in Cystic Fibrosis. Clinics in chest medicine. 2016;37:59–67. doi: 10.1016/j.ccm.2015.10.003. [DOI] [PMC free article] [PubMed] [Google Scholar]
- 29.Whelan FJ, et al. Longitudinal sampling of the lung microbiota in individuals with cystic fibrosis. PloS one. 2017;12:e0172811. doi: 10.1371/journal.pone.0172811. [DOI] [PMC free article] [PubMed] [Google Scholar]
- 30.Mahenthiralingam E. Emerging cystic fibrosis pathogens and the microbiome. Paediatric respiratory reviews. 2014;15(Suppl 1):13–15. doi: 10.1016/j.prrv.2014.04.006. [DOI] [PubMed] [Google Scholar]
- 31.Green H, Jones AM. Emerging Gram-negative bacteria: pathogenic or innocent bystanders. Current opinion in pulmonary medicine. 2018;24:592–598. doi: 10.1097/MCP.0000000000000517. [DOI] [PubMed] [Google Scholar]
- 32.Zhao J, et al. Decade-long bacterial community dynamics in cystic fibrosis airways. Proceedings of the National Academy of Sciences of the United States of America. 2012;109:5809–5814. doi: 10.1073/pnas.1120577109. [DOI] [PMC free article] [PubMed] [Google Scholar]
- 33.Tashiro Y, Yawata Y, Toyofuku M, Uchiyama H, Nomura N. Interspecies interaction between Pseudomonas aeruginosa and other microorganisms. Microbes and environments. 2013;28:13–24. doi: 10.1264/jsme2.ME12167. [DOI] [PMC free article] [PubMed] [Google Scholar]
- 34.O’Brien, S. & Fothergill, J. L. The role of multispecies social interactions in shaping Pseudomonas aeruginosa pathogenicity in the cystic fibrosis lung. FEMS microbiology letters364 (2017). [DOI] [PMC free article] [PubMed]
- 35.Winstanley C, Fothergill JL. The role of quorum sensing in chronic cystic fibrosis Pseudomonas aeruginosa infections. FEMS microbiology letters. 2009;290:1–9. doi: 10.1111/j.1574-6968.2008.01394.x. [DOI] [PubMed] [Google Scholar]
- 36.Nguyen AT, et al. Cystic Fibrosis Isolates of Pseudomonas aeruginosa Retain Iron-Regulated Antimicrobial Activity against Staphylococcus aureus through the Action of Multiple Alkylquinolones. Frontiers in microbiology. 2016;7:1171. doi: 10.3389/fmicb.2016.01171. [DOI] [PMC free article] [PubMed] [Google Scholar]
- 37.Toyofuku M, Nakajima-Kambe T, Uchiyama H, Nomura N. The effect of a cell-to-cell communication molecule, Pseudomonas quinolone signal (PQS), produced by P. aeruginosa on other bacterial species. Microbes and environments. 2010;25:1–7. doi: 10.1264/jsme2.ME09156. [DOI] [PubMed] [Google Scholar]
- 38.Sotirova AV, Spasova DI, Galabova DN, Karpenko E, Shulga A. Rhamnolipid-biosurfactant permeabilizing effects on gram-positive and gram-negative bacterial strains. Current microbiology. 2008;56:639–644. doi: 10.1007/s00284-008-9139-3. [DOI] [PubMed] [Google Scholar]
- 39.Vandeplassche E, Coenye T, Crabbe A. Developing selective media for quantification of multispecies biofilms following antibiotic treatment. PLoS One. 2017;12:e0187540. doi: 10.1371/journal.pone.0187540. [DOI] [PMC free article] [PubMed] [Google Scholar]
- 40.EUCAST. Preparation of agar plates and broth for EUCAST AST v. 5.0 [Internet]. Available from: http://www.eucast.org/ast_of_bacteria/media_preparation/.
- 41.Brettin T, et al. RASTtk: a modular and extensible implementation of the RAST algorithm for building custom annotation pipelines and annotating batches of genomes. Scientific reports. 2015;5:8365. doi: 10.1038/srep08365. [DOI] [PMC free article] [PubMed] [Google Scholar]
- 42.O’Toole, G. A. Microtiter dish biofilm formation assay. Journal of visualized experiments: JoVE, 10.3791/2437 (2011). [DOI] [PMC free article] [PubMed]
- 43.O’Toole GA, Kolter R. Initiation of biofilm formation in Pseudomonas fluorescens WCS365 proceeds via multiple, convergent signalling pathways: a genetic analysis. Molecular microbiology. 1998;28:449–461. doi: 10.1046/j.1365-2958.1998.00797.x. [DOI] [PubMed] [Google Scholar]
- 44.Wiegand I, Hilpert K, Hancock RE. Agar and broth dilution methods to determine the minimal inhibitory concentration (MIC) of antimicrobial substances. Nature protocols. 2008;3:163–175. doi: 10.1038/nprot.2007.521. [DOI] [PubMed] [Google Scholar]
- 45.EUCAST. Determination of minimum inhibitory concentrations (MICs) of antibacterial agents by agar dilution. Clin Microbiol Infect. European Society of Clinical Infectious Diseases. 2000;6:509–515. doi: 10.1046/j.1469-0691.2000.00142.x. [DOI] [PubMed] [Google Scholar]
- 46.Chow S, Gu K, Jiang L, Nassour A. Salicylic acid affects swimming, twitching and swarming motility in Pseudomonas aeruginosa, resulting in decreased biofilm formation. J Exp Microbiol Immunol. 2011;15:22–29. [Google Scholar]
- 47.McMorran BJ, Shanta Kumara HM, Sullivan K, Lamont IL. Involvement of a transformylase enzyme in siderophore synthesis in Pseudomonas aeruginosa. Microbiology (Reading. England) 2001;147:1517–1524. doi: 10.1099/00221287-147-6-1517. [DOI] [PubMed] [Google Scholar]
- 48.Essar DW, Eberly L, Hadero A, Crawford IP. Identification and characterization of genes for a second anthranilate synthase in Pseudomonas aeruginosa: interchangeability of the two anthranilate synthases and evolutionary implications. Journal of bacteriology. 1990;172:884–900. doi: 10.1128/jb.172.2.884-900.1990. [DOI] [PMC free article] [PubMed] [Google Scholar]
- 49.Pinzon NM, Ju LK. Improved detection of rhamnolipid production using agar plates containing methylene blue and cetyl trimethylammonium bromide. Biotechnology letters. 2009;31:1583–1588. doi: 10.1007/s10529-009-0049-7. [DOI] [PubMed] [Google Scholar]
- 50.Siegmund I, Wagner F. New Method for Detecting Rhamnolipids Excreted by Pseudomonas Species during Growth on Mineral Agar. Biotechnol Tech. 1991;5:265–268. doi: 10.1007/BF02438660. [DOI] [Google Scholar]
- 51.Moss DE, Gutierrez YR, Perez RG, Kobayashi H. Simple spectrophotometric assay for calcium-activated neutral proteases (calpains) Pharmacology. biochemistry. and behavior. 1991;39:495–497. doi: 10.1016/0091-3057(91)90214-M. [DOI] [PubMed] [Google Scholar]
- 52.Vandecandelaere I, Depuydt P, Nelis HJ, Coenye T. Protease production by Staphylococcus epidermidis and its effect on Staphylococcus aureus biofilms. Pathogens and disease. 2014;70:321–331. doi: 10.1111/2049-632X.12133. [DOI] [PubMed] [Google Scholar]
- 53.Shaw PD, et al. Detecting and characterizing N-acyl-homoserine lactone signal molecules by thin-layer chromatography. Proceedings of the National Academy of Sciences of the United States of America. 1997;94:6036–6041. doi: 10.1073/pnas.94.12.6036. [DOI] [PMC free article] [PubMed] [Google Scholar]
- 54.Crabbe A, et al. Use of the rotating wall vessel technology to study the effect of shear stress on growth behaviour of Pseudomonas aeruginosa PA01. Environmental microbiology. 2008;10:2098–2110. doi: 10.1111/j.1462-2920.2008.01631.x. [DOI] [PubMed] [Google Scholar]
- 55.Hentzer M, et al. Inhibition of quorum sensing in Pseudomonas aeruginosa biofilm bacteria by a halogenated furanone compound. Microbiology (Reading. England) 2002;148:87–102. doi: 10.1099/00221287-148-1-87. [DOI] [PubMed] [Google Scholar]
- 56.Carterson AJ, et al. A549 lung epithelial cells grown as three-dimensional aggregates: alternative tissue culture model for Pseudomonas aeruginosa pathogenesis. Infect Immun. 2005;73:1129–1140. doi: 10.1128/IAI.73.2.1129-1140.2005. [DOI] [PMC free article] [PubMed] [Google Scholar]
- 57.Barrila J, et al. Organotypic 3D cell culture models: using the rotating wall vessel to study host-pathogen interactions. Nat Rev Microbiol. 2010;8:791–801. doi: 10.1038/nrmicro2423. [DOI] [PubMed] [Google Scholar]
- 58.Crabbe A, et al. Antimicrobial efficacy against Pseudomonas aeruginosa biofilm formation in a three-dimensional lung epithelial model and the influence of fetal bovine serum. Sci Rep. 2017;7:43321. doi: 10.1038/srep43321. [DOI] [PMC free article] [PubMed] [Google Scholar]
- 59.Crabbé A, et al. Alveolar epithelium protects macrophages from quorum sensing-induced cytotoxicity in a three-dimensional co-culture model. Cellular Microbiology. 2011;13:469–481. doi: 10.1111/j.1462-5822.2010.01548.x. [DOI] [PubMed] [Google Scholar]
- 60.Chuanchuen R, Gaynor JB, Karkhoff-Schweizer R, Schweizer HP. Molecular characterization of MexL, the transcriptional repressor of the mexJK multidrug efflux operon in Pseudomonas aeruginosa. Antimicrobial agents and chemotherapy. 2005;49:1844–1851. doi: 10.1128/AAC.49.5.1844-1851.2005. [DOI] [PMC free article] [PubMed] [Google Scholar]
- 61.Chuanchuen R, Narasaki CT, Schweizer HP. The MexJK efflux pump of Pseudomonas aeruginosa requires OprM for antibiotic efflux but not for efflux of triclosan. Journal of bacteriology. 2002;184:5036–5044. doi: 10.1128/JB.184.18.5036-5044.2002. [DOI] [PMC free article] [PubMed] [Google Scholar]
- 62.Deziel E, et al. The contribution of MvfR to Pseudomonas aeruginosa pathogenesis and quorum sensing circuitry regulation: multiple quorum sensing-regulated genes are modulated without affecting lasRI, rhlRI or the production of N-acyl-L-homoserine lactones. Molecular microbiology. 2005;55:998–1014. doi: 10.1111/j.1365-2958.2004.04448.x. [DOI] [PubMed] [Google Scholar]
- 63.Rampioni G, et al. Transcriptomic analysis reveals a global alkyl-quinolone-independent regulatory role for PqsE in facilitating the environmental adaptation of Pseudomonas aeruginosa to plant and animal hosts. Environmental microbiology. 2010;12:1659–1673. doi: 10.1111/j.1462-2920.2010.02214.x. [DOI] [PMC free article] [PubMed] [Google Scholar]
- 64.De Soyza A, et al. Developing an international Pseudomonas aeruginosa reference panel. MicrobiologyOpen. 2013;2:1010–1023. doi: 10.1002/mbo3.141. [DOI] [PMC free article] [PubMed] [Google Scholar]
- 65.O’Toole, G. A. Cystic Fibrosis Airway Microbiome: Overturning the Old, Opening the Way for the New. Journal of bacteriology200 (2018). [DOI] [PMC free article] [PubMed]
- 66.Lee J, Zhang L. The hierarchy quorum sensing network in Pseudomonas aeruginosa. Protein & cell. 2015;6:26–41. doi: 10.1007/s13238-014-0100-x. [DOI] [PMC free article] [PubMed] [Google Scholar]
- 67.Davies EV, et al. Temperate phages both mediate and drive adaptive evolution in pathogen biofilms. Proceedings of the National Academy of Sciences of the United States of America. 2016;113:8266–8271. doi: 10.1073/pnas.1520056113. [DOI] [PMC free article] [PubMed] [Google Scholar]
- 68.Azimi, S. et al. Allelic polymorphism shapes collective phenotypes in evolving Pseudomonas aeruginosa populations. BioRxiv, 10.1101/644724 (2019).
- 69.Dekimpe V, Deziel E. Revisiting the quorum-sensing hierarchy in Pseudomonas aeruginosa: the transcriptional regulator RhlR regulates LasR-specific factors. Microbiology (Reading. England) 2009;155:712–723. doi: 10.1099/mic.0.022764-0. [DOI] [PubMed] [Google Scholar]
- 70.Diggle SP, et al. The Pseudomonas aeruginosa quinolone signal molecule overcomes the cell density-dependency of the quorum sensing hierarchy, regulates rhl-dependent genes at the onset of stationary phase and can be produced in the absence of LasR. Molecular microbiology. 2003;50:29–43. doi: 10.1046/j.1365-2958.2003.03672.x. [DOI] [PubMed] [Google Scholar]
- 71.Wilder CN, Diggle SP, Schuster M. Cooperation and cheating in Pseudomonas aeruginosa: the roles of the las, rhl and pqs quorum-sensing systems. The ISME journal. 2011;5:1332–1343. doi: 10.1038/ismej.2011.13. [DOI] [PMC free article] [PubMed] [Google Scholar]
- 72.Craig L, Pique ME, Tainer JA. Type IV pilus structure and bacterial pathogenicity. Nature reviews. Microbiology. 2004;2:363–378. doi: 10.1038/nrmicro885. [DOI] [PubMed] [Google Scholar]
- 73.Klausen M, et al. Biofilm formation by Pseudomonas aeruginosa wild type, flagella and type IV pili mutants. Molecular microbiology. 2003;48:1511–1524. doi: 10.1046/j.1365-2958.2003.03525.x. [DOI] [PubMed] [Google Scholar]
- 74.Yang L, Nilsson M, Gjermansen M, Givskov M, Tolker-Nielsen T. Pyoverdine and PQS mediated subpopulation interactions involved in Pseudomonas aeruginosa biofilm formation. Molecular microbiology. 2009;74:1380–1392. doi: 10.1111/j.1365-2958.2009.06934.x. [DOI] [PubMed] [Google Scholar]
- 75.Pasloske BL, Carpenter MR, Frost LS, Finlay BB, Paranchych W. The expression of Pseudomonas aeruginosa PAK pilin gene mutants in Escherichia coli. Molecular microbiology. 1988;2:185–195. doi: 10.1111/j.1365-2958.1988.tb00020.x. [DOI] [PubMed] [Google Scholar]
- 76.Ahmed, M. N., Porse, A., Sommer, M. O. A., Hoiby, N. & Ciofu, O. Evolution of Antibiotic Resistance in Biofilm and Planktonic Pseudomonas aeruginosa Populations Exposed to Subinhibitory Levels of Ciprofloxacin. Antimicrobial agents and chemotherapy62 (2018). [DOI] [PMC free article] [PubMed]
- 77.Sanz-Garcia, F., Hernando-Amado, S. & Martinez, J. L. Mutation-Driven Evolution of Pseudomonas aeruginosa in the Presence of either Ceftazidime or Ceftazidime-Avibactam. Antimicrobial agents and chemotherapy62 (2018). [DOI] [PMC free article] [PubMed]
- 78.Davies EV, James CE, Brockhurst MA, Winstanley C. Evolutionary diversification of Pseudomonas aeruginosa in an artificial sputum model. BMC microbiology. 2017;17:3. doi: 10.1186/s12866-016-0916-z. [DOI] [PMC free article] [PubMed] [Google Scholar]
- 79.Balasubramanian, D. et al. Co-regulation of {beta}-lactam resistance, alginate production and quorum sensing in Pseudomonas aeruginosa. Journal of medical microbiology60 (2011). [DOI] [PMC free article] [PubMed]
- 80.Kong KF, et al. Pseudomonas aeruginosa AmpR is a global transcriptional factor that regulates expression of AmpC and PoxB beta-lactamases, proteases, quorum sensing, and other virulence factors. Antimicrobial agents and chemotherapy. 2005;49:4567–4575. doi: 10.1128/AAC.49.11.4567-4575.2005. [DOI] [PMC free article] [PubMed] [Google Scholar]
- 81.Hotterbeekx A, Kumar-Singh S, Goossens H, Malhotra-Kumar S. In vivo and In vitro Interactions between Pseudomonas aeruginosa and Staphylococcus spp. Frontiers in cellular and infection microbiology. 2017;7:106. doi: 10.3389/fcimb.2017.00106. [DOI] [PMC free article] [PubMed] [Google Scholar]
- 82.Nguyen AT, Oglesby-Sherrouse AG. Interactions between Pseudomonas aeruginosa and Staphylococcus aureus during co-cultivations and polymicrobial infections. Applied microbiology and biotechnology. 2016;100:6141–6148. doi: 10.1007/s00253-016-7596-3. [DOI] [PMC free article] [PubMed] [Google Scholar]
- 83.Beaume M, et al. Metabolic pathways of Pseudomonas aeruginosa involved in competition with respiratory bacterial pathogens. Frontiers in microbiology. 2015;6:321. doi: 10.3389/fmicb.2015.00321. [DOI] [PMC free article] [PubMed] [Google Scholar]
- 84.Kim S, Yoon Y, Choi KH. Pseudomonas aeruginosa DesB Promotes Staphylococcus aureus Growth Inhibition in Coculture by Controlling the Synthesis of HAQs. PloS one. 2015;10:e0134624. doi: 10.1371/journal.pone.0134624. [DOI] [PMC free article] [PubMed] [Google Scholar]
- 85.Liu W, et al. Interspecific Bacterial Interactions are Reflected in Multispecies Biofilm Spatial Organization. Frontiers in microbiology. 2016;7:1366. doi: 10.3389/fmicb.2016.01366. [DOI] [PMC free article] [PubMed] [Google Scholar]
- 86.Rudkjobing VB, et al. The microorganisms in chronically infected end-stage and non-end-stage cystic fibrosis patients. FEMS immunology and medical microbiology. 2012;65:236–244. doi: 10.1111/j.1574-695X.2011.00925.x. [DOI] [PubMed] [Google Scholar]
- 87.Sibley CD, et al. The Streptococcus milleri population of a cystic fibrosis clinic reveals patient specificity and intraspecies diversity. J Clin Microbiol. 2010;48:2592–2594. doi: 10.1128/JCM.00414-10. [DOI] [PMC free article] [PubMed] [Google Scholar]
- 88.Flynn KM, et al. Evolution of Ecological Diversity in Biofilms of Pseudomonas aeruginosa by Altered Cyclic Diguanylate Signaling. Journal of bacteriology. 2016;198:2608–2618. doi: 10.1128/JB.00048-16. [DOI] [PMC free article] [PubMed] [Google Scholar]
Associated Data
This section collects any data citations, data availability statements, or supplementary materials included in this article.
Supplementary Materials
Data Availability Statement
All data is available in this manuscript, the Supplemental Information or deposited in databases, as described in the manuscript.