

Abstract
This study aimed to investigate the effect of lnc-ITSN1-2 knockdown on cell proliferation, apoptosis, inflammation and mRNA expression patterns in rheumatoid arthritis (RA) fibroblast-like synoviocytes (FLS), and the correlation of its synovium tissue expression with disease risk, inflammatory cytokines and disease activity of RA. Control shRNA plasmids and lnc-ITSN1-2 shRNA plasmids were transfected into RA FLS, and then cell proliferation, apoptosis, inflammatory cytokines expressions were evaluated. Subsequently, mRNA sequencing and bioinformatics analyses were conducted, and rescue experiment of nucleotide-binding oligomerization domain 2 (NOD2) mRNA overexpression on alleviating the functions of lnc-ITSN1-2 was performed. Additionally, lnc-ITSN1-2 and NOD2 mRNA expressions in synovial tissue in 30 RA patients and 15 controls were measured. Lnc-ITSN1-2 expression was increased in RA FLS compared with normal FLS. Lnc-ITSN1-2 knockdown inhibited RA FLS proliferation and inflammation while promoted RA FLS apoptosis. mRNA sequencing and bioinformatics analyses revealed 144 upregulated and 98 downregulated genes by lnc-ITSN1-2 knockdown, which were enriched in regulating inflammatory responses and cytokines related pathways. NOD2 was selected for rescue experiment, which disclosed that upregulating NOD2 alleviated the effect of lnc-ITSN1-2 knockdown on cell proliferation, apoptosis and inflammation in RA FLS. In addition, synovial tissue lnc-ITSN1-2 positively associated with NOD2 mRNA, and both of them positively correlated with disease risk, inflammation and activity of RA. Downregulation of lnc-ITSN1-2 correlates with decreased disease risk and activity of RA, and reduces RA FLS proliferation and inflammation via regulating NOD2/RIP2 signaling pathway.
Keywords: Rheumatoid arthritis, fibroblast-like synoviocytes, lnc-ITSN1-2, NOD2, proliferation, apoptosis, inflammation
Introduction
Rheumatoid arthritis (RA) is a chronic inflammatory disease that affects approximately one percent of the population worldwide, and it burdens the patients in regard with their life and occupation due to cartilage and bone damages, the extraarticular manifestations, as well as an unsatisfactory rate of full remissions [1,2]. RA has a genetic predisposition representing as a higher risk for patients with a family history to develop RA, and also presents with a heritability of 40% to 65% for seropositive RA. Furthermore, accumulating studies have revealed a more comprehensive understanding of RA genetics, including the promising roles of non-coding RNAs in participation in RA pathogenesis [3-6].
Long non-coding RNAs (lncRNAs), a class of non-coding RNAs that are longer than 200 bases and have almost no protein-coding function, present with very low abundance in animals and human, however, they have diversified capacities such as maintaining telomere stability and mediating nuclear architecture and transcription [7,8]. More importantly, recent studies suggest that lncRNAs play critical roles in RA etiology, for instance, lnc-GAPLINC increases the tumor-like behaviors of fibroblast-like synoviocytes (FLS) through sponging miR-382-5p and miR-575 [4]. As to lnc-ITSN1-2, a lncRNA that locates on chromosome 21 with a start site at 33943624 and an end site at 33969598 (http://www.noncode.org), it has been discovered to be upregulated in RA patients and correlate with elevated disease activity and more severe inflammation in our previous study, indicating the potential role of lnc-ITSN1-2 in RA development and progression [9]. However, the detailed mechanisms of lnc-ITSN1-2 in RA pathology and the possibility of lnc-ITSN1-2 as a treatment target for RA is completely unknown. Thus, this present study aimed to investigate the effect of lnc-ITSN1-2 knockdown on cell proliferation, apoptosis, inflammation and mRNA expression patterns in RA FLS, and to explore the correlation of its synovium tissue expression with disease risk, inflammatory cytokines and disease activity of RA.
Methods
Ethics approval
This study was approved by the Ethics Review Board of ShangHai GuangHua Hospital of Integrated Traditional Chinese and Western Medicine, and all included RA patients as well as controls provided signed informed consents before enrollment.
Cell culture
Synovium tissues were obtained from RA patients underwent knee arthroscopy and controls who underwent knee joint surgery due to trauma, and then RA FLS and normal FLS were isolated according to a previously described method [10,11] and cultured in 90% Dulbecco’s modified Eagle’s medium (DMEM) (Gibco, USA, catalog number: 10569044) supplemented with 10% fetal bovine serum (FBS) (Gibco, USA, catalog number: 10099141) under 95% air and 5% CO2 at 37°C. Both RA FLS and normal FLS from passages 5-8 monolayer culture were used for the following experiments in this study.
Measurement of lnc-ITSN1-2 expression in RA FLS and normal FLS
After stably passaging, lnc-ITSN1-2 expression in RA FLS and normal FLS was detected by quantitative polymerase chain reaction (qPCR).
Plasmids construction and transfection
pEX-2 plasmids were used for the establishment of control shRNA plasmids and lnc-ITSN1-2 shRNA plasmids by Shanghai Gene Bio-Tech Company (Shanghai, China). Then control shRNA plasmids and lnc-ITSN1-2 shRNA plasmids were transfected into RA FLS to detect the comprehensive mechanism of lnc-ITSN1-2 knockdown in RA pathogenesis, and were accordingly divided into NC (-) group and ITSN1-2 (-) group. In addition, RA FLS without plasmids transfection were set as blank control (Blank group). For assessing the effect of upregulated lnc-ITSN1-2 on RA FLS cell functions, control overexpression and lnc-ITSN1-2 overexpression plasmids were transfected into RA FLS as NC (+) group and ITSN1-2 (+) group, respectively.
Measurement of RA FLS proliferation, apoptosis and inflammation after transfection
lnc-ITSN1-2 expression was detected at 48 h after transfection in each group by qPCR, and then RA FLS proliferation ability was detected at 0 h, 24 h, 48 h and 72 h after transfection in each group by Counting Kit-8 (CCK-8) (Sigma, USA, catalog number: 96992), and RA FLS apoptosis rate was detected at 48 h after transfection in each group by Annexin V (AV) apoptosis detection kit with propidium iodide (PI) (Invitrogen, USA, catalog number: BMS500FI-300). Besides, mRNA and protein expressions of inflammatory cytokines including IFN-γ, TNF-α, IL-10 and IL-17 were detected at 48 h after transfection in each group by qPCR and Western Blot.
mRNA sequencing process
Cells were harvested at 24 h after transfection in NC (-) group and ITSN1-2 (-) group, and total RNA was extracted using Trizol reagent (Invitrogen, USA, catalog number: 15596018), then RNA concentration, purity and integrity were assessed and the quality control was performed. Subsequently, mRNA was captured by Dynabeads Oligo (dT)25 (Thermo Fisher Scientific, USA, catalog number: 61005), the first and second strands of the cDNA were synthesized and library fragments were purified using AMPure XP system (Beckman Coulter, USA, catalog number: A63880). PCR assay and measurement of libraries quality were conducted using Bioanalyzer 2100 system (Agilent Technologies, USA, catalog number: G2938C), then clustering of index-coded samples was performed using HiSeq PE Cluster Kit v4 cBot (Illumina, USA, catalog number: PE-401-4001), and the libraries were sequenced on Illumina Hiseq X10 platform (Illumina, USA, catalog number: SY-412-1001) followed by that 150 bp paired-end reads were produced after cluster generation for mRNA. Automate quality control and adapter trimming were conducted using Trim Galore, Cutadapt and FastQC. Then the trimmed reads were mapped to the human genome Hg38 by Hisat2, and mapping quality control was conducted using RSeQC. Finally, the reads count of mRNA were then calculated using FeatureCounts.
Bioinformatics analysis
The mRNAs which were identified in 50% or above samples were included in the analysis, and raw reads count was normalized and logarithmically transformed for bioinformatics analysis. The bioinformatics analysis was conducted using R software (Version 3.3.3). In brief, differentially expressed genes (DEGs) were detected using DeSeq2 package, and statistical significance was defined as adjusted P value < 0.05, and the biological significance was defined as a difference of at least abs (log2 (fold change (FC))) > 0.5, which were exhibited as Valcano spot; Gene Ontology (GO) and Kyoto Encyclopedia of Genes and Genomes (KEGG) enrichment analysis were performed using DAVID web servers. In addition, we have uploaded our data for RNA sequencing and bioinformatics analysis on the GEO database with No. GSE129934 (https://www.ncbi.nlm.nih.gov/geo/query/acc.cgi?acc=GSE129934).
Measurement of potential target gene (NOD2) of lnc-ITSN1-2 in RA FLS
Nucleotide-binding oligomerization domain 2 (NOD2) was observed to be one of the top DEGs in ITSN1-2 (-) group compared to NC (-) group (Log2FC = -6.8, P = 1.66E-11), and NOD2 is well-known to be critical in regulating many inflammatory diseases such as inflammatory bowel disease, systemic lupus erythematosus and RA as well [12-14]. Thus we then detected NOD2 mRNA and protein expressions at 48 h after transfection in each group by qPCR and Western Blot.
Rescue experiment
To validate whether lnc-ITSN1-2 functioned via regulating NOD2 in RA FLS, rescue experiments were conducted as follows: (1) pGPU6 and pEX-2 plasmids were used for establishment of control overexpression, NOD2 overexpression, control shRNA, and lnc-ITSN1-2 shRNA plasmids by Shanghai Gene Bio-Tech Company (Shanghai, China); (2) control overexpression & control shRNA plasmids were transfected into RA FLS as NC group, control overexpression & lnc-ITSN1-2 shRNA plasmids were transfected into RA FLS as ITSN1-2 (-) group, NOD2 overexpression & lnc-ITSN1-2 shRNA plasmids were transfected into RA FLS as NOD2 (+) & ITSN1-2 (-) group; (3) lnc-ITSN1-2 expression at each group was detected at 48 h after transfection by qPCR. (4) We further hypothesized that lnc-ITSN1-2 functioned via regulating NOD2 and its downstream genes and signaling (NOD2-RIP2 signaling pathway which is verified to be greatly involved in the inflammation and immune regulation [14-16]), thus NOD2 and RIP2 expressions were detected at 48 h after transfection in each group by qPCR and Western Blot.
Measurement of RA FLS proliferation, apoptosis and inflammation in rescue experiment
RA FLS proliferation ability was detected at 0 h, 24 h, 48 h and 72 h after transfection in each group by CCK-8 (Sigma, USA, catalog nubmer: 96992), and RA FLS apoptosis rate was detected at 48 h after transfection in each group by AV apoptosis detection kit with PI (Invitrogen, USA, catalog number: BMS500FI-300), Finally, mRNA and protein expressions of inflammatory cytokines including IFN-γ, TNF-α, IL-10 and IL-17 were detected at 48 h after transfection in each group by qPCR and Western Blot.
Measurement of lnc-ITSN1-2 and NOD2 in synovium tissues from RA patients and controls
Synovium tissues were obtained from 30 RA patients underwent knee arthroscopy and 15 controls underwent knee joint surgery due to trauma, and then lnc-ITSN1-2 and NOD2 mRNA expressions in synovium tissues were detected by qPCR. The inclusion criteria of RA patients were: Diagnosed as RA according to 1987 American College of Rheumatology (ACR) classification of RA, age above 18 years, severe knee symptoms underwent knee arthroscopy. The inclusion criteria of controls were: trauma of knee joint underwent surgery, without history of knee degeneration disease or inflammatory diseases, without history of knee surgery.
RA patients’ data collection
Age, gender, body mass index (BMI), disease duration, tender joint count (TJC), swollen joint count (SJC); erythrocyte sedimentation rate (ESR), C-reactive protein (CRP) and disease activity score in 28 joints (DAS28) (based on ESR and CRP respectively), rheumatoid factor (RF) status, anticitrullinated protein antibodies (ACPA) status in RA patients were recorded, and their correlations with lnc-ITSN1-2 and NOD2 were analyzed.
Measurement of inflammatory cytokines in synovium tissues from RA patients
Inflammatory cytokines in synovium tissues from RA patients including TNF-α, IL-1β, IL-6, IL-10 and IL-17 were detected by qPCR, and their correlations with lnc-ITSN1-2 and NOD2 were analyzed.
qPCR
Total RNA was extracted from cells or tissues using Trizol reagent (Invitrogen, USA, catalog number: 15596018), then RNA concentration, purity and integrity were assessed and the quality control was performed. The total RNA was reversely transcribed into cDNA by PrimeScript™ RT reagent Kit (TAKARA, Japan, catalog number: RR037A), and QuantiNova SYBR Green PCR Kit (Qiagen, German, catalog number: 208054) was used to perform PCR. Subsequently, GAPDH was used as an internal reference for lncRNA and mRNA detection, and the results were calculated according to 2-ΔΔCt formula. The sequences of primers that were used in qPCR were listed in Table 1.
Table 1.
List of primers
| Gene | Forward Primer (5’-3’) | Reverse Primer (5’-3’) |
|---|---|---|
| Lnc-ITSN1-2 | GCTTCACTCGCTTGCTTACA | GGTTCTGTCTTGCCTTCTGTT |
| TNF-α | TGTTCCTCAGCCTCTTCTCCTT | CTCTCAGCTCCACGCCATTG |
| IL-1β | GGACAGGATATGGAGCAACAAG | TTCAACACGCAGGACAGGTA |
| IL-6 | CTTCGGTCCAGTTGCCTTCTC | AGGTGAGTGGCTGTCTGTGT |
| IL-10 | CTCTGTTGCCTGGTCCTCCT | CGCCTTGATGTCTGGGTCTTG |
| IL-17 | TTACTACAACCGATCCACCTCAC | CCACGGACACCAGTATCTTCTC |
| IFN-γ | TCGGTAACTGACTTGAATGTCCA | TCGCTTCCCTGTTTTAGCTGC |
| NOD2 | GCTCAGTCTCGCTTCCTCAG | CAGTGTCCGCATCGTCATTG |
| RIP2 | CTGAATATCCTGATGTTGCTTGGC | TTGCTACTTCGTGACTGTGAGAG |
| GAPDH | GACCACAGTCCATGCCATCAC | ACGCCTGCTTCACCACCTT |
Western blot
Total protein was extracted from cells, and then BCA kit (Thermo Fisher Scientific, USA, catalog number: 23227) was used for evaluating total protein concentration, afterward, the standard curve was made to calculate the concentration. Then the total protein was transferred to the sodium dodecyl sulfate polyacrylamide gel electrophoresis (SDS-PAGE) for electrophoresis that was performed to separate the total protein, and then the separated total protein was transferred to polyvinylidene fluoride membranes (Millipore, Bedford, USA, catalog number: IPVH00010) and blocked. Subsequently, the primary antibody was added and was incubated under 4°C overnight, and then the secondary antibody was added, which was incubated in 37°C for 1 h. Then the bands were exposed under X-ray using Gel Imager (Biorad, USA) and an ECL kit was used to visualize the image. Antibodies used in Western Blot were listed in Table 2.
Table 2.
List of antibodies
| Antibody | Company | Dilution |
|---|---|---|
| Primary Antibody | ||
| IFN-γ Rabbit mAb | CST (USA) | 1:1000 |
| TNF-α Rabbit mAb | CST (USA) | 1:1000 |
| IL-10 Rabbit mAb | Abcam (UK) | 1:2000 |
| IL-17 Rabbit mAb | Abcam (UK) | 1:2000 |
| CARD15 (NOD2) Rabbit pAb | Abcam (UK) | 1:1000 |
| RIP2 Rabbit pAb | Abcam (UK) | 1:1000 |
| GAPDH Rabbit mAb | CST (USA) | 1:1000 |
| Secondary Antibody | ||
| Goat Anti-Rabbit IgG H&L (HRP) | CST (USA) | 1:4000 |
CCK-8
The cell suspension of RA FLS was isolated and transferred into a 96 well plate, which was incubated in a 37°C incubator for 2-4 h. Afterward, 10 μL CCK-8 reagent (Sigma, USA, catalog number: 96992) and 90 μL DMEM (Gibco, USA, catalog number: 10569044) were added into every plate, which was incubated with 5% CO2 in 37°C for 2 h. Then the cell proliferation was evaluated by reading the optical density (OD) value in a microplate reader (BioTek, USA, catalog number: 800TS).
AV/PI
The RA FLS were digested by 0.25% trypsin (Gibco, USA, catalog number: 25200056) and washed by 1 mL precooled phosphate buffer (PBS) for twice, and were subsequently centrifuged at 1000 rpm for 5 mins. Then 100 μL binding buffer was added and the cell were re-suspended. Afterward, 5 μL AV (Invitrogen, USA, catalog number: BMS500FI-300) was added, which was subsequently transferred into a flow cytometry tube with 385 μL binding buffer. After that, 10 μL PI (Invitrogen, USA, catalog number: BMS500FI-300) was added and incubated for 15 mins, then the flow cytometry assay was performed.
ELISA
The RA FLS cell supernatant was obtained for the detections of secreting inflammatory cytokines expressions, and the expressions of IFN-γ, TNF-α, IL-10 and IL-17 in cell supernatant were assessed by IFN gamma Human enzyme-linked immuno sorbent assay (ELISA) Kit (Invitrogen, USA, catalog number: BMS228), TNF alpha Human Uncoated ELISA Kit with Plates (Invitrogen, USA, catalog number: 88-7346-22), IL-10 Human ELISA Kit (Invitrogen, USA, catalog number: BMS215-2) and IL-17A Human ELISA Kit (Invitrogen, USA, catalog number: BMS2017), respectively.
Methods of cell apoptosis induced by TRAIL
After the cell culture of RA FLS as previously described, the control shRNA and lnc-ITNS1-2 shRNA were transfected into the RA FLS, and then at 48 h posttransfection, the RA FLS were co-cultured with 10 μl 100 ng/ml TNF-related apoptosis-inducing ligand (TRAIL) (Sigma, USA, catalog number: T9701) for 24 h.
Statistical analysis
Statistical analysis was conducted using SPSS 22.0 Software (IBM, USA) and GraphPad 6.01 Software (GraphPad Int., USA). Data were presented as mean ± standard deviation, median (1/4-3/4 quarters) or count (percentage). Comparison between two groups was detected by t test or Wilcoxon rank sum test. The correlation was detected by Spearman correlation test. Value of parameters for distinguishing RA patients from controls was detected by receiver operating characteristic (ROC) curve and assessed by area under curve (AUC). P < 0.05 was considered as significant.
Results
Effect of lnc-ITSN1-2 knockdown on RA FLS proliferation and apoptosis
Lnc-ITSN1-2 expression in RA FLS was increased compared with that in normal FLS (P < 0.01) (Figure 1A). At 48 h after transfection, lnc-ITSN1-2 was downregulated in ITSN1-2 (-) group compared with NC (-) group (P < 0.01), which implied the successful transfection in RA FLS (Figure 1B). Cell proliferation at 48 h (P < 0.05) and 72 h (P < 0.05) was inhibited in ITSN1-2 (-) group compared with NC (-) group (Figure 1C), while cell apoptosis at 48 h was promoted in ITSN1-2 (-) group compared with NC (-) group (P < 0.01) (Figure 1D, 1E). These results indicated that lnc-ITSN1-2 knockdown inhibited cell proliferation while promoted apoptosis in RA FLS.
Figure 1.
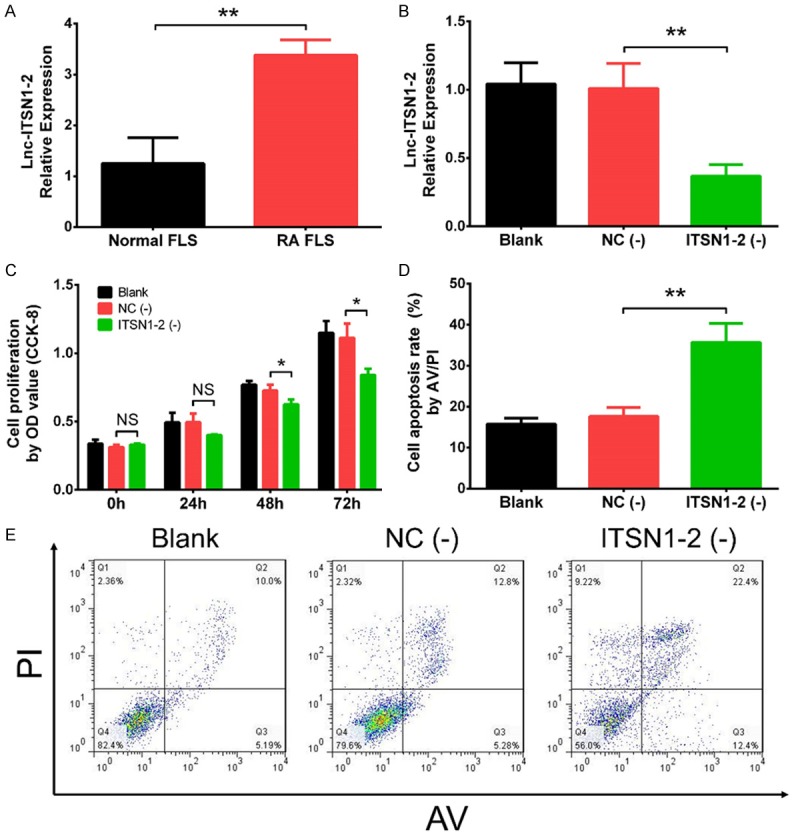
Effect of lnc-ITSN1-2 knockdown on RA proliferation and apoptosis. Lnc-ITSN1-2 expression in RA FLS and normal FLS (A), lnc-ITSN1-2 expression in RA FLS after transfections (B), effect of lnc-ITNS1-2 knockdown on proliferation (C) and apoptosis (D, E) in RA FLS. Comparison between two groups was detected by t test. P < 0.05 was considered as significant. *P < 0.05; **P < 0.01. RA, rheumatoid arthritis; FLS, fibroblast-like synoviocytes.
Effect of lnc-ITSN1-2 knockdown on inflammatory cytokines expressions in RA FLS
IFN-γ (P < 0.01) (Figure 2A), TNF-α (P < 0.05) (Figure 2B) and IL-17 (P < 0.01) (Figure 2D) mRNA expressions were reduced in ITSN1-2 (-) group compared with NC (-) group, while IL-10 (P < 0.01) (Figure 2C) mRNA expression was elevated in ITSN1-2 (-) group compared with NC (-) group. In addition, the protein expressions of IFN-γ, TNF-α, IL-10 and IL-17 displayed the same trends as their mRNA expressions did (Figure 2E). In addition, the expressions of IFN-γ (P < 0.05) (Supplementary Figure 1A), TNF-α (P < 0.05) (Supplementary Figure 1B) and IL-17 (P < 0.01) (Supplementary Figure 1D) in cell supernatant were inhibited, while the IL-10 expression (P < 0.01) (Supplementary Figure 1C) in cell supernatant was promoted in ITSN1-2 (-) group compared with NC (-) group. These data revealed that lnc-ITSN1-2 knockdown reduced RA FLS inflammation.
Figure 2.

Effect of lnc-ITSN1-2 knockdown on inflammatory cytokines expressions in RA FLS. The effect of lnc-ITSN1-2 on expressions of IFN-γ (A), TNF-α (B), IL-10 (C) and IL-17 (D) mRNA and their protein expressions (E). Comparison between two groups was detected by t test. P < 0.05 was considered as significant. *P < 0.05; **P < 0.01. RA, rheumatoid arthritis; FLS, fibroblast-like synoviocytes.
Effect of lnc-ITSN1-2 knockdown on regulating mRNA expression profiles in RA FLS
Bioinformatics analysis revealed that there were 144 upregulated DEGs and 98 downregulated DEGs in ITSN1 (-) group compared to NC (-) group (Figure 3A), and the top 10 upregulated and 10 downregulated DEGs in ITSN1-2 (-) group compared to NC (-) group by the rank of absolute value of Log2FC were shown in Table 3. The further GO enrichment analysis displayed that the total 242 DEGs were enriched in biological process, such as negative regulation of inflammatory response, response to lipopolysaccharide and chemokine mediated signaling pathway; cellular components, such as extracellular space, extracellular region and cell surface; and molecular function, such as chemokine activity, protein kinase binding and cytokine activity (Figure 3B). In addition, KEGG enrichment analysis displayed that the total 242 DEGs were associated with various pathways related to RA, such as cytokine-cytokine receptor interaction, NOD-like receptor signaling pathways and TNF signaling pathway (Figure 3C). These data comprehensively exhibited the potential molecular mechanism of lnc-ITSN1-2 knockdown in RA FLS.
Figure 3.

Bioinformatics analysis. Volcano plot (A), GO enrichment analysis (B) and KEGG enrichment analysis (C) of dysregulated mRNAs by lnc-ITSN1-2 knockdown. DEGs were detected using DeSeq2 package, and statistical significance was defined as adjusted P value < 0.05, and the biological significance was defined as a difference of at least abs (log2 (fold change (FC))) > 0.5, which were exhibited as Valcano spot. GO, Gene Ontology; KEGG, Kyoko Encyclopedia of Genes and Genomes; RA, rheumatoid arthritis; DEGs, differentially expressed genes.
Table 3.
List of top 10 upregulated and 10 downregulated DEGs between ITSN1-2 (-) and NC (-) groups
| Gene | Gene-ID | Log2FC | P value | Trend |
|---|---|---|---|---|
| UBE2E2 | ENSG00000182247 | 12.0566 | 0.04348 | UP |
| PIK3CD | ENSG00000171608 | 6.5378 | 0.000039 | UP |
| C16orf58 | ENSG00000140688 | 6.41762 | 0.028773 | UP |
| IL17RB | ENSG00000056736 | 6.0525 | 2.14E-09 | UP |
| IL36A | ENSG00000136694 | 5.57883 | 1.95E-06 | UP |
| CCL18 | ENSG00000275385 | 5.35261 | 0.001946 | UP |
| STAT3 | ENSG00000168610 | 5.0392 | 0.00085 | UP |
| TNFAIP3 | ENSG00000118503 | 4.85194 | 3.97E-06 | UP |
| GBP5 | ENSG00000154451 | 4.77668 | 2.20E-11 | UP |
| CASP8 | ENSG00000064012 | 4.30634 | 1.44E-09 | UP |
| KDM7A | ENSG00000006459 | -6.9125 | 0.007105 | DOWN |
| NOD2 | ENSG00000167207 | -6.8241 | 1.66E-11 | DOWN |
| DFFA | ENSG00000160049 | -6.81217 | 1.93E-06 | DOWN |
| NLRP2 | ENSG00000022556 | -6.69711 | 0.000881 | DOWN |
| FFAR2 | ENSG00000126262 | -6.33062 | 0.000351 | DOWN |
| CASP9 | ENSG00000132906 | -5.8744 | 0.000109 | DOWN |
| PPARD | ENSG00000112033 | -5.48254 | 6.87E-07 | DOWN |
| PABPN1 | ENSG00000100836 | -5.44491 | 0.003851 | DOWN |
| TP53BP2 | ENSG00000143514 | -5.23253 | 1.31E-12 | DOWN |
| FBP2 | ENSG00000130957 | -5.07128 | 0.002112 | DOWN |
Top 10 upregulated and 10 downregulated DEGs in ITSN1-2 (-) group compared to NC (-) group were selected by the rank of absolute value of Log2FC. DEGs, deferentially expressed genes; FC, fold change.
Rescue experiments
NOD2 was observed to be one of the top DEGs in ITSN1-2 (-) group compared to NC (-) group (Log2FC = -6.8, P = 1.66E-11) (Table 3), and NOD2 was well-known to be critical in regulating many inflammatory diseases such as inflammatory bowel disease, systemic lupus erythematosus and RA as well [12-14]. Thus we next detected the effect of lnc-ITSN1-2 knockdown on regulating NOD2 mRNA and protein expressions, which disclosed that NOD2 mRNA expression was downregulated in ITSN1-2 (-) group compared with NC (-) group (P < 0.01) (Figure 4A), and NOD2 protein expression was also reduced in ITSN1-2 (-) group compared with NC (-) group (Figure 4B). In order to validate whether lnc-ITSN1-2 functioned via regulating NOD2 in RA FLS, rescue experiment was conducted. We observed that lnc-ITSN1-2 expression was declined in ITSN1-2 (-) group compared with NC group (P < 0.01) while was of no difference between ITSN1-2 (-) group and NOD2 (+) & ITSN1-2 (-) group (P > 0.05), suggesting the transfections were successful and NOD2 overexpression had no effect on lnc-ITSN1-2 expression (Figure 4C). Then the NOD2 (Figure 4D) and RIP2 (Figure 4E) mRNA expressions were upregulated in NOD2 (+) & ITSN1-2 (-) group compared with ITSN1-2 (-) group (P < 0.01 and P < 0.05, respectively), while was reduced in ITSN1-2 (-) group than that in NC group (P < 0.01 and P < 0.01, respectively). The protein expressions of NOD2 and RIP2 also showed the same trends as the NOD2 and RIP2 mRNAs expressions did (Figure 4F). These implied that lnc-ITSN1-2 knockdown inhibited NOD2/RIP2 signaling pathway and NOD2 overexpression attenuated the regulatory effect. Moreover, cell proliferation at 72 h after transfection was enhanced in NOD2 (+) & ITSN1-2 (-) group compared to ITSN1-2 (-) group (P < 0.05) (Figure 4G), while cell apoptosis at 48 h was repressed in NOD2 (+) & ITSN1-2 (-) group compared with ITSN1-2 (-) group (P < 0.05) (Figure 4H, 4I). In addition, IFN-γ (P < 0.05) (Figure 5A), TNF-α (P < 0.01) (Figure 5B), and IL-17 (P < 0.05) (Figure 5D) mRNA expressions were elevated while IL-10 (P < 0.05) (Figure 5C) mRNA expression was decreased in NOD2 (+) & ITSN1-2 (-) group compared to ITSN1-2 (-) group, and their protein expressions disclosed similar trends (Figure 5E). These data indicated that lnc-ITSN1-2 knockdown regulated cell proliferation, apoptosis and inflammation via inhibiting ROD2/RIP2 signaling pathway in RA FLS.
Figure 4.
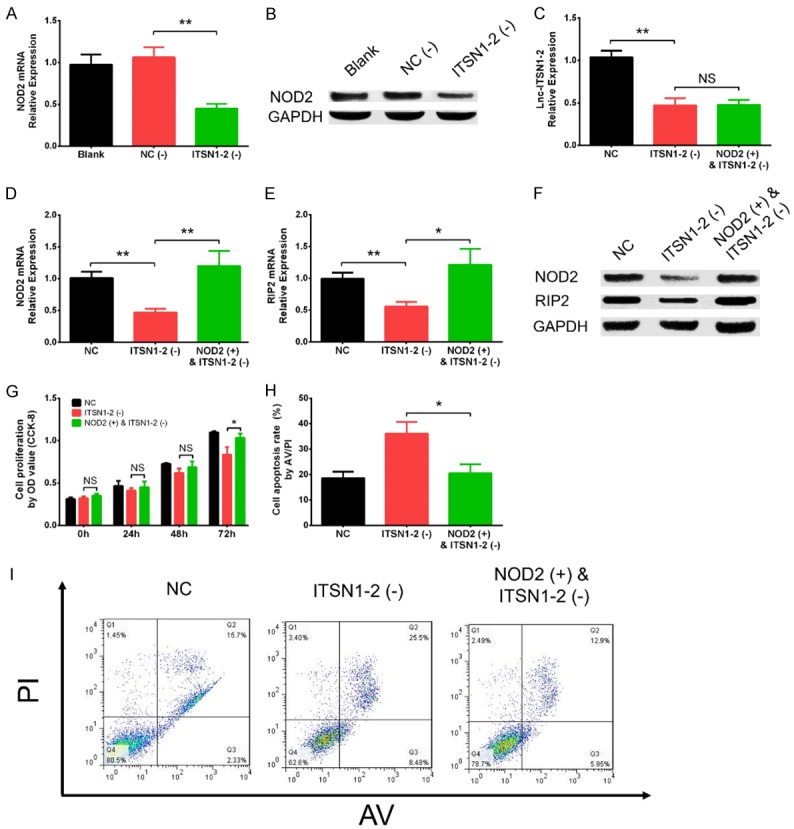
Effect of lnc-ITSN1-2 knockdown and NOD2 overexpression on RA FLS proliferation and apoptosis in rescue experiments. Effect of lnc-ITSN1-2 knockdown on NOD2 mRNA (A) and protein (B) expressions, effect of NOD2 overexpression on lnc-ITSN1-2 expression (C), NOD2 expression after transfections (D), effect of NOD2 overexpression & lnc-ITSN1-2 knockdown on RIP2 mRNA expression (E), protein expression of NOD2 and RIP2 after transfections (F), effect of NO2 overexpression and lnc-ITSN1-2 knockdown on proliferation (G) and apoptosis in RA FLS (H, I). Comparison between two groups was detected by t test. P < 0.05 was considered as significant. *P < 0.05; **P < 0.01. RA, rheumatoid arthritis; FLS, fibroblast-like synoviocytes; NOD2, nucleotide-binding oligomerization domain 2.
Figure 5.
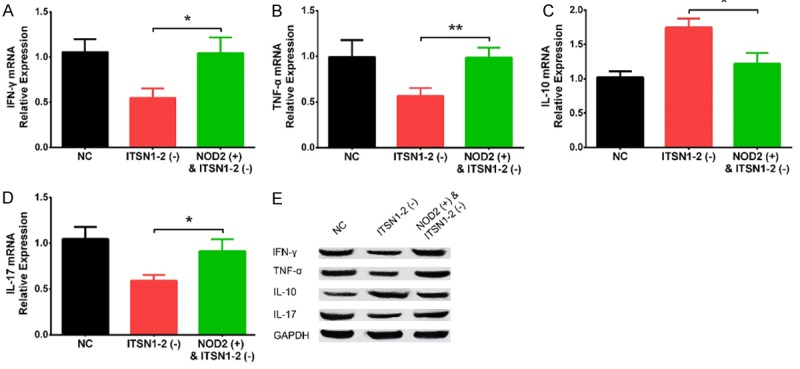
Effect of lnc-ITSN1-2 knockdown and NOD2 overexpression on inflammation cytokines expressions in RA FLS. Effect of lnc-ITSN1-2 knockdown and NOD2 overexpression on IFN-γ (A), TNF-α (B), IL-10 (C) and IL-17 (D) mRNA expressions and protein expressions (E). Comparison between two groups was detected by t test. P < 0.05 was considered as significant. *P < 0.05; **P < 0.01. RA, rheumatoid arthritis; FLS, fibroblast-like synoviocytes; NOD2, nucleotide-binding oligomerization domain 2.
Characteristics of RA patients
The correlation of synovial tissue expression of lnc-ITSN1-2 and NOD2 with RA risk, inflammation and activity were further explored in clinical study. Thirty RA patients with the mean age of 55.2 ± 13.2 years were included, in whom there were 6 (20.0%) males and 24 (80.0%) females (Table 4). In addition, the mean BMI value was 22.7 ± 3.4 kg/m2. Meanwhile, the median disease duration, number of patients with RF positive, number of patients with ACPA positive, median TJC, median SJC, median ESR, median CRP, mean DAS28 score (ESR) and mean DAS28 score (CRP) were 9 (7-11) years, 24 (80.0%), 23 (76.7%), 7 (5-10) joints, 7 (5-8) joints, 44.6 (22.7-65.4) mm/h, 62.3 (35.9-114.2) mg/l, 5.28 ± 0.67 and 5.24 ± 0.56, respectively. Furthermore, the number of patients receiving TNF-α inhibitors combined with methotrexate, TNF-α inhibitors combined with leflunomide, leflunomide, IL-6 inhibitors, dual DMARDs therapy and triple DMARDs therapy were 2 (6.67%), 2 (6.67%), 1 (3.33%), 10 (33.3%) and 15 (50.0%), respectively.
Table 4.
Characteristics of RA patients
| Parameters | RA patients (N = 30) |
|---|---|
| Age (years) | 55.2 ± 13.2 |
| Gender (n/%) | |
| Male | 6 (20.0) |
| Female | 24 (80.0) |
| BMI (kg/m2) | 22.7±3.4 |
| Disease duration (years) | 9 (7-11) |
| RF positive (n/%) | 24 (80.0) |
| ACPA positive (n/%) | 23 (76.7) |
| TJC (joints) | 7 (5-10) |
| SJC (joints) | 7 (5-8) |
| ESR (mm/h) | 44.6 (22.7-65.4) |
| CRP (mg/l) | 62.3 (35.9-114.2) |
| DAS28 score (ESR) | 5.28 ± 0.67 |
| DAS28 score (CRP) | 5.24 ± 0.56 |
| Treatments | |
| TNF-α inhibitors combined with methotrexate (%) | 2 (6.67%) |
| TNF-α inhibitors combined with Leflunomide (%) | 2 (6.67%) |
| IL-6 inhibitors (%) | 1 (3.33%) |
| Dual DMARDs therapy (%) | 10 (33.3%) |
| Triple DMARDs therapy (%) | 15 (50.0%) |
Data were presented as mean value ± standard deviation, median value (25th-75th quantiles) or count (percentage). RA, rheumatoid arthritis; BMI, body mass index; RF, rheumatoid factor; ACPA, anti-citrullinated protein antibody; TJC, tender joint count; SJC, swollen joint count; ESR, erythrocyte sedimentation rate; CRP, C-reactive protein; DAS28, disease activity score in 28 joints; TNF-α, tumor necrosis factor; IL, interleukin.
Synovial tissue expressions of lnc-ITSN1-2 and NOD2 in RA and controls
Lnc-ITSN1-2 expression (P < 0.001) (Figure 6A) and NOD2 mRNA expression (P < 0.001) (Figure 6B) in synovial tissue were both increased in RA patients compared with controls. Furthermore, the ROC curves showed that synovial tissue lnc-ITSN1-2 had good value in predicting RA risk with AUC of 0.873 (95% CI: 0.760-0.986) (Figure 6C), so did synovial tissue NOD2 mRNA with AUC of 0.800 (95% CI: 0.673-0.927) (Figure 6D). And synovial tissue lnc-ITSN1-2 was positively correlated with NOD2 mRNA in RA patients (P = 0.002) (Figure 6E). These data further implied that lnc-ITSN1-2 and NOD2 were closely involved in the development of RA.
Figure 6.
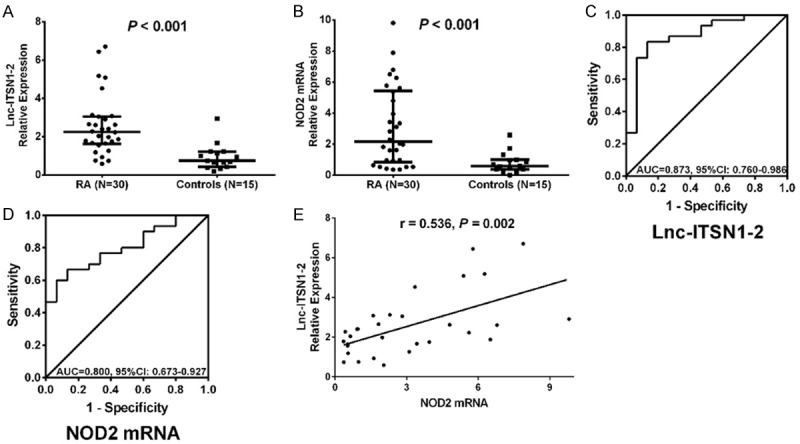
Lnc-ITSN1-2 and NOD2 mRNA expressions in synovial tissue for predicting RA risk. Lnc-ITSN1-2 expression in RA patients and controls (A), NOD2 expression in RA patients and controls (B), ROC curve of the predictive value of lnc-ITSN1-2 for RA risk (C), ROC curve of the predictive value of NOD2 mRNA expression for RA risk (D) and the correlation of lnc-ITSN1-2 expression with NOD2 mRNA expression in RA patients (E). Correlation was detected by Spearman correlation test. Value of parameters for distinguishing RA patients from controls was detected by ROC curve and assessed by AUC. P < 0.05 was considered as significant. RA, rheumatoid arthritis; NOD2, nucleotide-binding oligomerization domain 2; ROC, receiver operating characteristic; AUC, area under curve.
Correlations of lnc-ITSN1-2 and NOD2 with disease activity and inflammation in synovial tissue in RA patients
Lnc-ITSN1-2 in synovial tissue was positively correlated with CRP (P = 0.0024) (Figure 7D) and DAS28 score (CRP) (P < 0.001) (Figure 7F), while was not associated with TJC (P = 0.098) (Figure 7A), SJC (P = 0.056) (Figure 7B), ESR (P = 0.947) (Figure 7C) or DAS28 score (ESR) (P = 0.081) (Figure 7E) in RA patients. And lnc-ITSN1-2 expression was positively associated with TNF-α (P = 0.043) (Figure 8A) and IL-17 (P = 0.030) (Figure 8E) expressions, while negatively correlated with IL-10 expression (P = 0.001) (Figure 8D); additionally, lnc-ITSN1-2 expression was not correlated with IL-1β (P = 0.054) (Figure 8B) and IL-6 (P = 0.066) (Figure 8C) expressions. Moreover, NOD2 mRNA expression was positively associated with TJC (P = 0.044) (Figure 9A), SJC (P = 0.015) (Figure 9B), CRP (P = 0.008) (Figure 9D) and DAS28 score (P < 0.001) (Figure 9F) (CRP) while was not correlated with ESR (P = 0.702) (Figure 8C) and DAS28 score (ESR) (P = 0.075) (Figure 9E). NOD2 mRNA expression was positively correlated with TNF-α (P = 0.003) (Figure 10A), IL-1β (P = 0.028) (Figure 10B) and IL-17 (P = 0.001) (Figure 10D) expressions while was negatively associated with IL-10 (P = 0.003) (Figure 10D) expression. These data further implied that lnc-ITSN1-2 and NOD2 were closely involved in the inflammation activation and disease progression of RA.
Figure 7.
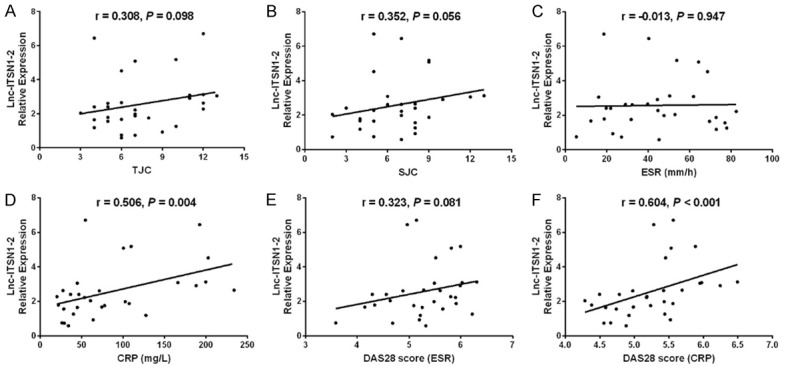
Correlation of synovial tissue lnc-ITSN1-2 with RA disease activity. Correlation of lnc-ITSN1-2 expression in synovial tissue with TJC (A), SJC (B), ESR (C), CRP (D), DAS28 (ESR) (E) and DAS28 score (CRP) (F). Correlation was detected by Spearman correlation test. P < 0.05 was considered as significant. RA, rheumatoid arthritis; CRP, C-reactive protein; DAS28, disease activity score in 28 joints; TJC, tender joint count; SJC, swollen joint count; ESR, erythrocyte sedimentation rate.
Figure 8.
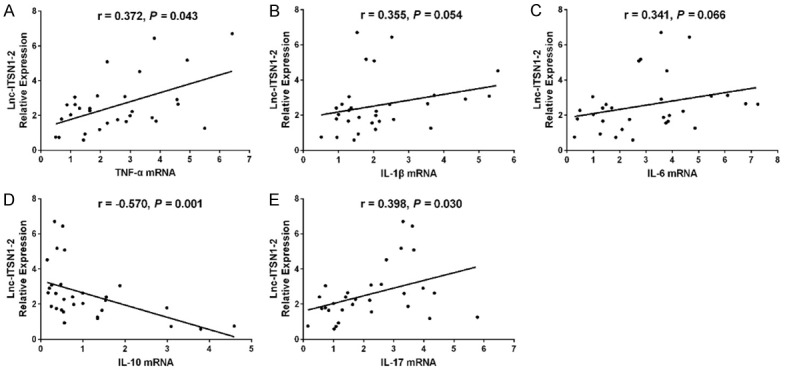
Correlation of synovial tissue lnc-ITSN1-2 with inflammatory cytokines expressions. Correlation of lnc-ITSN1-2 expression in synovial tissue was positively associated with TNF-α (A), IL-1β (B), IL-6 (C), IL-10 (D) and IL-17 (E) mRNA expressions. Correlation was detected by Spearman correlation test. P < 0.05 was considered as significant. TNF, tumor necrosis factor; IL, interleukin.
Figure 9.

Association of synovial tissue NOD2 mRNA with disease activity. The correlation of NOD2 mRNA expression in synovial tissue with TJC (A), SJC (B), ESR (C), CRP (D), DAS28 (ESR) (E) and DAS28 (CRP) (F) in RA patients. Correlation was detected by Spearman correlation test. P < 0.05 was considered as significant. NOD2, nucleotide-binding oligomerization domain 2; TJC, tender joint count; SJC, swollen joint count; CRP, C-reactive protein; DAS28, disease activity score in 28 joints; ESR, erythrocyte sedimentation rate.
Figure 10.
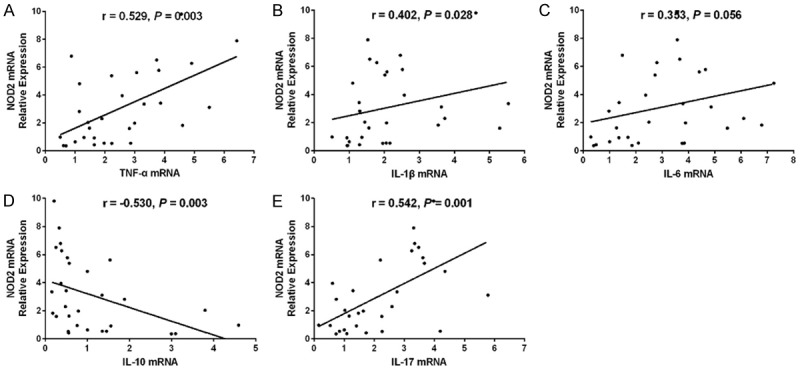
Association of synovial tissue NOD2 mRNA with inflammatory cytokines expressions. Association of NOD2 mRNA expression in synovial tissue with TNF-α (A), IL-1β (B) IL-10 (C) and IL-17 (D) with IL-6 mRNA (E) expressions. Correlation was detected by Spearman correlation test. P < 0.05 was considered as significant. NOD2, nucleotide-binding oligomerization domain 2; TNF, tumor necrosis factor; IL, interleukin.
Effect of lnc-ITSN1-2 overexpression on RA FLS proliferation and apoptosis
The cell proliferation of RA FLS was increased in ITSN1-2 (+) group compared with NC (+) group at 48 h (P < 0.05) and 72 h (P < 0.05) after transfections (Supplementary Figure 2A). As for cell apoptosis, it was declined in ITSN1-2 (+) group than that in NC (+) group (Supplementary Figure 2B). These results showed that overexpression of lnc-ITSN1-2 promoted cell proliferation while inhibited cell apoptosis in RA FLS.
Effect of lnc-ITSN1-2 knockdown on cell apoptosis induced by TRAIL in RA FLS
After transfections and the subsequent co-culture with TRAIL, the cell apoptosis of RA FLS was enhanced in ITSN1-2 (-) group compared to NC (-) group (P < 0.01) (Supplementary Figure 3A, 3B).
Discussion
In this study we found that (1) lnc-ITSN1-2 knockdown inhibited cell proliferation and inflammation while promoted cell apoptosis in RA FLS; (2) bioinformatics analysis revealed 144 upregulated DEGs and 98 downregulated DEGs by lnc-ITSN1-2 knockdown, which were solely enriched in negative regulation of inflammatory response, extracellular space and chemokine activity, and were mainly correlated with cytokine-cytokine receptor interaction pathways; (3) further rescue experiments disclosed that lnc-ITSN1-2 knockdown mediated cell proliferation, apoptosis and inflammation by inhibiting NOD2/RIP2 signaling pathway; (4) synovial tissue lnc-ITSN1-2 was up-regulated and positively correlated with NOD2 mRNA expression, disease activity and inflammation in RA patients; in addition, synovial tissue NOD2 mRNA expression was also upregulated and positively associated with disease activity as well as inflammation in RA patients.
With the purpose of exploring the molecular mechanisms of lnc-ITSN1-2 in regulating RA pathogenesis, we conducted the present study, and found that lnc-ITSN1-2 knockdown repressed cell proliferation and inflammation while enhanced cell apoptosis in RA FLS. To the best of our knowledge, no study has ever been done to investigate the effect of lnc-ITSN1-2 on cell functions and inflammation in RA FLS, however, there have been several studies evaluating the influences of other lncRNAs on the pathogenesis of RA. A recent study illustrates that Tanshinone IIA enhances cell apoptosis of RA FLS by elevating the expression of lnc-GAS5 [3]. Another experiment elucidates that lnc-NTT promotes the differentiation of monocytes via binding to the nearby gene PBOV1 and is a mediator of inflammation in monocytes in RA [17]. In addition, lnc-GAPLINC has been illuminated to elevate the tumor-like behaviors of RA FLS by acting as a microRNA sponge, which sponges miR-382-5p and miR-575 [4]. And a previous study reports that upregulated lnc-HOTAIR elevates cell proliferation while inhibits inflammation in RA rat models via mediating miR-138 expression and the NF-κB signaling pathway [18]. These studies all indicate that lncRNAs play critical roles in RA pathogenesis by regulating cell functions via mediating various signaling pathways or sponging multiple miRNAs. As for lnc-ITSN1-2, we discovered in our previous study that plasma lnc-ITNS1-2 was upregulated in RA patients compared with healthy controls and positively associated with ESR level, CRP level and DAS28 score, indicating that lnc-ITSN1-2 might play a critical role in RA pathogenesis [9]. Here are several possible explanations to the results in our study regarding the function of lnc-ITSN1-2 on RA FLS proliferation, apoptosis and inflammation: (1) lnc-ITSN1-2 knockdown probably inhibited cell proliferation and inflammation while enhanced cell apoptosis of RA FLS by regulating multiple pathways that related to RA, such as cytokine-cytokine receptor interaction pathways, TNF signaling pathway and NF-kappa B signaling pathway, which were exhibited by our bioinformatics analysis; (2) moreover, our further rescue experiments elucidated that lnc-ITSN1-2 knockdown directly repressed the NOD2/RIP2 signaling pathway to regulate the RA FLS proliferation, apoptosis and inflammation, which could also explain this result.
Furthermore, in our study, mRNA sequencing and bioinformatics analyses identified 144 upregulated DEGs and 98 downregulated DEGs in lnc-ITSN1-2 knockdown group compared with negative control group, and the GO enrichment analysis displayed that those DEGs were enriched in various biological processes, such as negative regulation of inflammatory response, chemokine mediated signaling pathway and immune response, which are involved in the RA pathogenesis, and were mainly located in extracellular space and cell surface. Additionally, KEGG enrichment analysis displayed that DEGs by lnc-ITSN1-2 were associated with various RA related signaling pathways, such as cytokine-cytokine signaling pathway, chemokine signaling pathway and NOD-like receptor signaling pathway. Based on these findings, we speculated that lnc-ITSN1-2 was involved in RA pathogenesis mainly through regulating extracellular inflammatory response, immune response, chemokine activity, cytokine activity and protein kinase binding via multiple pathways in extracellular space and cell surfaces, such as the cytokine-cytokine interaction and NOD-like receptor signaling pathway.
Next, we found that lnc-ITSN1-2 knockdown inhibited cell proliferation, inflammation while promoted cell apoptosis by mediating the NOD2/RIP2 signaling pathway in RA FLS. NOD2, an intracellular pattern recognition receptor that abundantly expresses on dendritic cells, macrophages, intestinal cells, lung cells and so on, is a predominant member of the Toll-like receptors (TLRs) family [19-22]. In autoimmune and inflammatory diseases, such as Crohn’s disease and dermatitis, NOD2 is reported to be a crucial regulator in the adjustment of innate and adaptive immune responses, which are also closely related to the progress of inflammation [23,24]. However, the studies that evaluate the correlation of NOD2 with RA is relatively limited. A recent experiment reveals that NOD2 gene expression is elevated in RA FLS and downregulating NOD2 decreases the expressions of pro-inflammatory cytokines and NF-κB in RA FLS [25]. Moreover, another experiment elucidates that NOD2/RIP2 signaling is activated in the immune cells separated from RA patients, and NOD2/RIP2 signaling also mediates inflammatory responses in peripheral blood mononuclear cells (PBMCs) obtained from RA patients by regulating the TNF-α, IL-8, and IL-1β expressions [14]. An animal experiment illuminates that NOD2/RIP2 signaling participates in the stimulation of arthritis onset in mouse models by activating the IL-17-dependent joint immune responses [26]. And all these previous studies might provide some reasons for our results of the regulatory role of lnc-ITSN1-2 in NOD2/RIP2 signaling pathway, which was that: lnc-ITSN1-2 knockdown could inhibit cell proliferation and inflammation while promote cell apoptosis through mediating the NOD2/RIP2 signaling pathway probably due to that the NOD2/RIP2 signaling pathway is reported to play crucial role in regulating the immune and inflammatory responses [14,23-26].
Last, in this study, the synovial tissue lnc-ITSN1-2 expression is upregulated in RA patients compared with controls and had a good value in predicting RA risk, in addition, it was also positively correlated with disease activity and inflammation in RA patients, indicating that lnc-ITSN1-2 had the potential to be a biomarker for diagnosis and disease surveillance. Furthermore, we also found that synovial tissue lnc-ITSN1-2 positively correlated with NOD2 mRNA expression in RA patients, and NOD2 mRNA expression also positively associated with disease activity and inflammation in RA patients, which manifested the regulatory role of lnc-ITSN1-2 on NOD2 and the correlation of NOD2 with inflammation and disease activity in a more macroscopic scale. Regarding that lncRNAs are found to be aberrantly expressed in RA patients and may play decisive roles in the pathogenesis, mounting studies suggest that lncRNAs have potential to be biomarkers in the management of RA patients. For instance, a recent study demonstrates that PBMC lnc_ENST00000456270 expression is elevated in RA patients compared with healthy controls, and is positively associated with serum levels of TNF-α and IL-6 expressions, as well as Simplified Disease Activity Index (SDAI) score in RA patients [27]. However, only our previous study investigated the value of lnc-ITSN1-2 as a biomarker in RA patients, which elucidated that plasma lnc-ITSN1-2 was elevated in RA patients compared with healthy controls and was positively correlated with ESR, CRP and DAS28 score in RA patients, which was in line with the results in our present study [9]. In addition, NOD2 expression displayed a stronger correlation with disease activity compared with lnc-ITSN1-2, indicating that there are other factors that might be responsible for regulating the expression of NOD2 in RA synovial tissue. Thus, it is possible that the NOD2 also interacts with other factors related to inflammation or immune responses to participate in the RA pathogenesis, resulting in a stronger association of NOD2 expression with the RA disease activity. As for the explanations to the results regarding the correlations of lnc-ITSN1-2 and NOD2 with disease activity and inflammation in RA patients in our study, the regulation of NOD2, or the interactions of NOD2 with other factors, have been revealed by mounting previous studies, which illuminated that NOD2 expression could be regulated by various inflammation-related factors, such as β-arrestin 2, nucleotide-binding oligomerization domain protein 12 (NLRP12) and NADPH oxidase 2 (NOX2), etc. [28-30].
In conclusion, downregulation of lnc-ITSN1-2 correlates with decreased disease risk and activity of RA, and reduces RA FLS proliferation and inflammation via regulating NOD2/RIP2 signaling pathway.
Acknowledgements
This study was supported by Prioyity speciality for Changning district, Shanghai Municipal Commission of Health and Family Planning (No. 20161003).
Disclosure of conflict of interest
None.
Supporting Information
References
- 1.van der Woude D, van der Helm-van Mil AHM. Update on the epidemiology, risk factors, and disease outcomes of rheumatoid arthritis. Best Pract Res Clin Rheumatol. 2018;32:174–187. doi: 10.1016/j.berh.2018.10.005. [DOI] [PubMed] [Google Scholar]
- 2.Smolen JS, Aletaha D, McInnes IB. Rheumatoid arthritis. Lancet. 2016;388:2023–2038. doi: 10.1016/S0140-6736(16)30173-8. [DOI] [PubMed] [Google Scholar]
- 3.Li G, Liu Y, Meng F, Xia Z, Wu X, Fang Y, Zhang C, Liu D. Tanshinone IIA promotes the apoptosis of fibroblast-like synoviocytes in rheumatoid arthritis by up-regulating lncRNA GAS5. Biosci Rep. 2018;38 doi: 10.1042/BSR20180626. [DOI] [PMC free article] [PubMed] [Google Scholar]
- 4.Mo BY, Guo XH, Yang MR, Liu F, Bi X, Liu Y, Fang LK, Luo XQ, Wang J, Bellanti JA, Pan YF, Zheng SG. Long non-coding RNA GAPLINC promotes tumor-like biologic behaviors of fibroblast-like synoviocytes as microRNA sponging in rheumatoid arthritis patients. Front Immunol. 2018;9:702. doi: 10.3389/fimmu.2018.00702. [DOI] [PMC free article] [PubMed] [Google Scholar]
- 5.Yan ZF, Zhao XY, Liu W, Liu XP. UCA1 impacts progress of rheumatoid arthritis by inducing the apoptosis of fibroblast-like synoviocyte. Eur Rev Med Pharmacol Sci. 2018;22:914–920. doi: 10.26355/eurrev_201802_14370. [DOI] [PubMed] [Google Scholar]
- 6.Furer V, Greenberg JD, Attur M, Abramson SB, Pillinger MH. The role of microRNA in rheumatoid arthritis and other autoimmune diseases. Clin Immunol. 2010;136:1–15. doi: 10.1016/j.clim.2010.02.005. [DOI] [PubMed] [Google Scholar]
- 7.Porro A, Feuerhahn S, Lingner J. TERRA-reinforced association of LSD1 with MRE11 promotes processing of uncapped telomeres. Cell Rep. 2014;6:765–776. doi: 10.1016/j.celrep.2014.01.022. [DOI] [PubMed] [Google Scholar]
- 8.Yu TY, Kao YW, Lin JJ. Telomeric transcripts stimulate telomere recombination to suppress senescence in cells lacking telomerase. Proc Natl Acad Sci U S A. 2014;111:3377–3382. doi: 10.1073/pnas.1307415111. [DOI] [PMC free article] [PubMed] [Google Scholar]
- 9.Gong XM, Fan XL, Zhang ZM, Cai Q, Guo MR, Gao CX, Xiao LB, Yue T. Circulating lnc-ITSN1-2 expression presents a high value in diagnosis of rheumatoid arthritis and correlates with disease activity. Int J Clin Exp Pathol. 2017;10:10451–10458. [PMC free article] [PubMed] [Google Scholar]
- 10.Ospelt C, Kurowska-Stolarska M, Neidhart M, Michel BA, Gay RE, Laufer S, Gay S. The dual inhibitor of lipoxygenase and cyclooxygenase ML3000 decreases the expression of CXCR3 ligands. Ann Rheum Dis. 2008;67:524–529. doi: 10.1136/ard.2007.071589. [DOI] [PubMed] [Google Scholar]
- 11.Suzuki T, Iwamoto N, Yamasaki S, Nishino A, Nakashima Y, Horai Y, Kawashiri SY, Ichinose K, Arima K, Tamai M, Nakamura H, Origuchi T, Miyamoto C, Osaki M, Ohyama K, Kuroda N, Kawakami A. Upregulation of thrombospondin 1 expression in synovial tissues and plasma of rheumatoid arthritis: role of transforming growth factor-beta1 toward fibroblast-like synovial cells. J Rheumatol. 2015;42:943–947. doi: 10.3899/jrheum.141292. [DOI] [PubMed] [Google Scholar]
- 12.Cho JH, Abraham C. Inflammatory bowel disease genetics: Nod2. Annu Rev Med. 2007;58:401–416. doi: 10.1146/annurev.med.58.061705.145024. [DOI] [PubMed] [Google Scholar]
- 13.Li J, Wu S, Wang MR, Wang TT, Li BK, Zhu JM. Potential roles of nucleotide-binding oligomerization domain 2 in the pathogenesis of systemic lupus erythematosus. Rheumatol Int. 2014;34:1339–1344. doi: 10.1007/s00296-014-2975-5. [DOI] [PubMed] [Google Scholar]
- 14.Franca R, Vieira SM, Talbot J, Peres RS, Pinto LG, Zamboni DS, Louzada-Junior P, Cunha FQ, Cunha TM. Expression and activity of NOD1 and NOD2/RIPK2 signalling in mononuclear cells from patients with rheumatoid arthritis. Scand J Rheumatol. 2016;45:8–12. doi: 10.3109/03009742.2015.1047403. [DOI] [PubMed] [Google Scholar]
- 15.Keestra-Gounder AM, Byndloss MX, Seyffert N, Young BM, Chavez-Arroyo A, Tsai AY, Cevallos SA, Winter MG, Pham OH, Tiffany CR, de Jong MF, Kerrinnes T, Ravindran R, Luciw PA, McSorley SJ, Baumler AJ, Tsolis RM. NOD1 and NOD2 signalling links ER stress with inflammation. Nature. 2016;532:394–397. doi: 10.1038/nature17631. [DOI] [PMC free article] [PubMed] [Google Scholar]
- 16.Pellegrini E, Desfosses A, Wallmann A, Schulze WM, Rehbein K, Mas P, Signor L, Gaudon S, Zenkeviciute G, Hons M, Malet H, Gutsche I, Sachse C, Schoehn G, Oschkinat H, Cusack S. RIP2 filament formation is required for NOD2 dependent NF-kappaB signalling. Nat Commun. 2018;9:4043. doi: 10.1038/s41467-018-06451-3. [DOI] [PMC free article] [PubMed] [Google Scholar]
- 17.Yang CA, Li JP, Yen JC, Lai IL, Ho YC, Chen YC, Lan JL, Chang JG. lncRNA NTT/PBOV1 axis promotes monocyte differentiation and is elevated in rheumatoid arthritis. Int J Mol Sci. 2018;19 doi: 10.3390/ijms19092806. [DOI] [PMC free article] [PubMed] [Google Scholar]
- 18.Zhang HJ, Wei QF, Wang SJ, Zhang HJ, Zhang XY, Geng Q, Cui YH, Wang XH. LncRNA HOTAIR alleviates rheumatoid arthritis by targeting miR-138 and inactivating NF-kappaB pathway. Int Immunopharmacol. 2017;50:283–290. doi: 10.1016/j.intimp.2017.06.021. [DOI] [PubMed] [Google Scholar]
- 19.Inohara , Chamaillard , McDonald C, Nunez G. NOD-LRR proteins: role in host-microbial interactions and inflammatory disease. Annu Rev Biochem. 2005;74:355–383. doi: 10.1146/annurev.biochem.74.082803.133347. [DOI] [PubMed] [Google Scholar]
- 20.Kufer TA, Fritz JH, Philpott DJ. NACHT-LRR proteins (NLRs) in bacterial infection and immunity. Trends Microbiol. 2005;13:381–388. doi: 10.1016/j.tim.2005.06.004. [DOI] [PubMed] [Google Scholar]
- 21.Girardin SE, Boneca IG, Carneiro LA, Antignac A, Jehanno M, Viala J, Tedin K, Taha MK, Labigne A, Zahringer U, Coyle AJ, DiStefano PS, Bertin J, Sansonetti PJ, Philpott DJ. Nod1 detects a unique muropeptide from gram-negative bacterial peptidoglycan. Science. 2003;300:1584–1587. doi: 10.1126/science.1084677. [DOI] [PubMed] [Google Scholar]
- 22.Girardin SE, Boneca IG, Viala J, Chamaillard M, Labigne A, Thomas G, Philpott DJ, Sansonetti PJ. Nod2 is a general sensor of peptidoglycan through muramyl dipeptide (MDP) detection. J Biol Chem. 2003;278:8869–8872. doi: 10.1074/jbc.C200651200. [DOI] [PubMed] [Google Scholar]
- 23.Antosz H, Osiak M. NOD1 and NOD2 receptors: integral members of the innate and adaptive immunity system. Acta Biochim Pol. 2013;60:351–360. [PubMed] [Google Scholar]
- 24.van Beelen AJ, Zelinkova Z, Taanman-Kueter EW, Muller FJ, Hommes DW, Zaat SA, Kapsenberg ML, de Jong EC. Stimulation of the intracellular bacterial sensor NOD2 programs dendritic cells to promote interleukin-17 production in human memory T cells. Immunity. 2007;27:660–669. doi: 10.1016/j.immuni.2007.08.013. [DOI] [PubMed] [Google Scholar]
- 25.Kim HW, Kwon YJ, Park BW, Song JJ, Park YB, Park MC. Differential expressions of NOD-like receptors and their associations with inflammatory responses in rheumatoid arthritis. Clin Exp Rheumatol. 2017;35:630–637. [PubMed] [Google Scholar]
- 26.Vieira SM, Cunha TM, Franca RF, Pinto LG, Talbot J, Turato WM, Lemos HP, Lima JB, Verri WA Jr, Almeida SC, Ferreira SH, Louzada-Junior P, Zamboni DS, Cunha FQ. Joint NOD2/RIPK2 signaling regulates IL-17 axis and contributes to the development of experimental arthritis. J Immunol. 2012;188:5116–5122. doi: 10.4049/jimmunol.1004190. [DOI] [PubMed] [Google Scholar]
- 27.Yuan M, Wang S, Yu L, Qu B, Xu L, Liu L, Sun H, Li C, Shi Y, Liu H. Long noncoding RNA profiling revealed differentially expressed lncRNAs associated with disease activity in PBMCs from patients with rheumatoid arthritis. PLoS One. 2017;12:e0186795. doi: 10.1371/journal.pone.0186795. [DOI] [PMC free article] [PubMed] [Google Scholar]
- 28.Chen L, Kong L, Wei X, Wang Y, Wang B, Zhang X, Sun J, Liu H. Beta-arrestin 2 negatively regulates NOD2 signalling pathway through association with TRAF6 in microglia after cerebral ischaemia/reperfusion injury. J Cell Mol Med. 2019;23:3325–3335. doi: 10.1111/jcmm.14223. [DOI] [PMC free article] [PubMed] [Google Scholar]
- 29.Cheng L, Chen L, Wei X, Wang Y, Ren Z, Zeng S, Zhang X, Wen H, Gao C, Liu H. NOD2 promotes dopaminergic degeneration regulated by NADPH oxidase 2 in 6-hydroxydopamine model of Parkinson’s disease. J Neuroinflammation. 2018;15:243. doi: 10.1186/s12974-018-1289-z. [DOI] [PMC free article] [PubMed] [Google Scholar]
- 30.Normand S, Waldschmitt N, Neerincx A, Martinez-Torres RJ, Chauvin C, Couturier-Maillard A, Boulard O, Cobret L, Awad F, Huot L, Ribeiro-Ribeiro A, Lautz K, Ruez R, Delacre M, Bondu C, Guilliams M, Scott C, Segal A, Amselem S, Hot D, Karabina S, Bohn E, Ryffel B, Poulin LF, Kufer TA, Chamaillard M. Proteasomal degradation of NOD2 by NLRP12 in monocytes promotes bacterial tolerance and colonization by enteropathogens. Nat Commun. 2018;9:5338. doi: 10.1038/s41467-018-07750-5. [DOI] [PMC free article] [PubMed] [Google Scholar]
Associated Data
This section collects any data citations, data availability statements, or supplementary materials included in this article.