

Abstract
It is controversial that retina and photoreceptors are involved in amblyopic development. Lack of imaging devices for quantitative assessment of photoreceptors in vivo impedes further investigation. In this study we investigated the differences of macular thickness, outer nuclear layer (ONL) thickness and cone density among eyes with unilateral anisometropic amblyopia, amblyopic fellow eyes, and normal control eyes using high-definition spectral-domain optical coherence tomography and adaptive optics imaging system. Thicker fovea and parafovea with characteristic quantitative retinal changes in unilateral amblyopic patients indicated that the amblyopic process might involve the retina. Cones tended to be homogeneously distributed at 1.5° from the foveal center in all participants. However, we did not detect any significant differences in cone density and ONL thickness at 1.5° from the foveal center in patients with unilateral amblyopia when compared with the fellow eyes and the normal control eyes. This is the first study to explore whether photoreceptors are involved in amblyopic development in vivo that would help for understanding the underlying mechanisms of amblyopia. Whether macular changes relate to cone photoreceptors migration of the amblyopic eyes remains to be determined.
Keywords: Adaptive optics, amblyopia, cone photoreceptor, macular thickness, outer nuclear layer
Introduction
Amblyopia decreases best-corrected visual acuity (BCVA) as a consequence of specific abnormalities such as anisometropia, strabismus, and visual deprivation [1]. While the lateral geniculate body and the cerebral cortex are involved in amblyopia development [2,3], the evidence for direct retinal changes in amblyopic eyes is controversial and still under investigation. With advances in imaging technology, interest has emerged to study the differences in the retinal structure in amblyopia. The anatomical and structural differences are now easier to assess with the availability of high-definition scans on spectral-domain optical coherence tomography (SD-OCT). Although some previous studies found that there were no changes in macular thickness with amblyopia, more reports showed amblyopic children had a thicker foveal thickness [4-7]. The underlying mechanism of increasing macular thickness is still unknown. Yen et al. found that foveal thickness increased in amblyopic eyes and hypothesized that amblyopia might affect the process of postnatal reduction of ganglion cells and the optic nerve axons, which could then lead to a measurable increase in the retinal nerve fiber layer (RNFL) thickness in amblyopic eyes, along with a decrease in the foveal cone diameter [8]. Al-Haddad et al. also noted several signs of foveal immaturity in amblyopic eyes, as well as a thicker overall fovea, implying that the photoreceptors might be abnormal as a result of amblyopic progression [9]. Confirmation of these findings by in vivo observation of photoreceptors is impossible until the advent of adaptive optics imaging systems that correct ocular aberrations. The use of this new technology in ophthalmology has enabled the direct observation of photoreceptors, retinal pigment epithelium, and lamina cribrosa, and the in vivo images are in good agreement with histological studies [10-12]. Thus, the goals of this study were to determine the changes in macular ultrastructural morphology in the eyes of unilateral anisometropic amblyopic patients and compare the findings with those from the fellow eyes and age-matched control group.
Methods
This prospective observational study was conducted at the Eye Hospital of Wenzhou Medical University. Research procedures were performed in accordance with the Declaration of Helsinki and were approved by the Research Review Board at Wenzhou Medical University. Written informed consent to participate in the study was obtained from each patient or from the parents of minor-age participants.
Patients with unilateral anisometropic amblyopia were enrolled. Unilateral anisometropic amblyopia was defined by the presence of age appropriate normal BCVA in one eye, a BCVA difference of at least two lines between the affected and fellow eyes, and a spherical equivalent difference of at least 1.5 diopters between the amblyopic and fellow eyes. Each participant underwent a comprehensive ophthalmologic examination that included visual acuity, slit-lamp examination, and fundus examination. The exclusion criteria were active inflammation, previous refractive surgery, corneal scarring, fundus disease that might affect vision acuity, inability to fixate, or severe blepharophimosis.
Age, gender, refractive error, and BCVA were recorded. Axial lengths (AL) were measured by Lenstar LS 900 (Haag-Streit AG, Koeniz, Switzerland) based on low coherence reflectometry. Participants underwent macular thickness analysis using the macular cube 512 × 128 feature of SD-OCT (Cirrus high Definition OCT, Carl Zeiss Meditec Inc., CA, U.S.A). Only images whose signal strengths were more than 6 and had good quality were selected. Only one eye with relatively better image quality was selected in the final analysis in healthy subjects. The central subfield thickness (CST) corresponded to the 1 mm diameter center of the fovea. Average macular thickness in each inner quadrant (IMT) of an annulus outer 3 mm diameter were also analyzed in this study (Figure 1). The Outer nuclear layer (ONL) thickness outer 1.5° were measured in four meridians (Temporal, Nasal, Superior, Inferior) with a custom MATLAB program (Figure 2). ONL thickness was measured manually by three independent observers who were not informed which eye was amblyopic or not. The mean value of the three measurements was used for the analysis.
Figure 1.

Analyzed regions of retinal thickness using the Early Treatment Diabetic Retinopathy Study (EDTRS) map. The regions were located in three rings with diameters of 1, 3, and 6 mm. Inner and outer rings were divided into four quadrants: temporal, nasal, superior and inferior (only central and inner ring macular thickness were included in this study).
Figure 2.
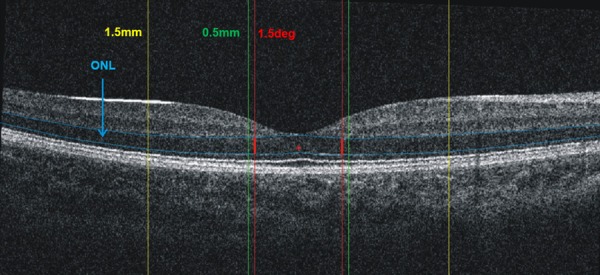
Macular thickness measurements: a. Macular retinal thickness was measured in two concentric rings, with the central ring corresponding to the fovea (1 mm diameter, green line), the middle ring corresponding to the parafovea (3 mm diameter, yellow line). b. Outer nuclear layer (ONL): ONL was measured between the blue line (distance between outer plexiform layer and the inner segment/outer segment line) at 1.5° (red lines) outside central fovea in four meridians.
High resolution images of cone photoreceptors were captured by a non-contact en face adaptive optics imaging system (RTX-1, Imagine Eyes, Orsay, France). The imaging field of view was 4° × 4° and each acquisition took 4 s. The image resolution was 1500 × 1500 dpi. In a single session, 40 live high-resolution images of the retina were automatically overlapped and averaged to improve the image quality [13,14]. According to the cone topography map, the cone mosaic within 1° of the foveal center was too dense to be resolved, but it was more reliable at 1.5°. Image field samplings of 80 dpi × 80 dpi were automatically cropped from eight macular regions of interest, 1.5° outside the foveal center (Figure 3). Cone densities and nearest neighbor distances (NND) were measured in the eight regions with a semi-automatic calculation MATLAB program (AOdetect2.0b13) provided by Imagine Eyes company. After auto-recognition, the missing cones were added, and the mislabeled ones were deleted manually by two observers who were uninformed to whether an eye was amblyopic or not. Overall density determinations were based on data from all eight macular regions of interest. Additionally, data from four meridional regions of interest (Temporal, Nasal, Superior, Inferior) were also analyzed separately. The NND was measured as the minimum distances to the center of the neighboring cells within the cone mosaic.
Figure 3.

Eight regions of interest (80 dpi × 80 dpi) located 1.5° from the foveal center were selected, enlarged, and cropped to better display the cones and calculate cone density (blue cross sign: auto-recognition; green cross sign: manual addition).
Statistical analysis was performed using R version 3.4.3 (Copyright 2017, The R Foundation for Statistical Computing, https://www.r-project.org/) and SPSS for windows (version 18.0; SPSS, Inc., Chicago, IL, USA). Continuous data met normal distribution were presented as means ± standard deviations, and one-way analysis of variance was used to investigate the differences among different groups. For those skewed continuous data, medians (1st quartile, 3rd quartile) were selected to describe their features, and Kruskal-Wallis H tests were applied to assess the differences among groups. Post-hoc tests were then performed when the above-mentioned null hypotheses were rejected. The general linear models were used for the multiple comparisons. To adjust for the impacts due to some potential confounders containing age and AL on our conclusion, analysis of covariance was then applied for the comparisons of variables among different groups. Spearman correlation analysis was performed to determine the relationships among different variables. All tests were two-sided and P values < 0.05 were considered to be statistically significant.
Results
30 patients with unilateral anisometropic amblyopia and 30 healthy subjects participated in this study. There were no statistically differences in gender and age between the amblyopic patients and healthy volunteers (Table 1). AL and astigmatic power were all lower in the amblyopic eyes compared to the fellow eyes and the normal control eyes (all, P < 0.001). The spherical power of the amblyopic eyes was greater than the normal control eyes (P < 0.001). However, there were no significant differences in these parameters between the amblyopic fellow eyes and the normal control eyes (all, P > 0.05).
Table 1.
Demographics and clinical characteristics of participants
| Variables | Anisometric amblyopia | Normal eyes | P-value | |
|---|---|---|---|---|
|
| ||||
| Amblyopic eyes | Amblyopic fellow eyes | |||
| Eyes, (subjects) | 30 | 30 | 30 | - |
| Age, years | 12.00 (10.00, 23.00) | 12.00 (10.00, 23.00) | 13.00 (11.00, 25.00) | 0.567 |
| Gender, M/F | 17/13 | 17/13 | 19/11 | 0.998 |
| Axial length, mm | 22.22±1.21 | 23.86±1.23 | 24.34±0.81 | < 0.001 |
| Spherical power | 4.50 (3.00, 6.00) | 0.00 (-1.00, 0.50) | -1.25 (-1.50, -0.50) | < 0.001 |
| Astigmatic power | -1.00 (-1.50, -0.50) | 0.00 (-0.50, 0.00) | 0.00 (-0.50, 0.00) | < 0.001 |
| BCVA (log MAR) | 0.52 (0.30, 0.82) | 0.00 (0.00, 0.00) | 0.00 (0.00, 0.00) | < 0.001 |
BCVA: Best-corrected vision acuity (log minimum angle of resolution).
Mean macular Thickness measurement with Cirrus OCT for all subjects was shown in Table 2. Significant difference was present in CST after age and AL adjustment (P = 0.034), while the difference was hidden without correction (P = 0.694). CST in amblyopic eyes (after correction, mean = 247.08 µm) was significantly higher than that of their fellow eyes (after correction, mean = 231.76 µm, P = 0.0126) and the normal control eyes (after correction, mean = 232.20 µm, P = 0.0272). Mean IMT was greater in amblyopic eyes than in the amblyopic fellow eyes and the normal control eyes (after correction, P = 0.0113 and P = 0.0063 respectively). Moreover, IMT in the temporal quadrant was thinnest compared with the other three locations in all participants (all P < 0.01). No statistically significant differences were detected in ONL among three types of eyes, while there were statistically differences in different meridians comparison in three groups respectively. However, the differences varied and represented no identifiable pattern for post hoc analysis. The nasal ONL thickness showed significant differences with temporal (P = 0.0316) and superior (P = 0.0007) in amblyopic eyes. For fellow eyes, there were significant differences between temporal vs. superior (P = 0.0035), nasal vs. inferior (P = 0.0124) and nasal vs. inferior (P = 0.0124). Whereas, the superior ONL thickness showed significant differences with temporal (P < 0.0001), nasal (P < 0.0001) and inferior (P < 0.0001) in the normal control eyes. Interobserver agreement was high with intraclass correlation coefficients (ICC) of 0.950 (95% CI, 0.941-0.957) for assessing ONL.
Table 2.
Macular thickness comparison among three types of eyes
| Location | Amblyopic eyes | Amblyopic fellow eyes | Normal eyes | P |
|---|---|---|---|---|
| CST, µm | ||||
| Overall | 237.57±21.28 | 234.43±25.84* (0.013) | 239.03±15.35* (0.027) | 0.694/0.034 |
| ONL, µm | ||||
| Overall | 70.87±9.25 | 70.03±9.19 | 74.33±9.00 | 0.162/0.119 |
| Temporal | 69.77±18.58 | 72.24±14.14 | 78.50±11.42 | 0.073/0.478 |
| Nasal | 78.42±16.54 | 76.20±12.83 | 76.20±12.83 | 0.609/0.616 |
| Superior | 64.65±15.92 | 63.21±12.20 | 62.56±15.87 | 0.855/0.963 |
| Inferior | 70.66±16.15 | 68.49±13.95 | 76.65±8.83 | 0.138/0.052 |
| P | 0.009/0.019 | 0.123/0.001 | < 0.001/< 0.0001 | |
| IMT, µm | ||||
| Overall | 318.51±14.76 | 310.52±12.38* (0.011) | 309.46±10.41* (0.006) | 0.013/0.015 |
| Temporal | 307.83±14.22 | 299.40±11.61* (0.003) | 299.63±12.05* (0.004) | 0.016/0.006 |
| Nasal | 323.03±16.31 | 316.23±14.99* (0.025) | 314.20±11.76* (0.007) | 0.052/0.022 |
| Superior | 324.07±16.98 | 315.63±12.57* (0.025) | 315.07±10.58* (0.023) | 0.020/0.048 |
| Inferior | 319.10±15.28 | 310.80±12.72* (0.034) | 308.93±10.26* (0.016) | 0.007/0.043 |
| P | < 0.001/0.000 | 0.000/< 0.0001 | 0.000/< 0.0001 |
CST: Thickness Central Subfield (µm); ONL: Outer nuclear layer (µm); IMT: Inner macular thickness (between 1 mm and 3 mm ring, µm);
P < 0.05, Compared with amblyopic eyes after adjustment of age and axial length.
16 patients and 16 age-matched healthy volunteers were enrolled in the part of cone photoreceptor analysis due to relatively poor image quality in some eyes, especially the amblyopic eyes. Cone photoreceptor packing densities in the amblyopic eyes, amblyopic fellow eyes, and normal control eyes were shown in Figure 4. It seemed that cone density in linear units (CD_L) was higher in amblyopic eyes than amblyopic fellow eyes and normal eyes in all four locations (all, P < 0.05 in four meridians). While when the density was expressed in angular density units (CD_A), i.e., cones/deg2, the statistical significance was lost without AL and age adjustment (P = 0.189 in overall cone density). However, the differences in CD_L were no longer existent after AL and age adjustment in four meridians. The details about cone density and NND were shown in Table 3. In all participants, cones tended to be homogeneously distributed in the regions of interest at 1.5° from the center of the fovea. There were no significant differences among the four meridians in the amblyopic eyes, the fellow eyes, and the normal control eyes (all, P > 0.05). Cone spacing was negatively correlated with cone density (r = -0.998, P < 0.0001 in linear units; r = -0.997, P < 0.0001 in angular units). The same results were also found for the NND. There were no statistical differences among three groups in NND_L and NND_A after adjustment of AL and age (all, P > 0.05). Interobserver agreement was high with ICC of 0.998 (95% CI, 0.998-0.999) and 0.997 (95% CI, 0.996-0.998) for assessing CD_A and NND_A respectively.
Figure 4.

Comparison cone density in linear (upper) and angular units (down) among amblyopic eyes, amblyopic fellow eyes and normal control eyes in four meridians.
Table 3.
Overall and meridional cone densities, nearest neighbor distances at 1.5° from the central fovea among three types of eyes
| Variables | Overall | Temporal | Nasal | Superior | Inferior | P |
|---|---|---|---|---|---|---|
| CD_L (cells/mm2) | ||||||
| Amblyopic eyes | 34402.4±3904.3 | 34414.7±3822.2 | 34607.5±4980.2 | 36823.3±4525.5 | 35249.5±4044.3 | 0.520/0.390 |
| Amblyopic fellow eyes | 28999.5±5371.2 | 30233.9±4592.2 | 30774.3±4559.6 | 31203.1±4793.3 | 31671.5±4317.1 | 0.583/0.545 |
| Normal eyes | 30726.9±3970.3 | 30682.3±3072.7 | 29665.0±3302.7 | 31099.7±3865.7 | 31035.8±3061.9 | 0.859/0.734 |
| P | 0.006/0.269 | 0.008/0.868 | 0.007/0.945 | 0.001/0.850 | 0.012/0.986 | |
| CD_A (cells/deg2) | ||||||
| Amblyopic eyes | 2487.0±259.7 | 2486.9±187.2 | 2488.7±205.4 | 2621.9±222.1 | 2496.0±256.4 | 0.434/0.415 |
| Amblyopic fellow eyes | 2457.0±355.2 | 2561.3±268.8 | 2564.6±303.0 | 2596.6±295.3 | 2655.3±273.3 | 0.487/0.505 |
| Normal eyes | 2645.6±296.0 | 2643.9±214.1 | 2556.9±253.3 | 2677.5±280.4 | 2678.7±270.4 | 0.689/0.688 |
| P | 0.189/0.188 | 0.167/0.465 | 0.673/0.923 | 0.694/0.690 | 0.162/0.899 | |
| NND_L (µm) | ||||||
| Amblyopic eyes | 5.97±0.34 | 5.97±0.34 | 5.96±0.42 | 5.78±0.38 | 5.90±0.35 | 0.571/0.453 |
| Amblyopic fellow eyes | 6.54±0.61 | 6.40±0.53 | 6.33±0.48 | 6.29±0.49 | 6.24±0.49 | 0.554/0.477 |
| Normal eyes | 6.33±0.46 | 6.32±0.34 | 6.43±0.40 | 6.29±0.41 | 6.29±0.32 | 0.885/0.812 |
| P | 0.008/0.264 | 0.012/0.687 | 0.012/0.959 | 0.002/0.831 | 0.025/0.979 | |
| NND_A (arcmin) | ||||||
| Amblyopic eyes | 1.33±0.07 | 1.33±0.05 | 1.33±0.05 | 1.30±0.06 | 1.33±0.07 | 0.473/0.466 |
| Amblyopic fellow eyes | 1.34±0.10 | 1.31±0.07 | 1.31±0.08 | 1.30±0.07 | 1.29±0.07 | 0.460/0.470 |
| Normal eyes | 1.29±0.08 | 1.29±0.05 | 1.31±0.07 | 1.28±0.07 | 1.29±0.07 | 0.829/0.759 |
| P | 0.185/0.195 | 0.012/0.491 | 0.785/0.968 | 0.698/0.680 | 0.189/0.927 |
CD_L: Cone density in linear units; CD_A: Cone density in angular units; NND_L: Nearest neighbor distances in linear units; NND_A: Nearest neighbor distances in angular units. “/”: P values in left and right were without and with adjustment of age and axial length respectively; The values of all parameters shown in Table 3 were all raw data without correction of age and axial length.
NO correlations were found between BCVA and ONL (r = 0.214, P = 0.256); BCVA and CD_L (r = 0.198, P = 0.479); BCVA and CD_A (r = -0.2, P = 0.475), BCVA and CST (r = -0.146, P = 0.440) in amblyopic eyes. AL were positively correlated with CST (r = 0.288, P = 0.006), NND_L (r = 0.613, P < 0.0001), negatively correlated with CD_L (r = -0.618, P < 0.0001), and not correlated with IMT (r = -0.135, P = 0.203), CD_A (r = 0.124, P = 0.408), NND_A (r = -0.135, P = 0.367). Our results indicated that there was increase ONL with age in all participants (r = 0.430, P = 0.018 in amblyopic eyes, r = 0.592, P = 0.001 in fellow eyes; r = 0.513, P = 0.004 in normal eyes). There was no correlation between age and CST, except in fellow eyes, although the correlation was week (r = 0.367, P = 0.046). We also found a significant increasing IMT with age (r = 0.551, P = 0.002) in fellow eyes, while not in other two groups.
Discussion
Amblyopia is known as a disease occurring during the development and maturation period of the visual pathway between the retina and the central neurons. Although the involvement of both the lateral geniculate nucleus and the cortical neurons in amblyopia are generally accepted, retinal involvement in amblyopic progression is still controversial [2,15-17]. In the current study, there were significant differences in foveal and parafoveal macular thickness in amblyopic eyes compared with those from the fellow eyes and the eyes of age-matched controls. However, our results reveal that cone density and ONL thickness differences at locations 1.5° from the foveal center did not exist between individuals with amblyopia and visual normal control subjects.
Numerous previous studies have dealt with the retinal changes in unilateral amblyopia with different results [18-20]. In the present research, there were statistically significant differences in macular thickness among amblyopic eyes, amblyopic fellow eyes and healthy control eyes in the fovea (diameter of 1 mm) and parafovea (diameter of 3 mm). This was consistent with some previous studies [7,21], while other researchers reported no significant differences in the macular structures [4,17,22,23] or differences exist only in some specific types of amblyopia [6,24,25]. A meta-analysis of 28 clinical trials involving 408 patients indicates that the foveal minimum thickness, CST, mean macular thickness (within 6 mm diameter) and peripapillary RNFL thickness were thicker in the amblyopic eyes than in the fellow eyes, whereas only the foveal minimum thickness was significantly increased in the amblyopic eyes as compared with the healthy control eyes [20]. However, IMT and outer macular thickness (radii of 1.5 to 3.0 mm) were not significantly different in the meta-analysis. The limitation of this report was without considering possible confounders, especially AL and age. Pang et al. reported that the CST of amblyopic eyes became thinner after amblyopic treatment [26]. It indicated that the amblyopic process might involve the retina, especially the macula. However, Wu et al. found that there were no significantly differences in CST, inner macular and outer macular thickness between the amblyopic and amblyopic fellow eyes in hyperopic anisometropic amblyopia, while it was lack of normal controls [27]. The previous study also found that the central macular thickness significantly increased in amblyopic eyes than fellow eyes in anisometropic amblyopia, but not in strabismic amblyopia [6]. These conflicting findings might be due to ethnicity differences, age variations, the use of different instruments, amblyopia severity, or the types of amblyopia. In this report, we did not find any significant difference in CST before age and AL adjustment (P = 0.694), while the difference was presented after correction (P = 0.034). Kasem et al. found that age and AL were two independent variables that statistically significantly correlated with the central macular thickness [28]. There were contradictory results concerning the relationship between age and central macular thickness. Some were positive indicating an increase in the central macular thickness with the age [29,30], some were negative referring to a decrease in the central macular thickness with the age [31], while others observed no significant correlation [32,33]. We calculated Spearman correlation coefficients to determine whether aging was associated with changes in macular thickness in the three different groups. Our results indicated that there was a weak correlation between age and CST in fellow eyes (r = 0.367, P = 0.046), while not in amblyopic eyes and normal eyes. We also found a significant increasing IMT with age (r = 0.551, P = 0.002) in fellow eyes, while not in the other two groups. Although this discrepancy was unknown, age and AL as two important independent confounders should be considered in further macular thickness analysis.
We also measured the thickness of ONL at 1.5° outside central fovea, which was majorly composed of photoreceptors’ cell bodies. The mean ONL in amblyopic eyes, fellow eyes and the control eyes were 70.87±9.25 μm, 70.03±9.19 μm and 74.33±9.00 μm respectively. We found no significant differences between amblyopic eyes and either the fellow eyes or the control eyes in ONL thickness at four quadrants with/without AL and age adjustment. Overall, the ONL thicknesses at four quadrants were significant differences in all participants. However, the differences were varied, and they did not form a pattern. Park et al. reported significant differences between two eyes in unilateral amblyopia in ONL at several macular locations, which have not been demonstrated by the present study [34]. The primary type of amblyopia in their report was strabismic amblyopia (16/20). Moreover, ONL measured in 490~500 µm and 1490~1500 µm from the foveal center in Park’s report. To enhance the comparability of eyes with different shapes, a 1.5° outside central fovea was chosen in the present study instead of same linear distance as the previous report. Al-Haddad et al. found that the ONL area from foveal center to 500 µm was thinner only at temporal in amblyopic eyes [9]. However, Chen et al. found that the amblyopic eyes were significantly thicker in the nasal RNFL and inferior inner nuclear layer than the normal control eyes, but not in ONL [35]. We speculated that the underlying cause of divergence among these researches were due to different types of amblyopia enrollment, different locations and methods of measurements.
CD_L in amblyopic eyes was significantly higher than fellow eyes and normal controls along the temporal, superior, inferior and nasal meridians without age and AL correction. However, these differences were not found in CD_A with or without age and AL adjustment (Figure 4 and Table 3). Differences in AL can affect estimate of cone density and NND [36]. However, when expressed as the number of cones/deg2, the cone density was not correlated with AL [11,37]. In present study we found that there was decrease CD_L (r = -0.618, P < 0.0001) and increase NND_L with AL (r = 0.613, P < 0.0001), while no correlation was found between AL and CD_A (r = 0.124, P = 0.408), NND_A (r = -0.135, P = 0.367). Measurements of cone density and NND are much more reliable when AL is considered and the measurements express in arcmin units. Thus, for both cone density and NND, the values expressed in angular units, i.e., cones/deg2 for cone density and arcmin for NND, are more representative of the actual cone density and NND, especially when AL were great differences among amblyopic, amblyopic fellow eyes and normal control eyes. We also found no significant differences in cone density among the four meridians of each group for measurements taken at 1.5°. Park et al. found that within 1-mm eccentricity, the cone mosaic diagrams of the nasal and temporal meridians were significantly greater than the superior and inferior meridians in healthy subjects [36]. However, along the four meridians, there were no differences in the mosaic diagrams. This observation was consistent with a previous histological study [38]. Although cone density was up to 40-45% higher along the nasal meridian compared to the temporal meridian throughout most of the peripheral retina at equivalent eccentricities, ratios of densities along the nasal and temporal horizontal meridians of the average retina were about 1.0 from the foveal center to about 1 mm. Cone spacing was negatively correlated with cone density (r = -0.998, P < 0.0001 in linear units; r = -0.997, P < 0.0001 in angular units). Consequently, cone density results were comparable to the ones observed with NND.
Presence of amblyopia was associated with increased foveal and parafoveal thickness in this report, but the origin or significance of this finding was still uncertain. Al-Haddad et al. noted shallow foveal pit in amblyopia eyes, absent of normal bulge at the central foveal inner segment/outer segment junction, as well as a thicker overall fovea, implying that the photoreceptors might be abnormal as a result of amblyopic progression [9]. Yen et al. found that foveal thickness increased in amblyopic eyes and hypothesized that amblyopia might affect the postnatal maturation of the retina [8]. The authors hypothesized that amblyopia might affect the process of postnatal reduction of ganglion cells and the optic nerve axons, which could then lead to a measurable increase in the RNFL thickness in amblyopic eyes along with a decrease in the foveal cone diameter. To validate these hypotheses, the cone density at 1.5° was measured by adaptive optics imaging system in living human eyes after compensating ocular aberrations. If these hypotheses were correct, higher cone density in fovea would be possibly found in amblyopic eyes. In this report, there were not enough shreds of evidence to prove hypothesis about amblyopia progression affect normal maturation of the macula, including a decrease in foveal cone diameters, as we found that there were no changes in the cone density and ONL of amblyopic eyes. The exact mechanism responsible for this is still not clear and needs for further investigations.
Our current results demonstrated BCVA were unrelated to CST, IMT, CD_L, CD_A, NND_L and NND_A in amblyopic eyes. The structure-function relationship was not well-established in the macular. Previous studies have investigated the correlation of the retinal thickness and BCVA in eyes with amblyopia and reported that the BCVA was not correlated with the macular thickness regardless of amblyopia type, which was consistent with our report [26,39]. Pang et al. who also reported that there was no correlation between central macular thickness and visual improvement after amblyopia treatment. It speculated that the critically important factor that was required in high-level acuity was the foveal cone density, but not the foveal thickness [26]. However, we also did not observe any significant correlation between BCVA and cone density at 1.5° in present study. It is possible that there are minute structural changes that occur and cannot be detected by merely measuring the macular thicknesses and cone density in fovea that occur in amblyopic eyes. Additional studies extended to more central fovea are warranted to validate these results.
The limitation of the present study was a relatively small sample size, whereas the broad age range (6-33 years). It should be noted that anisometropic amblyopic eyes showed shorter AL compare to the fellow eyes and healthy control eyes. To diminish the effect of these two confounding factors, we compared the retinal microstructures using a statistical technique that was controlled for the age and AL. Due to relatively poor imaging in amblyopic eyes, only 16 patients were included in the cone analysis finally. It should be noted that severely amblyopic eyes showed less stable fixation. High refractive error in amblyopia eyes may be another effect factor. It was also observed that some amblyopic patients still could not obtain high-quality cone images without the two possible reasons mentioned above. It is implied that some structural or functional abnormal might be in amblyopic eyes. Further studies will be performed to determine the effect of image quality on the analysis of cone density in amblyopic eyes. Moreover, the RTX-1 camera is unable to distinguish cone photoreceptors in the foveal center, and therefore unable to determine the cone density within 1° of the center. Therefore, we could reliably observe cones only at 1.5° from the central fovea in this study. It is unlikely that our conclusion obtained at 1.5° from the central fovea can be directly extended to the other areas in the fovea. Studies based on a larger sample size of amblyopic and normal eyes will improve the reliability of our observations.
To the best of our knowledge, this is the first study to use SD-OCT and adaptive optics imaging system to assess macular anatomical and microstructures in unilateral amblyopia. A thicker fovea and parafovea were found in the anisometropic amblyopic eyes when compared with the fellow eyes and the normal control eyes, while no differences were observed in cone density and ONL thickness at 1.5° from the foveal center. Currently, photoreceptors involvement in amblyopic progression is still being debated. Additional studies with larger sample sizes and/or histological examinations are warranted to validate these results.
Acknowledgements
This work was supported in part by Natural Science Foundation of Zhejiang Province (LQ17H120007); the National Science and Technology Ministry (2012BAI08B04); National Natural Science Foundation of China (81300804); The Scientific Research Fund of Wenzhou Medical University (QTJ11022); The National Key Research and Development Program of China (2016YFC0100200, 2016YFC0100201) and Scientific and Technological Program of Wenzhou (Y20160153 & Y20160449).
Disclosure of conflict of interest
None.
References
- 1.Attebo K, Mitchell P, Cumming R, Smith W, Jolly N, Sparkes R. Prevalence and causes of amblyopia in an adult population. Ophthalmology. 1998;105:154–159. doi: 10.1016/s0161-6420(98)91862-0. [DOI] [PubMed] [Google Scholar]
- 2.von Noorden GK, Crawford ML, Levacy RA. The lateral geniculate nucleus in human anisometropic amblyopia. Invest Ophthalmol Vis Sci. 1983;24:788–790. [PubMed] [Google Scholar]
- 3.Ma Y. Relationship between monocularly deprivation and amblyopia rats and visual system development. Asian Pac J Trop Med. 2014;7:568–571. doi: 10.1016/S1995-7645(14)60095-X. [DOI] [PubMed] [Google Scholar]
- 4.Altintas O, Yuksel N, Ozkan B, Caglar Y. Thickness of the retinal nerve fiber layer, macular thickness, and macular volume in patients with strabismic amblyopia. J Pediatr Ophthalmol Strabismus. 2005;42:216–221. doi: 10.3928/01913913-20050701-03. [DOI] [PubMed] [Google Scholar]
- 5.Yoon SW, Park WH, Baek SH, Kong SM. Thicknesses of macular retinal layer and peripapillary retinal nerve fiber layer in patients with hyperopic anisometropic amblyopia. Korean J Ophthalmol. 2005;19:62–67. doi: 10.3341/kjo.2005.19.1.62. [DOI] [PubMed] [Google Scholar]
- 6.Al-Haddad CE, Mollayess GM, Cherfan CG, Jaafar DF, Bashshur ZF. Retinal nerve fibre layer and macular thickness in amblyopia as measured by spectral-domain optical coherence tomography. Br J Ophthalmol. 2011;95:1696–1699. doi: 10.1136/bjo.2010.195081. [DOI] [PubMed] [Google Scholar]
- 7.Huynh SC, Samarawickrama C, Wang XY, Rochtchina E, Wong TY, Gole GA, Rose KA, Mitchell P. Macular and nerve fiber layer thickness in amblyopia: the Sydney childhood eye study. Ophthalmology. 2009;116:1604–1609. doi: 10.1016/j.ophtha.2009.03.013. [DOI] [PubMed] [Google Scholar]
- 8.Yen MY, Cheng CY, Wang AG. Retinal nerve fiber layer thickness in unilateral amblyopia. Invest Ophthalmol Vis Sci. 2004;45:2224–2230. doi: 10.1167/iovs.03-0297. [DOI] [PubMed] [Google Scholar]
- 9.Al-Haddad CE, El Mollayess GM, Mahfoud ZR, Jaafar DF, Bashshur ZF. Macular ultrastructural features in amblyopia using high-definition optical coherence tomography. Br J Ophthalmol. 2013;97:318–322. doi: 10.1136/bjophthalmol-2012-302434. [DOI] [PubMed] [Google Scholar]
- 10.Akagi T, Hangai M, Takayama K, Nonaka A, Ooto S, Yoshimura N. In vivo imaging of lamina cribrosa pores by adaptive optics scanning laser ophthalmoscopy. Invest Ophthalmol Vis Sci. 2012;53:4111–4119. doi: 10.1167/iovs.11-7536. [DOI] [PubMed] [Google Scholar]
- 11.Li KY, Tiruveedhula P, Roorda A. Intersubject variability of foveal cone photoreceptor density in relation to eye length. Invest Ophthalmol Vis Sci. 2010;51:6858–6867. doi: 10.1167/iovs.10-5499. [DOI] [PMC free article] [PubMed] [Google Scholar]
- 12.Scoles D, Sulai YN, Dubra A. In vivo dark-field imaging of the retinal pigment epithelium cell mosaic. Biomed Opt Express. 2013;4:1710–1723. doi: 10.1364/BOE.4.001710. [DOI] [PMC free article] [PubMed] [Google Scholar]
- 13.Bidaut Garnier M, Flores M, Debellemaniere G, Puyraveau M, Tumahai P, Meillat M, Schwartz C, Montard M, Delbosc B, Saleh M. Reliability of cone counts using an adaptive optics retinal camera. Clin Exp Ophthalmol. 2014;42:833–840. doi: 10.1111/ceo.12356. [DOI] [PubMed] [Google Scholar]
- 14.Saleh M, Debellemaniere G, Meillat M, Tumahai P, Bidaut Garnier M, Flores M, Schwartz C, Delbosc B. Quantification of cone loss after surgery for retinal detachment involving the macula using adaptive optics. Br J Ophthalmol. 2014;98:1343–1348. doi: 10.1136/bjophthalmol-2013-304813. [DOI] [PubMed] [Google Scholar]
- 15.Nishi T, Ueda T, Hasegawa T, Miyata K, Ogata N. Retinal thickness in children with anisohypermetropic amblyopia. Br J Ophthalmol. 2015;99:1060–1064. doi: 10.1136/bjophthalmol-2014-305685. [DOI] [PubMed] [Google Scholar]
- 16.Williams C, Papakostopoulos D. Electro-oculographic abnormalities in amblyopia. Br J Ophthalmol. 1995;79:218–224. doi: 10.1136/bjo.79.3.218. [DOI] [PMC free article] [PubMed] [Google Scholar]
- 17.Kee SY, Lee SY, Lee YC. Thicknesses of the fovea and retinal nerve fiber layer in amblyopic and normal eyes in children. Korean J Ophthalmol. 2006;20:177–181. doi: 10.3341/kjo.2006.20.3.177. [DOI] [PMC free article] [PubMed] [Google Scholar]
- 18.Wang BZ, Taranath D. A comparison between the amblyopic eye and normal fellow eye ocular architecture in children with hyperopic anisometropic amblyopia. J AAPOS. 2012;16:428–430. doi: 10.1016/j.jaapos.2012.06.006. [DOI] [PubMed] [Google Scholar]
- 19.Andalib D, Javadzadeh A, Nabai R, Amizadeh Y. Macular and retinal nerve fiber layer thickness in unilateral anisometropic or strabismic amblyopia. J Pediatr Ophthalmol Strabismus. 2013;50:218–221. doi: 10.3928/01913913-20130319-02. [DOI] [PubMed] [Google Scholar]
- 20.Li J, Ji P, Yu M. Meta-analysis of retinal changes in unilateral amblyopia using optical coherence tomography. Eur J Ophthalmol. 2015;25:400–409. doi: 10.5301/ejo.5000583. [DOI] [PubMed] [Google Scholar]
- 21.Pang Y, Goodfellow GW, Allison C, Block S, Frantz KA. A prospective study of macular thickness in amblyopic children with unilateral high myopia. Invest Ophthalmol Vis Sci. 2011;52:2444–2449. doi: 10.1167/iovs.10-5550. [DOI] [PubMed] [Google Scholar]
- 22.Walker RA, Rubab S, Voll AR, Erraguntla V, Murphy PH. Macular and peripapillary retinal nerve fibre layer thickness in adults with amblyopia. Can J Ophthalmol. 2011;46:425–427. doi: 10.1016/j.jcjo.2011.07.013. [DOI] [PubMed] [Google Scholar]
- 23.Yassin SA, Al-Tamimi ER, Al-Hassan S. Macular and retinal nerve fiber thickness in recovered and persistent amblyopia. Int Ophthalmol. 2015;35:833–842. doi: 10.1007/s10792-015-0055-9. [DOI] [PubMed] [Google Scholar]
- 24.Dickmann A, Petroni S, Salerni A, Dell’Omo R, Balestrazzi E. Unilateral amblyopia: an optical coherence tomography study. J AAPOS. 2009;13:148–150. doi: 10.1016/j.jaapos.2008.10.009. [DOI] [PubMed] [Google Scholar]
- 25.Dickmann A, Petroni S, Perrotta V, Salerni A, Parrilla R, Aliberti S, Savastano MC, Centra D, Discendenti S, Balestrazzi E. A morpho-functional study of amblyopic eyes with the use of optical coherence tomography and microperimetry. J AAPOS. 2011;15:338–341. doi: 10.1016/j.jaapos.2011.03.019. [DOI] [PubMed] [Google Scholar]
- 26.Pang Y, Frantz KA, Block S, Goodfellow GW, Allison C. Effect of amblyopia treatment on macular thickness in eyes with myopic anisometropic amblyopia. Invest Ophthalmol Vis Sci. 2015;56:2677–2683. doi: 10.1167/iovs.14-15532. [DOI] [PubMed] [Google Scholar]
- 27.Wu SQ, Zhu LW, Xu QB, Xu JL, Zhang Y. Macular and peripapillary retinal nerve fiber layer thickness in children with hyperopic anisometropic amblyopia. Int J Ophthalmol. 2013;6:85–89. doi: 10.3980/j.issn.2222-3959.2013.01.18. [DOI] [PMC free article] [PubMed] [Google Scholar]
- 28.Kasem MA, Badawi AE. Changes in macular parameters in different types of amblyopia: optical coherence tomography study. Clin Ophthalmol. 2017;11:1407–1416. doi: 10.2147/OPTH.S143223. [DOI] [PMC free article] [PubMed] [Google Scholar]
- 29.Duan XR, Liang YB, Friedman DS, Sun LP, Wong TY, Tao QS, Bao L, Wang NL, Wang JJ. Normal macular thickness measurements using optical coherence tomography in healthy eyes of adult Chinese persons: the Handan Eye Study. Ophthalmology. 2010;117:1585–1594. doi: 10.1016/j.ophtha.2009.12.036. [DOI] [PubMed] [Google Scholar]
- 30.Hashemi H, Khabazkhoob M, Yekta A, Emamian MH, Nabovati P, Fotouhi A. The distribution of macular thickness and its determinants in a healthy population. Ophthalmic Epidemiol. 2017;24:323–331. doi: 10.1080/09286586.2017.1290808. [DOI] [PubMed] [Google Scholar]
- 31.Eriksson U, Alm A. Macular thickness decreases with age in normal eyes: a study on the macular thickness map protocol in the Stratus OCT. Br J Ophthalmol. 2009;93:1448–1452. doi: 10.1136/bjo.2007.131094. [DOI] [PubMed] [Google Scholar]
- 32.Chan A, Duker JS, Ko TH, Fujimoto JG, Schuman JS. Normal macular thickness measurements in healthy eyes using stratus optical coherence tomography. Arch Ophthalmol. 2006;124:193–198. doi: 10.1001/archopht.124.2.193. [DOI] [PMC free article] [PubMed] [Google Scholar]
- 33.Manassakorn A, Chaidaroon W, Ausayakhun S, Aupapong S, Wattananikorn S. Normative database of retinal nerve fiber layer and macular retinal thickness in a Thai population. Jpn J Ophthalmol. 2008;52:450–456. doi: 10.1007/s10384-008-0538-6. [DOI] [PubMed] [Google Scholar]
- 34.Park KA, Park DY, Oh SY. Analysis of spectral-domain optical coherence tomography measurements in amblyopia: a pilot study. Br J Ophthalmol. 2011;95:1700–1706. doi: 10.1136/bjo.2010.192765. [DOI] [PubMed] [Google Scholar]
- 35.Chen W, Xu J, Zhou J, Gu Z, Huang S, Li H, Qin Z, Yu X. Thickness of retinal layers in the foveas of children with anisometropic amblyopia. PLoS One. 2017;12:e0174537. doi: 10.1371/journal.pone.0174537. [DOI] [PMC free article] [PubMed] [Google Scholar]
- 36.Park SP, Chung JK, Greenstein V, Tsang SH, Chang S. A study of factors affecting the human cone photoreceptor density measured by adaptive optics scanning laser ophthalmoscope. Exp Eye Res. 2013;108:1–9. doi: 10.1016/j.exer.2012.12.011. [DOI] [PMC free article] [PubMed] [Google Scholar]
- 37.Legras R, Gaudric A, Woog K. Distribution of cone density, spacing and arrangement in adult healthy retinas with adaptive optics flood illumination. PLoS One. 2018;13:e0191141. doi: 10.1371/journal.pone.0191141. [DOI] [PMC free article] [PubMed] [Google Scholar]
- 38.Curcio CA, Sloan KR, Kalina RE, Hendrickson AE. Human photoreceptor topography. J Comp Neurol. 1990;292:497–523. doi: 10.1002/cne.902920402. [DOI] [PubMed] [Google Scholar]
- 39.Araki S, Miki A, Yamashita T, Goto K, Haruishi K, Ieki Y, Kiryu J. A comparison between amblyopic and fellow eyes in unilateral amblyopia using spectral-domain optical coherence tomography. Clin Ophthalmol. 2014;8:2199–220. doi: 10.2147/OPTH.S69501. [DOI] [PMC free article] [PubMed] [Google Scholar]